high-rate anaerobic digestion of palm oil mill effluent in an upflow anaerobic sludge-fixed film...
TRANSCRIPT

High-rate anaerobic digestion of palm oil mill effluent in
an upflow anaerobic sludge-fixed film bioreactor
G.D. Najafpour a,*, A.A.L. Zinatizadeh b, A.R. Mohamed b, M. Hasnain Isa c,H. Nasrollahzadeh b
a Department of Chemical Engineering, Engineering Faculty, University of Mazandaran, Babol, Iranb School of Chemical Engineering, Engineering Campus, Universiti Sains Malaysia, 14300 Nibong Tebal, Penang, Malaysia
c School of Civil Engineering, Engineering Campus, Universiti Sains Malaysia, 14300 Nibong Tebal, Penang, Malaysia
Received 21 March 2005; received in revised form 4 May 2005; accepted 21 June 2005
Abstract
The upflow anaerobic sludge-fixed film (UASFF) reactor is one of the granular sludge bioreactors that are used for the rapid
biotransformation of organic matter to methane with the help of granulated microbial aggregates. The UASFF reactor is a hybrid reactor
with an upflow fixed film (UFF) part over an upflow anaerobic sludge blanket (UASB) section. The major problem associated with UASB
reactors is the long start-up period (2–4 months). In this study, a UASFF bioreactor with tubular flow behavior was developed in order to
shorten the start-up period at low hydraulic retention time (HRT) for palm oil mill effluent (POME) treatment. The reactor was operated at
38 8C and HRT of 1.5 and 3 days. The organic loading was gradually increased from 2.63 to 23.15 g chemical oxygen demand (COD)/l day.
Granular sludge was rapidly developed within 20 days. The size of granules increased from an initial pinpoint size to reach 2 mm. High
chemical oxygen demand removals of 89 and 97% at HRT of 1.5 and 3 days were achieved, respectively. Methane yield of 0.346 l CH4/g
CODremoved at the highest organic loading rate (OLR) was obtained. The use of an internal upflow anaerobic fixed film section caused the
flocculated biomass to precipitate over the sludge blanket. The precipitated biomass served as suitable and natural hydrophobic core to form a
spatial arrangement of microbial species in the process of mature bio-granulation.
# 2005 Elsevier Ltd. All rights reserved.
Keywords: UASFF; POME; Methane; VFA; COD; Biogranule; Biofilm
www.elsevier.com/locate/procbio
Process Biochemistry 41 (2006) 370–379
1. Introduction
Oil palm (Elaeis guineensis) is one of the most versatile
crops in the tropical world. The production of palm oil,
however, results in the generation of large quantities of
polluted wastewater commonly referred to as palm oil mill
effluent (POME). Typically, 1 t of crude palm oil production
requires 5–7.5 t of water; over 50% of which ends up as
POME. This wastewater is a viscous, brownish liquid
containing about 95–96% water, 0.6–0.7% oil and 4–5%
total solids (including 2–4% SS, mainly debris from the
fruit). It is acidic (pH 4–5), hot (80–90 8C), nontoxic (no
chemicals are added during oil extraction), has high organic
* Corresponding author. Tel.: +98 1113234204; fax: +98 1113240700.
E-mail addresses: [email protected], [email protected]
(G.D. Najafpour).
1359-5113/$ – see front matter # 2005 Elsevier Ltd. All rights reserved.
doi:10.1016/j.procbio.2005.06.031
content (COD 50,000 mg/l, BOD 25,000 mg/l) and contains
appreciable amounts of plant nutrients [1,2].
Palm oil industries are facing tremendous challenges to
meet the increasingly stringent environmental regulations.
Over the past decades, several cost-effective treatment
technologies comprising anaerobic, aerobic and facultative
processes have been developed for the treatment of POME
[2–7]. More than 85% of palm oil mills use solely ponding
systems due to their low costs. It has been reported that only
a few mills are equipped with biogas recovery systems [8].
One of the most notable developments in anaerobic
treatment process technology is the upflow anaerobic sludge
blanket (UASB) reactor. The UASB reactor exhibits positive
features, such as allows high organic loadings, short
hydraulic retention time (HRT) and has a low energy
demand [9]. Granular sludge formation is the main
distinguishing characteristic of UASB reactors as compared

G.D. Najafpour et al. / Process Biochemistry 41 (2006) 370–379 371
to other anaerobic technologies. A major problem associated
with the UASB reactor is that several months may be
required for the development of anaerobic sludge granules
[10]. It may be noted, however, that the start-up of UASB
reactor and the development of granules in the reactor are
two different processes with no bearing on each other. In
spite of the advantages of granular sludge, effective
treatment of wastewaters with flocculant sludge UASB
reactors have been documented [11,12]. The high suspended
solids content of POME can prevent the system from
operating at high organic loading rates (OLR). Suspended
and colloidal components of wastewaters in the form of fat,
protein, and cellulose have adverse impact on UASB
reactors’ performance and can cause deterioration of
microbial activities and wash out of active biomass [13].
Modification of the UASB process was required to
overcome the existing deficiencies. Use of internal packing
as an alternative for retaining biomass in the UASB reactor is
a suitable solution for the above mentioned problem. The
packing medium in the UASB reactor is intended to increase
solids retention by dampening short circuiting, improving
gas/liquid/solid separation, and providing surface for
biomass attachment [14]. The upflow anaerobic sludge-
fixed film (UASFF) reactor is an anaerobic hybrid reactor
Fig. 1. Schematic diagram o
which is a combination of upflow anaerobic sludge blanket
(UASB) and upflow fixed film (UFF) reactors. The lower
part of the UASFF reactor is the UASB portion where
flocculant and granular sludge are developed. The upper part
of the UASFF reactor serves as a fixed film bioreactor. The
UASFF reactor has been used successfully for the treatment
of various industrial wastewaters, such as POME, slaughter-
house, swine and starchy wastewater [15–17,21].
Internal packing creates a suitable environment to
accelerate biogranule formation by particles recirculation.
Biogranulation is a process of cell-to-cell self-immobiliza-
tion that culminates in the formation of granules. The
biogranules are dense microbial consortia packed with
several bacterial species and typically contain millions of
organisms per gram of biomass [18]. Great attention has
been paid to accelerate the start-up period and enhance
granules formation in UASB reactors with the aid of
chemical agents [19,20]. Borja and coworkers [2,5] have
investigated the treatability of POME using ordinary and
two-stage UASB reactors with HRT and start-up period of 4
and 40 days, respectively. Also, POME treatability in an
anaerobic hybrid digester was studied by Borja et al. [21]. At
an OLR of 16.2 g/l day and HRT of 3.5 days, COD removal
efficiency and methane yield of 92.3% and 0.335 m3/kg
f the UASFF reactor.

G.D. Najafpour et al. / Process Biochemistry 41 (2006) 370–379372
Table 1
Characteristic of palm oil mill effluent (POME)
Parameter Value
BOD (mg/l) 23,000–26,000
COD (mg/l) 42,500–55,700
Soluble COD (mg/l) 22,000–24,000
CODremoved were achieved, respectively. The main purposes
of the present research were to explore the possibility of
shortening the start-up period of the UASFF reactor, to
accelerate the formation of granular sludge and to evaluate
the performance stability of the UASFF reactor in the
treatment of POME at high OLRs.
SS (mg/l) 16,500–19,500Oil and grease (mg/l) 4900–5700
Total N (mg/l) 500–700
pH 3.8–4.4
2. Material and methods2.1. Experimental set up
The schematic diagram of the laboratory-scale UASFF
reactor used in this study is shown in Fig. 1. The system was
designed to behave as tubular flow, therefore height per
diameter ratio was set at 20.3. The UASFF reactor was made
of a glass column with an internal diameter of 6.5 cm and a
height of 132 cm. The total volume of the reactor was
4980 ml and the working volume was 4380 ml (excluding
head space). The column consisted of three compartments;
bottom, middle and top. The bottom part of the column, with
a height of 80 cm was operated as a UASB reactor whereas
the middle part of the column with a height of 25 cm was
operated as a fixed film reactor. The top part of the bioreactor
served as a gas–liquid–solid separator. The middle section of
the columnwas randomly packed with 90 pieces of pall rings
with diameter and height of each equal to 18 mm. The
specific surface area of the packing material was 341 m2/m3
with a void space of 91.25%. The purpose of the top section
(i.e. the gas–liquid–solid separator) of the reactor was to
allow separation of the biogas and washed out solids from
the liquid phase. An inverted funnel shaped gas separator
was used to conduct the biogas to the gas collector tank. A
gas sampling port was provided in the connecting tubing for
the determination of biogas composition. The UASFF
reactor was operated under mesophilic conditions (38 8C)and the temperature was maintained by circulating hot water
through the reactor jacket. The circulated flow was from a
water bath maintained at the desired temperature to ensure
isothermal operation. Six sampling ports (S1–S6) were
placed at suitable distances along the height of the reactor
(Fig. 1). POME as substrate was continuously fed to the
reactor through the base using a peristaltic pump (Cole
Parmer, Master flex L/s) and the effluent was collected from
the top of the column. In order to distribute the feed
uniformly in the reactor, an influent liquid distributor was
mounted at the base of the column. The top of the UASFF
reactor was connected to a water displacement gas meter to
measure the volume of biogas produced.
2.2. Palm oil mill effluent
The UASFF reactor was fed with POME pre-settled for
1 h. The characteristics of POME are summarized in Table 1.
POME samples were collected weekly from a near by palm
oil mill and stored in a cold room at 4 8C before use.
Different dilutions of POME were prepared using tap water.
The pH of the feed was adjusted to 6.8, using a 6N sodium
hydroxide solution. The alkalinity was adjusted to 1500–
1700 mg CaCO3/l using sodium bicarbonate. Supplemen-
tary nutrients such as nitrogen (NH4Cl) and phosphorous
(KH2PO4) were added to yield a COD:N:P ratio of 250:5:1.
2.3. Seed sludge
The inoculum for seeding was a mixture of sludge taken
from a drainage channel bed of Perai industrial zone
(Butterworth, Malaysia), digested sludge from a food
cannery industry and animal manure in equal proportions.
The sludge was initially passed through a screen to remove
debris. The total volatile solids concentration of the seed was
measured as 10,300 mg/l. In order to test the microbial
activity of the seed sludge, 5 ml of the sludge mixture was
added to 50 ml diluted POME (as substrate with COD of
4000 mg/l) in a 150 ml serum bottle. The produced gas was
analyzed after 24 h. It was found to contain CH4 (52.7%),
CO2 (29.8%) and N2 (18.4%). The results showed anaerobic
activity of seed sludge. In the packed bed section, a 2 % agar
(Merk) solution was used to make the packing surface sticky
for fast development of biofilm.
2.4. Reactor operation
The UASFF reactor was inoculated with 600 ml sludge
mixture. In order to acclimate the sludge with POME, the
reactor was daily batch-fed with diluted POME (7000–
9000 mg COD/l) for 7 days. After each feed the liquid
content of the reactor was continuously recirculated for 1
day (until the next feed). The average VSS concentration of
the sludge after the 7-day batch-fed period was 12,650 mg/l.
ACOD removal of about 65%was achieved at the end of this
period.
Continuous feeding of the reactor was started with an
initial organic loading rate (OLR) of 2.63 g COD/l day and
an HRT of 1.5 day. The HRT was maintained constant
throughout the start-up duration. The influent COD
concentration was 4000 mg/l for the first 7 days, and then
it was increased stepwise to 34,725 mg/l (OLR = 23.15 g-
COD/l day) from 7 to 20 days (Fig. 2). In order to improve
treatment performance and provide an upflow velocity of
0.44 m/h [9], fresh feed was mixed with recycled effluent in

G.D. Najafpour et al. / Process Biochemistry 41 (2006) 370–379 373
Fig. 2. COD removal efficiency during start-up period.
a ratio of 1:11.25. The purpose of the high recycle ratio was
to eliminate high organic over loading and to supply
alkalinity by blending the fresh feed with the low COD and
high alkalinity recycled stream. Temperature was main-
tained at 38 8C. It was not necessary to adjust the pH of the
reactor as it remained relatively constant (about 6.9–7.6)
throughout the experiment. COD reduction, biomass
concentration, pH, methane production and volatile fatty
acids (VFA) concentration were monitored.
2.5. Analytical methods
A gas-tight syringe (Hamilton CO., Reno, Nevada, USA)
was used to take gas samples from the gas sampling port. A
gas chromatograph (Perkin Elmer, Auto system XL),
equipped with thermal conductivity detector (TCD) and
data acquisition system with computer software (Total
Chrom), was used for gas composition analysis. A GC
column, Carboxen 1000, with 100/120 mesh (Supelco, Park,
Bellefonte, PA, USA) was used. The column temperature
was initially maintained at 40 8C for 3.5 min, followed by
automatic temperature increase at a rate of 20 8C/min till it
reached 180 8C. The injector and detector temperatures were
150 and 200 8C, respectively. The carrier gas (He) flow rate
was set at 30 ml/min.
The liquid samples for VFAs determination were
analyzed by another gas chromatograph, HP 5890 Series
II (Hewlett Packard, Avondale, PA, USA) equipped with a
flame ionization detector (FID) and an integrator (HP 3396).
A 2 m � 2 mm stainless steel, 80/120 mesh Carbopack B-
DA/4% Carbowax 20 M (Supelco) column was used. The
oven temperature was maintained at 175 8C. The injector
and detector temperatures were 200 and 220 8C, respec-tively. The carrier gas (He) flow rate was set at 40 ml/min. A
2-propanol solution (1%) was used as internal standard with
concentration of 20 ml/ml of sample and then the samplewas
acidified with 60 ml of concentrated formic acid. The
injection sample volume was 0.4 ml. Samples were filtered
using Whatman GF/C (934AH) to remove suspended solids
before injecting into the GC column to prevent any clogging.
Other parameters, viz. biochemical oxygen demand (BOD),
COD, suspended solids (SS), volatile suspended solids
(VSS), alkalinity and total Kjeldahl nitrogen (TKN), were
analyzed using procedures outlined in Standard Methods
[22].
Scanning electron microscopy (SEM) was used to
examine the external structure of the granules. A specimen
is bombarded with a scanning beam of electrons and then the
slowly moving ‘‘secondary electrons’’ are collected,
amplified and displayed on the cathode ray tube. The
electron beam and the cathode ray tube scan synchronously
so that an image of the specimen surface is formed.
Specimen preparation for SEM included fixation with 5%
glutaraldehyde and 1% osmium tetroxide, followed by
dehydration with 50–100% ethanol before drying, finally to
make the specimen conductive to electricity. The sample
was examined using a Leo Supra 50 VP Field emission SEM
(UK) equipped with Oxford INCA 400 energy dispersive X-
ray microanalysis system [23–25].
The dry weight of the attached biofilm per unit wetted
surface area of pall ring was evaluated by drying the
removable section of packing before and after biofilm
attachment, at a temperature of 80 8C for 24 h. The
difference between the weight measurements was divided
by the wetted surface area of the packing.
The sludge volume index (SVI) is the volume in
millimeters occupied by 1 g of a suspension after 30 min
settling. SVI was measured according to Standard Methods
(2710 D) [22].
2.6. Operational and performance parameters
Operational and performance parameters included HRT,
OLR, solids loading rate (SLR), food-to-microorganisms
ratio (F/M) and specific methanogenic activity (SMA) and
specific activity (SA) of the reactor. SLR is defined as the
total suspended solids concentration introduced in a unit
volume of UASFF reactor per unit time (e.g. g SS/l day).
OLR takes into account the liquid flow rate and contaminant
concentration and is defined as the mass of pollutant
introduced in a unit volume of UASFF reactor per unit time
(e.g. g COD/l day). F/M integrates contaminant concentra-
tion and microbial mass and is the mass of pollutant applied
to a unit mass of microbial mass per unit time (e.g. g COD/g
VSS day).
SMA can be expressed on the basis of microbial mass
(liters of biogas produced per unit mass of microbial
population). The specific activity of the process is described
as the fraction of the organic load biodegraded in a unit mass
of sludge. These parameters were determined using the
following relationships:
HRT ¼ V
Q(1)
OLR ¼ Q � CODin
V(2)

G.D. Najafpour et al. / Process Biochemistry 41 (2006) 370–379374
SLR ¼ Q � TSSV
(3)
F
M¼ Q � CODin
V � VSS (4)
SMA ¼ QCH4
V � VSS (5)
SA ¼ Q � CODin � CODout
V � VSS (6)
where Q is the influent flow rate (l/day), V is the volume of
the reactor (liters), VSS is the sludge concentration in the
reactor and QCH4is the methane production rate (liters CH4/
day).
Fig. 3. Effluent VFAs concentration (mg/l).
Fig. 4. VSS and COD concentration along the height of the reactor on day
20 of start-up.
3. Results and discussion
3.1. Reactor start-up
The UASFF reactor performance during the first 26 days
of operation is shown in Fig. 2. In the first week the reactor
was fed with an influent COD of 4000 mg/l (OLR = 2.63 g
COD/l day) and the COD removal efficiency was enhanced
from 53 to 85%. The influent COD concentration was then
increased stepwise to 34,725 mg/l for the remaining period
of the experiment. It is clear from the graph that increases
in influent COD from 6260 to 10,290 mg/l and 26,210
to 34,725 mg/l caused reduction in the COD removal
efficiency; implying that the system was put under stress.
This is also reflected by the increase in VFAs concentration
during these periods (Fig. 3). These observations are
attributed to the sudden increase in COD loads which
resulted in organic shocks to the microorganisms. The micro
flora then took time for acclimation to the new environment.
By the end of the start-up period (26 days) a removal
efficiency of 85% was achieved at an OLR of 23.15 g COD/l
day. This is a marked improvement over the study on POME
treatment using a UASB reactor by Borja and Banks [5]
wherein they achieved a COD removal efficiency of more
than 90% at a much lower OLR, 1.27 g COD/l day, and after
a longer period of operation, i.e. 30 days. Their reactor
operation was affected by the considerable sludge loss with
the effluent at the beginning of the start-up period [5]. In the
present study with the UASFF reactor, the flocculated sludge
wash out phenomena did not occur. Also granulation, which
usually requires a longer time [26,27], was observed within
the limited operational period of the UASFF reactor. The
internal recirculation of dispersed bacteria probably assisted
in their quicker agglomeration. In order to monitor the
buffering capacity, effluent alkalinity was measured. The
total alkalinity was in the range of 1570–3020 mg/l and
VFA/alkalinity ratio changed from a minimum value of
0.029 to a maximum of 0.237. The results showed increase
in effluent alkalinity with increase in OLR.
The UASFF reactor biomass content was monitored by
determination of VSS in samples along the height of the
reactor and in the effluent. Fig. 4 shows the suspended solids
and residual COD distribution along the height of the reactor
on the 20th day of operation. The mixed stream (feed + re-
cycle) entering the reactor had a COD of 6160 mg/l and the
HRT calculated based on the resulted flow was 3 h. The
results indicated that a 27% COD removal was associated
with the packed bed section. A total COD removal rate of
20.32 g COD/l day was achieved at the end of the start-up
period. The average MLVSS content of the sludge blanket
was 41,500 mg/l.
Fig. 5 shows the profiles of COD concentration and COD
removal rate along the height of the reactor. It can be noted
that different sections of the concentration profile have
different gradients; thus, implying various COD removal
rate along the height of the UASFF reactor. The COD
removal rates were calculated based on the COD values at
the bottom and top sections and the contained volumes.
These rates were then plotted (Fig. 5) at the positions
corresponding to the top levels of the sections. In the UASB
portion of the reactor, i.e. up to 75 cm height (S4), the COD
removed rate was found to decrease from 5.56 at the lowest
section to 1.76 g/l day at the top. This is attributed to reduce
biomass concentrations in the upper levels of the sludge
blanket. The COD removal rate then increased to 6.16 g/l

G.D. Najafpour et al. / Process Biochemistry 41 (2006) 370–379 375
Fig. 5. Variation of COD concentration along the height of the reactor.
Fig. 7. Development of granule blanket height in UASFF reactor.
day at a height of 112 cm due to the presence of massive
amount of anaerobic bacteria attached to the pall rings in the
fixed film section of the reactor.
The biogas was found to have 62–82% methane; the
balance being carbon dioxide (Fig. 6). At the end of start-up,
a methane production rate of 6.23 l CH4/l day was achieved.
As the OLR was increased the CO2 fraction in the biogas
was also increased. The obtained data indicated that, even at
the high gas production rate (6.23 l CH4/l day) the CH4 level
in the biogas was 62%.
With regards to the efficiency of UASB system based on
formation and retention of granules, significant growth in the
height of the UASFF granule bed was observed during the
start-up period (Fig. 7). An indication of sludge growth was
obtained by noting the thickness of the sludge bed after
stopping the feed and allowing the sludge to settle in the
reactor for 1 h. With an initial bed height of 190 mm, at first
the height of granulated bed, the growth rate was slow but
after 8 days the rate increased substantially (Fig. 7). This is
attributed to the internal recycling of sludge from the fixed
film section, above the sludge blanket. While the OLR was
increased from 2.63 to 23.15 g/l day, the height of sludge bed
Fig. 6. Methane fraction in biogas during start-up period.
increased to 300 mm. The specific activity (SA) of the
UASFF reactor reached 1.54 g CODremoved/g VSS day after
an operational period of 20 days. The use of methanogen-
enriched seed sludge for the reactor inoculation and the
confinement of the dispersed and flocculated sludge in the
lower part of the reactor due to the fixed bed portion were the
main reasons for the accelerated start-up process.
3.2. Rapid granule formation
At the beginning of the experiment the inoculum was fine
and flocculant (<0.1 mm) rather than granular. Addition of
fine methanogenic sludge as seed and feeding the reactor
with POME (containing high acetate, about 2300 mg/l) was
effective to enhance the development of methanogenic
sludge granules. The special physical features of the UASFF
reactor, i.e. the presence of a UFF section that recirculates
biomass to the UASB section and the resultant high
interaction among bacterial consortium caused rapid
biogranule development. Fig. 8 shows the sequence of
bio-granule formation in the UASFF reactor during the start-
up. The granules diameter increased from an initial pinpoint
size to 2 mm. As the OLR was increased from 9.66 to
23.15 g/l day, the granulation rate was rapidly increased.
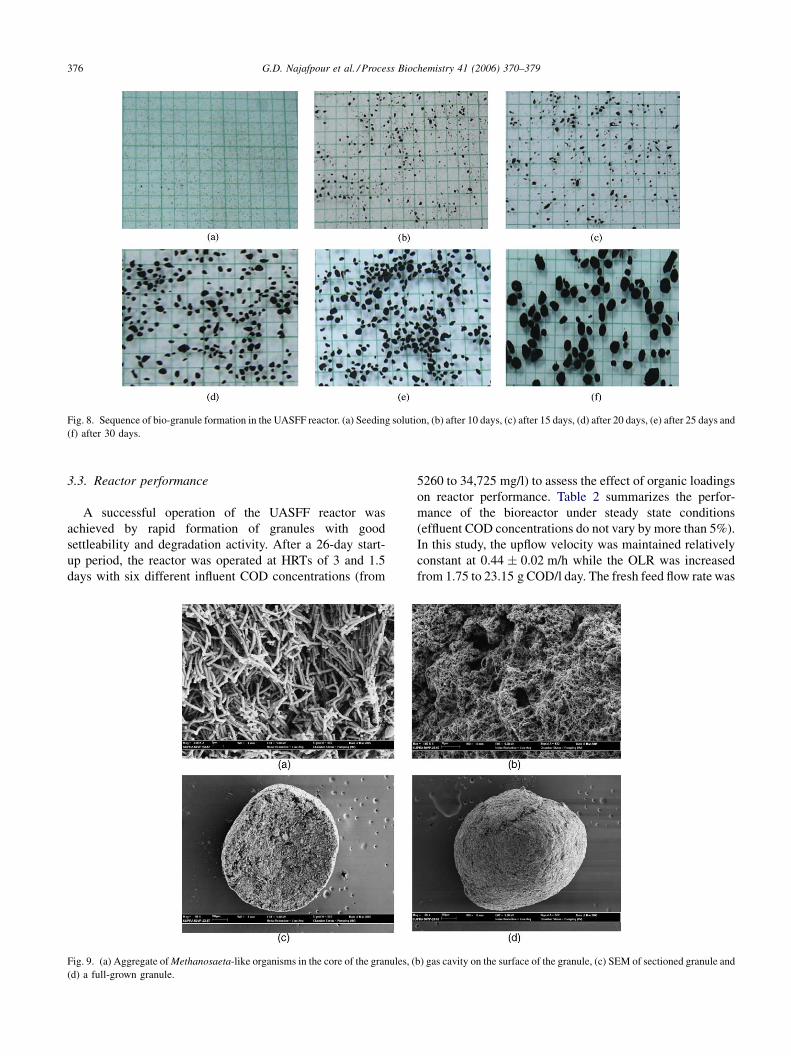
Fig. 9a shows methanosaeta-like organisms packed in the
core of a developed granule. Fig. 9b illustrates the porous
spatial arrangement of the granule surface which confirms
the gas production within the granule. Figs. 9c and d show
that the structured aggregates were grown due to cellular
multiplication of the entrapped bacteria, and became dense
with spherical shape by the hydrodynamic shear force
caused by the upflow liquid and biogas formed.
A multi layer sludge bed with granules of different
sizes and densities was developed. SVI at sampling ports
S1, S2 and S3 were 16.9, 37.9 and 117 ml/g, respectively.
Development of microbial granules can be affected by
reactor operating conditions [28]. Gas bubbles production
from sludge blanket, cell precipitation from the middle fixed
film part and high suspended solids content of POME also
provide a high driving force to enhance rapid microbial
granulation in this type of reactors.
G.D. Najafpour et al. / Process Biochemistry 41 (2006) 370–379376
Fig. 8. Sequence of bio-granule formation in the UASFF reactor. (a) Seeding solution, (b) after 10 days, (c) after 15 days, (d) after 20 days, (e) after 25 days and
(f) after 30 days.
3.3. Reactor performance
A successful operation of the UASFF reactor was
achieved by rapid formation of granules with good
settleability and degradation activity. After a 26-day start-
up period, the reactor was operated at HRTs of 3 and 1.5
days with six different influent COD concentrations (from
Fig. 9. (a) Aggregate of Methanosaeta-like organisms in the core of the granules, (
(d) a full-grown granule.
5260 to 34,725 mg/l) to assess the effect of organic loadings
on reactor performance. Table 2 summarizes the perfor-
mance of the bioreactor under steady state conditions
(effluent COD concentrations do not vary by more than 5%).
In this study, the upflow velocity was maintained relatively
constant at 0.44 � 0.02 m/h while the OLR was increased
from 1.75 to 23.15 g COD/l day. The fresh feed flow rate was
b) gas cavity on the surface of the granule, (c) SEM of sectioned granule and

G.D. Najafpour et al. / Process Biochemistry 41 (2006) 370–379 377
Table 2
UASFF bioreactor performance at various HRT and OLR under steady state conditions
HRT
(day)
CODin
(mg/l)
OLR
(g/l day)
SLR
(g/l day)
COD
removal
(%)
CH4
fraction
(%)
Methane
production
rate (liters
CH4/g
COD day)
Methane yield
(liters CH4/g
CODremoved)
Reactor
sludge
(g VSS)
Waste
sludge
(g VSS)
Specific
methanogenic
activity
(g COD-CH4/g
VSS day)
Food/
sludge
(g COD/g
VSS day)
Total
VFAa
(mg/l)
pH
3.0 5260 1.75 0.35 95 � 0.5 84.0 0.29 0.310 41.7 0 0.14 0.18 20 7.05
1.5 5260 3.51 0.70 93 � 0.5 82.3 0.32 0.338 0.29 0.37 36 7.12
3.0 10,575 3.53 0.73 96 � 0.5 82.1 0.32 0.333 0.24 0.26 24 7.11
1.5 10,575 7.05 1.45 94.5 � 0.5 75.9 0.32 0.333 52.9 10.05 0.47 0.51 44 7.25
3.0 14,485 4.83 1.04 97 � 0.5 80.1 0.33 0.341 0.24 0.29 15 7.15
1.5 14,485 9.66 2.10 92 � 0.5 72.6 0.32 0.348 74.2 7.20 0.46 0.57 60 7.42
3.0 21,310 7.10 1.53 97.5 � 0.5 77.8 0.32 0.334 0.33 0.40 20 7.25
1.5 21,310 14.21 3.10 91 � 0.5 69.0 0.32 0.345 77.5 41.23 0.64 0.80 80 7.60
3.0 26,210 8.74 1.81 97.5 � 0.5 74.2 0.34 0.344 0.43 0.51 23 7.30
1.5 26,210 17.47 3.62 90 � 0.5 64.2 0.32 0.344 75.2 52.64 0.80 1.02 115 7.83
3.0 34,725 11.58 2.34 96.5 � 0.5 71.9 0.31 0.325 0.49 0.62 28 7.56
1.5 34,725 23.15 4.68 89.5 � 0.5 62.0 0.28 0.346 82.4 70.36 0.97 1.23 158 7.90a As acetic acid.
stepwise increased from 1.46 to 2.92 l/day for each influent
COD concentration. Steady state condition was achieved at
each hydraulic loading. The steady state data (Table 2)
shows that the reactor was very efficient in COD removal. A
minimum efficiency of 89.5% at OLR of 23.15 g/l day and
HRTof 1.5 days was achieved. It is important to note that at
the highest OLR (23.15 g/l day) and SLR (4.68 g/l day)
while food to sludge ratio was 1.23 g COD/g VSS day, the
process was stable. Instability of an ordinary UASB reactor
for treatment of POME with OLR of 10.63 g COD/l day and
HRT of 4 days was reported by Borja and Banks [5]. In this
study, a COD removal efficiency of greater than 96% was
achieved at HRT of 3 days with OLR of 11.58 g COD/l day.
Two main factors controlling the stability of the UASFF
reactor at high organic loading were understood to be
internal packing and high ratio of effluent recycle. The
internal packing was very effective in providing better solid
capturing in the column and the effluent recycle created
internal dilution for the elimination of high organic loading
effects. As excessive built-up of sludge in the reactor can
Fig. 10. COD removal rate and COD removal percent at different HRT and
OLR.
result in wash-out and turbid effluent, the MLSS content of
the upper part of the sludge blanket was monitored in order
to control stability of the bioreactor. The MLSS at S4
(highest level in the UASB section) was maintained in the
range of 1900–2100 mg SS/l at OLR of 23.15 g/l day by
removing sludge from S2.
Fig. 10 illustrates the effect of OLR on reactor
performance in terms of percentage of COD removal and
COD removal rate. The relationship between COD removal
rate and OLR at different HRTs is linear, though with
different slopes. It is an indication that the reactor has not yet
reached its maximum operational limit even though at HRT
of 1.5 days COD removal efficiency was slightly decreased
from 93 to 89.5%. As a reactor approaches its maximum
operational capacity, the COD removal rate would reach
a maximum and then start to decrease. It is a sign of
insufficient microbial biomass accumulation in the reactor to
handle the additional organic load [29].
Fig. 11 shows that low methane production rate was
obtained at OLR of 1.75 and 23.15 g/l day which
Fig. 11. Methane fraction and methane production rate as a function of
OLR.

G.D. Najafpour et al. / Process Biochemistry 41 (2006) 370–379378
Fig. 12. Effluent VFA and pH at different HRT and OLR.
corresponds to food-to-sludge ratios of 0.18 and 1.23 g
COD/g VSS day, respectively. Methane fraction of biogas
gradually decreased from 84 to 62%. It may be noted that
only at OLR of 23.15 g/l day was propionic acid detectable
(82 mg/l) in the effluent. The increase of propionic acid in
the effluent indicates overloading, implies that the acido-
genic bacteria produced more VFAs and H2 than what could
be utilized by the acetogenic (propionate and butyrate
consumers) and the methanogenic (acetate and H2 con-
sumers) bacteria. This resulted in accumulation of propio-
nate due to hydrogen inhibition of acetogens and also caused
inhibition of methanogens.
The concentration of volatile fatty acids and pH in the
reactor effluent at the two HRTs and different influent COD
concentrations are shown in Fig. 12. For all OLRs tested at
HRT of 3 days, the total VFA concentration remained low
(15–28 mg acetic acid/l) and there was no VFA built-up
(Table 2). In contrast, an increase in VFA concentration was
observed with increase in OLR at HRT of 1.5 days. At the
highest OLR (23.15 g/l day) tested, the total VFA
concentration reached 158 mg/l. It may be inferred that
even though a UASFF reactor can yield good treatment
efficiencies at a low HRTof 1.5 days, extra care (particularly
Fig. 13. Relationship between COD removal rate and VSS in the reactor as
one of the biological process variables.
in terms of VFA built-up) must be exercised at such lowHRT
levels. There was a trend for pH to increase with increasing
organic load as the produced VFA was buffered by
bicarbonate generated by the anaerobic bacteria and effluent
alkalinity was recovered through high recycle ratio.
Fig. 13 shows the relationship between volatile solids
content and COD removal rate at HRT of 3 and 1.5 days.
Although it was not possible to distinguish between the
nature of VSS contents (whether active biomass or organic
matter from POME), this correlation confirmed that there
was a logical trend between sludge bed growth and organic
matter degradation rate; the specific activity of the reactor
increases with the increase in sludge. The granular sludge bed
was stable under all operating conditions tested, even at very
high OLR of 23.15 g COD/l day (67 g COD/l of granular
sludge day). The sludge was dense with low SVI (Section
3.2), there was no sludge wash-out and the reactor continued
to operate stable and high COD removal efficiencies.
4. Conclusions
This study reveals that the treatability of POME using the
UASFF bioreactor as a novel hybrid bioreactor with high
organic load and SS concentration was successfully achieved.
The use of UASFF reactor was a good strategy to accelerate
anaerobic granulation and to achieve high COD removal
efficiency in a short period of time. The reactor was very
efficient in the treatment of diluted andhigh strength POMEat
highOLR and short HRT. High COD removals of 89 and 97%
at HRTof 1.5 and 3 days were achieved, respectively. The use
of packing media in the middle portion reduced channeling
problem and loss of biomass due to flotation associated with
poorly performing UASB reactors. Additionally, the packing
material caused theflocculated biomass to precipitate over the
sludge blanket to serve as suitable and natural hydrophobic
core for the development of granular sludge. Biogas
production was found to be close to the theoretical yield.
Acknowledgements
The financial support provided by Universiti Sains
Malaysia (School of Chemical Engineering) as a short term
grant (no. 6035132) is gratefully acknowledged. The greatest
appreciation goes to the industry personnel for their full
cooperation. The authors would also like to acknowledge the
cooperation of the staff of the Glass Blowing workshop of
Universiti SainsMalaysia for their fantastic and unique job in
the fabrication of the glass UASFF reactor.
References
[1] Singh G, Huan LK, Leng T, Kow DL. Oil palm and the environment.
SDN. Bhd, Kuala Lumpur: Sp-nuda Printing, 1999.

G.D. Najafpour et al. / Process Biochemistry 41 (2006) 370–379 379
[2] Borja R, Banks CJ, Sanchez E. Anaerobic treatment of palm oil mill
effluent in a two-stage up-flow anaerobic sludge blanket (UASB)
system. Biotechnology 1996;45:125–35.
[3] Chooi CF. Ponding system for palm oil mill effluent treatment.
Workshop Proc Palm Oil Res Inst Malaysia 1984;9:53–62.
[4] Borja R. Kinetic of methane production from palm oil mill effluent in
an immobilized cell bioreactor using saponite as support medium.
Bioresour Technol 1994;48:209–14.
[5] Borja R, Banks C. Anaerobic digestion of palm oil mill effluent using
an up-flow anaerobic sludge blanket (UASB) reactor. Biomass Bioe-
nergy 1994;6:381–9.
[6] Fakhrul-Razi A, Noor MJMM. Treatment of palm oil mill effluent
(POME) with the membrane anaerobic system (MAS). Water Sci
Technol 1999;39:159–63.
[7] Faisal M, Hajime U. Kinetic analysis of palm oil mill wastewater
treatment by a modified anaerobic baffled reactor. Biochem Eng
2001;9:25–31.
[8] Yeoh BG. A technical and economic analysis of heat and power
generation from biomethanation of palm oil mill effluent, electricity
supply industry in transition: issues and prospect for Asia. SIRIM
Environment and Bioprocess Technology Centre; 2004.
[9] Metcalf & Eddy.Wastewater engineering. 4th Ed. New York: McGraw
Hill; 2003. p. 10.
[10] Liu Y, Tay J. State of the art of biogranulation technology for waste-
water treatment. Biotechnol Adv 2004;22:533–63.
[11] Sayed S, De Zeeuw W, Lettinga G. Anaerobic treatment of slaughter-
house waste using a flocculent sludge UASB reactor. Agric wastes
1984;11:197–226.
[12] Gooden JAS, Finlayson JM, Low EW. A further study of the anaerobic
bio-treatment of malt whisky distillery pot ale using an UASB system.
Biosour Technol 2001;78:155–60.
[13] Torkian A, Eqbali A, Hashemian SJ. The effect of organic loading rate
on the performance of UASB reactor treating slaughterhouse effluent.
Resour Conversation Recycling 2003;40:1–11.
[14] Suraruk B,Wangnai C, Chaiprasert P, TanticharoenM. Performance of
an anaerobic hybrid reactor combining a filter and a sludge bed. The
10th Annual General Meeting of the Thai Society for Biotechnology
for a Self-Sufficient Economy, 25–27 November 1998, Sol Twin
Towers Hotel, Bangkok, Thailand. p. 94–102.
[15] Borja R, Bank ChJ, Wang Zh. Mancha A. Anaerobic digestion of
slaughterhouse wastewater using a combination sludge blanket and
filter arrangement in a single reactor. Bioresour Technol 1998;65:
125–33.
[16] Lo KV, Liao PH, Gao YC. Anaerobic treatment of swine wastewater
using hybrid UASB reactors. Bioresour Technol 1994;47:153–7.
[17] Shaji JP. Development of a high rate anaerobic reactor for biometha-
nation of cassava starch factory effluent. Ph.D. thesis. TNAU,
Coimbatore: Department of Bioenergy, College of Agricultural Engi-
neering; 2000.
[18] Liu Y, Yang S, Tay J, Liu Q, Qin L, Li Y. Cell hydrophobicity is a
triggering force of biogranulation. Enzyme Microb Technol
2004;34:71–374.
[19] Show K, Wang Y, Foong S, Tay J. Accelerated start-up and enhanced
granulation in up flow anaerobic sludge blanket reactors. Water Res
2004;38:2294–304.
[20] Jeong HS, Kim YH, Yeom SH, Songa BK, Lee SI. Facilitated UASB
granule formation using organic-inorganic hybrid polymers. Process
Biochem 2005;40:89–94.
[21] Borja R, Banks CJ, Khalaoui B, Martin A. Performance evaluation of
an anaerobic hybrid digester treating palm oil mill effluent. J Environ
Sci Health A 1996;31:1379–93.
[22] American Public Health Association (APHA). Standard Methods for
the examination of water and wastewater, 20th Ed. Washington, DC:
APHA, AWWA; 1999.
[23] Kanovsky MJ. a formaldehyde-glutaraldehyde fixative of high
osmolality for use in electron microscopy. J Cell Biol 1965;27:
137A.
[24] Glauert AM. Fixation, dehydration and embedding of biological
specimen. In: Glauert AM, editor. Practical methods in electron
microscopy. North-Holland: Amsterdam, 1980.
[25] Dykstra MJ. Biological electron microscopy, theory, techniques and
troubleshooting. NY: Plenum press, 1992.
[26] Lettinga G. Anaerobic digestion and wastewater treatment systems.
Antonie van Leeuwen hoek Int J Gen Mol Biol 1995;67:3–28.
[27] Schmidt JE, Ahring BK. Granular sludge formation in upflow anae-
robic sludge blanket (UASB) reactors. J Eng Appl Sci 1996;49:
229–46.
[28] Liu Y, Xu HL, Yang ShF. Tay JH. Mechanisms and models for
anaerobic granulation in upflow anaerobic sludge blanket reactor.
Water Res 2003;37:661–73.
[29] Strydom JP, Mostert JF, Britz TJ. Anaerobic treatment of a synthetic
dairy effluent using a hybrid digester. Water SA 1995;21:125–30.