high-precision surface reconstruction of human … · 2016-02-12 · high-precision surface...
TRANSCRIPT

1
High-Precision Surface Reconstruction of Human
Bones from Point-Sampled Data
Jacobo Bibliowicz Autodesk Research, University of Toronto
Azam Khan Autodesk Research
Anne Agur University of Toronto
Karan Singh University of Toronto
ABSTRACT
We present our efforts to build a database of high quality, multiresolution reconstructions of human bone shapes. We state our rationale for using laser scanning as our digitizing process and describe our reconstruction pipeline. Additionally, we describe the semantic and metadata that is kept with each digital sample and our initial efforts to validate our results. A preview of our database is available online and will be openly available for research in anatomy, education, and biomechanical simulation. Keywords: human bone, laser scan, surface reconstruction, point samples
INTRODUCTION
Traditionally, osteologists have used as their primary resource large collections of human bone samples [36], such as the Hamann-Todd collection at the Cleveland Museum of Natural History. Currently, however, a trend toward using digitized bone samples for osteological endeavors is developing, as digital samples are easily generated from laser scanners or medical imaging protocols. Although studies show

2
that shape analyses based on digital bone samples are as accurate as those based on physical samples [27, 15, 29], curated collections of digital human skeletons have yet to appear. In this paper, we present the first openly available collection of digitized bone samples for use in shape analysis and biomechanical simulation.
A digital collection offers a number of advantages over a physical one. It reduces the need for manipulating the sometimes fragile physical bone samples and requires less physical storage. Researchers may easily refer to digital samples on a laptop or tablet while in the field. Additionally, many hard to measure properties of the bone samples are easily calculated numerically on the computer, such as volume, surface area, and surface curvatures. Finally, digital samples enable both biomechanical simulation and traditional osteological measurements [27, 15, 29], enabling faster and more direct visualization of shape statistics.
We have identified three methods to obtain digital bone samples for our collection: using computed tomography (CT) scanners to digitize human bodies (live or dead), using CT on physical bones from osteological collections, or using laser scanners directly on physical bones.
Scanning human bodies would seem the best solution, since the bones would materialize in their correct anatomical location and both their internal and external surface could easily be extracted. However, CT scans are used for medical diagnosis, so ethics and privacy concerns are a barrier to scan access. Also, as CT is based on X-ray, scans are localized to reduce patient exposure to radiation. The scans are typically localized in the abdominal area and thus it is rare to find full body scans. As Figure 1 shows, segmentation of bone surfaces is also a challenge. Thresholding produces artifacts in the digital samples such as holes and bone merging. Surface reconstructions of manually segmented bones also suffer from terracing artifacts [12], which are hard to remove even after overly smoothing the
FIGURE 1. Output of traditional thresholding algorithms. The center panel shows the results of applying a thresholding algorithm to the image on the left, and the right panel shows a 3D reconstruction. The red arrows point to a hole in the reconstruction caused by less dense bone tissue and the yellow arrows point at bone surfaces that have been merged together.

3
shape. These are even evident on higher resolution micro CT scans. Thus, the best option is to digitize physical bones directly. In this case, using a
laser scanner makes more sense. Although it cannot capture the internal surface of the bone, the laser scanner is more portable and can be easily relocated to the bone collection location, reducing the risk of damage to the physical samples. It also possesses an order of magnitude higher sampling precision: 35 microns versus 350 microns for CT.
Another feature of our database is determined by the inherent multiscale nature of anatomical entities such as bone. Bones have features at cellular, tissue, organ, and organ system levels. Likewise, a physical simulation of knee biomechanics requires a different level of detail than a simulation of the lower limb, or even a simulation of the entire body. Therefore, we anticipate users of our database will benefit from having available a range of models of the same bone at different resolutions. Since we tag each shape with anatomical information, we face the challenge of storing this information in a resolution-independent way to avoid data redundancy.
We present here ongoing efforts to build a digital database of human bone samples. Our intention for this database is to provide an online, freely accessible collection of bones for osteological and morphometric analyses as well as biomechanical simulation. A preview of our data is available online at the Parametric Human Project website, http://www.parametrichuman.org. After reviewing other similar projects, we discuss our method of data capture, post-processing, labeling, and archiving.
PREVIOUS WORK
ANATOMICAL DATABASES
Research has generated a fair number of digital human anatomical databases to date. Probably the most well known is The Visible Human Project from the U.S. National Library of Medicine [23]. It consists of full-body CT, MRI, and digital photographs of cryosections of a human male subject and a human female subject. Similar projects exist in China [37] and Korea [25]. These projects only provide raw image and volume data and leave all organ reconstruction to the user.
Anatomical atlases are another form of digital anatomical database. The Digital Anatomist [6] is a web-based atlas providing 2D and 3D views of human anatomy with close ties to a semantic database. Another web-based system, the Anatomy Browser [13], displays slices of a medical volume along with a 3D view of segmented organs in the region. Both of these systems allow the user to click on regions of the image to identify organs; however, neither provides access to the 3D shapes directly.
More recent 3D-modeled atlases are able to provide arbitrary views of the body. For example, both the Visible Body [35] web application and the Google Body

4
Browser [14] allow the user to move around the space and show or hide different organs and organ systems. Unfortunately, these atlases are based on "average" shapes of human organs. Improving in anatomical accuracy is Voxel-Max [28], which is based on the Visible Human dataset. Although very detailed, this atlas is only based on a single individual and does not contain any shape variations.
Digital databases of individual bones seem to be quite common for specific studies [19, 10]; however, to our knowledge, very few of these databases are openly available for other researchers (see, for example, Moore et al.'s collection [22]). In contrast, our goal is to provide an openly accessible database of documented bone shapes for applications in anatomical education, research, and biomechanical simulation.
COLLECTIONS OF DIGITIZED OBJECTS
Only a few large scale collections of digitized objects currently exist. Also developed for anthropometric applications, the CAESAR Project [30] is an anthropometric database of human scans for sale by SAE International. It contains 3D laser scans of 2,400 hundred male and female North American subjects aged 18--65 in standing and sitting poses. The database also includes the locations of various anthropometric landmarks as well as anthropometric measurements evaluated with standard instruments such as calipers. In a manner similar to our work, scans from different scan heads were aligned and triangulated using simple triangulation algorithms built into the scanning software [31].
In contrast, the Digital Michelangelo Project [20] was designed with an extensive post-processing pipeline. This project scanned a large number of Michelangelo's statues and all of the Forma Urbis Romae fragments to a very high level of accuracy. Since the statues were scanned in fragments, a lengthy alignment step found overlapping scans and aligned them using the iterated closest point (ICP) algorithm [8, 4]. The surfaces were then reconstructed using a method developed by Curless [9] which combines a large number of input scans using a weighted average. The processing pipeline went further and computed color and reflectance information for each of the samples in the final mesh. Our work builds a similar processing pipeline, although it is tailored to the variation in size and shape of the objects that we scan.
DATA CAPTURE
The data acquisition step is the most crucial step of our database pipeline. By using high precision digitization technology, we acquire digital samples of bone shapes at very high resolution and then have the freedom to reduce the sample resolution depending on the intended application. By storing the raw data of the digitizer, we are able to revisit our cleanup and reconstruction pipeline in the future and apply new algorithms as they become available.

5
Since our goal is to achieve a high level of anatomical accuracy, we selected laser scanning as our prime digitization technique. We are using a FARO Laser ScanArm mounted on a FaroArm Quantum measurement arm [33]. This laser scanner has a high rate of sample capture (19,200 point and normal samples per minute) with very high precision (35 microns between samples). The scanner arm is secured to a CaesarStone slab [34] to ensure the motion of the arm does not warp the scanning surface. The slab itself is secured to a heavy scanning table.
In order to scan a bone, we place it on the scanning table in an elevated, horizontal position secured by plasticine (see Figure 2). This ensures that we can scan the parts of the bone facing away from the table and some of the parts facing the table. Once we are satisfied with the scan, we turn the bone around 180 degrees and scan the other side. This procedure ensures that there is enough overlap
FIGURE 2. Scanning a tibia bone. Our scanning setup is visible on the left pane, showing the bone resting on plasticine supported by the CaesarStone slab and the FaroArm Quantum and ScanArm mounted to the slab. The right panel shows the scanning software. Note the red feedback region and the flat regions generated by the CaesarStone slab.
FIGURE 3. From left to right, the original point scan of a tibia bone (rendered as splats, 6.7M points), the reconstructed mesh after Poisson reconstruction (1.75M points), and the final mesh after the remeshing step (105K points). The bottom row shows a close-up of the proximal tibia showing the different sample densities at each step.

6
between the two scans for appropriate rigid alignment. For some bones more than two scan passes are required, and, occasionally, not all parts of the bone are sampled by the scan. For example, parts of the vertebral foramina of the lumbar vertebrae are not accessible by the line of sight of the scanner.
Once we have achieved coverage of the entire bone with the scanner, we proceed to clean up the data in software. As can be seen in Figure 2, the scanner invariably captures part of the scanning surface and plasticine supporting the bone. We use Geomagic Studio to remove this unrelated data manually [17]. Next, we align all scan passes of the same bone by manually tagging three to four homologous points visible on each scan and solving for the best rigid transformation. This alignment is further optimized using a variant of ICP. We also apply an outlier removal filter and a noise reduction filter, all provided by Geomagic Studio.
Next, we proceed to generate polygonal meshes of each bone at various resolutions. Generating meshes from point set surfaces is a well-studied problem with many available techniques. We classify these into two categories: implicit-based approaches and Delaunay-based approaches.
Implicit-based approaches work by generating an implicit function from the data and then extract an isosurface of this function to generate the surface. The implicit surface can be algebraic [7] but more generally is some sort of sampled distance field [16, 9, 26, 18, 32]. These approaches typically require that normals are provided or computed, and also require a surfacing algorithm such as Marching Cubes [21] or one of its variants (see the survey by Newman and Yi [24]).
Delaunay-based approaches do not need normal information as they work by generating the 3D Delaunay triangulation (or sometimes the dual Voronoi diagram) of the input points. The mesh is then extracted as a 2D sub-complex of this 3D simplicial complex [2, 3, 11, 5]. These algorithms are very effective as long as the input samples are evenly distributed, but they are memory intensive and do not work very well for fairly large numbers of input samples.
Since our scanner provides both point and normal information and our scans contain millions of points, we have opted to use the Poisson Reconstruction [18] algorithm to generate our surfaces. Aside from generating watertight surfaces, this algorithm works out of core (i.e., without loading all the data to memory) and therefore can handle our sometimes exorbitant data sets. The algorithm considers the normal vector field N as the gradient of the indicator function ϕ (the indicator function is the function valued 1 inside the surface volume and 0 elsewhere). Mathematically, this relationship is expressed as ∇ϕ = N. The problem is converted into a Poisson problem by taking the divergence of the above expression (∇2ϕ = ∇·N) and solving for ϕ. The implementation of this algorithm uses an octree to sample the generated signed distance field and reconstructs the surface using the standard Marching Cubes algorithm.
Marching Cubes is known to generate meshes with sliver triangles and is not adaptive to surface properties such as curvature. We therefore perform a second remeshing step after the initial reconstruction to improve the quality of the mesh triangles. In particular, we apply the meshing method of Boissonnat and Oudot [5]

7
as implemented in the CGAL library [1]. As the remeshing algorithm has parameters for setting average edge distance and curvature error, we determine what the resolution of the reconstruction will be at this stage. Thus, we perform the Poisson reconstruction at the highest resolution possible and then remesh at the desired resolution. A result of our reconstruction is shown in Figure 3.
Occasional anomalies do appear in the reconstruction. In many cases, our physical bone samples have damaged exterior surfaces, exposing their internal trabecular architecture. In these cases, the laser scanner cannot correctly sample the surface, leading to reconstruction artifacts. To document such anomalies, we take photographs of each of our samples which we can easily refer to later when the samples are no longer physically available.
ADDING SEMANTIC DATA AND METADATA
Our database would not be complete if it did not have information about the subjects we scanned. We therefore store metadata for each of our subjects and link it to each individual bone sample. The metadata stored here includes the age at death, sex, and geographic origin of the subject.
Additionally, for an individual subject, we store the relative position and orientation of each bone with respect to a fixed coordinate system. We use these coordinates to align the skeleton in its correct anatomical position. We select the fixed coordinate system to be the ground plane, and place and rotate each bone according to its centroid and PCA orientation axes.
Further, we document each reconstruction as it is generated. We include the details of the algorithms used, such as the number of octree levels in the Poisson reconstruction or the desired average edge length in the remeshing step. This ensures that the procedure is reproducible and allows us to modify the pipeline if new, improved algorithms are developed.
Finally, we add semantic data by labeling bony features and landmarks on each of the samples. Since we build many reconstructions, we would like to only store
FIGURE 4. Comparison of a bone sample next to its 3D printout. Note on the right panel the damaged cortical surface and the resulting artifact on the printed object.
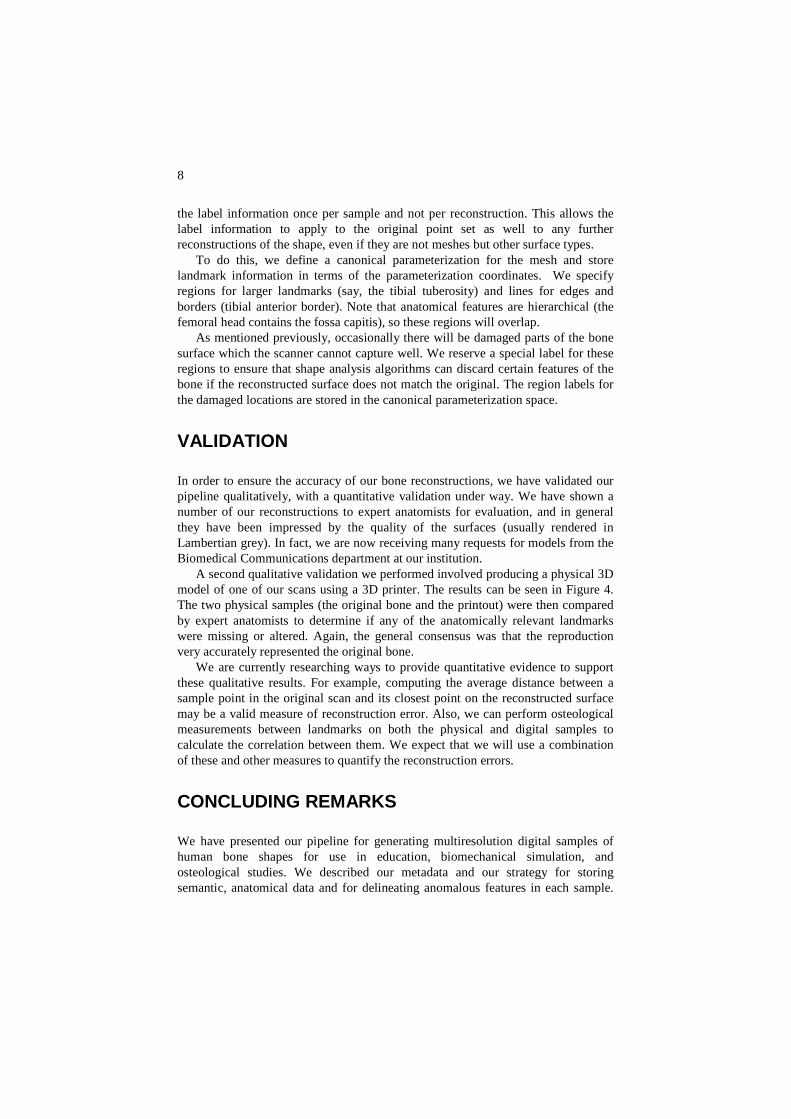
8
the label information once per sample and not per reconstruction. This allows the label information to apply to the original point set as well to any further reconstructions of the shape, even if they are not meshes but other surface types.
To do this, we define a canonical parameterization for the mesh and store landmark information in terms of the parameterization coordinates. We specify regions for larger landmarks (say, the tibial tuberosity) and lines for edges and borders (tibial anterior border). Note that anatomical features are hierarchical (the femoral head contains the fossa capitis), so these regions will overlap.
As mentioned previously, occasionally there will be damaged parts of the bone surface which the scanner cannot capture well. We reserve a special label for these regions to ensure that shape analysis algorithms can discard certain features of the bone if the reconstructed surface does not match the original. The region labels for the damaged locations are stored in the canonical parameterization space.
VALIDATION
In order to ensure the accuracy of our bone reconstructions, we have validated our pipeline qualitatively, with a quantitative validation under way. We have shown a number of our reconstructions to expert anatomists for evaluation, and in general they have been impressed by the quality of the surfaces (usually rendered in Lambertian grey). In fact, we are now receiving many requests for models from the Biomedical Communications department at our institution.
A second qualitative validation we performed involved producing a physical 3D model of one of our scans using a 3D printer. The results can be seen in Figure 4. The two physical samples (the original bone and the printout) were then compared by expert anatomists to determine if any of the anatomically relevant landmarks were missing or altered. Again, the general consensus was that the reproduction very accurately represented the original bone.
We are currently researching ways to provide quantitative evidence to support these qualitative results. For example, computing the average distance between a sample point in the original scan and its closest point on the reconstructed surface may be a valid measure of reconstruction error. Also, we can perform osteological measurements between landmarks on both the physical and digital samples to calculate the correlation between them. We expect that we will use a combination of these and other measures to quantify the reconstruction errors.
CONCLUDING REMARKS
We have presented our pipeline for generating multiresolution digital samples of human bone shapes for use in education, biomechanical simulation, and osteological studies. We described our metadata and our strategy for storing semantic, anatomical data and for delineating anomalous features in each sample.

9
Although some of our work is still preliminary, we have made a preview of our open-access database available at http://www.parametrichuman.org. Our vision is to provide a space for other researchers to contribute their own high-quality data and thus create a sizable repository of shapes for various human populations.
As physical human samples are becoming harder to acquire, we believe more anatomical and osteological collections will find a space in the digital world. Therefore, we hope our initial efforts to build a digital repository of shapes will inspire others to make digital repositories of their data for use by the academic community as well.
REFERENCES
[1] CGAL, Computational Geometry Algorithms Library. http://www.cgal.org. [2] Amenta, Nina et al. (1998), “A new voronoi-based surface reconstruction
algorithm.” Proceedings SIGGRAPH ‘98, ACM, 415–421. [3] Amenta, Nina et al. (2001), “The power crust.” Proceedings Solid Modeling and
Applications ‘01, ACM, 249–266. [4] Besl, P.J. and McKay, N.D. (1992), “A method for registration of 3-d shapes.”
IEEE Trans. Pattern Anal. Mach. Intell., 14, 239–256. [5] Boissonat, J.D. and Oudot, S. (2005), “Provably good sampling and meshing of
surfaces.” Graphical Models, 67, 405–451. [6] Brinkley, S. et al. (1997), “The digital anatomist information system and its use
in the generation and delivery of web-based anatomy atlases.” Computers and Biomedical Research, 30(6), 472–503.
[7] Carr, J.C. et al. (2001), “Reconstruction and representation of 3d objects with radial basis functions.” Proceedings SIGGRAPH ‘01, ACM, 67–76.
[8] Chen, Yang and Medioni, G. (1992), “Object modeling by registration of multiple range images.” Image Vision Comput., 10, 145–155.
[9] Curless, B. and Levoy, M. (1996), “A volumetric method for building complex models from range images.” Proceedings SIGGRAPH ‘96, ACM, 303–312.
[10] Daruwalla, Z.J. et al. (2010), “Anatomic variation of the clavicle: a novel three-dimensional study.” Clinical Anatomy, 23(2), 199–209.
[11] Dey, T.K. and Goswami, S. (2003), “Tight cocone: A water-tight surface reconstructor.” Proceedings Solid Modeling and Applications ‘03, ACM, 127–134.
[12] Gibson, S.F. (1998), “Contrained elastic surface nets: Generating smooth surfaces from binary segmented data.” Proceedings MICCAI ‘98, Springer-Verlag, 888–898.
[13] Golland, P. (1998), “AnatomyBrowser: A framework for integration of mdecial information.” Proceedings MICCAI ‘98, Springer-Verlag, 720–731.
[14] Google Body. Google, Inc. http://bodybrowser.googlelabs.com [15] Grabherr, S. et al. (2009), “Estimation of sex and age in ‘virtual skeletons’---a
feasibility study.” European Radiography, 19, 419–429. [16] Hoppe, H. et al. (1992), “Surface reconstruction from unorganized points.”
Proceedings SIGGRAPH ‘92, ACM, 71–78.

10
[17] Geomagic Studio 12. Geomagic, Inc. http://www.geomagic.com [18] Kazhdan, M. et al. (2006), “Poisson surface reconstruction.” Proceedings SGP
‘06, Eurographics Association, 61–60. [19] Kurazune, R. (2009), “3d reconstruction of a femoral shape using a parametric
model and two 2d fluoroscopic images.” Computer Vision and Image Understanding, 113(2), 202–211.
[20] Levoy, M. et al. (2000), “The digital Michelangelo project: 3d scanning of large statues.” Proceedings SIGGRAPH ‘00, ACM, 131–144.
[21] Lorensen, W.E. and Cline, H.E. (1987), “Marching cubes: A high resolution 3d surface construction algorithm.” Proceedings SIGGRAPH ‘87, ACM, 163–169.
[22] Moore, D.C. et al. (2007), “A digital database of wrist bone anatomy and carpal kinematics.” Journal of Biomechanics, 40(11), 2537–2542.
[23] Visible human data set. Department of Health National Library of Medicine and Human Services. http://www.nlm.nih.gov/research/visible/visible_human.html.
[24] Newman, T. and Yi, H. (2006), “A survey of the marching cubes algorithm.” Computers & Graphics, 30(5), 854–879.
[25] Visible Korean. Ajou University School of Medicine. http://vkh.ajou.ac.kr. [26] Ohtake, Y. et al. (2003), “Multi-level partition of unity implicits.” ACM Trans.
Graph., 22, 463–470. [27] Park, H.K. et al. (2006), “Use of hand-held laser scanning in the assessment of
craniometry.” Forensic Science International, 160(2-3), 200–206. [28] Pommert, A. et al. (2001), “Creating a high-resolution spatial/symbolic model
of the inner organs based on the visible human.” Medical Image Analysis., 5(3), 221–228.
[29] Ramsthaler, F. et al. (2010), “Morphological sexing of the skeletal remains using volume-rendered cranial CT scans.” Forensic Science International, 195(1), 148–152.
[30] Robinette, K.M. et al. (1999), “The CAESAR project: A 3-d surface anthropometry survey.” Proceedings 3DIM ‘99, IEEE, 380–386.
[31] Robinette, K.M. et al. (2002), Civilian American and European surface anthropometry resource (CAESAR) Final report. Volume 1. Summary. Technical Report, Sytronics, Inc., Dayton, Ohio.
[32] Shalom, S. et al. (2010), “Cone carving for surface reconstruction.” ACM Trans. Graph., 29(6), 150:1–150:10.
[33] Quantum FaroArm and Laser ScanArm. FARO Technologies, Inc. http://www.faro.com
[34] CaesarStone USA, Inc. http://www.caesarstoneus.com. [35] Visible Body. Visible Body, Inc. http://www.visiblebody.com. [36] White, T.D. and Folkens, P.A. (2005), The Human Bone Manual. Elsevier
Academic Press, Massachussets. [37] Zhang, S.X. et al. (2004), “The Chinese Visible Human (CVH) dataset
incorporate technical and imaging advances on earlier digital humans.” Journal of Anatomy, 204(3), 165–173. http://www.chinesevisiblehuman.com.