high precision axial coordinate readout for an axial 3-d...
TRANSCRIPT

1
CERN-PH-EP/2007-013
9 May 2007
High Precision Axial Coordinate Readout for an Axial 3-D PET Detector Module using a Wave Length Shifter Strip Matrix
A. Braem, E. Chesi, C. Jorama, J. Séguinot and P. Weilhammer
CERN, PH Department, CH-1211 Geneva, Switzerland
R. De Leo, E. Nappi
INFN, Sezione di Bari, I-70122 Bari, Italy
W. Lustermann, D. Schinzel ETH Zürich, CH-8092 Zürich, Switzerland
I. Johnson, D. Renker Paul Scherrer Institut, CH-5232 Villigen, Switzerland
S. Albrecht University Hospital Geneva, CH-1211 Geneva, Switzerland
To be submitted for publication in Nucl. Instr. Meth. A.
Abstract
We describe a novel method to extract the axial coordinate from a matrix of long axially oriented crystals, which is based on wavelength shifting plastic strips. The method allows building compact 3-D axial gamma detector modules for PET scanners with excellent 3-dimensional spatial, timing and energy resolution while keeping the number of readout channels reasonably low. A voxel resolution of about 10 mm3 is expected. We assess the performance of the method in two independent ways, using classical PMTs and G-APDs to read out the LYSO (LSO) scintillation crystals and the wavelength shifting strips. We
——— a Corresponding author: [email protected]

2
observe yields in excess of 35 photoelectrons from the strips for a 511 keV gamma and reconstruct the axial coordinate with a precision of about 2.5 mm (FWHM).
PACS 87.58.Fg; 85.60.Ha; 85.40.-e
1. Introduction
Advances in Positron Emission Tomography (PET) are driven to a significant extent by progress in instrumentation, i.e. by the performance of scintillation crystals, photodetectors and readout electronics. We describe a novel method to extract the axial coordinate from a matrix of long axially oriented crystals, which is based on wavelength shifting (WLS) plastic strips. The method allows building compact high performance 3-D axial gamma detector modules for PET scanners.
The paper is organised as follows: In chapter 2 we motivate the development by medical requirements arising from functional PET imaging, particularly in the fields of brain research and oncology. Chapter 3 describes the current limitations of PET instrumentation and points out how our proposed concept can contribute to overcoming some of them. The principle and potential of the WLS based readout is discussed in chapter 4, while chapter 5 describes the experimental demonstration of the method. In chapter 6 we summarize and give an outlook on our next steps.
2. Medical Requirements for optimal brain PET scanning
Functional imaging using PET has become one of the most powerful methods in medical imaging to study and quantify metabolic processes in the human (and animal) body. In particular PET plays a crucial role in quantification of the brain function. Advances in brain PET imaging, where emphasis is put on accurate observation of small structures, rely on improving the spatial resolution and the sensitivity of present day PET scanners, if possible combined with reduced radiation exposure of the patient. Further advance relies on improving the reconstruction algorithms in order to obtain better image quality and contrast and finally the possibility to combine a PET scanner with other precise morphological imaging devices like X-ray CT and MRI in co-registration mode.
Brain PET is used to cover a broad clinical field of applications ranging from oncology to neurology, psychiatry and vascular diseases. In all cases a significant improvement of image quality and sensitivity of the PET scanner will contribute strongly to improve diagnostics and treatment of the patient. A few examples will be discussed. The choice of tracers depends on various factors like the underlying pathology or availability of a cyclotron unit for tracers with very short half-live. For each tracer, depending on its metabolic pathway and uptake mechanism, certain specific requirements are necessary in order to perform high quality brain PET scans. For example 18F-FDG (Fluoro-2-deoxy-D-glucose) is an analogue of glucose and as such incorporated into active cells using the glucose transport mechanism on the basal membrane.
In neuro-oncology FDG can be used to distinguish viable tumour tissue from scar tissue after radiation therapy. However, the elapsed time after radiotherapy plays an important role as it creates a state of inflammation of up to 4 weeks after its end leading to an increase of background activity and a decrease of the tumour to background ratio. To use the full potential of PET imaging in this particular therapy an improvement of performance of PET scanners is mandatory.
In neuro-oncology other tracers like e.g. FET (Fluoro-ethyl-tyosine), which is a cell proliferation marker are being used. FET-PET is more and more used in the work-up of glioma in adults. FET-PET with high spatial resolution can spot additional lesions of very little volume that sometimes have not been diagnosed by routine

3
MRI. In addition, it can visualize the most hypermetabolic region within the suspected brain tumour indicating the most aggressive component of a tumoral lesion. Multimodality imaging substantially contributes to precise localisation of lesions and thus metabolic and anatomical information can guide the neurosurgical stereotactic biopsy for histo-pathological analysis. These results substantially help to correctly classify the primary brain tumour and evaluate prognostic factors to choose the adequate treatment option. In the oncological work-up of patients there is a strong demand for the detection of small tumoral lesion for the early detection of tumour recurrences and for the primary work-up of the brain tumours.
Brain PET with FDG is commonly performed in epilepsy for preoperative evaluation of pharmaco-resistant epilepsy in children and adults. PET is usually done in seizure-free intervals to visualize epileptic foci that show as focal areas of hypometabolism. However, the active clinical state of seizures creates regions of hypermetabolism that can propagate over the whole cortical tissue. Seizure occurring shortly after or during tracer injection will change dramatically the PET scan and its knowledge is mandatory for interpretation. Again, determination of the pathology and its exact localisation is mandatory for the pre-surgical evaluation.
More recently F-DOPA PET is increasingly used for imaging in movement disorders. High sensitive methods in combination with high resolution structural imaging modalities will allow identifying and exactly localizing the underlying pathology.
In psychiatry different tracers are used to spot cell receptor ligands such as Serotonin by targeting small functional units of the central nervous system which will require substantial improvements in PET scanner performance.
In conclusion one can state that there is a strong medical case for improvements of sensitivity, spatial resolution and image quality in PET scanners. Medical analysis and interpretation of symptoms in a wide field of brain deceases, as shown in the few examples above, will greatly be helped by improving the performance of PET scanners as proposed in this paper.
3. Overcoming limitations of present clinical PET scanners
PET scanners of the present generation use radial geometry with rather finely segmented scintillation crystals and Anger logic readout. Their main limitations in acquiring images with the best possible spatial resolution and image contrast, while having reasonably high detector efficiency, such that the patient is only exposed to an as small as possible radiation dose, are:
• Parallax error due to limited knowledge of the depth of interaction of the 511 keV photon in the radial direction. Several techniques have been developed to reduce the parallax error, e.g. the Phoswich arrangement of scintillation crystals [1].
• Relatively low efficiency of photon conversion due to the anti-correlation between accurate knowledge of depth of interaction and radial thickness (= length) of scintillation crystals.
• Image smearing due to the physics of the photon interaction. The spatial extension of the 511 keV photon interaction cascade even in high Z scintillation material makes an important contribution to the deterioration of the image quality. This is due to the fact that even for scintillation material with the highest density and effective Z the fraction of Compton interactions is 60% or more.
• Limited capability to identify and reject events with Compton interaction in the scintillation material. Acceptance of events with a primary Compton interaction in the data sample leads to smearing of the image.
• Irreducible smearing in spatial resolution of PET scanners coming from the non-colinearity of the photon pairs (~ ±0.25°) due to the finite momentum distribution of the e+e¯ system at the moment of annihilation.

4
A reference for the new generation of PET scanners is the High Resolution Research Tomograph (HRRT) [2][3] developed by CPS Innovation (Knoxville, USA) and under test since several years. Efficiency for the detection of photon pairs is given to be 6.9%, which includes a sizeable fraction of unidentified Compton interactions. Energy resolution is 17% at 511 keV and timing resolution is 2 to 4 ns. The volumetric voxel resolution is given as 20 mm3, corresponding to a trans-axial resolution of 2.6 mm in average and an axial resolution of about 3 mm. All quantities referenced here are FWHM.
The ultimate limitations in accuracy caused by the physics process of positron emission and annihilation is in most cases small compared to the performance in spatial resolution of presently available PET scanners, at least for the commonly used isotopes 18F, 11C and 13N for which the annihilation point in tissue is smeared due to straggling of the positron before annihilation. For the three isotopes mentioned above it is 0.1 mm, 0.19 mm and 0.280 mm FWHM [4], respectively with considerably bigger FW(0.1)M values (6 to 8 times) due to tails in the distributions. Rather important effects on the deterioration of image resolution can be expected for isotopes with higher end point positron energies like 124I, 15O or 94mTc.
Our previously proposed concept of a true 3-D PET scanner with axial geometry of the scintillation crystals [5] had a number of very attractive features, however the determination of the axial coordinate was based on the light intensity ratio at the two ends of the crystals and did not lead to a fully competitive spatial resolution. In this paper we propose a novel approach which overcomes this limitation by introducing a series of plastic wavelength shifter strips oriented orthogonal to the axis of the crystals. The novel concept which is summarized below together with the characteristics of the originally proposed configuration merges the advantages of both concepts:
• It allows full 3-D reconstruction of the 511 keV photons.
• It has no parallax error.
• It gives better spatial resolution (x, y, and z) compared to existing PET scanners.
• The total thickness of the scintillation detector stack can be chosen independently of other device parameters, which allows tuning the efficiency according to the requirements of specific applications.
• It yields total uniformity of spatial resolution over the complete field of view.
• It has the capability to distinguish photon interactions with Compton cascades from photo-absorption events with nearly 100% efficiency.
• It provides increase of sensitivity by including events in the final event sample with a primary Compton interaction, exploiting the constraints given by the energy deposited in the scintillation crystals and the position measurement of both observed interactions. About 25% of the Compton interactions can be kinematically fully resolved. This will increase for LYSO crystals the number of coincidences which can be used for chord reconstruction by a factor 1.6 to 1.8 depending on the recoil electron energy cut-off.
• Axial arrangement of the scintillation crystals reduces significantly the number of electronic readout channels, while maintaining high granularity.
• The new concept uses polished LYSO crystals which results in optimal light output and optimal energy resolution.
• It has very good energy resolution in the order of 10% (FWHM) at 511 keV (for LYSO crystals)
• It provides very good timing resolution decreasing accidental counts
• The spatial resolution which can be obtained with the new concept (for scintillation crystal dimensions proposed in [5]) will result in a voxel precision of 10 mm3 FWHM, close to the limitations imposed by the inherent physical limits from non-colinearity and range straggling of the positron.

5
• Arrays of Geiger Mode APDs (G-APDs), also called Silicon Photo Multipliers (SiPMs), are an option to readout the LYSO crystals in a strong magnetic field, hence opening the possibility of co-registration with MRI.
Fig. 1: Schematic representation of a 3-D Axial brain PET scanner with HPD photodetectors.
4. Readout of the z-coordinate of an axial PET scanner with WLS strips
The Axial Brain PET configuration proposed earlier [5] consists of stacks of ~ 15 cm long LYSO crystals with a cross section of 3.2 mm × 3.2 mm, axially oriented and separated by 0.8 mm. Each array of 16 x 13 crystals is optically coupled at both ends to proximity focused Hybrid Photon Detectors (HPD). The axial (z) coordinate was derived from the ratio of the light output measured by HPDs on both sides of each LYSO stack. An artist view of such a brain PET scanner is shown in Fig. 1.
In the new scheme the z-coordinate is obtained by introducing an orthogonal layer of stacks of thin Wave Length Shifter (WLS) strips between the layers of the scintillation crystal matrix (Fig. 2). The thin WLS strips are arranged as z-hodoscopes placed in the 0.8 mm wide gaps between crystal rows. The role of the crystal matrix is now limited to the reconstruction of the x and y coordinates and to the measurement of the deposited energy. The crystals are optimized for long absorption length, i.e. for light yield and ultimately energy resolution. In addition the crystal matrix can be read out by suitable photo-detectors on only one side with an Aluminium coating applied on the opposite side reflecting the light to the read out side.
The WLS strips are excited by the scintillation light (e.g. LSO: λ ~ 420 nm) which is not trapped in the crystal by total internal reflection (see Fig. 3). A major part of the scintillation light escaping from the crystal bars is absorbed by the WLS strip and re-emitted as fluorescence light at about 490 nm (Y-11 WLS). A fraction of the fluorescence light is trapped in the strip by total internal reflection and propagates to the two end faces of the

6
strip. One end face is mirror-coated reflecting the light to the opposite end, where it is detected by compact fast photo sensors.
Fig. 2: Left: Principle of readout of a scintillator matrix with wavelength shifting strips. For reasons of clarity only every second WLS strip is shown. Right: Zoomed view with all WLS strips shown.
Reading out scintillators with wavelength shifter bars, strips or fibres is a widely used method in calorimetry of high energy physics experiments where the light from a large scintillator volume needs to be concentrated on a relatively small photodetector. The readout of crystals for medical applications via plastic scintillators and strips is already documented in literature [6]. However, to the best of our knowledge, the here proposed specific geometry has not been implemented before.
x
y z
Fig. 3: Details of scintillation and fluorescence light trapping. Only one crystal and one WLS bar are shown.

7
The photoelectric yield of the WLS strip can be roughly estimated as
det41
4)( εεε
πγ ⋅⋅⋅⋅Ω
⋅= transfluorLdYMeVEN . (eq. 1)
We assume the following parameters: light yield of LYSO scintillator YL = 32.000 MeV-1, solid angle of non-trapped scintillation photons dΩ/4π = 0.19 (Monte Carlo), fluorescence efficiency of the WLS material εfluor = 0.8, trapping and transport efficiency (due to optical absorption) εtrans = 0.5, photon detection efficiency of the sensor εdet= 0.15 (at 490 nm). This results in N/Eγ = 46 detected photoelectrons for a 511 keV gamma which would guarantee 100% detection efficiency and allow deriving the z-coordinate, along the crystal axis both in digital and analogue form.
If only the signal from one WLS strip closest to the photon interaction in the LYSO crystal is taken one obtains a digital spatial resolution which can be tuned by varying the width of the WLS strips. In the case that the conversion of a 511 keV photon in the LYSO crystal is seen by more than one WLS strip, the z-resolution can be determined by a centre of gravity algorithm requiring that the readout electronics provides analogue information.
Geiger mode Avalanche Photo Detectors (G-APDs) are very good candidates for the readout of the WLS strips, e.g. the Hamamatsu MPPC 33-050C Multi-Pixel Photon Counter. G-APDs are particularly interesting for this application because of their compactness, speed, relatively good linearity and energy resolution. In addition they can be operated in very high magnetic fields which allow combing PET with CT and MRI. The effective photon detection efficiency at 490 nm is expected to be of the order 30%2.
For the readout of the crystal matrix both a single HPD mounted at one end or G-APDs reading the light on one or on both ends of the matrix can be considered. In the case of HPD readout suppressing the readout on one side allows for a more compact arrangement of the crystal matrices in a full scanner, essentially free of cracks. Using G-APDs will also provide very good timing resolution thus helping to reduce random coincidence background.
With an attenuation length for annihilation photons of more than 30 cm in polystyrene WLS strips and an attenuation length of about 1 cm in LYSO, only ~ 1% of 511 keV photons will interact in the WLS strips. This small fraction of undesired events will be eliminated by energy cuts on the signals of the scintillation crystals.
The proposed PET architecture is very attractive for other applications like PEM or very high resolution small animal platforms. In the case of a small animal axial PET scintillation crystal stacks could be built with single crystals of 1 mm to 2mm side dimensions and only 4 cm to 6 cm length. A very compact small animal PET scanner with sub-millimeter resolution in the image space and very high sensitivity can be realized as indicated in Fig. 4.
Use of long scintillation crystals may seem prohibitive for TOF-PET, an approach which relies on sub-ns timing to improve noise and NEC rate characteristics and brings also other advantages [7]. The precise knowledge of the axial position of the photon’s interaction eliminates the fluctuation from the unknown propagation time along the crystal and restores the full resolution. As will be shown below, readout of a long crystal with G-APDs leads to a very competitive resolution.
——— 2 Data Sheet. Hamamatsu MPPC 33-050C.

8
Fig. 4: Schematic representation of a small animal PET configuration with axial crystals and WLS strips. Both the crystals and the WLS strips are read by arrays of G-APDs. They are mounted on special printed circuit boards, which for clarity are shown in a retracted position.
5. Experimental demonstration of the WLS based z-readout
Two different and independent approaches were followed to assess the potential of the WLS based z-readout. In the following we sketch the principles and the test set-ups and summarize the main results. We concentrate on three topics: (1) the photoelectric yield of the WLS strips, (2) the achievable spatial resolution along the crystal axis and (3) the timing resolution. A more detailed description of the experimental techniques and the results will be given in a forthcoming article.
5.1 Principle and experimental set-up
The photon detector in a PET scanner is required to precisely localize gamma rays in the energy range between about 100 to 511 keV. The low energy range is of particular interest for the 3-D-axial camera, as it is used to unambiguously discriminate Compton interactions in the crystal matrix. We demonstrate the principle and performance of the WLS based z-readout with two different and independent methods, which are schematically shown in Fig. 5.

9
H2 flash lamp mirror
G-APD
LSO
WLS strip
22Na
LYSO
PMT
G-APD
PMT (1 inch)
PMT (3/8 inch)
PMT (3/8 inch)
LYSO
WLS strip
window with CsI photocathode Sapphire
window
Fig. 5: Schematic representation (not to scale) of the two measurement principles. Left: Set-up with low energy electron source. Right: Set-up with 22Na source.
1. Pulsed low energy electron source: In order to vary the energy deposition in the scintillator crystal and its position in an easily controllable way, we designed a set-up which is based on a pulsed source of low energy electrons which impinge on the crystal. The electrons are produced by illuminating a semi-transparent CsI photocathode with short light pulses (~10 ns) from a H2 flash lamp. The negative potential of the photocathode Ucath (10 ≤ Ucath ≤ 27.5 kV) defines the kinetic energy of the electrons when they hit the crystal surface. The total energy deposition is controlled through the number Ne of electrons in the pulse. Two LYSO:Ce crystals (3.2 × 3.2 × 100 mm3) were mounted side by side, with one of their end faces optically coupled through a Sapphire window to a single photomultiplier tube3. The other end faces are mirror-coated with a vacuum evaporated Al film. Two 60 mm long WLS strips4 (3 × 1.1 mm2) were mounted orthogonal to and underneath the two crystals with a small gap of about 0.1 mm. An Aluminum foil under the strips reflects the small fraction of non absorbed light back onto the strip. The strip end which is not read out was also coated with a reflective Aluminum film. The set-up allows continuously varying the deposited energy and displacing the beam spot in a controlled way in order to measure the z-resolution of the WLS based readout. The beam spot at the level of the crystals has Gaussian shape with FWHM of 1.8 mm, both in the x and y coordinate. The available intensity of the collimated H2 flash lamp allowed energy depositions up to about 425 keV per pulse. The measurements needed to be performed in vacuum.
2. Radioactive 22Na source: In the second set-up a smaller LSO crystal (3 × 3 × 50 mm3) and an orthogonal WLS strip (same type and dimensions as above) were exposed to annihilation photons from a 22Na source.
——— 3 Photonis XP3102. Photonis, Brive La Gaillarde, France. 4 ELJEN EJ-280, high dye concentration, SCIONIX, Bunnik, The Netherlands

10
Both the crystal and the WLS strip were read out at one end by a G-APD of 3 × 3 mm2 size5. A small LYSO crystal (2 × 2 × 12 mm3) read out by a PMT served to tag the second annihilation photon. The non-read end of the LSO crystal was closed with white Teflon tape and 3 of the long sides were covered with reflecting foil (V2000 from 3M). The upper side of the strip was covered with a reflecting foil and the non-read end with Teflon tape.
In both set-ups conventional optical grease was used to improve the light transmission between scintillators (WLS strips) and photodetectors.
5.2 Results with the pulsed low energy electron source
The scintillation crystals are excited by short bunches of low energy electrons. In first approximation, the total energy deposited in the crystal per bunch is Edep = Ne · Ee = Ne · e · Ucath. For relatively small numbers Ne of electrons per bunch (e.g. <30), the fluctuation σ( Ne) = √Ne dominates over the photon statistics and the intrinsic resolution of the scintillator. The number of electrons in the bunch and hence the deposited energy can therefore be determined from Ne = (Q/ σ(Q))2 with Q and σ(Q) being the charge amplitude and its fluctuation, respectively, measured with the PMT connected to the LYSO crystal. The charge amplitude Q is obtained by integrating the PMT signal with a charge sensitive ADC (LeCroy 1182, gate length 150 ns). Absolute calibration of the PMTs’ gains was performed by determining the response of the PMTs to single photoelectrons generated by a pulsed LED. This allows converting the measured charge to the number of detected photoelectrons.
The analysis is complicated by two low energy effects: (1) A fraction (~45%) of the electrons is back scattered from the LYSO crystal without depositing their full energy. (2) The light yield of LYSO scales with the deposited energy in a sublinear way, described by the Relative Light Output RLO6. A straightforward Monte Carlo model, based on measured back scattering and light yield data [8-10] is used to describe the two effects and to derive from the measured charge and its fluctuation, Q and σ(Q), the actually converted energy. We estimate the relative precision of the MC corrected energy value to be ±10%.
Fig. 6 shows the measured charge distribution from the LYSO crystal for a total converted energy of 366 keV (Ne = 25, Ee = 27.5 keV, Edep = 443 keV). After conversion to photoelectrons using the calibration of the PMT, the variation of the photoelectric yield with the converted energy is shown in Fig. 7. Extrapolation to 511 keV yields a photoelectric yield of 1160 pe. It should be noted that such a photoelectric yield, if produced by a single 511 keV photon, and not by a group of low energy electrons, would lead to an energy resolution of about 10-11% (FWHM). Fig. 8 shows the corresponding charge and yield distributions for the WLS strips and
Fig. 9 the variation of the sum of the two strips with the converted energy. The extrapolated value of the photoelectric yield at 511 keV was found to be 42 pe, a value which guarantees full detection efficiency.
——— 5 Type MPPC 33-050C.Hamamatsu Photonics, Hamamatsu City, Japan. 6 Above E = 20 keV, RLO ~ 0.76. For E > 100 keV, RLO is essentially equal to 1.

11
Fig. 6: Integrated charge signal, extracted from the LYSO crystal (in ADC counts; 1 count = 50 fC) following excitation with Ne ~ 25 electrons of 27.5 keV energy.
0
200
400
600
800
1000
1200
1400
0 100 200 300 400 500 600
E conv (keV)
Npe
Light Yield: LYSO crystals
Fig. 7: LYSO crystal: Dependence of the photoelectric yield, derived from the charge signal, on the converted energy.

12
Fig. 8: Charge distributions, extracted from the two WLS strips (in ADC counts in ADC counts; 1 count = 50 fC).
0
5
10
15
20
25
30
35
40
45
50
0 100 200 300 400 500 600
Npe
E conv (keV)
Light Yield: WLS strips
Fig. 9: WLS strips: Dependence of the photoelectric yield, derived from the charge signal, on the converted energy. The sum of the two WLS strips is shown.
13
The z-coordinate, i.e. the coordinate transverse to the strips along the crystals, can be reconstructed using the yield ratio of the two WLS strips:
21
21QQQQbazrec +
−⋅+= (eq. 2)
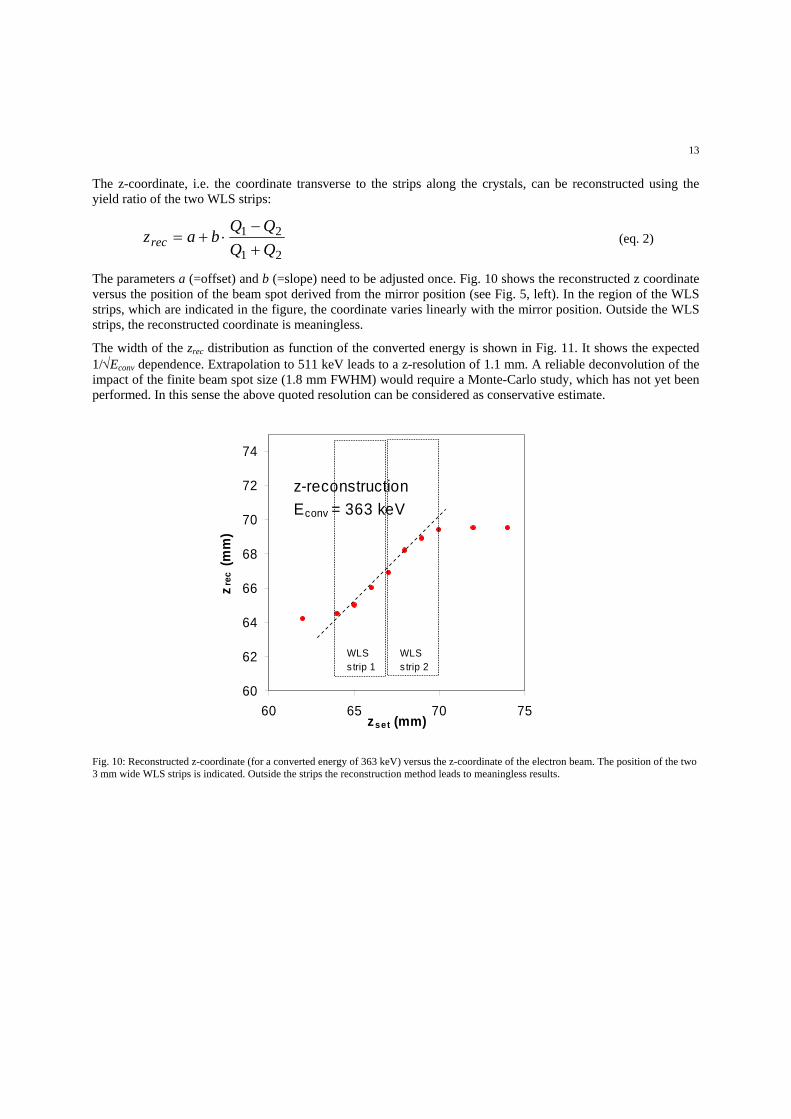
The parameters a (=offset) and b (=slope) need to be adjusted once. Fig. 10 shows the reconstructed z coordinate versus the position of the beam spot derived from the mirror position (see Fig. 5, left). In the region of the WLS strips, which are indicated in the figure, the coordinate varies linearly with the mirror position. Outside the WLS strips, the reconstructed coordinate is meaningless.
The width of the zrec distribution as function of the converted energy is shown in Fig. 11. It shows the expected 1/√Econv dependence. Extrapolation to 511 keV leads to a z-resolution of 1.1 mm. A reliable deconvolution of the impact of the finite beam spot size (1.8 mm FWHM) would require a Monte-Carlo study, which has not yet been performed. In this sense the above quoted resolution can be considered as conservative estimate.
60
62
64
66
68
70
72
74
60 65 70 75zset (mm)
zrec
(mm
)
z-reconstructionEconv = 363 keV
WLSstrip 1
WLSstrip 2
Fig. 10: Reconstructed z-coordinate (for a converted energy of 363 keV) versus the z-coordinate of the electron beam. The position of the two 3 mm wide WLS strips is indicated. Outside the strips the reconstruction method leads to meaningless results.

14
0
0.5
1
1.5
2
2.5
3
0 200 400 600Econv (keV)
σz (
mm
) z-reconstruction
Fig. 11: The reconstruction precision is plotted versus the converted energy. Extrapolation to 511 keV indicates a precision of σz = 1.1 mm.
5.3 Results obtained with the 22Na source
The signals of both G-APDs (cf. Fig. 5) were amplified by a factor of ~20 using the MAR-87 amplifier and fed into a timing filter amplifier (Ortec 454) with gain 1 and 50 ns shaping time. The signals from the two crystals read out by a G-APD and a photomultiplier, respectively, were sent to constant fraction discriminators. Their outputs formed a coincidence which opened the gate of a charge sensitive ADC. The spectrum obtained with the LSO/G-APD detector is shown in Fig. 12. For the 511 keV X-rays an energy resolution of 11.5% FWHM was obtained, in good agreement with the value estimated from photoelectric yield measurements which were performed on the e-source set-up, discussed before.
The signal from the WLS/G-APD detector was recorded by the ADC using the same gate derived from the coincidence. The threshold of the LSO/G-APD discriminator was set between the Compton edge and the 511 keV line, thus selecting only photoelectric events. The resulting charge spectrum is shown in Fig. 13.
The excellent resolution of G-APDs for one, two etc. photoelectrons (pe) allows a simple and precise calibration of the spectrum. A value of 8.8 ADC channels/pe was found. Using this calibration the photoelectric peak of Fig. 13 corresponds to 43.5 pe
In a G-APD photons from an avalanche in a hit micro cell leaking to neighbouring cells leads to cross-talk, which increases with gain. The cross-talk increases the number of hit cells and therefore the apparent charge. We estimate the 3×3 mm2 Hamamatsu device to have a cross-talk of 10-20% for the gain values used in this measurement. Hence the true photoelectric yield of the WLS strip is therefore 35-39.
——— 7 Mini-Circuits, New York (US), www.minicircuits.com

15
0
100
200
300
400
500
600
700
800
900
1000
0 200 400 600 800 1000
ADC channels
coun
ts511 keVLSO
22Na
Fig. 12. Integrated charge spectrum of the LSO/G-APD detector.
0
20
40
60
80
100
120
140
160
180
0 200 400 600 800 1000
ADC channels
coun
ts
WLS strip22Na
Fig. 13. Pulse height spectrum of the WLS/G-APD detector when only photoelectric events are selected.

16
0
200
400
600
800
1000
1200
1400
1600
0 10 20 30 40 5
time [ns]
coun
tsRel. timing LSO - WLS strip22Na
0
Fig. 14. Relative timing between the LSO crystal and the WLS strip, both read out with G-APD. Only photoelectric events were selected. The combined resolution is 5.5 ns (FWHM).
The relative timing between the LSO crystal and the WLS strip was measured with a TDC and constant fraction discriminators. The threshold of the constant fraction discriminator of the LSO/G-APD which defined the start signal was set to select only photoelectric events. The constant fraction discriminator connected to the WLS strip was set to ~2 pe and was used as stop signal.. From the TDC spectrum shown in Fig. 14 the resolution was determined to be 5.5 ns (FWHM). The contribution of the LSO crystal was extracted from a TDC spectrum using the small tagging LYSO/PMT detector as stop signal and was found to be 700 ps (FWHM) indicating that the WLS strip completely dominates the relative timing precision.
5.4 Discussion and comparison of the results
We demonstrated with two independent methods the readout of WLS strips which detect the scintillation light of LYSO / LSO crystals. In both cases a comfortably high photoelectric yield was achieved which even exceeds the rough performance estimates based on simple considerations. The yield figures allow efficient detection and precise spatial reconstruction.
The performance achieved with the G-APD readout of the LSO crystal, both in terms of energy and time resolution, is better than recent published data.
The photoelectric yield obtained by both methods cannot be compared directly since the photon detection efficiency of the G-APD at 490 nm is about two times higher than the one of the bialkali photocathode of the PMT. In addition the single WLS strip equipped with a G-APD does not have full geometric acceptance for the detection of the scintillation light. Both effects accidentally cancel out for this particular measurement.

17
6. Summary and next Steps
We propose a detector concept for PET scanners where long axially oriented scintillation crystals are read out on one end. The axial z-coordinate is derived from a hodoscope made of thin WLS strips slotted in between the crystals. Our measurements, performed with two different and independent set-ups, using classical PMT and novel G-APD for the readout, proved the feasibility of this geometrical configuration and demonstrated that an excellent z-resolution of better than σz = 1.1 mm can be achieved at E = 511 keV. Given the transverse size of the scintillator crystals, a voxel resolution of about 10 mm3 (FWHM) appears fully realistic.
We intend to fabricate a small demonstrator module, based on a matrix of e.g. 4 × 4 or 5 × 5 long LYSO crystal bars. An appropriate arrangement of WLS strips, e.g. 4 × 16 or 4 × 32 strips, slotted in between the crystals will be used for the axial coordinate reconstruction. Such a module allows characterizing energy and z-resolution of the matrix and studying integration related effects like cross-talk between different strip layers.
A small demonstrator module will also allow studying various readout options. The crystals can be read with an existing HPD [12] developed previously and tested for the Axial HPD-PET project [5]. The WLS strips can be read with G-APDs. Alternatively, both crystals and strips can be read with G-APDs. The conception and fabrication of an appropriate multi-channel readout ASIC for arrays of G-APDs is a logical step in the sequence.
The availability of two small demonstrator modules would allow performing studies in PET configuration and assessing the potential of the proposed geometrical configuration under realistic conditions.
Acknowledgements
We would like to thank our technical staff, C. David, A. Folley, M. van Stenis, (all CERN), L. Dell’Olio and G. De Carne (INFN Bari) for their excellent work in the preparation of the mechanical and optical components used in the tests. Two of us (W.L and D.S) are very grateful to Prof. F. Pauss for her continuous support. We are also indebted to M. Droege, Chr. Haller, Drs F. Nessi-Tedaldi and P. Lecomte for the set up of a test bench.
References [1] M.Schmandt et al., Performances results of a new DOI detector block for a High Resolution PET LSO Re-search Tomograph HRRT.
(1998) IEEE Trans. Nucl. Sci. (1998) 3000-3005 [2] K.Wienhard et al., The ECAT HRRT : Performance and First Clinical Application of the New High Resolution Research Tomograph.
IEEE Trans. Nucl. Sci. 49 (2002) 104-110 [3] M.Schmandt et al., Performance evaluation of a new LSO High Resolution Research Tomograph HRRT. Proc. IEEE 1999 Nuclear
Science Symp. and Medical Imaging Conf., vol. 2, pp. 1067–1071.IEEE Trans. Nucl. Sci. (1999) [4] S.E. Derenzo et al., Critical instrumentation issues for <2 mm resolution high sensitivity brain PET. In: K. Uemura, N.A. Lassen, T.
Jones and I. Kanno, Editors, Quantification of Brain Function: Tracer Kinetics and Image Analysis in Brain PET, Elsevier, Amsterdam (1993), pp. 25–37
[5] J. Séguinot et al., Novel Geometrical Concept of a High Performance Brain PET Scanner - Principle, Design and Performance Estimates , Il Nuovo Cimento C, Volume 29 Issue 04 pp 429-463.
[6] N. Belcari et al, Measurement of photoelectron yield from scintillating fibres coupled to a YAP:Ce matrix, Nucl. Instr. Meth. A 461 (2001) 413–415
[7] W. W. Moses, Time of Flight in PET Revisited, IEEE Trans. Nucl. Science, VOL. 50, NO. 5, (2003) 1325 [8] W. Mengesha et al., IEEE Trans. Nucl. Sci. Vol. 45, No. 3 (1998) 456 [9] W.W. Moses, Current trends in scintillator detectors and materials, Nucl. Instr. Meth. A 487 (2002) 123-128 [10] E.H. Darlington, Backscattering of 10-100 keV electrons from thick targets, J. Phys. D, Vol. 8, (1975) 85-93 [11] E. Lorenz et al., Some studies for a development of a small animal PET based on LYSO crystals and Geiger mode-APDs, Nucl. Instr. and
Meth. A 572 (2007) 259–261 [12] E. Chesi et al., A segmented Hybrid Photon Detector with integrated auto-triggering front-end electronics for a PET scanner.., Nucl.
Instr. Meth. A 564 (2006) 352-363