high precision and fast functional mapping of cortical circuitry through a novel combination of...
TRANSCRIPT

doi:10.1152/jn.00992.2009 103:2301-2312, 2010. First published 3 February 2010;J NeurophysiolXiangmin Xu, Nicholas D. Olivas, Rafael Levi, Taruna Ikrar and Zoran NenadicPhotostimulationVoltage Sensitive Dye Imaging and Laser ScanningCortical Circuitry Through a Novel Combination of High Precision and Fast Functional Mapping of
You might find this additional info useful...
for this article can be found at:Supplemental materialhttp://jn.physiology.org/content/suppl/2010/02/12/00992.2009.DC1.html
24 articles, 10 of which can be accessed free at:This article cites http://jn.physiology.org/content/103/4/2301.full.html#ref-list-1
including high resolution figures, can be found at:Updated information and services http://jn.physiology.org/content/103/4/2301.full.html
can be found at:Journal of Neurophysiologyabout Additional material and information http://www.the-aps.org/publications/jn
This infomation is current as of August 26, 2011.
American Physiological Society. ISSN: 0022-3077, ESSN: 1522-1598. Visit our website at http://www.the-aps.org/.(monthly) by the American Physiological Society, 9650 Rockville Pike, Bethesda MD 20814-3991. Copyright © 2010 by the
publishes original articles on the function of the nervous system. It is published 12 times a yearJournal of Neurophysiology
on August 26, 2011
jn.physiology.orgD
ownloaded from

Innovative Methodology
High Precision and Fast Functional Mapping of Cortical Circuitry Througha Novel Combination of Voltage Sensitive Dye Imaging and LaserScanning Photostimulation
Xiangmin Xu,1,2 Nicholas D. Olivas,1 Rafael Levi,1 Taruna Ikrar,1 and Zoran Nenadic2
1Department of Anatomy and Neurobiology, School of Medicine, University of California, Irvine; and 2Department of BiomedicalEngineering, University of California, Irvine, California
Submitted 12 November 2009; accepted in final form 29 January 2010
Xu X, Olivas ND, Levi R, Ikrar T, Nenadic Z. High precisionand fast functional mapping of cortical circuitry through a novelcombination of voltage sensitive dye imaging and laser scanningphotostimulation. J Neurophysiol 103: 2301–2312, 2010. Firstpublished February 3, 2010; doi:10.1152/jn.00992.2009. The de-velopment of modern neuroscience tools is critical for decipheringbrain circuit organization and function. An important aspect for tech-nical development is to enhance each technique’s advantages andcompensate for limitations. We developed a high-precision and fastfunctional mapping technique in brain slices that incorporates thespatial precision of activation that can be achieved by laser-scanningphotostimulation with rapid and high-temporal resolution assessmentof evoked network activity that can be achieved by voltage-sensitivedye imaging. Unlike combination of whole cell recordings with pho-tostimulation for mapping local circuit inputs to individually recordedneurons, this innovation is a new photostimulation-based technique tomap cortical circuit output and functional connections at the level ofneuronal populations. Here we report on this novel technique in detailand show its effective applications in mapping functional connectionsand circuit dynamics in mouse primary visual cortex and hippocam-pus. Given that this innovation enables rapid mapping and preciseevaluation of cortical organization and function, it can have broadimpacts in the field of cortical circuitry.
I N T R O D U C T I O N
A key to revealing brain mechanisms is to understand theprinciples of circuit organization and function, thereby decod-ing how the circuit processes information and guides behavior.This requires use of modern tools to systematically character-ize properties of neuronal components and their connectionsand to enable precise measurements of circuit activity. Wedeveloped a new technique based on the integration of laserscanning photostimulation and voltage-sensitive dye (VSD)imaging. This novel approach is an all-optical approach forbrain circuit mapping, providing important applications incortical circuitry studies.
Our new technique uses VSD imaging to allow for func-tional connectivity and spatiotemporal dynamics of neuronalpopulation activity in large cortical regions to be examined.Fast VSD imaging has been widely used to study populationneuronal activity in cortical tissue both in vivo and in vitro(Grinvald and Hildesheim 2004). Particularly for in vitro brainslices, fast VSD imaging allows mapping of circuit organiza-tion and circuit dynamics, and more recently, has been used to
probe functional abnormalities in models of neurological andpsychiatric disorder (Airan et al. 2007; Ang et al. 2006). Onemajor limitation of most in vitro VSD imaging studies, how-ever, is that sources of activation are not precisely controlled.For example, neuronal responses have been imaged either afterpharmacologically induced seizure activity or electrical stim-ulation (Ang et al. 2006; Huang et al. 2004; Petersen andSakmann 2001). Significant disadvantages of electric stimula-tion include indiscriminate activation of axons of passage, slowand inefficient placement of multiple stimulation locations, andtissue damage. To compensate this limitation, we use laserscanning photostimulation to provide spatially precise activa-tion of neuronal circuits. The optical stimulation via glutamateuncaging enables rapid and noninvasive photoactivation ofneurons with great convenience and superior spatial resolutionin practical experiments (Callaway and Katz 1993; Shepherd etal. 2003; Xu and Callaway 2009). Combining whole cellrecordings from single neurons with photostimulation of clus-ters of presynaptic neurons has been developed for extensivemapping of local functional inputs to a single recorded neuron(Schubert et al. 2003; Shepherd and Svoboda 2005; Xu andCallaway 2009). However, successful application of this wholecell recording approach requires repeated experiments fromnumerous recorded neurons and analysis of hundreds of syn-aptic currents that are recorded in each recorded cell. Resultstherefore tend to be limited to a small number of targeted celltypes, making this method less useful for fast, unbiased surveysof overall changes in network connectivity that might occurduring development or in responses to experimental manipu-lations.
The purpose of our technical development was to develop anew photostimulation-based technique to map cortical circuitoutput and functional connections at the neuronal populationlevel by combining the advantages of VSD imaging and opticalstimulation. In this report, we first describe our system andprovide details to make this technique available to other inves-tigators. Then we describe effective applications of the tech-nique in mapping functional connections, circuit organizationand dynamics in mouse primary visual cortex (V1) and hip-pocampus.
M E T H O D S
Slice preparation
Wild-type C57/B6 mice were used in the experiments. Fifteen micewere used for V1 circuit studies, and five mice used for hippocampal
Address for reprint requests and other correspondence: X. Xu, Dept. ofAnatomy and Neurobiology, School of Medicine, Univ. of California, Irvine,CA 92697-1275 (E-mail: [email protected]).
J Neurophysiol 103: 2301–2312, 2010.First published February 3, 2010; doi:10.1152/jn.00992.2009.
23010022-3077/10 $8.00 Copyright © 2010 The American Physiological Societywww.jn.org
on August 26, 2011
jn.physiology.orgD
ownloaded from

circuit studies. Only the best cut slices were used for this study. Onaverage, one animal yielded two successful slices. Some data obtainedfrom these experiments will be reported separately. All animals werehandled and experiments were conducted in accordance with proce-dures approved by the Institutional Animal Care and Use Committeeat the University of California, Irvine. To prepare living brain slices,animals (postnatal day 17–23) were deeply anesthetized with pento-barbital sodium (�100 mg/kg, ip) and rapidly decapitated, and theirbrains removed. Visual cortical or hippocampal sections were cut 400�m thick with a vibratome (VT1200S, Leica Systems) in sucrose-containing artificial cerebrospinal fluid (ACSF) (in mM: 85 NaCl, 75sucrose, 2.5 KCl, 25 glucose, 1.25 NaH2PO4, 4 MgCl2, 0.5 CaCl2,and 24 NaHCO3). Slices were first incubated in sucrose-containingACSF for 30 min to 1 h at 32°C, and after the initial incubation period,transferred to recording ACSF (in mM: 126 NaCl, 2.5 KCl, 26NaHCO3, 2 CaCl2, 2 MgCl2, 1.25 NaH2PO4, and 10 glucose) for thedye staining at room temperature. The slices were stained for 2–3 h ina staining chamber containing ACSF with 0.02 mg/ml of an oxonoldye, NK3630 (first synthesized by R. Hildesheim and A. Grinvald asRH482; available from Nippon Kankoh-Shikiso Kenkyusho) andmaintained in regular ACSF before use. The NK3630 dye has beencharacterized in previous studies and has its peak signal-to-noise ratiocentered around 705 nm (Jin et al. 2002). Throughout the incubation,staining, and recording, the slices were continuously bubbled with95% O2-5% CO2.
Electrophysiology and photostimulation
Slices were visualized with an upright microscope (BW51X, Olym-pus) with infrared differential interference contrast optics. Electro-physiological recordings, photostimulation, and imaging of the slicepreparations were done in a slice perfusion chamber mounted on amotorized stage of the microscope. At low magnification (4� objec-tive lens, 0.16 NA; UplanApo, Olympus), laminar and cytoarchitec-tonic features of brain slices were visualized under infrared bright-field transillumination, and the slice images were acquired by ahigh-resolution digital CCD camera (Retiga 2000, Q-imaging, Austin,TX). Digitized images from the camera were used for guiding andregistering photostimulation sites in cortical slices.
The absorption dye, NK3630, had low toxicity for neurons in the slice,and even after long sessions of VSD recordings over several hours, theslice still remained healthy (Supplemental Fig. S1, A and B).1 The cellsin the VSD-stained slices had normal spiking patterns and resting mem-brane potentials that did not differ from those cells recorded in controlslices without the dye staining. The resting membrane potentials for theidentified pyramidal cells in the VSD-stained slices (n � 11 cells) and thecells in the control slices (n � 10 cells) were �66.6 � 2.2 and �64.9 �1.8 (SE) mV, respectively (P � 0.05, Mann-Whitney U test).
During experiments, simultaneous electrophysiological recordings(whole cell recordings, loose-seal patchings, or local field potentialrecordings) were conducted to monitor laser stimulation and correlateVSD signals with the electrical activity. To perform patch recording,cells were visualized at high magnification (60� objective, 0.9 NA;LUMPlanFl/IR, Olympus). Neurons were patched with borosilicateelectrodes and recorded at room temperature in the whole cell orloose-seal mode. The patch pipettes (4–6 M� resistance) were filledwith an internal solution containing (in mM) 126 K-gluconate, 4 KCl,10 HEPES, 4 ATP-Mg, 0.3 GTP-Na, and 10 phosphocreatine (pH 7.2,300 mOsm). The electrodes also contained 0.1% biocytin for celllabeling and morphological identification. Resting membrane poten-tials were measured immediately after electrodes broke into the cellsfollowing formation of a gigaohm seal, and current pulses wereinjected to examine each cell’s basic electrophysiological properties.Data were acquired with a Multiclamp 700B amplifier (MolecularDevices, Sunnyvale, CA), data acquisition boards (models PCI MIO
16E-4 and 6713, National Instruments, Austin, TX), and custommodified version of Ephus software (Ephus, available at https://openwiki.janelia.org/). Data were filtered at 2 kHz using a Besselfilter, digitized at 10 kHz, and stored on a computer. Once stablewhole cell recordings were achieved with good access resistance(usually �20 M�), the microscope objective was switched from 60�to 4� for laser scanning photostimulation. The same low-powerobjective lens was used for delivering the UV flash stimuli.
Stock solution of MNI-caged-L-glutamate (4-methoxy-7-nitroindoli-nyl-caged L-glutamate, Tocris Bioscience, Ellisville, MO) was preparedby dissolving MNI-glutamate in distilled water and stored in 50 �laliquots at �20°C for up to several weeks. An aliquot was added to20–25 ml of circulating ACSF for a concentration of 0.4 mM cagedglutamate. After 5–6 h of experimentation, the bath solution and MNI-glutamate were refreshed. Care was taken to ensure a constant fluid levelin the chamber of �2.0–2.5 mm above the slice to avoid small fluctua-tions in UV attenuation. For some experiments (see Fig. 2, B3 and B4),additions of 10 �M CNQX (Tocris Bioscience) and 10 �M 3-(2-carboxypiperazin-4-yl)-propyl-1-phosphonic acid (CPP; Tocris Bio-science) in solutions were used to block ionotropic glutamate receptors.In other experiments (see Supplemental Fig. S3), 2 �M TTX (TocrisBioscience) in the bath solution was used to block voltage-gated sodiumchannels, preventing neuronal spiking activity. In addition, modifiedACSF containing 0.2 mM Ca2 and 4 mM Mg2 was used to blocksynaptic transmission.
We adopted the design of the laser scanning photostimulationsystem described previously (Shepherd and Svoboda 2005; Shepherdet al. 2003). A laser unit (model 3501, DPSS Lasers, Santa Clara, CA)was used to generate a 355 nm UV laser for glutamate uncaging. Thelaser beam was 1.5 mm in diameter and directed through the opticalpath of our system. Short durations of laser flashes (e.g., 1–3 ms) werecontrolled by using an electro-optical modulator (i.e., pockels cell)(Conoptics, Danbury, CT) and a mechanical shutter (Uniblitz, VincentAssociates, Rochester, NY). Laser beam power was modulated by aneutral density gradient wheel and monitored by diverting a smallfraction of the laser beam with a glass coverslip to a photodiode. Thelaser scanning system included an X-Y pair of scan mirrors, the scanlens, the tube lens, and the objective lens (Fig. 1A). The mirrorsdelivered the laser beam through a scan lens; the beam entered themicroscope (BX51WI, Olympus) via a dichroic mirror (351DRLP,Chroma Technology, Brattleboro, VT) and was focused by a custom-made UV-transmitting tube lens. The beam underfilled the backaperture of the microscope objective to provide a more columnar (asopposed to conical) illuminating beam, keeping the mapping as twodimensional as possible by reducing the axial resolution. Various laserstimulation positions could be achieved through galvanometer-drivenX-Y scanning mirrors (Cambridge Technology, Cambridge, MA), asthe mirrors and the back aperture of the objective were in conjugateplanes, translating mirror positions into different scanning locations atthe objective lens focal plane. During uncaging, a variable number ofpatterned sites that covers the whole field are stimulated sequentiallyin a nonraster, nonrandom sequence, following a “shifting-X” patterndesigned to avoid revisiting the vicinity of recently stimulated sites(Shepherd and Svoboda 2005; Shepherd et al. 2003). Ephus softwarewas used to control photostimulation protocols and acquire photo-stimulation data. In most experiments, whole cell recordings orloose-seal patchings were simultaneously performed with opticalrecordings.
After all physiological assays had been completed, the brain sliceswere fixed in 4% paraformaldehyde in PBS overnight and transferredto 30% sucrose solution in PBS. The slices were stained againstbiocytin with 1:1,000 Cy3-conjugated streptavidin (Jackson Immu-noResearch, West Grove, PA) to show the morphology of the re-corded cells. Sections were also stained for 4-6-diamidino-2-phe-nylindole (DAPI) (Sigma-Aldrich, St. Louis, MO) to identify laminarboundaries. Neuron reconstructions were computer-assisted and based1 The online version of this article contains supplemental data.
Innovative Methodology
2302 X. XU, N. D. OLIVAS, R. LEVI, T. IKRAR, AND Z. NENADIC
J Neurophysiol • VOL 103 • APRIL 2010 • www.jn.org
on August 26, 2011
jn.physiology.orgD
ownloaded from

on stacks of optical sections acquired by a confocal microscope(LSM510-META, Carl Zeiss).
VSD imaging and data analysis
As indicated in Fig. 1A, a dual camera port was used to couple theQ-imaging camera and the laser scanning photostimulation system toa MiCAM02 fast imaging system (SciMedia USA, Costa Mesa, CA)for VSD imaging. The VSD imaging computer (B) was independentfrom the computer (A), but its image acquisitions were triggered andsynchronized with computer A through output TTL pulses fromcomputer A. On triggering, optical recording of VSD signals wasperformed by the MiCAM02 system with a sampling rate of 2.2ms/frame [frame resolution 88 (w) � 60 (h) pixels]. Under the 4�objective, the imaging field covered the area of 1.28 � 1.07 mm2 witha spatial resolution of 14.6 � 17.9 �m/pixel. With the 60� objective,the imaging field covered the area of 84.5 � 70.8 �m2 with aresolution of 0.96 � 1.18 �m/pixel. The trials were obtained every8 s, and the recording periods were either 400 or 1,000 frames for eachphotostimulation trial. VSD images were smoothed by convolvingimages with a Gaussian spatial filter (kernel size: 3 � 3 pixels; � size:1 � 1 pixel) and a Gaussian temporal filter (kernel size: 3 frames; �size: 1 frame). VSD signals were originally measured by the percentchange in pixel light intensity [�I/I%; the % change in the intensity(�I) at each pixel relative to the initial intensity (I)]. In addition, signalamplitudes were expressed as SD above the mean baseline signal fordisplay and quantification. In this study, single-trial VSD signals wereof sufficiently high amplitudes and could be discerned from back-ground noise; hence no averaging over multiple trials was necessary.Images were displayed and initially analyzed using an acquisition andanalysis software (BV-Analyzer, BrainVision). Further quantificationand measurements were performed with custom-made Matlab Pro-grams.
As for quantitative analysis of evoked activation in image frames,the mean and SD of the baseline activity of each pixel across the 50frames preceding photostimulation was first calculated, and thenactivated pixels were measured. The activated pixel was empiricallydefined as the pixel with the amplitude �1 SD above the mean of thecorresponding pixel’s amplitude preceding the stimulation (equivalentto the detectable signal level in the original VSD maps of �I/I%). Theoverall activation size in image frames was defined as the fraction ofactivated pixels, expressed as a percentage of the image frame size.
To quantify the layer-specific evoked activation in V1, the averagenumbers of activated pixels in different cortical layers across the 10frames around the peak VSD activation frame (e.g., at 50 ms afterphotostimulation) were measured, and the mean VSD activationstrength of individual layers was calculated in percent of the totalnumber of activated pixels of all the cortical layers (i.e., % totalevoked activation; Fig. 5, A–D).
For statistical comparisons across more than two groups, we usedthe Kruskal-Wallis test (nonparametric 1-way ANOVA) and theMann-Whitney U test for group comparisons. � levels of P � 0.05were considered significant.
R E S U L T S
General system design, calibration, and VSDresponse characterization
Our overall system is shown in Fig. 1A, consisting of laserscanning photostimulation, VSD imaging, and electrophysio-logical recording systems (see METHODS for detailed descrip-tions of the system). The absorption dye, NK3630 (RH 482),was used for our VSD imaging experiments. The dye waschosen because of its good sensitivity, low bleaching, and
FIG. 1. The system design, calibrations, and tests for combining laser scanning photostimulation with voltage-sensitive dye (VSD) imaging. A: the systemdiagram of a laser scanning photostimulation and VSD imaging setup. B: the physical calibration measurement of the laser scanning photostimulation systemwith a 2 � 2 (spacing at 500 �m) uncaging pattern generated by single 100 �s laser pulses (32 mW) on a thin layer of 0.2% caged fluorescein dextran througha 4� objective. C: the result of fluorescein uncaging by 10-�s laser pulses (32 mW) using a 60� objective. Red arrows point to fluorescent spots resulting fromuncaging. We estimated the laser physical excitation size with the full width at the half height (FWHH) from the cross profile of the uncaging spot with the heightreferring to fluorescence intensity. D and E: the functional calibration of laser scanning photostimulation by measurement of a single neuron’s excitation profile.The pyramidal neuron in visual cortex (V1) layer 4 was recorded in whole cell patch-clamp configuration and photostimulated with 1-ms laser pulses (32 mW).The array of 16 � 16 stimulation sites spanned different V1 cortical layers, and the sites were spaced 50 �m apart. D: the neuronal response traces depictingchanges in the membrane potential in response to photostimulation at the 10 � 10 stimulation sites centered at the recorded cell (indicated by the small blackcircle). Note that suprathreshold spikes were evoked only in the perisomatic region. E: the spiking locations of the neuron recorded in D across the 16 � 16stimulation sites. The color code indicates latencies of spiking in response to stimulation at different locations (see the color bar).
Innovative Methodology
2303CIRCUIT MAPPING THROUGH IMAGING AND PHOTOSTIMULATION
J Neurophysiol • VOL 103 • APRIL 2010 • www.jn.org
on August 26, 2011
jn.physiology.orgD
ownloaded from

phototoxicity, as well as its preferential staining of neuronswith a low affinity for glial cells (Jin et al. 2002; Konnerth etal. 1987). During experiments, a 705 nm light trans-illumi-nated brain slices and voltage-dependent changes in the lightabsorbance of the dye were captured by the MiCAM02 camera(Fig. 1A). The photostimulation and imaging systems werealigned and calibrated, and uncaging tests were visualized byexciting caged fluorescein dextran on a glass slide (Fig. 1, B andC). Under the 4� objective, the laser beam formed uncagingspots, each approximating a Gaussian profile with the estimatedfull width at the half height (FWHH) of 153 �m laterally at thefocal plane (Fig. 1B), and the laser beam caused uncaging offluorescent dextran at �100 �m in depth. It is important to notethat the physical laser excitation size in the glass slide does notdirectly translate into the effective spatial resolution of physiolog-ical uncaging in brain slices. In comparison, under the 60�objective, the UV laser induced uncaging was focused to a smallerspot with FWHH of 2.3 �m. Although imaging through the 60�objective is useful for exciting smaller numbers of neurons orpossibly even single cell stimulation, this study focused on imag-ing and excitation both through the 4� objective to map propa-gation of activity reflecting interlaminar connectivity within localcortical circuits.
In our experiments, VSD imaging was routinely performedwith simultaneous whole cell recordings or loose-seal patchingof single neurons to monitor the effectiveness and spatialprecision of laser photostimulation in cortical slices. For ex-ample, in the slice of mouse primary visual cortex (V1),through the 4� objective, laser stimulation (1 ms, 35 mW) hada spatial resolution of 50–100 �m in evoking suprathresholdspikes from the recorded neuron (Fig. 1D) and spike latencieswere 5.4–10.7 ms (Fig. 1E). Under the photostimulation con-ditions (power level: 30–35 mW; pulse duration: 1 ms; cagedglutamate concentration: 0.4 mM) used for our data set (10excitatory pyramidal cells), spikes evoked by photostimulationoccurred with an average latency of 11.5 � 0.7 (SE) ms withsomata located within 100 �m from the stimulation site. Theseexcitation profile data were consistent with previous studies(Dantzker and Callaway 2000; Shepherd and Svoboda 2005;Xu and Callaway 2009). Therefore with proper experimentalconditions, photostimulation-evoked action potentials onlyfrom neurons located at or near the stimulation site and thuscan provide spatially restricted activation. However, understronger photostimulation conditions (power level: 30–35mW; pulse duration: 2 ms or above), the spatial resolution oflaser photostimulation was lowered as spikes could be evokedfrom cells located 100–300 �m away from the stimulationsites with an average spike latency of 23.9 � 3.4 ms (6 cells).The stronger laser stimulation evoked neuronal spikes from thecells located �100 �m away from the photostimulation sitespossibly either through direct activation of distant dendrites orthrough strong synaptic drive (Dantzker and Callaway 2000;Weiler et al. 2008). The example data shown in SupplementalFig. S2 strongly supports that under the experimental conditionwith a longer laser duration, stimulating the presynaptic neu-rons in the strong excitatory pathways likely evoked spikes inthe recorded postsynaptic neuron through synaptic drive (e.g.,from layer 4 to layer 2/3). Hence in some imaging experimentsconducted for this study, strong laser stimulation was used tofurther assess trans-synaptic spread of activity.
In our VSD imaging experiments, the observed properties ofphotostimulation evoked VSD signals were closely related tomembrane potential depolarization of individual neurons (Fig. 2,B1–B4). Spikes responded faster to photostimulation than VSDsignals, because the average spike peak time in response tophotostimulation was 11.8 � 3 ms, and the average VSD signalpeak time was 29.9 � 6.3 ms (P � 0.001; data from 3 similarexperiments as shown in Fig. 2A). In these experiments, theaverage VSD response latency across different V1 layers was15.4 � 0.7 ms.
Because photostimulation and VSD imaging are combined,separation of the laser excitation and the VSD recording lightis important. Given the UV laser and the VSD absorption lighthave differing wavelengths (355 vs. �705 nm), the laser andits excitation artifact had been significantly reduced using aband-pass filter centered at 705 nm right before the imagingcamera (Fig. 1A). Furthermore, when using short laser pulses(i.e., 1–3 ms), the laser artifact signal only existed in the initialtwo image frames (2.2 ms/frame). Compared with the VSDsignal reflecting neural activity (0.1–0.5%), the artifact signalwas large, up to 2% change from baseline (Fig. 2, B1–B4),however, did not interfere with true VSD signals, consideringdetectable VSD responses occur approximately five to sixframes after the laser onset.
As exemplified in Fig. 2, A–E, the photostimulation-evokedVSD responses were mediated by glutamate and its receptors,as neuronal spiking and VSD responses to glutamate uncagingwere essentially abolished by the ionotropic glutamate receptorantagonists (CPP and CNQX; n � 5 slices). There was no VSDsignal without glutamate uncaging; laser flashes alone did notactivate neurons or induce VSD responses (Supplemental Fig.S1, C and D). Furthermore, reducing neurotransmitter releaseand synaptic spread from stimulated neurons using low Ca2
and high Mg2 ACSF solution restricted VSD changes to theregion near the stimulation site. This indicates that mostactivity far from the stimulation site reflected synaptic spreadof activity to postsynaptic neurons rather than activity in theaxons and distant dendrites of directly stimulated cells (Fig. 2,F–H). This is similar to the result observed in TTX, whichblocks both synaptic spread and conduction of activity with theaxons of stimulated cells (Supplemental Fig. S3).
Unlike electrical stimulation, a significant advantage ofphotostimulation is such that uncaged glutamate does notactivate passing axon fibers (Supplemental Fig. S1, E and F),thus ensuring spatial specificity of stimulation and avoidingantidromic presynaptic activation. In addition, VSD imaging ofthe photostimulation evoked network activity showed goodrepeatability and low variations, because maps were consistentacross multiple repetitions.
Through VSD imaging of large areas of cortical activityprobed with laser scanning photostimulation in various loca-tions, our new technique is a powerful tool for functionalcircuit analysis.
Mouse V1 cortical circuit mapping
We first show high-precision mapping of V1 circuits withour new technique. Compared with previous studies of rat V1circuits that used VSD imaging with electrical stimulation orpuffed glutamate at different cortical locations (Yuste et al.1997), our new technique allowed us to evaluate laminar
Innovative Methodology
2304 X. XU, N. D. OLIVAS, R. LEVI, T. IKRAR, AND Z. NENADIC
J Neurophysiol • VOL 103 • APRIL 2010 • www.jn.org
on August 26, 2011
jn.physiology.orgD
ownloaded from

propagation of evoked excitation and probe functional connec-tivity of mouse V1 laminar circuits (n � 10 slices), with amuch improved precision and speed.
Under the stimulation conditions used, laser scanning pho-tostimulation (1 ms, 30–35 mW) offered spatially restrictedneuronal activation in a specific cortical layer so that we wereable to map direct projections from the stimulated layer to itstargeted layer(s) by VSD imaging of evoked activation. Pho-tostimulation-evoked action potentials were restricted to neu-rons with cell bodies at or close to the stimulation site; activitypropagated through the axons of the stimulated neurons andgenerated postsynaptic responses in the neurons that wereconnected to the stimulated cells. The measured VSD signalsreflected the combined contributions of these sources, butresponses distant from the stimulation site were dominated bypostsynaptic changes, as evidenced by control experiments inwhich synaptic transmission was blocked by using low Ca2
and high Mg2 ACSF.Figure 3, A–C, show VSD image frames in response to laser
photostimulation at cortical layers 2/3, 4, or 5 in a V1 coronal
slice, respectively, whereas Fig. 3D shows VSD image framesin response to electrical stimulation at V1 layer 4. In compar-ison, layer 4 photostimulation was effective as electrical stim-ulation in evoking population neuronal responses, but its acti-vation was more restricted and specific (cf. Fig. 3, B6 and D6).
During photostimulation and VSD imaging experiments,stimulation in V1 cortical layers initiated excitation that re-sulted in VSD signals first localized to the stimulation site ataround 10–20 ms after laser exposure; excitation propagated tofunctionally connected cortical regions. For layer 2/3 stimula-tion, the activation in layer 2/3 was mostly localized in layer2/3; however, relatively small but clear activation propagatedfrom layer 2/3 to layer 5, bypassing most of layer 4 (Fig. 3,A1–A6). There was essentially no excitation from layer 2/3propagating to layer 6. Stimulation in layer 4 caused excitatoryactivity to spread vertically to layers 2/3 and 5, but with littleexcitation in layer 6 (Fig. 3, B1–B6). Strong activation in layers2/3 and 5 caused by layer 4 stimulation indicates these layersreceive strong direct projections from layer 4. Layer 5 stimulationresulted in distinct foci of activation in layer 2/3 (Fig. 3, C1–C6),
FIG. 2. Characterization of VSD responses evoked by glutamate uncaging. A: grayscale image of V1 slice stained with NK3630, photostimulated (laser: 1 ms, 35mW) at 2 sites (indicated by cyan stars) close to the recording electrode placed at the boundary of layers 3 and 4. As shown in the Inset, the recorded neuron was identifiedas an excitatory pyramidal neuron. B1 and B2: data traces of simultaneous whole cell recording and VSD imaging in response to photostimulation at sites 1 and 2 innormal artificial cerebrospinal fluid (ACSF), respectively. Red traces represent membrane potentials of the recorded neuron, and blue traces represent VSD signals thatwere measured from the region of interest (ROI) marked by a blue square around the electrode tip shown in A. The black arrow in B1 points to the artifact signal oflaser excitation in the VSD signal trace. B3 and B4 show data traces of simultaneous whole cell recording and VSD imaging in response to photostimulation at the samesites as B1 and B2 but in ACSF with 10 �M CNQX and 10 �M 3-(2-carboxypiperazin-4-yl)-propyl-1-phosphonic acid (CPP). C–E: VSD image frames of peakactivation after glutamate uncaging at site 1 (indicated by the white star) before and after bath application and after washout of CNQX and CPP, respectively. VSD signalamplitudes expressed as SD above the mean baseline signal are color coded. F–H: peak activation frames of a different V1 slice in response to laser photostimulationin a layer 4 site (indicated by the white star; laser: 1 ms, 35 mW) with perfusion of normal ACSF (control), low Ca2 and high Mg2 ACSF (containing 0.2 mM Ca2,4 mM Mg2), and postcontrol normal ACSF, respectively. The data show that most VSD responses outside the photostimulation site are predominantly postsynapticresponses that are blocked in the low Ca2 and high Mg2 solution.
Innovative Methodology
2305CIRCUIT MAPPING THROUGH IMAGING AND PHOTOSTIMULATION
J Neurophysiol • VOL 103 • APRIL 2010 • www.jn.org
on August 26, 2011
jn.physiology.orgD
ownloaded from
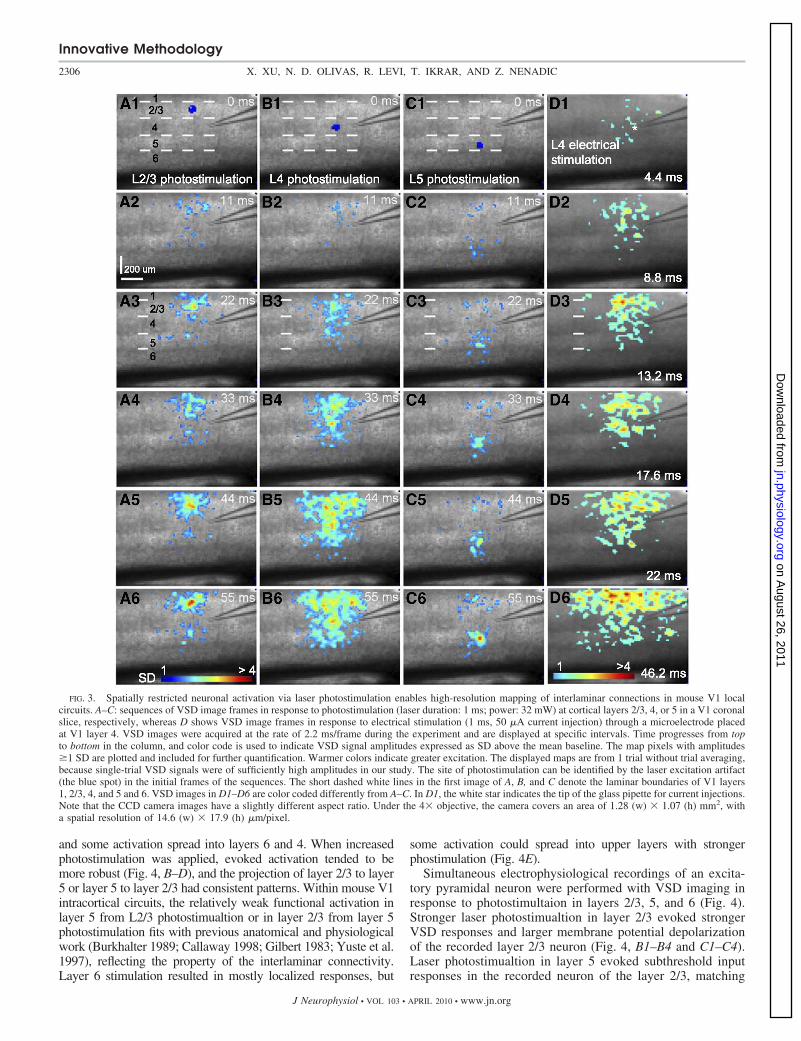
and some activation spread into layers 6 and 4. When increasedphotostimulation was applied, evoked activation tended to bemore robust (Fig. 4, B–D), and the projection of layer 2/3 to layer5 or layer 5 to layer 2/3 had consistent patterns. Within mouse V1intracortical circuits, the relatively weak functional activation inlayer 5 from L2/3 photostimualtion or in layer 2/3 from layer 5photostimulation fits with previous anatomical and physiologicalwork (Burkhalter 1989; Callaway 1998; Gilbert 1983; Yuste et al.1997), reflecting the property of the interlaminar connectivity.Layer 6 stimulation resulted in mostly localized responses, but
some activation could spread into upper layers with strongerphostimulation (Fig. 4E).
Simultaneous electrophysiological recordings of an excita-tory pyramidal neuron were performed with VSD imaging inresponse to photostimultaion in layers 2/3, 5, and 6 (Fig. 4).Stronger laser photostimualtion in layer 2/3 evoked strongerVSD responses and larger membrane potential depolarizationof the recorded layer 2/3 neuron (Fig. 4, B1–B4 and C1–C4).Laser photostimualtion in layer 5 evoked subthreshold inputresponses in the recorded neuron of the layer 2/3, matching
FIG. 3. Spatially restricted neuronal activation via laser photostimulation enables high-resolution mapping of interlaminar connections in mouse V1 localcircuits. A–C: sequences of VSD image frames in response to photostimulation (laser duration: 1 ms; power: 32 mW) at cortical layers 2/3, 4, or 5 in a V1 coronalslice, respectively, whereas D shows VSD image frames in response to electrical stimulation (1 ms, 50 �A current injection) through a microelectrode placedat V1 layer 4. VSD images were acquired at the rate of 2.2 ms/frame during the experiment and are displayed at specific intervals. Time progresses from topto bottom in the column, and color code is used to indicate VSD signal amplitudes expressed as SD above the mean baseline. The map pixels with amplitudes�1 SD are plotted and included for further quantification. Warmer colors indicate greater excitation. The displayed maps are from 1 trial without trial averaging,because single-trial VSD signals were of sufficiently high amplitudes in our study. The site of photostimulation can be identified by the laser excitation artifact(the blue spot) in the initial frames of the sequences. The short dashed white lines in the first image of A, B, and C denote the laminar boundaries of V1 layers1, 2/3, 4, and 5 and 6. VSD images in D1–D6 are color coded differently from A–C. In D1, the white star indicates the tip of the glass pipette for current injections.Note that the CCD camera images have a slightly different aspect ratio. Under the 4� objective, the camera covers an area of 1.28 (w) � 1.07 (h) mm2, witha spatial resolution of 14.6 (w) � 17.9 (h) �m/pixel.
Innovative Methodology
2306 X. XU, N. D. OLIVAS, R. LEVI, T. IKRAR, AND Z. NENADIC
J Neurophysiol • VOL 103 • APRIL 2010 • www.jn.org
on August 26, 2011
jn.physiology.orgD
ownloaded from
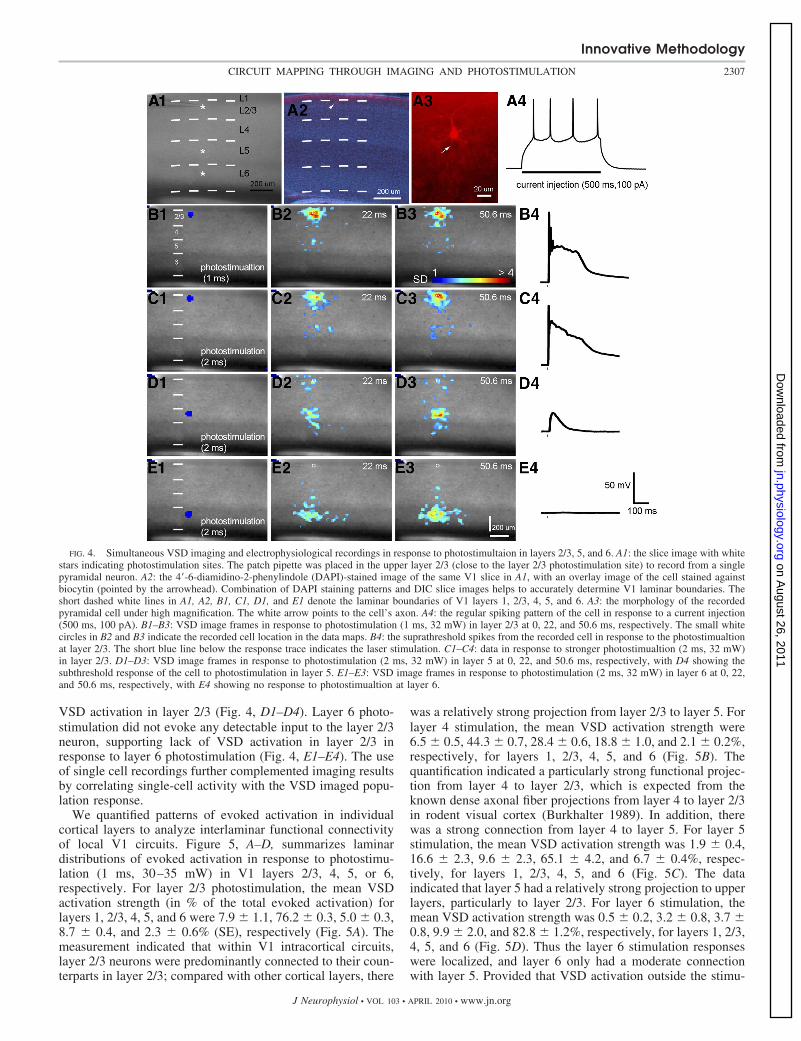
VSD activation in layer 2/3 (Fig. 4, D1–D4). Layer 6 photo-stimulation did not evoke any detectable input to the layer 2/3neuron, supporting lack of VSD activation in layer 2/3 inresponse to layer 6 photostimulation (Fig. 4, E1–E4). The useof single cell recordings further complemented imaging resultsby correlating single-cell activity with the VSD imaged popu-lation response.
We quantified patterns of evoked activation in individualcortical layers to analyze interlaminar functional connectivityof local V1 circuits. Figure 5, A–D, summarizes laminardistributions of evoked activation in response to photostimu-lation (1 ms, 30–35 mW) in V1 layers 2/3, 4, 5, or 6,respectively. For layer 2/3 photostimulation, the mean VSDactivation strength (in % of the total evoked activation) forlayers 1, 2/3, 4, 5, and 6 were 7.9 � 1.1, 76.2 � 0.3, 5.0 � 0.3,8.7 � 0.4, and 2.3 � 0.6% (SE), respectively (Fig. 5A). Themeasurement indicated that within V1 intracortical circuits,layer 2/3 neurons were predominantly connected to their coun-terparts in layer 2/3; compared with other cortical layers, there
was a relatively strong projection from layer 2/3 to layer 5. Forlayer 4 stimulation, the mean VSD activation strength were6.5 � 0.5, 44.3 � 0.7, 28.4 � 0.6, 18.8 � 1.0, and 2.1 � 0.2%,respectively, for layers 1, 2/3, 4, 5, and 6 (Fig. 5B). Thequantification indicated a particularly strong functional projec-tion from layer 4 to layer 2/3, which is expected from theknown dense axonal fiber projections from layer 4 to layer 2/3in rodent visual cortex (Burkhalter 1989). In addition, therewas a strong connection from layer 4 to layer 5. For layer 5stimulation, the mean VSD activation strength was 1.9 � 0.4,16.6 � 2.3, 9.6 � 2.3, 65.1 � 4.2, and 6.7 � 0.4%, respec-tively, for layers 1, 2/3, 4, 5, and 6 (Fig. 5C). The dataindicated that layer 5 had a relatively strong projection to upperlayers, particularly to layer 2/3. For layer 6 stimulation, themean VSD activation strength was 0.5 � 0.2, 3.2 � 0.8, 3.7 �0.8, 9.9 � 2.0, and 82.8 � 1.2%, respectively, for layers 1, 2/3,4, 5, and 6 (Fig. 5D). Thus the layer 6 stimulation responseswere localized, and layer 6 only had a moderate connectionwith layer 5. Provided that VSD activation outside the stimu-
FIG. 4. Simultaneous VSD imaging and electrophysiological recordings in response to photostimultaion in layers 2/3, 5, and 6. A1: the slice image with whitestars indicating photostimulation sites. The patch pipette was placed in the upper layer 2/3 (close to the layer 2/3 photostimulation site) to record from a singlepyramidal neuron. A2: the 4-6-diamidino-2-phenylindole (DAPI)-stained image of the same V1 slice in A1, with an overlay image of the cell stained againstbiocytin (pointed by the arrowhead). Combination of DAPI staining patterns and DIC slice images helps to accurately determine V1 laminar boundaries. Theshort dashed white lines in A1, A2, B1, C1, D1, and E1 denote the laminar boundaries of V1 layers 1, 2/3, 4, 5, and 6. A3: the morphology of the recordedpyramidal cell under high magnification. The white arrow points to the cell’s axon. A4: the regular spiking pattern of the cell in response to a current injection(500 ms, 100 pA). B1–B3: VSD image frames in response to photostimulation (1 ms, 32 mW) in layer 2/3 at 0, 22, and 50.6 ms, respectively. The small whitecircles in B2 and B3 indicate the recorded cell location in the data maps. B4: the suprathreshold spikes from the recorded cell in response to the photostimualtionat layer 2/3. The short blue line below the response trace indicates the laser stimulation. C1–C4: data in response to stronger photostimualtion (2 ms, 32 mW)in layer 2/3. D1–D3: VSD image frames in response to photostimulation (2 ms, 32 mW) in layer 5 at 0, 22, and 50.6 ms, respectively, with D4 showing thesubthreshold response of the cell to photostimulation in layer 5. E1–E3: VSD image frames in response to photostimulation (2 ms, 32 mW) in layer 6 at 0, 22,and 50.6 ms, respectively, with E4 showing no response to photostimualtion at layer 6.
Innovative Methodology
2307CIRCUIT MAPPING THROUGH IMAGING AND PHOTOSTIMULATION
J Neurophysiol • VOL 103 • APRIL 2010 • www.jn.org
on August 26, 2011
jn.physiology.orgD
ownloaded from

lation site mostly reflects synaptic spread of activity to postsyn-aptic neurons rather than activity in the axons and distantdendrites of directly stimulated cells in the photostimulatedlayer, we constructed a functional connectivity diagram formouse V1 local circuits based on quantitative analysis ofpropagation activity from multiple laminar locations (Fig. 5E).
Next we show rapid mapping of neuronal circuitry with ourtechnique by patterned photostimulation and VSD imaging ofmultiple V1 locations (n � 5 slices). As shown in Fig. 6, anarray of 4 � 4 photostimulation sites (cyan stars, spacing 200�m, in Fig. 6A1) covered the V1 cortical area at differentlaminar locations. Laser scanning photostimulation allowedrapid stimulation for assessment of activity propagation atmultiple locations because it was possible to activate many
different sites with very short time intervals. This approach ismuch more efficient than mapping with electrical stimulation atdifferent locations, considering the time required for properelectrode placement on the order of minutes.
During the experiments, a single pyramidal cell was re-corded in the middle of layer 2/3; as shown in Fig. 6, A3 andA4, photostimulation (1 ms, 35 mW) triggered spikes of therecorded cell only in layer 2/3 sites (i.e., sites 2 and 3 in Fig.6A1), but stronger photostimulation (3 ms, 35 mW) triggeredspikes of the recorded cell at a larger area around the cell somaincluding layer 4 sites (i.e., sites 6 and 7 in Fig. 6A1). Thestronger photostimulation excited more neurons at stimulationsites and evoked stronger VSD responses. When 3-ms photo-stimulation (laser power: 35 mW; duration: 3 ms) was used to
FIG. 5. Functional connectivity of V1 lam-inar circuits shown by quantitative analysis ofVSD activation evoked by laser scanning pho-tostimulation (1 ms, 30–35 mW). A–D: lami-nar distributions of VSD activation in responseto photostimulation in V1 layers 2/3, 4, 5, or 6,respectively. In the histogram, the x-axis indi-cates different cortical layers, and the y-axisshows VSD activation strength (mean � SE, in% of the total evoked activation). Data werebased on the representative cases shown inFigs. 3 and 4. E: summary of functional con-nectivity of local V1 laminar circuits based onquantitative analysis of VSD activation pat-terns. Given deeper layer neurons (particularlylayer 2/3 neurons) have extensive dendriticbranches in layer 1 (e.g., Fig. 4C) and somelayer 1 VSD activation might result from directneuronal activation in other layers, we ex-cluded layer 1 connectivity in our diagram. Inaddition, only the laminar projection with anaverage VSD activation strength �5% is in-cluded in the summary. The thicker projectionlines correspond to stronger interlaminarprojections.
Innovative Methodology
2308 X. XU, N. D. OLIVAS, R. LEVI, T. IKRAR, AND Z. NENADIC
J Neurophysiol • VOL 103 • APRIL 2010 • www.jn.org
on August 26, 2011
jn.physiology.orgD
ownloaded from

map all 16 locations in the V 1 slice, stronger photostimulationyielded clear columnar activity seen at stimulation sites, andincreased vertical propagation of activity (Fig. 6, B1–B16).Although activation patterns from stronger photostimulation inlayers 2/3, 4, and 6 generally resembled those evoked by using1-ms laser stimulation, stronger layer 5 photostimulation
evoked activity that propagated across all V1 layers, ascendinginto layers 4, 2/3, and 1 and descending into layer 6. The averagepeak activation size (in % of the whole image size) for layer 5stimulation was larger than that of layer 4 stimulation (12.3 �0.36 vs. 11.2 � 0.21%), and both of them differed significantlyfrom stimulation in layers 2/3 and 6 (7.31 � 0.13 and 7.72 �
FIG. 6. Rapid mapping of V1 local circuits through combination of VSD imaging and laser scanning photostimulation at multiple sites. A1: the slice imagewith cyan stars indicating a 4 � 4 stimulus pattern covering V1 from cortical layer 2/3 to layer 6. The patch pipette was placed in the middle of layer 2/3 torecord from a single pyramidal neuron duringphotostimulation and imaging. A2: the DAPI-stained image of the same V1 slice recorded in A1, with an overlayimage of the cell stained against biocytin (pointed by the white arrow). Inset in A2: the morphology of the recorded pyramidal cell under a higher magnification.The cell’s morphological reconstruction with major dendrites is shown in A1. The short dashed white lines in A1, A2, B4, B8, B12, and B16 denote the laminarboundaries of V1 layers 1, 2/3, 4, 5, and 6. A3 and A4: the excitation profiles of the recorded neuron in response to 1 and 3 ms photostimulation (laser power35 mW) of the 4 � 4 sites shown in A1, respectively. The small circle indicates the cell body location. The red traces displayed at the stimulation sites depictmembrane potential changes in response to photostimulation in the whole cell recording mode. B1–B16: single frames corresponding to the times of peakactivation from the VSD map sequences at each of the 16 stimulation sites indicated in A1. VSD signal amplitudes expressed as SD above the mean baselinesignal are color coded.
Innovative Methodology
2309CIRCUIT MAPPING THROUGH IMAGING AND PHOTOSTIMULATION
J Neurophysiol • VOL 103 • APRIL 2010 • www.jn.org
on August 26, 2011
jn.physiology.orgD
ownloaded from

0.26%; P � 0.001, Kruskal-Wallis test). The large activationderived from layer 5 stimulation is likely to result from both directneuronal responses induced at layer 5 as well as strong indirectsuprathreshold activation of layer 4 neurons via connections fromlayer 5 to layer 4 neurons (Schubert et al. 2003).
As shown above, our new technique enables cortical circuitsto be further probed by varying the strength of stimulation, bychanging either laser duration or power. This method cantherefore also be used to assess the polysynaptic spread ofactivity when laser activation is sufficiently strong.
Mouse hippocampal circuit mapping
Considering that the hippocampus is an important corticalstructure and its trisynaptic pathway is a fundamental network, wefurther extended our technique to study the mouse hippocampalcircuitry. We are particularly interested in understanding whether
or how a restricted population of dentate neurons (e.g., granulecells) can engage the entire trisynaptic circuit. We photostimu-lated different locations in the dentate gyrus (DG) such as themolecular layer, the granule cell layer, and the hilus, and moni-tored how evoked responses initiated and propagated throughoutthe hippocampal circuitry (n � 5 slices).
For the purpose of this study, we present example data ofstimulation in the DG granule cell layer as shown in Fig. 7.During the experiment, strong laser photostimulation (laserpower: 35 mW; duration: 3 ms) was used to activate thetrisynaptic circuitry. With the restricted photostimulation in theupper portion DG granule cell layer (indicated by the blue spotof laser excitation artifact in Fig. 7B), the VSD responseoriginated locally in the granule cell layer and after a shortdelay, traversed through the hilus, and reached CA3, followedby CA1 (Fig. 7C). The localized DG neuronal activation
FIG. 7. Hippocampal circuit mapping. A: DAPI-stained image of the hippocampus slice with the white rectangule marking the VSD imaging area shown inB and C. Overlay and alignment of DAPI staining with DIC living slice images located dentate gyrus (DG), CA3, CA2 (pointed by the arrowhead), and CA1.B: the space-time analysis indicating serial excitatory propagation in DG, CA3, and CA1. B: left: the background reference image with an analysis curve alignedwith the hippocampal circuitry. The white arrowhead in the left panel points to the restricted photostimulation site (the blue spot) in the DG granule cell layer.B: right: the space-time map with the y-axis indicating the location along the analysis curve shown in the left panel (e.g., the pink, green, and yellow arrowheadscorrespond to the colored locations in the left panel) and with the x-axis denoting the time progression after the photostimulation. C: time frame series of theVSD response after photostimulation and a clear excitation flow through the hippocampal trisynaptic pathway. VSD signal amplitudes expressed as SD abovethe mean baseline signal are color coded. In this experiment, the map pixels with amplitudes �2 SD are plotted for analysis. The maps are identically color codedwith warmer colors indicating greater excitatory activity. The white arrows in C point to the CA2 region, which had little activation.
Innovative Methodology
2310 X. XU, N. D. OLIVAS, R. LEVI, T. IKRAR, AND Z. NENADIC
J Neurophysiol • VOL 103 • APRIL 2010 • www.jn.org
on August 26, 2011
jn.physiology.orgD
ownloaded from

therefore induced serial excitatory propagation in DG, CA3,and CA1 (Fig. 7, B and C). The excitation in CA3 and CA1was extensive, but the CA2 region had little excitation (Fig. 7,B and C), which supports evidence that CA2 lacks granule cellinput (Nakagami et al. 1997; Swanson et al. 1978). The datashowed a localized DG neuronal population effectively en-gaged in the excitatory flow of information throughout DG andthe hippocampus proper collectively, thus providing a compre-hensive perspective of the functional circuit organization anddynamics of the hippocampal pathway.
D I S C U S S I O N
Optical-based techniques become increasingly important forcortical circuit studies, as modern technology continues to im-prove spatiotemporal resolutions of imaging and provide exquisitecontrol of the delivery of optical stimuli (Luo et al. 2008). Wedeveloped a new technique that combines laser scanning photo-stimulation with fast VSD imaging for high precision and rapidmapping of in vitro functional circuits. The incorporation of laserscanning photostimulation has greatly enhanced the ability ofassessment of evoked network activity by fast VSD imaging.Photostimulation provides spatially restricted neuronal activationand avoids the interpretation difficulties associated with electricalstimulation of neural tissue. Furthermore, compared with micro-electrode electric stimulation, laser scanning photostimulationpermits rapid evaluation of multiple locations with no physicaldamage to the tissue under the experimental conditions. In addi-tion, we anticipate that glutamate uncaging can be replaced withphotoactivation via channelrhodopsin or other genetically en-coded photosensitive molecules in specific cell types (Boyden etal. 2005; Kuhlman and Huang 2008). Thus our technique will bepossible to target not only specific cortical regions but alsospecific subset of neurons within their participating circuits.
Photostimulation-based mapping techniques have been widelyapplied for analyzing cortical circuits. Laser scanning photostimu-lation combined with single cell recordings or calcium imaging isan effective method for mapping local circuit inputs to singleneurons, because the simultaneous recording from a postsynapticneuron with photostimulation of clusters of presynaptic neurons atmany different locations provides quantitative measures of spatialdistribution of excitatory and inhibitory inputs impinging ontosingle recorded neurons (Callaway and Katz 1993; Nikolenko etal. 2007; Schubert et al. 2003; Shepherd and Svoboda 2005; Xuand Callaway 2009). Different from the aforementioned approach,our newly developed technique is intended to assess circuit acti-vation and network connectivity at the neuronal population levelthrough fast VSD imaging and photostimulation. Because ourtechnique is often performed with simultaneous electrophysiolog-ical recordings of single neurons, the method is readily combinedwith whole cell patch-clamp measurements of electrical signals inbrain slices so that local cortical circuits can be examined in thesame brain slice at both single cell and population levels.
Our technique can have important applications in the field ofcortical circuitry as shown in our studies of mouse V1 andhippocampal circuits. Because the mouse is an important modelsystem for cortical circuit studies and mouse V1 circuits are lesswell understood, we imaged and probed V1 with spatially re-stricted photostimulation and mapped interlaminar functional con-nectivity and circuit dynamics. This technique enabled directvisualization of interlaminar functional connections in V1 circuits
at a previously unattainable precision (Burkhalter 1989; Callaway1998; Yuste et al. 1997). Compared with previous rat V1 findings,our functional circuit analysis showed that mouse V1 layers 2/3and 4 had little projections to layer 6 and found that mouse V1layers 4 and 5 had relatively strong reciprocal projections and thatmouse layer 6 had weak projections to upper layers. Overall, ourmouse V1 data fit with and extend previous anatomical andphysiological observations of laminar patterns of axonal projec-tions in rodent V1 local circuits (Burkhalter 1989; Yuste et al.1997), and is generally consistent with proposed V1 laminaroperational schemes (Callaway 1998; Gilbert 1983).
Alternative approaches would be far more difficult and timeconsuming to obtain similar connectivity data using othermethods such as intracellular dye labeling and reconstructionof axonal arbors or by recording sequentially from manypossible postsynaptic partners. Although our V1 results are asexpected from known anatomy and connectivity in the rodentvisual cortex (Burkhalter 1989; Yuste et al. 1997), this methodwould be valuable for assaying brain areas, species, or genet-ically modified mouse lines in which these data are not pres-ently available. In addition, the application of this technique inthe hippocampal mapping further validated its technical powerand effectiveness. The circuit dynamics and functional con-nection in the hippocampal circuitry were mapped throughspatially restricted activation of a subset of DG neuronalpopulation. With strong photostimulation, we were able toexamine the complete perspectives of the polysynapticspread of activity in detail.
Future study using this technique can be extended forscreening circuit alterations in transgenic animal models reca-pitulating specific neurological diseases. Our new techniquewill allow for the rapid evaluation of alterations in circuitry ofmutant animals compared with normal animals and will guidemore detailed studies. The technique can be further developedas a methodology for identification and monitoring of real-timeresponses in vitro (e.g., cell cultures and slice preparations) todrugs or therapeutic interventions.
A C K N O W L E D G M E N T S
We thank Dr. Gordon Shepherd at Northwestern University, Dr. KarelSvoboda at Howard Hughes Medical Institute Janelia Farm Research Campus,Dr. Hongtao Ma at Weill Medical College of Cornell University, S. Strayer atthe University of California, Irvine, and A. Miller at Olympus USA fortechnical help and Drs. Edward Callaway, David Lyon, Ivan Soltesz, andRalph Siegel for critical reading of our manuscript.
G R A N T S
This work was funded by the National Institute of Drug Abuse GrantsDA-023700 and DA-023700-04S1 to X.Xu.
R E F E R E N C E S
Airan RD, Meltzer LA, Roy M, Gong Y, Chen H, Deisseroth K. High-speedimaging reveals neurophysiological links to behavior in an animal model ofdepression. Science 317: 819–823, 2007.
Ang CW, Carlson GC, Coulter DA. Massive and specific dysregulation ofdirect cortical input to the hippocampus in temporal lobe epilepsy. J Neu-rosci 26: 11850–11856, 2006.
Boyden ES, Zhang F, Bamberg E, Nagel G, Deisseroth K. Millisecond-timescale, genetically targeted optical control of neural activity. Nat Neu-rosci 8: 1263–1268, 2005.
Burkhalter A. Intrinsic connections of rat primary visual cortex: laminarorganization of axonal projections. J Comp Neurol 279: 171–186, 1989.
Callaway EM. Local circuits in primary visual cortex of the macaque monkey.Annu Rev Neurosci 21: 47–74, 1998.
Innovative Methodology
2311CIRCUIT MAPPING THROUGH IMAGING AND PHOTOSTIMULATION
J Neurophysiol • VOL 103 • APRIL 2010 • www.jn.org
on August 26, 2011
jn.physiology.orgD
ownloaded from

Callaway EM, Katz LC. Photostimulation using caged glutamate revealsfunctional circuitry in living brain slices. Proc Natl Acad Sci USA 90:7661–7665, 1993.
Dantzker JL, Callaway EM. Laminar sources of synaptic input to corticalinhibitory interneurons and pyramidal neurons. Nat Neurosci 3: 701–707, 2000.
Gilbert CD. Microcircuitry of the visual cortex. Annu Rev Neurosci 6:217–247, 1983.
Grinvald A, Hildesheim R. VSDI: a new era in functional imaging of corticaldynamics. Nat Rev 5: 874–885, 2004.
Huang X, Troy WC, Yang Q, Ma H, Laing CR, Schiff SJ, Wu JY. Spiralwaves in disinhibited mammalian neocortex. J Neurosci 24: 9897–9902,2004.
Jin W, Zhang RJ, Wu JY. Voltage-sensitive dye imaging of populationneuronal activity in cortical tissue. J Neurosci Methods 115: 13–27, 2002.
Konnerth A, Obaid AL, Salzberg BM. Optical recording of electrical activityfrom parallel fibres and other cell types in skate cerebellar slices in vitro.J Physiol 393: 681–702, 1987.
Kuhlman SJ, Huang ZJ. High-resolution labeling and functional manipula-tion of specific neuron types in mouse brain by Cre-activated viral geneexpression. PLoS ONE 3: e2005, 2008.
Luo L, Callaway EM, Svoboda K. Genetic dissection of neural circuits.Neuron 57: 634–660, 2008.
Nakagami Y, Saito H, Matsuki N. Optical recording of trisynaptic pathwayin rat hippocampal slices with a voltage-sensitive dye. Neuroscience 81:1–8, 1997.
Nikolenko V, Poskanzer KE, Yuste R. Two-photon photostimulation andimaging of neural circuits. Nat Methods 4: 943–950, 2007.
Petersen CC, Sakmann B. Functionally independent columns of rat somato-sensory barrel cortex revealed with voltage-sensitive dye imaging. J Neu-rosci 21: 8435–8446, 2001.
Schubert D, Kotter R, Zilles K, Luhmann HJ, Staiger JF. Cell type-specificcircuits of cortical layer IV spiny neurons. J Neurosci 23: 2961–2970, 2003.
Shepherd GM, Pologruto TA, Svoboda K. Circuit analysis of experience-dependent plasticity in the developing rat barrel cortex. Neuron 38:277–289, 2003.
Shepherd GM, Svoboda K. Laminar and columnar organization of ascendingexcitatory projections to layer 2/3 pyramidal neurons in rat barrel cortex.J Neurosci 25: 5670–5679, 2005.
Swanson LW, Wyss JM, Cowan WM. An autoradiographic study of theorganization of intrahippocampal association pathways in the rat. J CompNeurol 181: 681–715, 1978.
Weiler N, Wood L, Yu J, Solla SA, Shepherd GM. Top-down laminarorganization of the excitatory network in motor cortex. Nat Neurosci 11:360–366, 2008.
Xu X, Callaway EM. Laminar specificity of functional input to distinct typesof inhibitory cortical neurons. J Neurosci 29: 70–85, 2009.
Yuste R, Tank DW, Kleinfeld D. Functional study of the rat corticalmicrocircuitry with voltage-sensitive dye imaging of neocortical slices.Cereb Cortex 7: 546–558, 1997.
Innovative Methodology
2312 X. XU, N. D. OLIVAS, R. LEVI, T. IKRAR, AND Z. NENADIC
J Neurophysiol • VOL 103 • APRIL 2010 • www.jn.org
on August 26, 2011
jn.physiology.orgD
ownloaded from