high plains wind - weather plains wind (weather information news data) ... and one station every 36...
TRANSCRIPT

1 High Plains WIND
High Plains WIND
(Weather Information News Data)
August 1, 2007 Volume 1, Number 2
In This Issue Top Story.………………….1 Cooperative Observers........2 CoCoRaHS ……….……..………...6 News Stories………….…..….7-14
Contact Us National Weather Service 920 Armory Road Goodland, KS 67735 785-899-6412
http://www.weather.gov/gld
Chief Contributors:
Lawrence Boyd, OPL David Floyd, WCM Kelly James, Met Intern Scott Mentzer, MIC
See this tornado story on page 10
The Importance of Supplemental Data
By
Scott A. Mentzer, Meteorologist in Charge
Atmospheric and hydrologic data are the “life blood” of a meteorologist. As long as the data are accurate, the more data points a meteorologist has to analyze, the better. High resolution data presents a clear picture about what happened in the past, what is occurring now, and what may evolve in the future. One of the most frequent questions received by the National Weather Service (NWS) in Goodland is: “Where was the heaviest rain last night”. Fortunately, we can answer the question because various climatological networks have been established to provide high quality meteorological data. The NWS utilizes the following sources for precipitation data: 1) official meteorological observations from automated sensors known as ASOS (Automated Surface Observing System); 2) official precipitation reports from cooperative observers; 3) official rainfall reports from automated hydrological observing stations; 4) unofficial precipitation reports from the Community Collaborative Rain, Hail, and Snow Network (CoCoRaHS); 5) unofficial reports from the general public. continued on page 4
This newsletter is available at: http://www.crh.noaa.gov/images/gld/pdf/newsletter0807.pdf
2 High Plains WIND
.
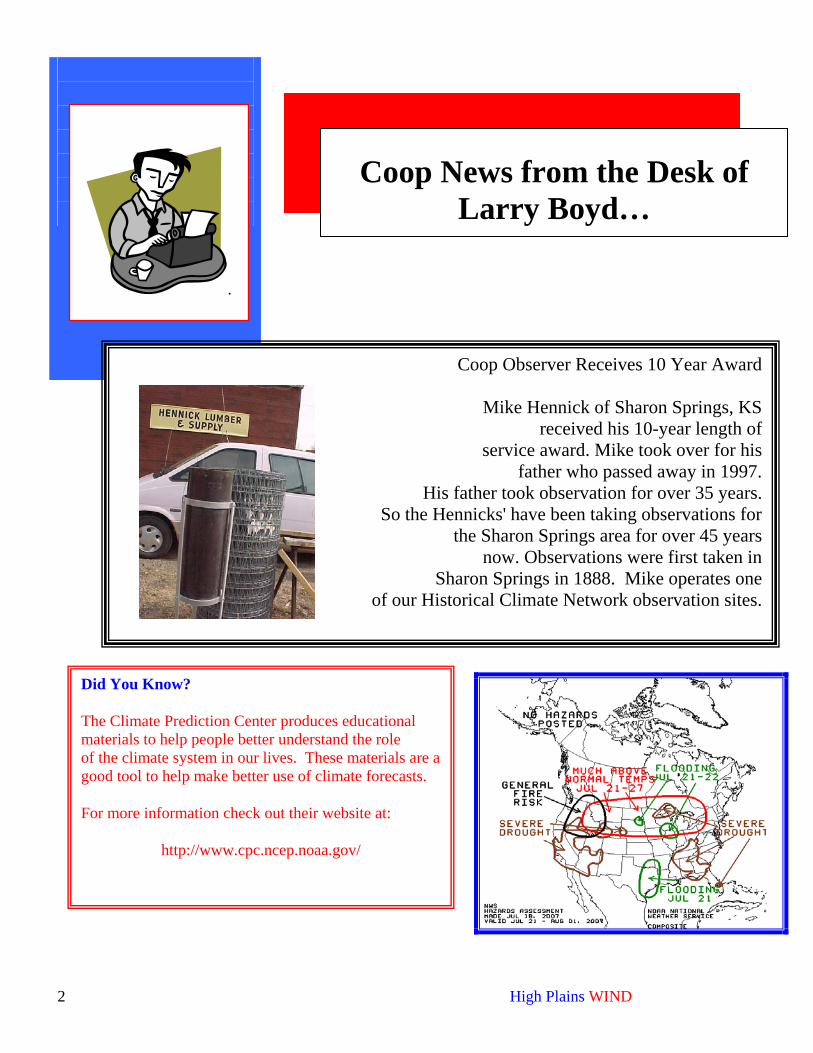
Coop Observer Receives 10 Year Award
Mike Hennick of Sharon Springs, KS received his 10-year length of
service award. Mike took over for his father who passed away in 1997.
His father took observation for over 35 years. So the Hennicks' have been taking observations for
the Sharon Springs area for over 45 years now. Observations were first taken in
Sharon Springs in 1888. Mike operates one of our Historical Climate Network observation sites.
Did You Know?
The Climate Prediction Center produces educational materials to help people better understand the role of the climate system in our lives. These materials are a good tool to help make better use of climate forecasts.
For more information check out their website at:
http://www.cpc.ncep.noaa.gov/
Coop News from the Desk of Larry Boyd…

You may have heard about a website called: www.surfacestations.org
A web site called “Surfacestations.org” is a site whose purpose is to photographically document all of the 1000+ Historical Climate Network (HCN) observation sites in the country and to highlight where the National Weather Service Cooperative Observer Program has issues with the location of the instrumentation. The web site is requesting that volunteers from the general public sign-up to visit and document each site. This web site is in no way associated with the NOAA/National Weather Service or our office.
Our office attempts to restrict all personal information about Co-op sites to protect the safety and privacy of our observers, but there are many ways of determining where Co-op observers are located (especially with free Internet mapping services).
Observers may either allow or restrict these people from coming on their property. You do not have to allow representatives of this organization access to your property or your observing equipment. Observers may require these individuals call and make an appointment, if they want to see the site and take photos, but you have no obligation to do so.
Observers should consider getting pertinent information from the visitor (name, address, phone number, etc.). Observers can also request that surfacestations.org remove any information/photos they are not comfortable with having on the web (after allowing the site to be photographed and surveyed).
In the future, as we do our routine visits, we will assess whether the observation equipment is properly located at observer sites and document any issues, so we can fix potential problems. Two significant initiatives will be coming soon in the Co-Op program. The first, entitled COOP21 plans to evaluate poorly performing sites. The second, called HCN Modernization (HCN-M) plan, calls for the installation of 1000 automated Co-Op stations at existing sites. Local staff from our office will implement these changes.
Attention Observers at Historical Observation Sites!
Questions? We’re as close as your
email. Please write to us at: [email protected]
or call us at 785-899-6412
3 High Plains WIND

Continued from page 1
The following maps show how important supplemental data sources are to construct an accurate picture of rainfall amounts. On June 12, 2007, scattered thunderstorms moved across the Tri-State area. Precipitation reports were gathered from the various networks the following morning. Figure 1 shows a precipitation map using only the ASOS data.
4 High Plains WIND
Figure 2 depicts the same rainfall event, but this figure utilizes both ASOS and cooperative observer data information. Note how the additional data show a maximum of precipitation area over Yuma, Dundy, and Cheyenne (KS) counties. This was completely missed using only the ASOS data. Further, another area of enhanced rainfall across Norton and Decatur counties is depicted using the cooperative data.
Figure 1
Figure 2

Finally, Figure 3 shows the same rainfall event using all the official and supplemental rainfall networks. Note how the maximum rainfall area shifts over the Saint Francis area in Cheyenne (KS) County. The secondary area over Norton and Decatur counties also becomes better defined.
5 High Plains WIND
Figure 3
This precipitation event looked benign from Figure 1. However, once all the other data sources were examined, a significant rainfall event occurred from Yuma, Colorado, to Lenora, Kansas. The additional reports added valuable information to the meteorologist who considered issuing a flash flood watch for thunderstorms forecast later in the day. This also shows how important it is for NWS offices to receive rainfall data each day. If you are an observer, please consider sending the data each day if you are not doing it already. Even reports of “no rain” are valuable.

CoCoRaHS
6 High Plains WIND
Location of Active CoCoRaHS and NeRAIN Observers.
Have you ever wondered where your fellow CoCoRaHS observers are located? Well, as you can see from the graphic, northwest Kansas and far eastern Colorado have a good rain gauge network. Nebraska’s NeRAIN (Nebraska Rainfall Assessment and Information Network) also has a good following in southwest Nebraska. Since CoCoRaHS was founded in Colorado in 1998,

far eastern Colorado has obtained over 50 observers. The Kansas division of CoCoRaHS was founded in 2005 and now northwest Kansas has over 90 observers. Nebraska’s NeRAIN was founded in 2004 and now holds over 30 observers in southwest Nebraska. In an effort to collect high quality precipitation data CoCoRaHS has set a goal of one or more stations per square mile in highly populated areas, and one station every 36 square miles or at every township in rural areas. We have yet to meet this goal but have quite an impressive start. Every month we have new volunteers signing up and current volunteers passing on the news about CoCoRaHS. While some stations have received virtually no rain, others have received their fair share this summer. Some noteworthy precipitation reports for the past two months: On May 15, the station located 12 miles SSW of Oakley reported 3.55 inches of rain. On June 13, the station located 11.1 miles SSE of Gove City reported 2.94 inches of rain and on the following day the station located 15.9 miles N of Wray, Colorado reported 2.80 inches of rain. I would like to thank all of the local observers for their hail and rainfall reports over the past few months and please keep them coming!
7 High Plains WIND
Kelly James CoCoRaHS Focal Point
For more information on CoCoRaHS visit: http://www.cocorahs.org/ For more information on NeRAIN visit: http://dnrdata.dnr.ne.gov/NeRAIN/index.asp
Lem Marsh, an observer for our office, took the photo shown at the right at Cedar Bluffs Reservoir. We enjoy seeing pictures of all kinds of weather in our county warning area. If you have a digital picture you would like to share with us and our readers, please send it to our webmaster at [email protected]. We’ll look forward to hearing from you!

8 High Plains WIND
Spotters – We appreciate you!
I want to thank all of you who volunteered your time to attend a storm spotter class this spring. Each year we train new spotters, and many others return for refresher training. Personally, I think it is a good idea to attend a spotter class every year, or at a minimum every other year. A good analogy is taking CPR classes. I have taken these classes for years, and while much of the basic information is the same, after each class I am glad I took time to revisit the procedures. Let’s face it, unused skills tend to atrophy with the passage of months.

The National Weather Service (NWS)
9 High Plains
WIND
We currently have over 1000 spotters serving in our 19 counties. Many cannot report information at certain times due to other commitments. That is fine. Don’t feel that just because you missed some severe weather events in the area that you can’t be of service to us in the future. Maybe the next weather event will be the one where you pass along a vital report to us!
We keep spotters on our records for three years. In other words, we keep a spreadsheet with a three-year running window of volunteers. In 2008, we will drop those who have not attended a class since 2006. The map above shows the locations of our storm spotters. In some cases, one dot represents many spotters, such as in larger towns.
We’ve had a busy severe weather year. See my article on page 10 in this issue discussing the record number of Tri-State area tornadoes in 2007. David Floyd Warning Coordination Meteorologist
The staff will host a 12-week weather class in the fall semester at Colby Community College. The class will be held Thursday evenings from 5:00 pm to 7:30 pm MDT (6:00 pm to 8:30 pm CDT). Classes will begin August 30 and end November 15.
Weather on the Internet Pressure, Temperature, Moisture Airmasses, Fronts, Jetstreams Clouds, Weather Instruments Setting up a Backyard Weather Station Large-scale weather systems Precipitation Weather Radar Imagery Weather Satellite Imagery Severe Weather and Tornado Formation Climatology and Long-Range Forecasting National Weather Service Office Tour
A weather briefing will be given each week at the beginning of class using information from the Internet. This will be followed by a short discussion period before the weekly topic is presented.
For more information email Dave at: [email protected].

2007 IS A RECORD-BREAKER FOR NUMBER OF TORNADOES IN THE TRI-STATE AREA
The office in Goodland has logged 54 tornadoes in its 19 county warning area since January 1st. This number far exceeds the previous calendar year record of 42 tornadoes, which occurred in 1994. In an average year, about 12 tornadoes occur in the area. The Goodland office serves 13 counties in northwest Kansas, three in eastern Colorado and three in southwest Nebraska. Although tornado records date back to the late 1800s, more reliable records start in 1950 when a nationwide effort to keep accurate tornado statistics began. Here is a list of 2007 tornado dates and the number of tornadoes occurring each day. Mar 24 .... 1 Mar 28 ... 16 Apr 21 .... 1 Apr 23 .... 8 Apr 24 .... 9 May 14 .... 1 May 22 .... 5 May 29 .... 2 Jun 19 .... 1 Jul 3 .... 10 Thankfully, no fatalities or injuries have occurred even though a record number of tornadoes have been reported. It is also noteworthy that severe thunderstorms occurring on March 28, 2007 resulted in 16 tornadoes, which is the most ever recorded in a single day in the Tri-State area and the most occurring in the month of March. In addition, 2007 now claims four of the top nine dates for number of tornadoes. Here is a list of the area top tornado producing dates from 1950 to 2007, and the number of tornadoes which occurred.. Mar 28 2007 .... 16 Oct 31 2000 .... 13 Jul 3 2007 ..... 10 Jun 1 2003 ..... 10 Apr 24 2007 ..... 9 Jun 12 1983 ..... 9 Jul 9 1993 ...... 9 Apr 23 2007 ..... 8 Jun 7 1992 ...... 8 The enhanced Fujita /EF/ scale ranks tornadoes based on the damage produced with EF5 being the strongest and EF0 being the weakest. The list below is a breakdown of tornado ratings for the Tri-State area in 2007. One reason for the large number of EF0 tornadoes is that our area has a vast amount of open farmland and pastureland and a very low density of homes and farmsteads. Tornadoes that do not produce damage are given a rating of EF0.
10 High Plains WIND

Rating # of Tornadoes Comments EF2 1 Bird City tornado on March 28 EF1 9 3 on March 28 - 4 on April 23 - 2 on other dates EF0 44 Nationally the preliminary 2007 tornado count stands at over 1000. However, this number is subject to change as damage surveys are completed and final reports are issued. Unfortunately, there have been 73 tornado fatalities so far in 2007, which exceeds the 10-year average of 62. Please see our website at www.weather.gov/gld for more detailed information.
11 High Plains WIND
Weather myths – truth or fiction? Check out this website and take a short quiz to see if you know what is true and what is not! The facts could save your life! http://www.srh.noaa.gov/fwd/media/severe/s_safetyf.htm

12 High Plains WIND
Larry Boyd Retires in October
Larry is pictured on the right presenting a Cooperative Observer Award to Lee Arnold
Larry 1971
After 36 years of federal service, Larry Boyd, Observation Program Leader (OPL) at our office, has made the decision to retire in October. In June of 1971 Larry was elected to a council position by the city of Independence, Missouri in its first City Council election. In July of that same year, the draft lottery instantly chose a different path for him. As number 8 in the draft lottery, he immediately went down to the Air Force recruiter, took a test and chose the Air Weather Service. In September of that year, he officially began his career with the Weather Service. After a quick boot camp in Lackland AFB in San Antonio, Texas and air weather school in Rantoul, Illinois. His first and only tour of duty in the USAF was near his own hometown. This tour of duty at Richards-Gebaur AFB in Grandview, Missouri lasted for 3 1/2 years. He received his honorable discharge in May of 1974.
Larry in 1976
Barter Island, Alaska
In less than a month, he was hired by what was then called the United States Weather Bureau in Memphis, Tennessee as a Forecaster Aide. After three years there, from 1974-77, he transferred to a remote island off the northern coast of Alaska called Barter Island. He was trained there to be an Upper Air Specialist. He only spent a year and half there before transferring to the office in Centreville-Brent, Alabama where he was trained to be an Upper Air and Radar Specialist. In 1995 he transferred back to Memphis, Tennessee and worked there as a Weather Service Specialist for seven years. In 2002 he transferred to Goodland, Kansas where he advanced to his current position. In October of this year, 2007, he and his wife Mona plan to move back to Missouri and settle there near family and friends in the area.
Larry releasing a
weather balloon
Congratulations, Larry!

13 High Plains WIND
A visitor to Goodland asks, “How do I get to the National Weather Service office?” Invariably, the answer is, “Go to the airport and look for the big soccer ball on a tower.” The “soccer ball” has also been called a volley ball or a golf ball sitting on a tee. However, the technical name for the structure is a radome, a weatherproof enclosure that protects an antenna. The radome at the NWS office protects the 28-foot Doppler weather radar antenna from rain, snow, hail, and particulates.
Figure 1: Radome at WFO Goodland
The fiberglass construction of the radome allows the radar signal to be transmitted and received with little attenuation. Sturdier construction material, like brick, would seriously weaken the radar signal rendering it useless. A quick inspection of the radome will reveal that it is assembled in pieces. There is no “mysterious scientific secret” on why the pieces are shaped the way they are. Studies have determined that the joints used to connect the fiberglass pieces affect the scattering of energy from the radar antenna. Arranging the joints in a random pattern is preferred to keep scattering of energy more uniform. The smaller pieces are also much more practical to ship to locations around the world than larger spherical shapes would be. Finally, the engineers who designed the radome created a process that cuts the fiberglass into shapes that minimizes waste of material. Figure 2 - Back of radar antenna inside the radome
Figure 3 - Radome Construction (Note the shapes in the fiberglass) So, the next time you’re in Goodland and want to visit the National Weather Service office, just go to the airport and look for the soccer ball – oops, I mean, look for the radome.
ff
fooorrr ttthhheee SSSooocccccceeerrr BBBaaallllll

2007 Precipitation Observing Site Jan Feb Mar Apr May Jun
Observed 0.59 0.11 0.67 1.56 2.72 1.55 Normal 0.36 0.32 0.96 1.60 3.11 2.53 Yuma, CO
Departure 0.23 -0.21 -0.29 -0.04 -0.39 -0.98 Observed 0.54 0.45 0.10 4.69 1.01 1.37
Normal 0.36 0.47 0.94 1.71 3.07 2.35 Stratton, CO
Departure 0.18 -0.02 -0.84 2.98 -2.06 -0.98 Observed 0.61 0.29 2.30 2.59 0.85 4.60
Normal 0.59 0.52 1.41 1.87 3.21 2.90 Benkelman, NE
Departure 0.02 -0.23 0.89 0.72 -2.36 1.70 Observed 0.25 0.14 1.58 6.08 2.53 1.18
Normal 0.50 0.64 1.41 2.22 3.26 3.22 McCook, NE
Departure -0.25 -0.50 0.17 3.86 -0.73 -2.04 Observed 0.54 0.44 2.23 2.44 0.81 0.98
Normal 0.43 0.44 1.20 1.51 3.46 3.30 Goodland, KS
Departure 0.11 0.00 1.03 0.93 -2.65 -2.32 Observed 0.64 0.45 2.44 5.72 1.95 3.32
Normal 0.39 0.48 1.32 1.46 2.91 2.56 Leoti, KS
Departure 0.25 -0.03 1.12 4.26 -0.96 0.76 Observed 0.81 0.20 1.57 2.60 2.11 1.59
Normal 0.52 0.58 1.55 2.10 3.66 2.59 Hoxie, KS
Departure 0.29 -0.38 0.02 0.50 -1.55 -1.00
The table above shows precipitation totals for the period January through June 2007 for selected reporting sites in the Tri-State area. Precipitation totals are highly variable. In general, April brought above normal rainfall to the region, but May and June have fallen short of normal rainfall amounts at many locations. The upper air pattern over the central High Plains in May and June was characterized by a large ridge of high pressure in the upper levels of the atmosphere. This resulted in fewer than average weather systems affecting the area, which ultimately translated to warmer and drier than normal conditions.
Pictured at left is our staff in front of the office. The picture was taken in June after a barbeque. Harvest was in full swing in the area and the staff took the opportunity to check out a tractor from Yost Farm Supply while celebrating NOAA’s 200th birthday
14 High Plains WIND