high performance business study 2015 h1
TRANSCRIPT

High Performance Business StudyAEX companies outperform their industry peers for the first time since 2009
2015 H1 Report

About the studyAccenture Strategy’s High Performance Business Study aims at understanding which companies are top performers within their industry and what sets them apart from their competition.
Twice a year, Accenture Strategy examines the performance of almost 2000 companies listed on stock exchanges all over the world. Most of these companies are large multinationals.
The High Performance Business (HPB) Study identifies which companies are top performers within their industry and what distinguishes them from their international peers.
High Performance Business is about...
• Sustained out-performance of peers
• Increased ability to overcome economic and/or business shocks
• Continuity across generations of leadership
• Creation of long-term value
The High Performance Business Study is based on...
• Relative performance compared to global industry peers
• 10 Years of Accenture research on almost 2,000 global companies in 61 industries
• In-depth analyses on AEX performance based on 10 performance metrics
The High Performance Business Study helps companies...
• Benchmark themselves against global industry peers
• Detect opportunities to improve the performance of operations compared to those of international peers
• Strive for sustained growth in performance
2

3

4

2015 H1 Key findings
During the first half of 2015, AEX companies strongly improved their current performance. Consequently, for the first time since 2009 AEX companies scored higher than the average of their industry competitors.. However, AEX companies did lose some ground on their future performance when compared to their peers.
The higher score on current performance for AEX companies is mainly driven by the improvement in shareholder value creation and higher revenues. The rally on the European stock markets during the first half of 2015 is an important driving force for the score on shareholder performance. In line with this, we see an improved score reoccurring for other European indices like France, Germany and Italy.
Furthermore, AEX companies saw an average revenue increase of 10 percent, whereas the international competitors remained stagnant at a 2 percent growth in revenues. This large increase in revenues seems to be connected to the depreciation of the Euro in comparison to other
currencies like the Dollar and British Pound, due to the broad monetary policy of the European Central Bank.
Contrastingly, the expectations for future performance of AEX companies saw a downfall in 2015. The contradiction between the current and future performance of AEX companies raises the question on how sustainable the current high score actually is. The challenge for the next year is therefore to retain the high scores they are currently experiencing.
Finally, a clear dichotomy between AEX companies has emerged over the course of 2015. On one side of the spectrum, there is a group of companies performing very well compared to their industry peers on both current and future performance. Opposing these companies, is a group of AEX companies scoring far below average on both axes. This means that the middle group, which entailed a considerable part of the AEX companies in 2014, is clearly thinning in size.
5

The overall performance in Europe has improved over the past year, whereas other stock markets are stabilizing.
Organisations in Europe have improved their performance during the last year, compared to their international peers. Part of this improvement is driven by the positive currency effects that Europe has experienced, due to a depreciation of the Euro to other currencies like the US Dollar.
Results
6
In this graph, the average total score of companies listed in the mentioned indices is reported. Scores higher than 50% indicate a performance above peer average, scores lower than 50% indicate a performance below peer average.
Interpretation
TOTAL HPB SCORE PER STOCK MARKET
2009 2010 2011 2012 2013 2014 2015_H1
China
RestUKFranceNLGermanyJapan
Top
25%
Abov
e av
erag
eBe
low
av
erag
eBo
ttom
25
%
US

7

AEX companies score above average on their current performance for the first time in years, but continue their downward trend in positioning for the future.
The improvement in current performance is mainly driven by the increase in shareholder performance and revenue growth. However, AEX organisations continue to lose ground to their international peers on their future positioning, which raises the question of how this current positive trend can be continued for years to come.
Results
8
TOTAL HIGH PERFORMANCE OF AEX COMPANIES
This graph displays the average score of AEX companies on the two main components of the HPB analysis: Current performance and positioning for the future. Scores higher than 50 indicate a performance above peer average, scores lower than 50 indicate a performance below peer average.
Interpretation
Top
25%
Abov
e av
erag
eBe
low
av
erag
eBo
ttom
25
%
2009 2010 2011 2012 2013 2014 2015_H1
Current performance Positioning for the future
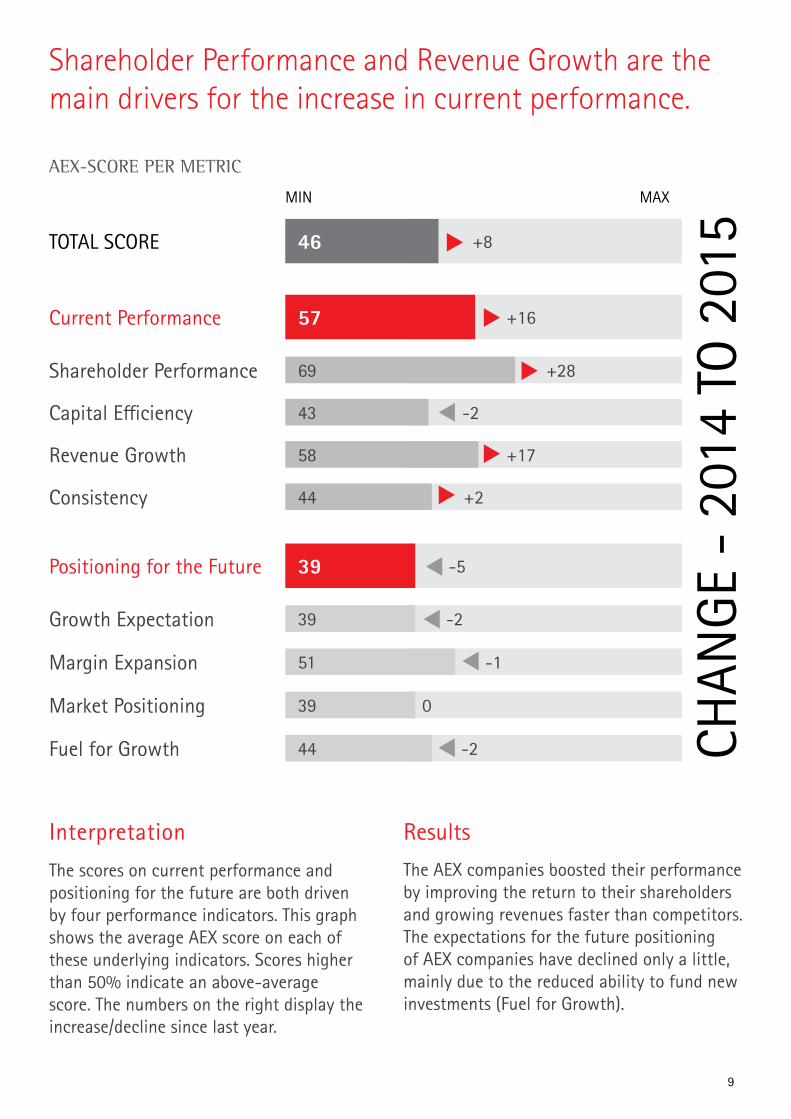
Shareholder Performance and Revenue Growth are the main drivers for the increase in current performance.
The AEX companies boosted their performance by improving the return to their shareholders and growing revenues faster than competitors.The expectations for the future positioning of AEX companies have declined only a little, mainly due to the reduced ability to fund new investments (Fuel for Growth).
Results
9
TOTAL SCORE
Current Performance
Shareholder Performance
+846
57
69
43
58
44
39
39
51
39
44
+16
+28
-2
+17
+2
-5
-2
-2
-1
0
Capital Efficiency
Revenue Growth
Consistency
Positioning for the Future
Growth Expectation
Margin Expansion
Market Positioning
Fuel for Growth
AEX-SCORE PER METRIC
MIN MAX
CHAN
GE -
201
4 TO
201
5
The scores on current performance and positioning for the future are both driven by four performance indicators. This graph shows the average AEX score on each of these underlying indicators. Scores higher than 50% indicate an above-average score. The numbers on the right display the increase/decline since last year.
Interpretation

0
10
5
15
25
35
45
55
65
75
85
95
20
30
40
50
60
70
80
90
100
0 5 10 15 20 25 30 35 40 45 50 55 60 65 70 75 80 85 90 95 100
Over the course of the year, a division occurred between companies either scoring good or bad on both axes.
This two-dimensional graph shows how AEX companies and their peers score on the current performance and future positioning. Companies with a score higher than 75% on both current performance and positioning for the future are considered a ‘high performer’.
Most of the AEX companies improved their current performance, compared to last year. Therefore, multiple companies are currently positioned around the High Performance area. However, none of the AEX companies are actually positioned inside this specific area which would make them highly competitive compared to the industry peers.
Interpretation Results
10
Current performance
International competitors AEX companies
Positioning for the future
HIGH PERFORMER
ASML
Randstad
Fugro

11
North-America
South America
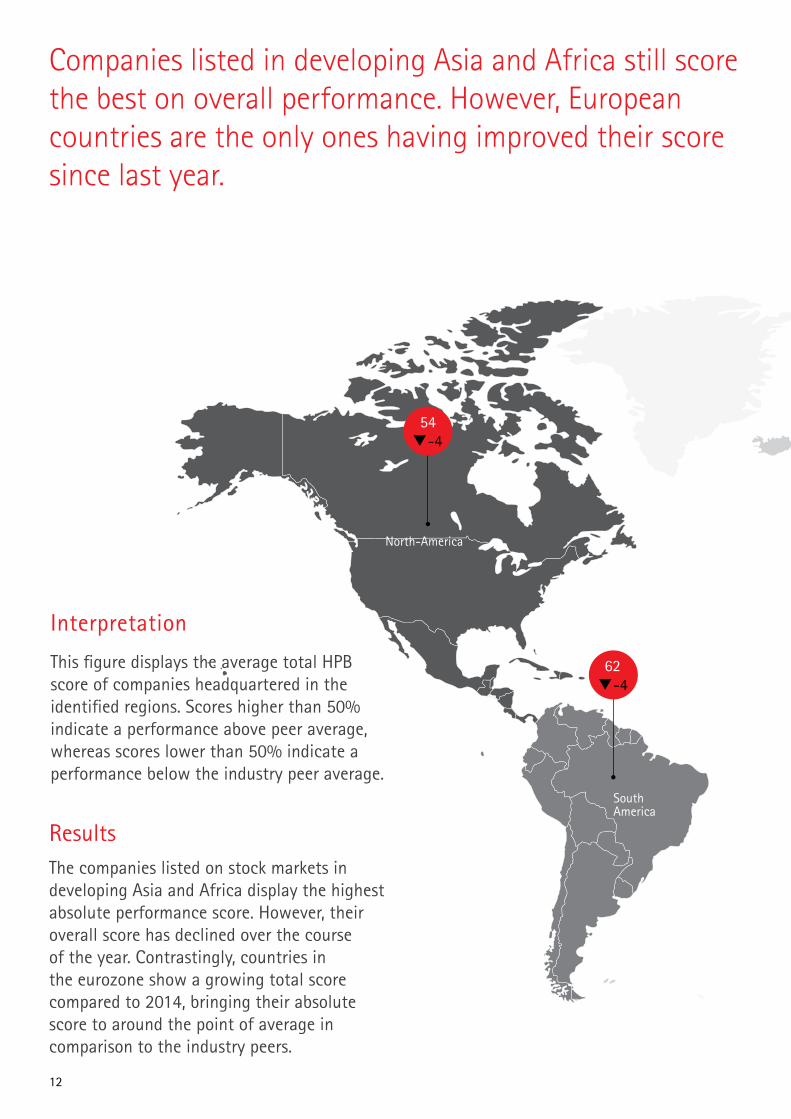
This figure displays the average total HPB score of companies headquartered in the identified regions. Scores higher than 50% indicate a performance above peer average, whereas scores lower than 50% indicate a performance below the industry peer average.
54-4
62-4
Companies listed in developing Asia and Africa still score the best on overall performance. However, European countries are the only ones having improved their score since last year.
The companies listed on stock markets in developing Asia and Africa display the highest absolute performance score. However, their overall score has declined over the course of the year. Contrastingly, countries in the eurozone show a growing total score compared to 2014, bringing their absolute score to around the point of average in comparison to the industry peers.
Interpretation
Results
12

Southern Europe
Eastern Europe
Russia
Overall HPB score
Change in HPB score 2014-2015
Developing Asia
Asia
Asian Tigers
Middle East
Africa
Nordics
50-16
477
453
61-12
51-5
36-4
53-2
55-6
69-9
Oceania
UK & Ireland
Western Europe
13
550
NetherlandsGermany
Italy
France
UK
43478
492
485
7
4711
42-8
40-8
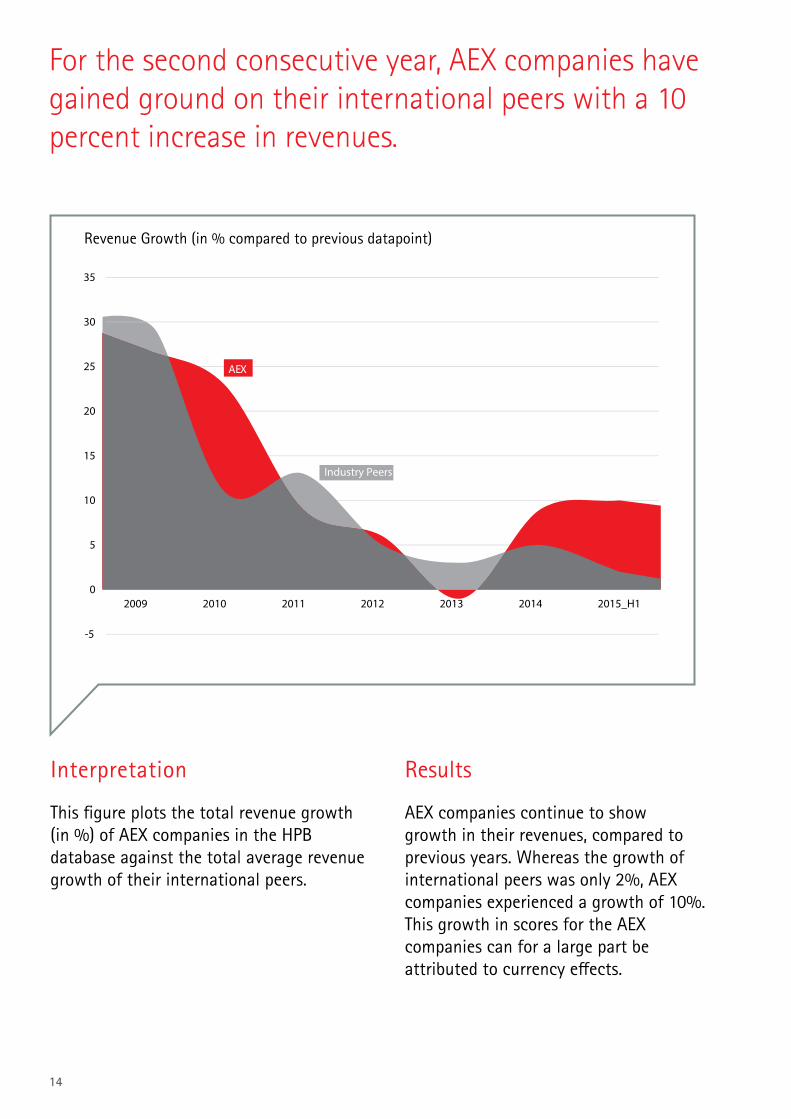
This figure plots the total revenue growth (in %) of AEX companies in the HPB database against the total average revenue growth of their international peers.
AEX companies continue to show growth in their revenues, compared to previous years. Whereas the growth of international peers was only 2%, AEX companies experienced a growth of 10%.This growth in scores for the AEX companies can for a large part be attributed to currency effects.
For the second consecutive year, AEX companies have gained ground on their international peers with a 10 percent increase in revenues.
Interpretation Results
14
-5
0
5
10
15
20
25
30
35
2009 2010 2011 2012 2013 2014 2015_H1
AEX
Industry Peers
Revenue Growth (in % compared to previous datapoint)
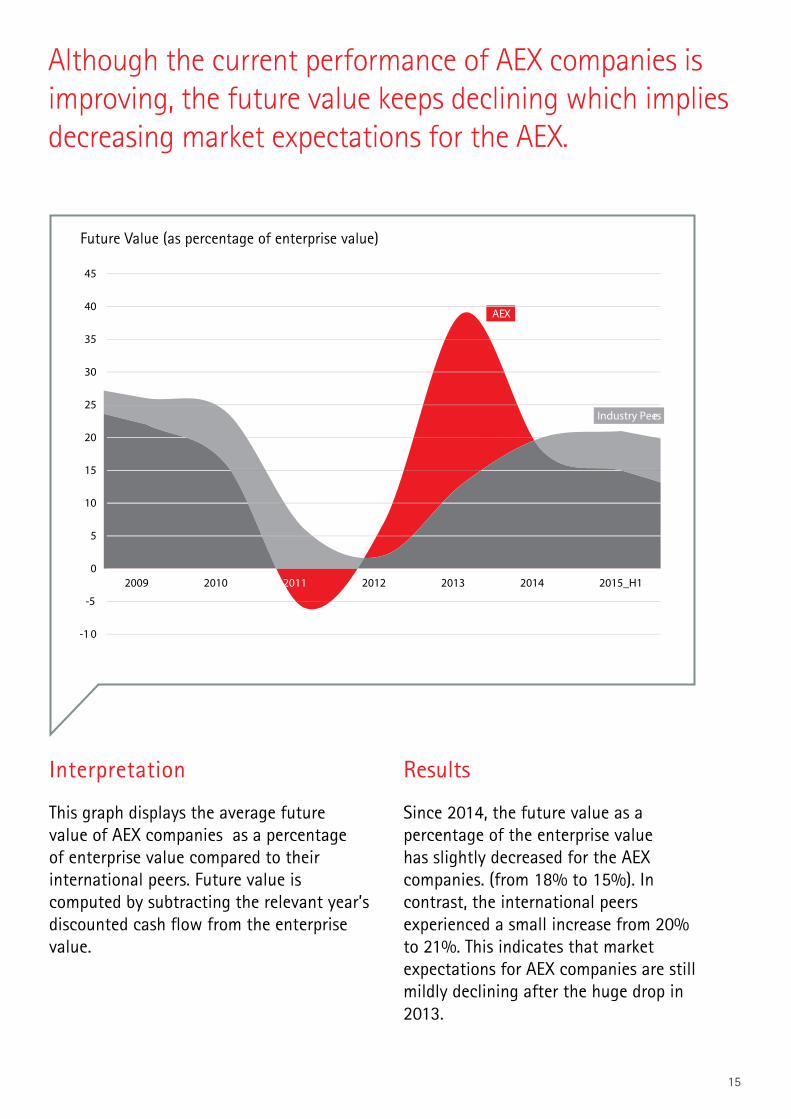
This graph displays the average future value of AEX companies as a percentage of enterprise value compared to their international peers. Future value is computed by subtracting the relevant year’s discounted cash flow from the enterprise value.
Since 2014, the future value as a percentage of the enterprise value has slightly decreased for the AEX companies. (from 18% to 15%). In contrast, the international peers experienced a small increase from 20% to 21%. This indicates that market expectations for AEX companies are still mildly declining after the huge drop in 2013.
Although the current performance of AEX companies is improving, the future value keeps declining which implies decreasing market expectations for the AEX.
Interpretation Results
15
AEX
Industry Peers
-1 0
-5
0
5
10
15
20
25
30
35
40
45
2009 2010 2011 2012 2013 2014 2015_H1
Future Value (as percentage of enterprise value)

Except for the Oil & Gas related industries, all industries display positive shareholder returns over the past year.
6
23
87
24
22
40
68
73
61
16
25
26
12
17
30
17
58
54
68
57
This graph highlights the average total shareholder return per industry. Total shareholder return is defined by the gain of loss on a stock plus the dividend paid out in that year.
The Airline and Metals & Mining industry display the highest return to their shareholders. In line with last year, the returns in the Oil and Gas and Oil Equipment Services industries are lowest. This seems to be related to the current drop in oil prices which put these two industries through tough times.
Interpretation Results
16
SHAREHOLDER RETURN
# of companies in industry peer set
30%
23%
16%
15%
13%
12%
11%
11%
10%
10%
9%
9%
9%
8%
8%
7%
5%
1%
-6%
-20%
Airlines
Metals and Mining
Personnel Services
Healthcare
Insurance
Media
Freight and Logistics
Banking
Chemicals
Pharmaceuticals
Food Products and HPC
Food Department Store
Alcoholic Beverages
Information Technology
Consumer Electronics
Semiconductor Equipement
Telecom
Dredging
Oil and Gas
Oil Equipment and Services

This graph plots the average revenue growth against the profitability of each industry. The profitability is measured by the EBITDA margin.
Companies that are active in the Pharmaceutical industry show the highest average score on both profitability and revenue growth. Contrastingly, the Oil and Gas industry scores especially low on the profitability measure.
In line with previous years, the pharmaceutical industry remains a high performer on both profitability and revenue growth.
Interpretation Results
17
AVERAGE REVENUE GROWTH VS PROFITABILITY PER INDUSTRY
0
5
10
15
20
25
30
35
-20 -15 -10 -5 0 5 10 15 20 25
Healthcare
Media
Banking
Oil and Gas
Dredging
Chemicals
Food Product and HPCs Airlines
Semiconductor Equipment
Metals and MiningConsumer Electronics
Food Derpartment Store
Freight & Logistics
Insurance
Personnel Services
Oil Equipment and Services
Telecom
Information Technology
Pharmaceuticals
Alcoholic Beverages
Profitability
Revenue Growth
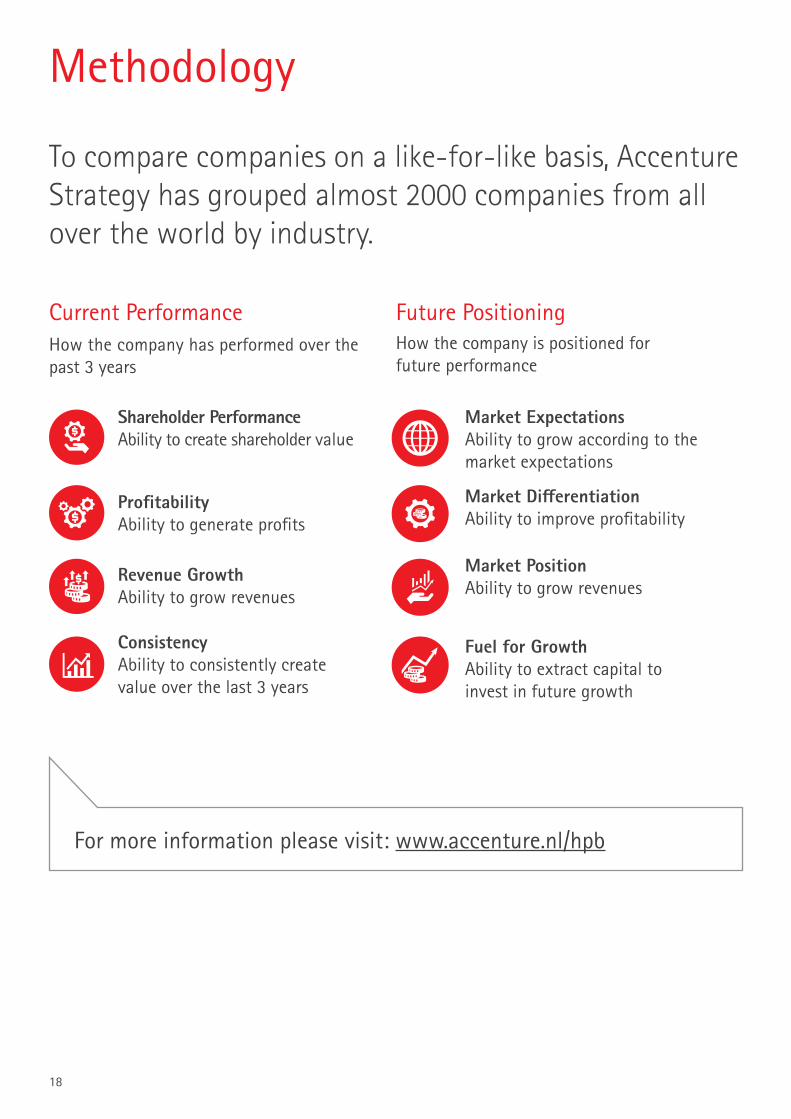
Methodology
Current PerformanceHow the company has performed over the past 3 years
Future PositioningHow the company is positioned for future performance
Shareholder Performance Ability to create shareholder value
Market ExpectationsAbility to grow according to the market expectations
Market DifferentiationAbility to improve profitability
Market PositionAbility to grow revenues
Fuel for GrowthAbility to extract capital to invest in future growth
ProfitabilityAbility to generate profits
Revenue GrowthAbility to grow revenues
ConsistencyAbility to consistently create value over the last 3 years
To compare companies on a like-for-like basis, Accenture Strategy has grouped almost 2000 companies from all over the world by industry.
For more information please visit: www.accenture.nl/hpb
18

19

Copyright © 2015 Accenture All rights reserved.
Accenture, its logo, and High Performance Delivered are trademarks of Accenture.
About Accenture
Accenture is a leading global professional services company, providing a broad range of services and solutions in strategy, consulting, digital, technology and operations. Combining unmatched experience and specialized skills across more than 40 industries and all business functions – underpinned by the world’s largest delivery network – Accenture works at the intersection of business and technology to help clients improve their performance and create sustainable value for their stakeholders. With more than 358,000 people serving clients in more than 120 countries, Accenture drives innovation to improve the way the world works and lives. Visit us at www.accenture.com.
Contact the Authors
Sander van Ginkel [email protected]
Peter Zuyderduyn [email protected]
Co-Authors
Paul van der Heijden [email protected]
Tim de Bie [email protected]
About Accenture Strategy
Accenture Strategy operates at the intersection of business and technology. We bring together our capabilities in business, technology, operations and function strategy to help our clients envision and execute industry-specific strategies that support enterprise wide transformation. Our focus on issues related to digital disruption, competitiveness, global operating models, talent and leadership help drive both efficiencies and growth. For more information, follow @AccentureStrat or visit www.accenture.com/strategy.