high frequency quoting: short-term volatility in bids and offers big data finance conference may 3,...
TRANSCRIPT
High Frequency Quoting:Short-Term Volatility
in Bids and Offers
Big Data Finance ConferenceMay 3, 2013
Joel HasbrouckStern School, NYU
1
Disclaimers
I teach in an entry-level training program at a large financial firm that is generally thought to engage in high frequency trading.
I serve on a CFTC advisory committee that discusses issues related to high frequency trading.
I accept honoraria for presentations at events sponsored by financial firms.
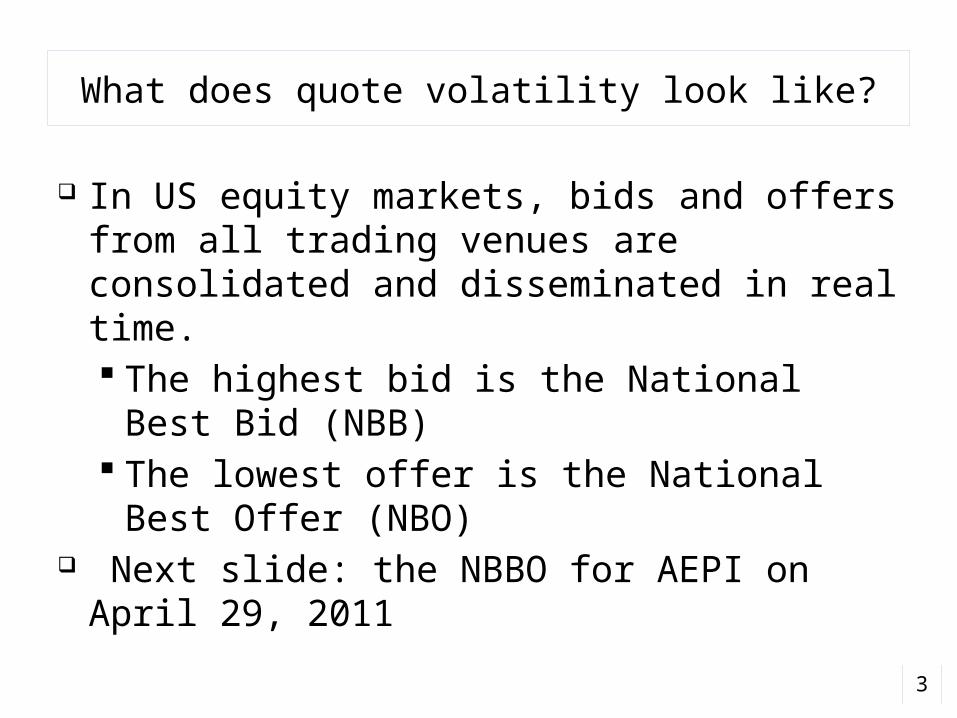
What does quote volatility look like?
In US equity markets, bids and offers from all trading venues are consolidated and disseminated in real time. The highest bid is the National Best Bid
(NBB) The lowest offer is the National Best Offer
(NBO) Next slide: the NBBO for AEPI on April 29,
20113
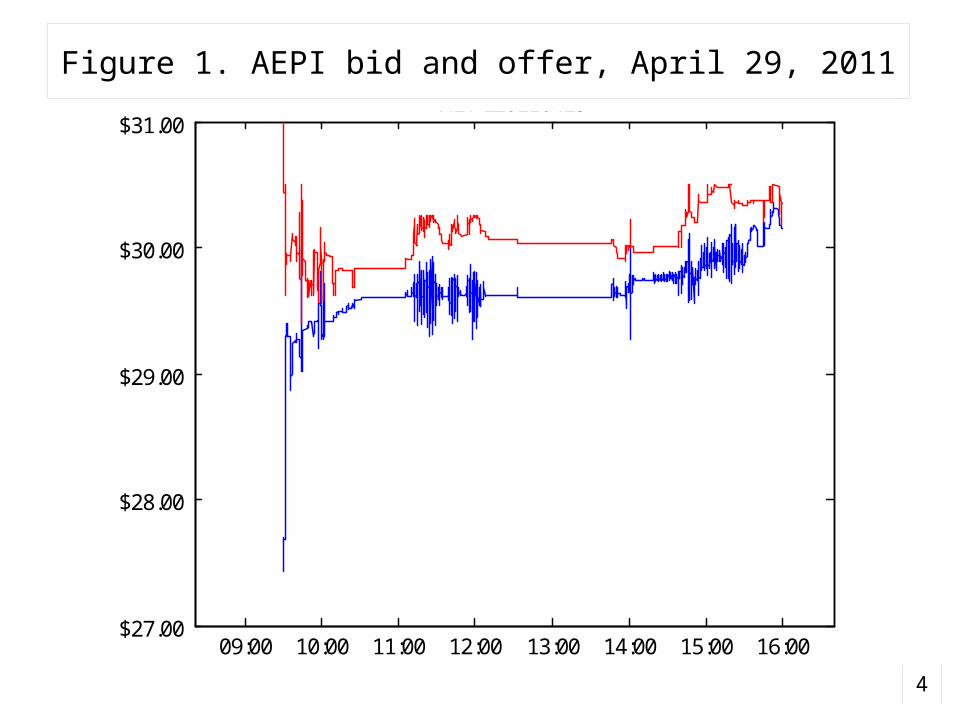
Figure 1. AEPI bid and offer, April 29, 2011
4
09:00 10:00 11:00 12:00 13:00 14:00 15:00 16:00$27.00
$28.00
$29.00
$30.00
$31.00 AEPI 20110429
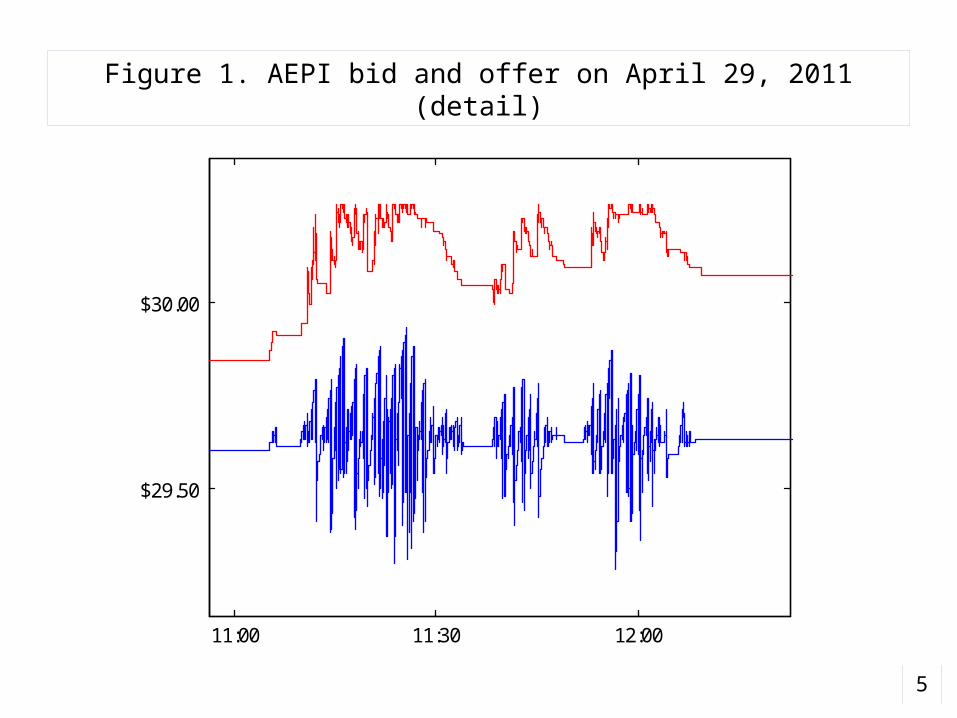
Figure 1. AEPI bid and offer on April 29, 2011 (detail)
5
11:00 11:30 12:00
$29.50
$30.00
AEPI 20110429
6
09:00 10:00 11:00 12:00 13:00 14:00 15:00 16:00
$9.00
$9.50
$10.00
$10.50
$11.00
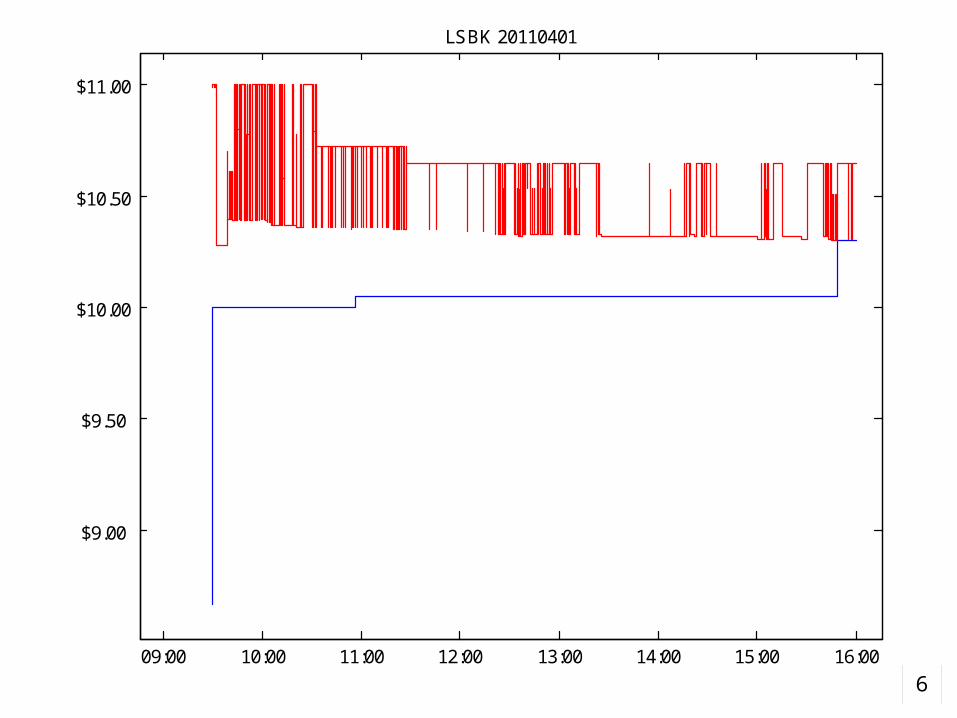
LSBK 20110401
7
09:45 09:50 09:55 10:00 10:05 10:10
$79.50
$80.00
$80.50
$81.00
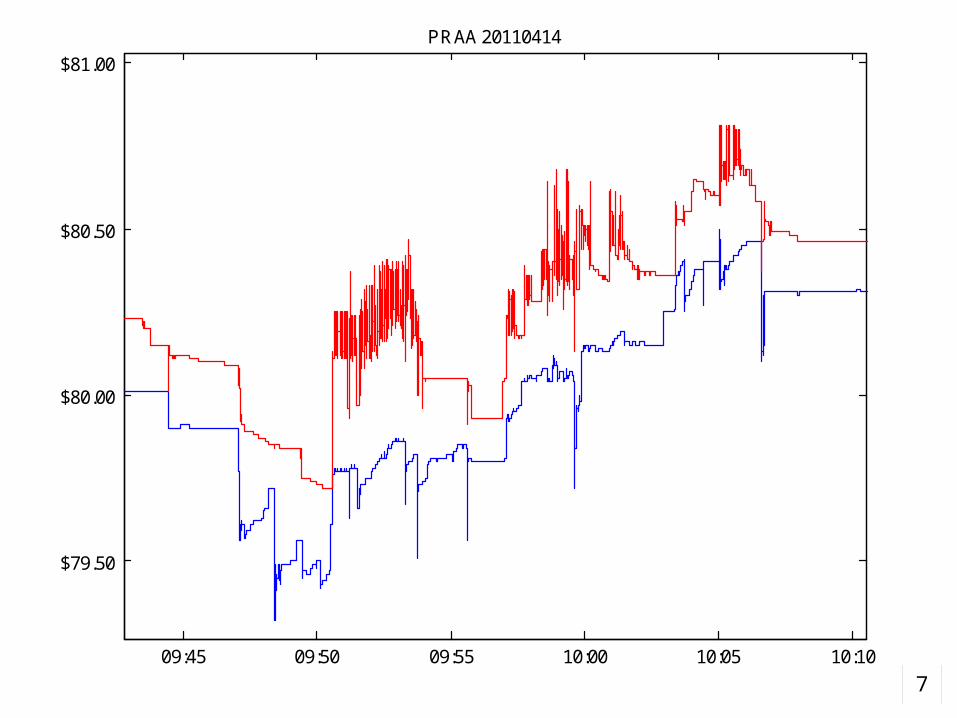
PRAA 20110414
8
13:20 13:30 13:40 13:50
$18.50
$19.00
$19.50
$20.00
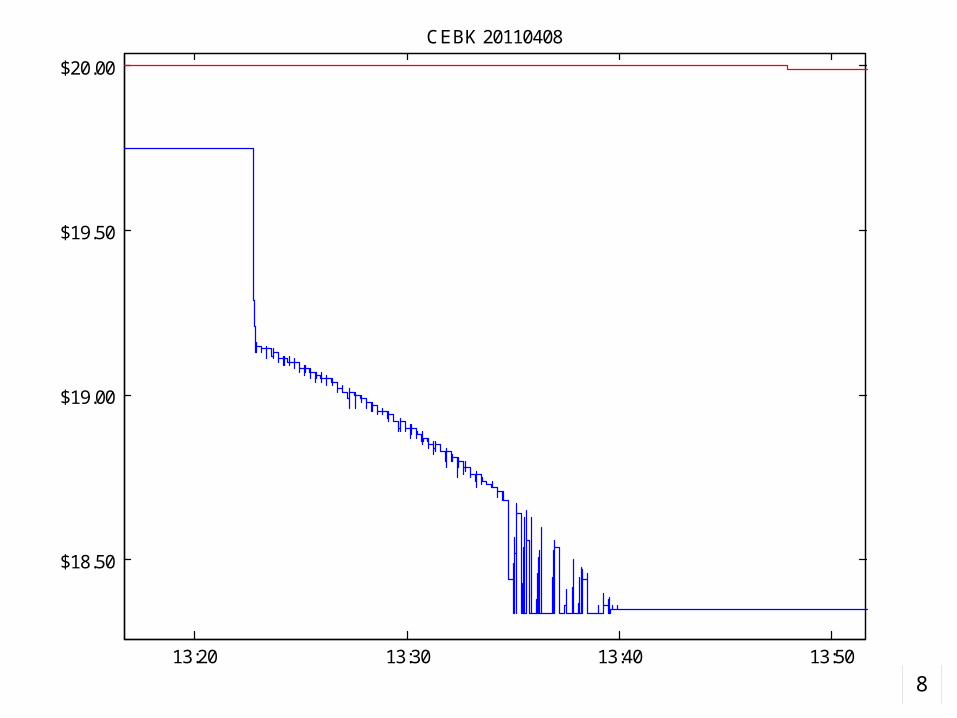
CEBK 20110408
9
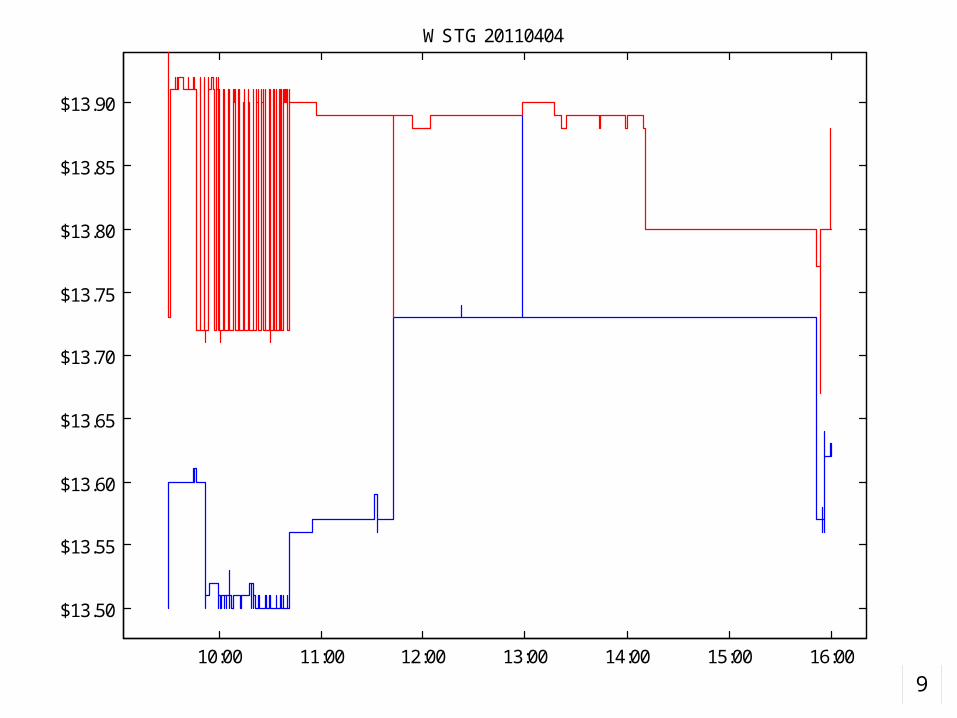
10:00 11:00 12:00 13:00 14:00 15:00 16:00
$13.50
$13.55
$13.60
$13.65
$13.70
$13.75
$13.80
$13.85
$13.90
WSTG 20110404

10
10:00 11:00 12:00 13:00 14:00 15:00 16:00
$1.94
$1.96
$1.98
$2.00
$2.02
$2.04
$2.06
AAME 20110418
11
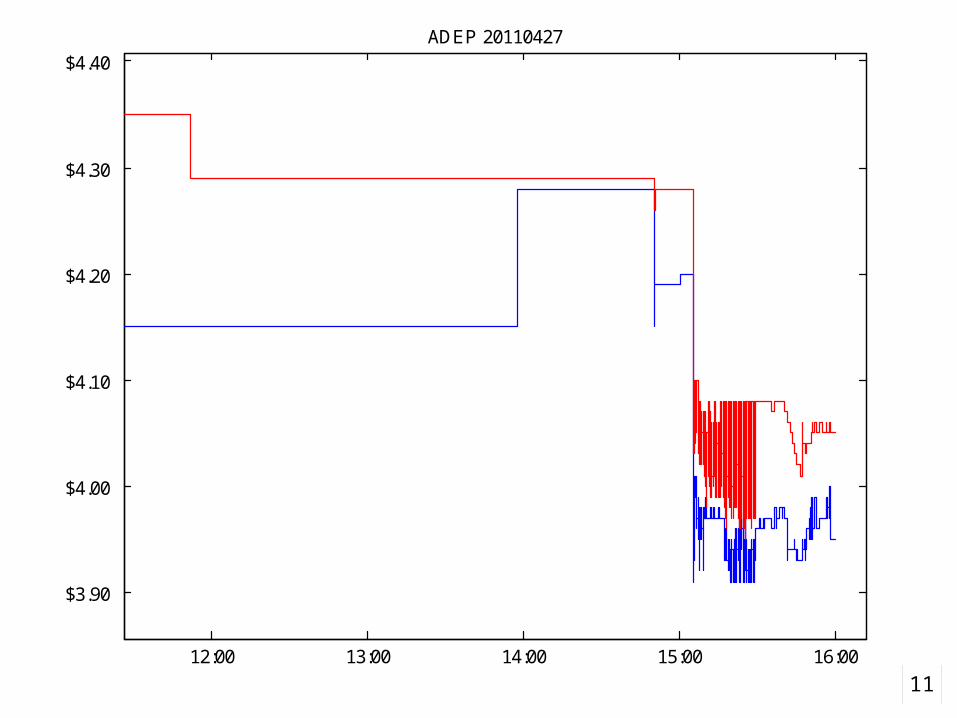
12:00 13:00 14:00 15:00 16:00
$3.90
$4.00
$4.10
$4.20
$4.30
$4.40
ADEP 20110427
Quote volatility: the questions
What is its economic meaning and importance?
How should we measure it? Is it elevated? Relative to what? Has it increased along with wider adoption
of high-speed trading technology?
12
Economic consequences of quote volatility
Noise due to flickering quotes Execution price risk
For marketable orders For dark trades
Intermediaries’ look-back options Quote-stuffing Spoofing
13
Descriptive statistics:computation and interpretation
14
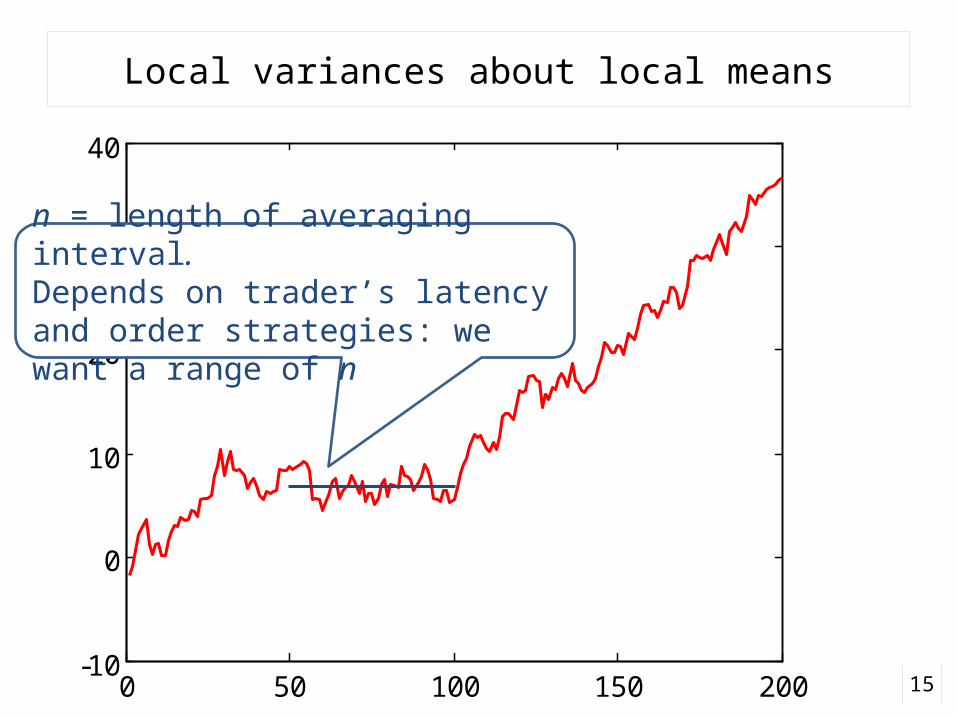
Local variances about local means
150 50 100 150 200-10
0
10
20
30
40
n = length of averaging interval. Depends on trader’s latency and order strategies: we want a range of n
Interpretation
To assess economic importance, I present the (wavelet and rough) variance estimates in three ways. In mils per share In basis points As a short-term/long-term ratio
16
Mils per share
Variances are computed on bid and offer price levels.
Reported volatilities are scaled to . One mil = $0.001
Most trading charges are assessed per share. Someone sending a marketable order to a US
exchange typically pays an “access fee” of about three mils/share.
An executed limit order receives a “liquidity rebate” of about two mils/share.
17
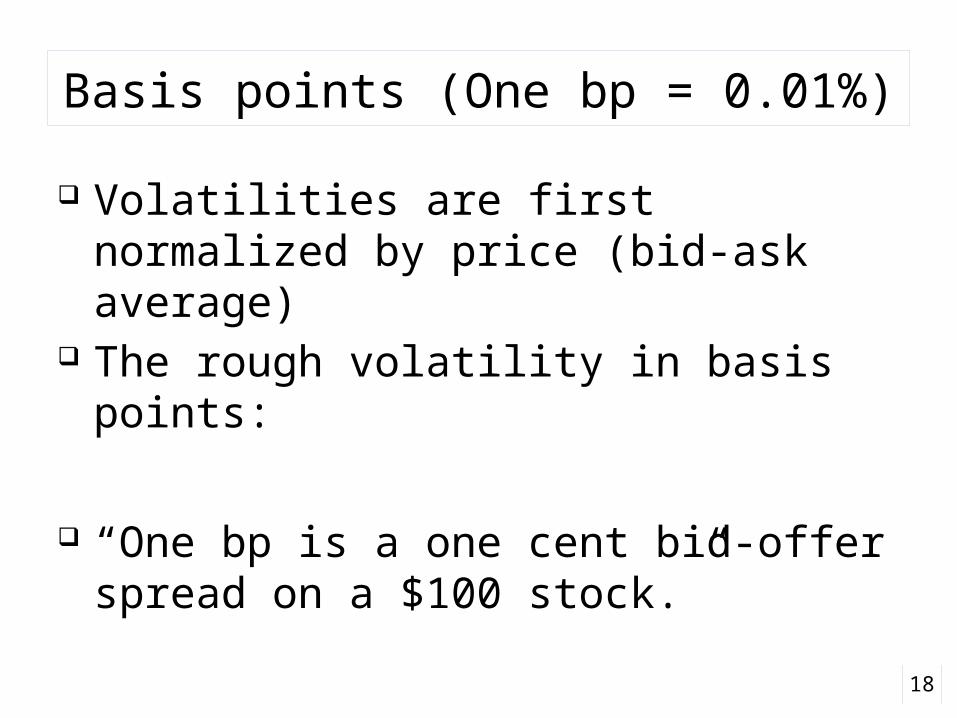
Basis points (One bp = 0.01%)
Volatilities are first normalized by price (bid-ask average)
The rough volatility in basis points:
“One bp is a one cent bid-offer spread on a $100 stock.”
18
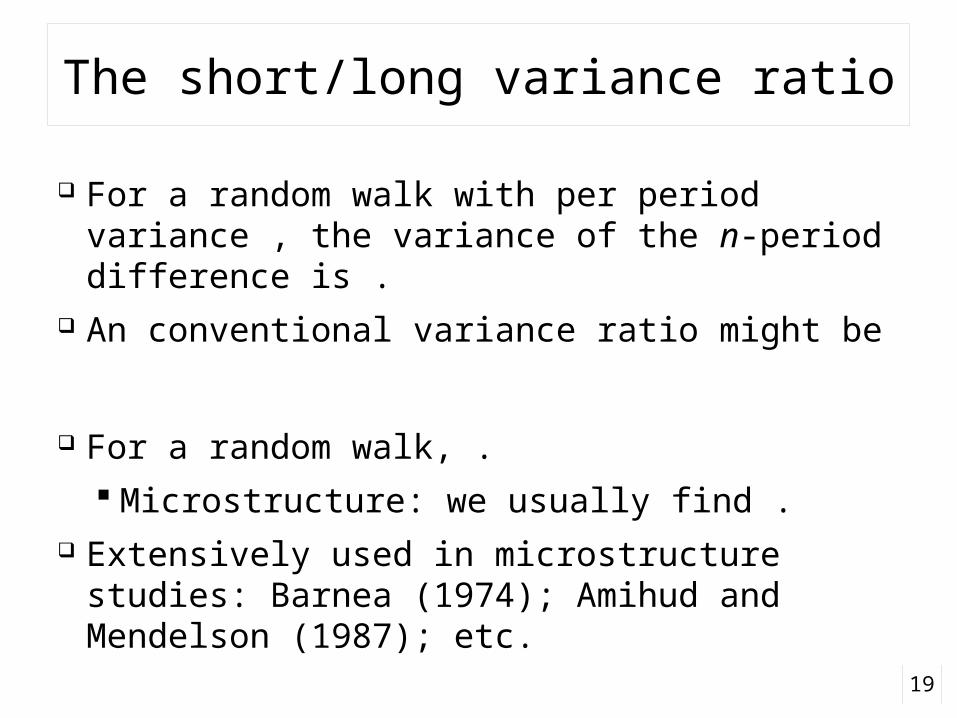
The short/long variance ratio
For a random walk with per period variance , the variance of the n-period difference is .
An conventional variance ratio might be
For a random walk, . Microstructure: we usually find .
Extensively used in microstructure studies: Barnea (1974); Amihud and Mendelson (1987); etc.
19
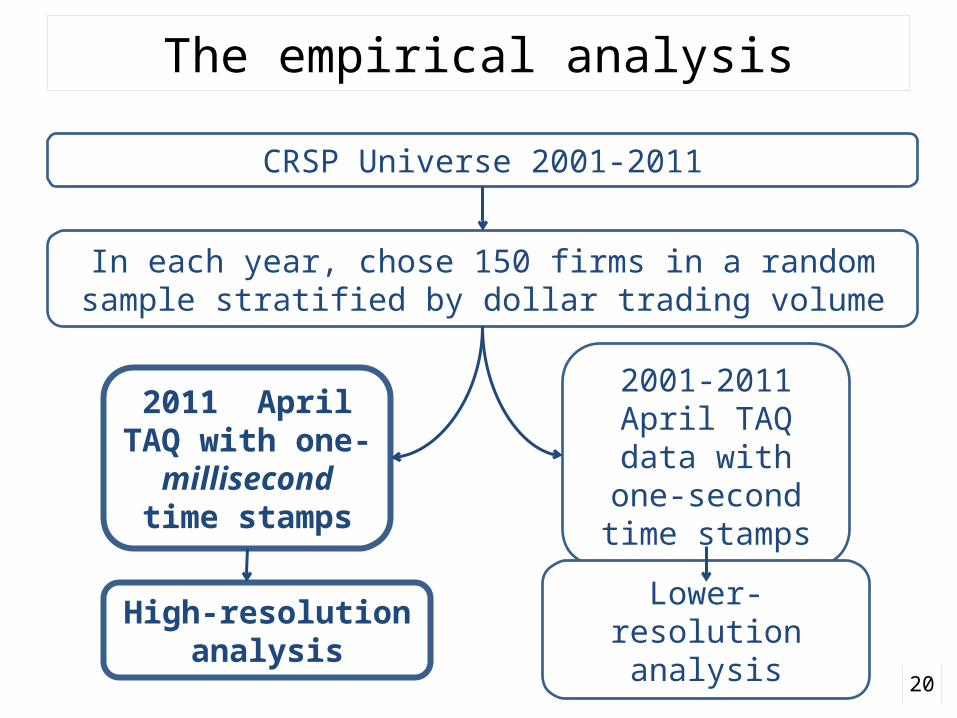
The empirical analysis
20
CRSP Universe 2001-2011
In each year, chose 150 firms in a random sample stratified by dollar trading volume
2001-2011April TAQ data
with one-second time stamps
2011 April TAQ with one-
millisecond time stamps
High-resolution analysis
Lower-resolution analysis
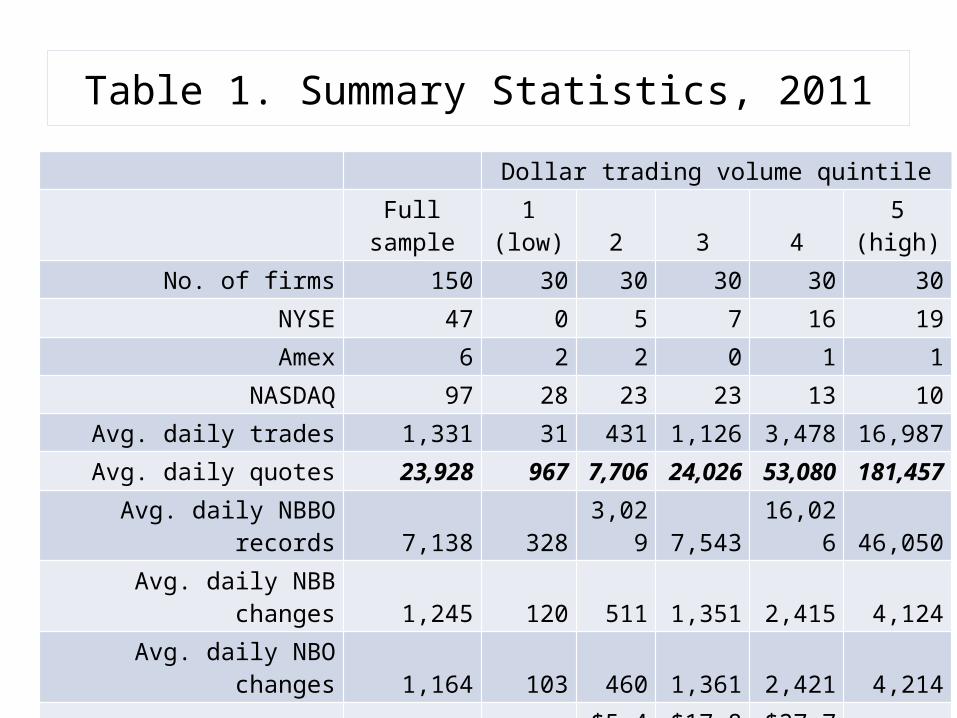
Table 1. Summary Statistics, 2011
Dollar trading volume quintile Full sample 1 (low) 2 3 4 5 (high)
No. of firms 150 30 30 30 30 30NYSE 47 0 5 7 16 19Amex 6 2 2 0 1 1
NASDAQ 97 28 23 23 13 10Avg. daily trades 1,331 31 431 1,126 3,478 16,987Avg. daily quotes 23,928 967 7,706 24,026 53,080 181,457
Avg. daily NBBO records 7,138 328 3,029 7,543 16,026 46,050Avg. daily NBB changes 1,245 120 511 1,351 2,415 4,124Avg. daily NBO changes 1,164 103 460 1,361 2,421 4,214
Avg. price $15.62 $4.87 $5.46 $17.86 $27.76 $51.60Market capitalization of
equity, $ Million $683 $41 $202 $747 $1,502 $8,739

Rough volatilities, Wavelet variances, (1) (2) (3) (4) (5) (6) (7)
Time scale mils Variance
ratio mils Variance
ratio Bid-Offer
Corr< 50 ms 0.28 0.16 4.22
50 ms 0.39 0.22 3.99 0.27 0.15 3.76 0.32100 ms 0.55 0.31 3.79 0.38 0.21 3.58 0.36200 ms 0.76 0.43 3.53 0.53 0.30 3.27 0.41400 ms 1.05 0.59 3.21 0.73 0.41 2.88 0.44800 ms 1.46 0.83 2.90 1.01 0.57 2.59 0.47
1,600 ms 2.02 1.14 2.64 1.40 0.79 2.38 0.513.2 sec 2.80 1.58 2.40 1.94 1.09 2.16 0.556.4 sec 3.90 2.18 2.12 2.71 1.49 1.84 0.60
12.8 sec 5.43 2.99 1.88 3.77 2.04 1.65 0.6425.6 sec 7.54 4.10 1.70 5.23 2.79 1.51 0.6951.2 sec 10.48 5.61 1.54 7.25 3.82 1.39 0.74
102.4 sec 14.53 7.68 1.42 10.04 5.22 1.29 0.793.4 min 20.12 10.51 1.32 13.87 7.14 1.21 0.836.8 min 27.88 14.40 1.23 19.22 9.78 1.15 0.86
13.7 min 38.55 19.70 1.16 26.45 13.33 1.08 0.8827.3 min 52.84 26.79 1.08 35.73 17.91 1.00 0.90
Table 2. Time scale variance estimates, 2011
A trader who faces time uncertainty of 400 ms incurs price risk of or .
At a time scale of 400 ms., the rough variance is 3.21 times the value implied by a random walk with variance calibrated to 27.3 minutes.
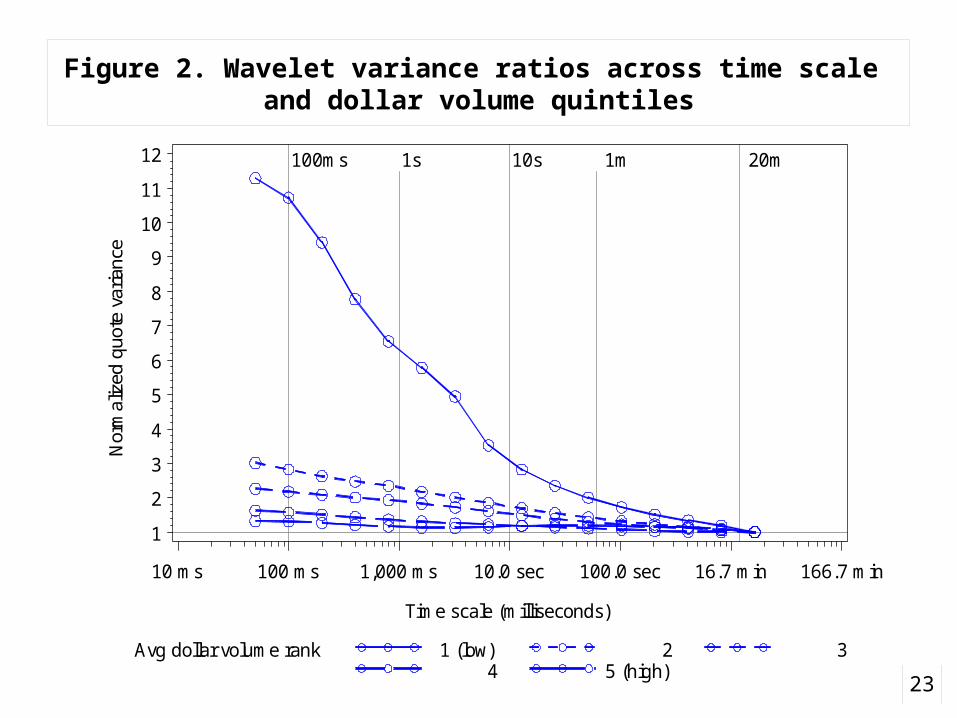
Figure 2. Wavelet variance ratios across time scale and dollar volume quintiles
23
Nor
mal
ized
quo
te v
aria
nce
1
2
3
4
5
6
7
8
9
10
11
12 100ms 1s 10s 1m 20m
Time scale (milliseconds)
10 ms 100 ms 1,000 ms 10.0 sec 100.0 sec 16.7 min 166.7 min
Avg dollar volume rank 1 (low) 2 34 5 (high)
The 2011 results: a summary
Variance ratios: short term volatility is much higher than we’d expect relative to a random-walk.
In mils per share or basis points, average short term volatility is economically meaningful, but small.
24
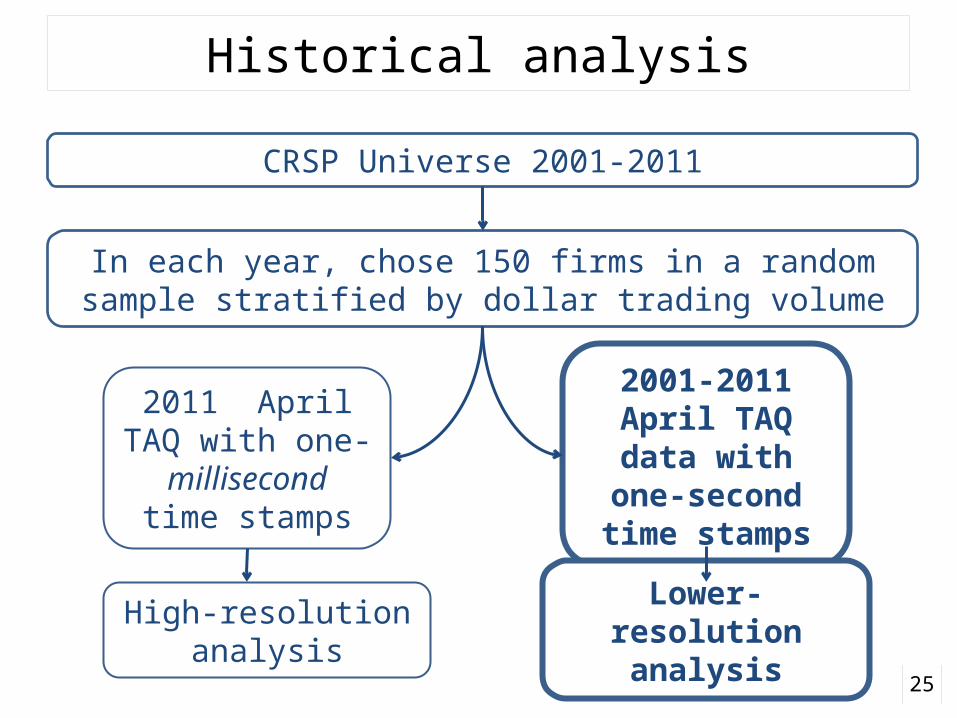
Historical analysis
25
CRSP Universe 2001-2011
In each year, chose 150 firms in a random sample stratified by dollar trading volume
2001-2011April TAQ data
with one-second time stamps
2011 April TAQ with one-
millisecond time stamps
High-resolution analysis
Lower-resolution analysis
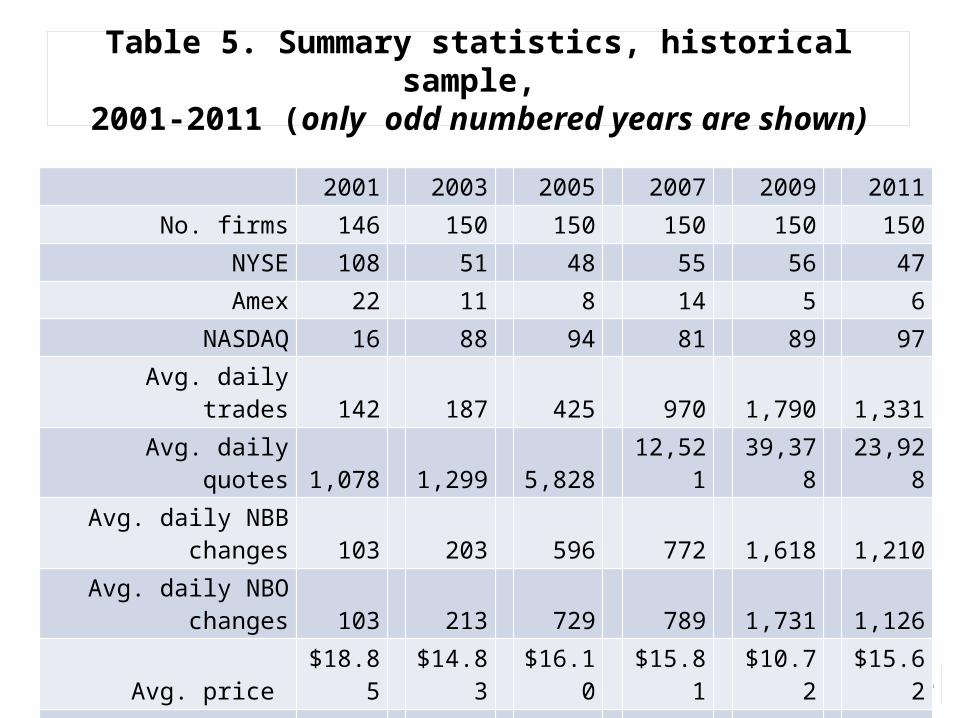
Table 5. Summary statistics, historical sample, 2001-2011 (only odd numbered years are shown)
26
2001 2003 2005 2007 2009 2011No. firms 146 150 150 150 150 150
NYSE 108 51 48 55 56 47Amex 22 11 8 14 5 6
NASDAQ 16 88 94 81 89 97Avg. daily trades 142 187 425 970 1,790 1,331Avg. daily quotes 1,078 1,299 5,828 12,521 39,378 23,928
Avg. daily NBB changes 103 203 596 772 1,618 1,210Avg. daily NBO changes 103 213 729 789 1,731 1,126
Avg. price $18.85 $14.83 $16.10 $15.81 $10.72 $15.62Market equity cap
$ Million $745 $189 $325 $480 $316 $683
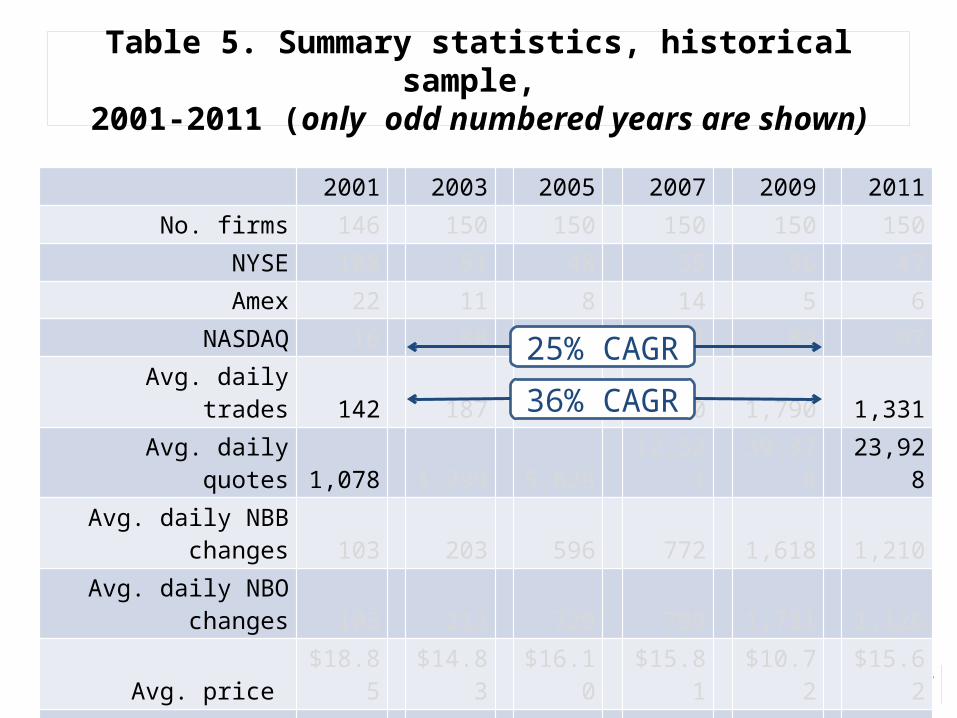
Table 5. Summary statistics, historical sample, 2001-2011 (only odd numbered years are shown)
27
2001 2003 2005 2007 2009 2011No. firms 146 150 150 150 150 150
NYSE 108 51 48 55 56 47Amex 22 11 8 14 5 6
NASDAQ 16 88 94 81 89 97Avg. daily trades 142 187 425 970 1,790 1,331Avg. daily quotes 1,078 1,299 5,828 12,521 39,378 23,928
Avg. daily NBB changes 103 203 596 772 1,618 1,210Avg. daily NBO changes 103 213 729 789 1,731 1,126
Avg. price $18.85 $14.83 $16.10 $15.81 $10.72 $15.62Market equity cap
$ Million $745 $189 $325 $480 $316 $683
25% CAGR
36% CAGR
What statistics to consider?
Long-term volatilities changed dramatically over the sample period.
Variance ratios (normalized to long-term volatility) are the most reliable indicators of trends.
28
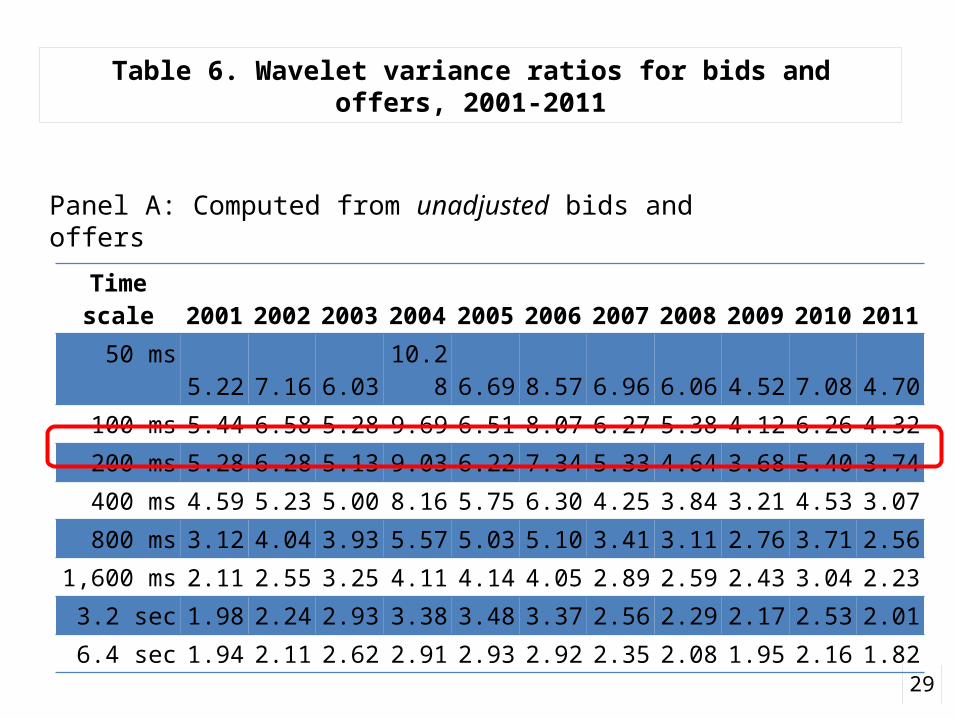
Table 6. Wavelet variance ratios for bids and offers, 2001-2011
29
Time scale 2001 2002 2003 2004 2005 2006 2007 2008 2009 2010 2011
50 ms 5.22 7.16 6.03 10.28 6.69 8.57 6.96 6.06 4.52 7.08 4.70100 ms 5.44 6.58 5.28 9.69 6.51 8.07 6.27 5.38 4.12 6.26 4.32200 ms 5.28 6.28 5.13 9.03 6.22 7.34 5.33 4.64 3.68 5.40 3.74400 ms 4.59 5.23 5.00 8.16 5.75 6.30 4.25 3.84 3.21 4.53 3.07800 ms 3.12 4.04 3.93 5.57 5.03 5.10 3.41 3.11 2.76 3.71 2.56
1,600 ms 2.11 2.55 3.25 4.11 4.14 4.05 2.89 2.59 2.43 3.04 2.233.2 sec 1.98 2.24 2.93 3.38 3.48 3.37 2.56 2.29 2.17 2.53 2.016.4 sec 1.94 2.11 2.62 2.91 2.93 2.92 2.35 2.08 1.95 2.16 1.82
Panel A: Computed from unadjusted bids and offers
No trend in quote volatilities?
Maybe … “Flickering quotes” aren’t new. Recent concerns about high frequency trading
are all media hype. The good old days weren’t really so great after
all.
What did quote volatility look like circa 2001?
30
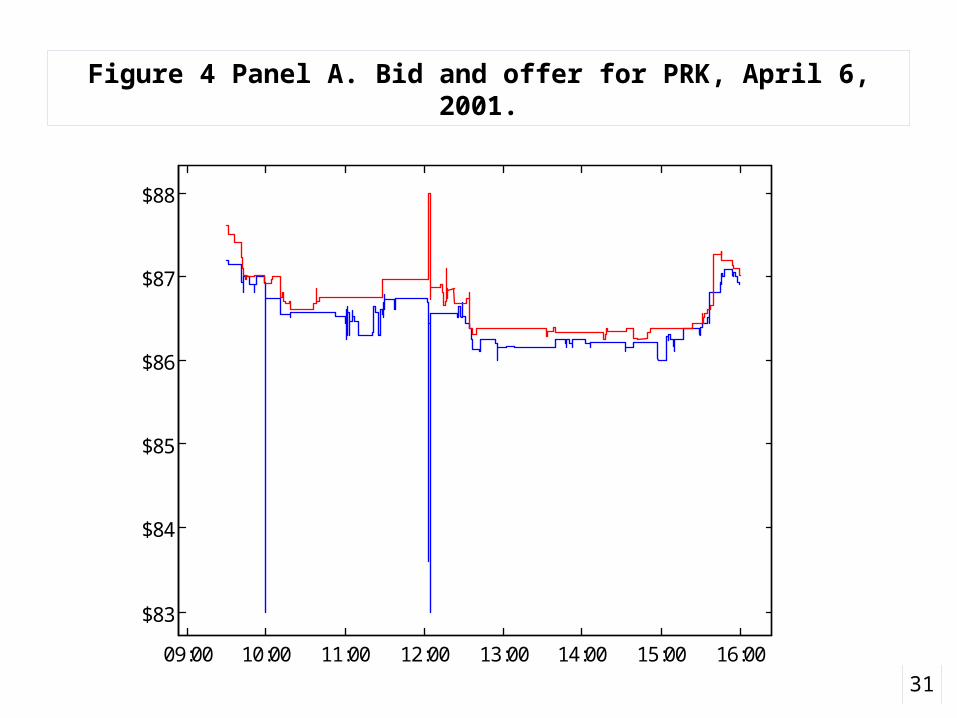
Figure 4 Panel A. Bid and offer for PRK, April 6, 2001.
31
09:00 10:00 11:00 12:00 13:00 14:00 15:00 16:00
$83
$84
$85
$86
$87
$88
PRK 20010406
Compare
PRK in 2001 vs. AEPI in 2011 AEPI: low amplitude, intense oscillation. PRK: large amplitude, no oscillation.
PRK-type noise is called “pop” noise It can be filtered out by clipping
I clip the short-run noise to
32
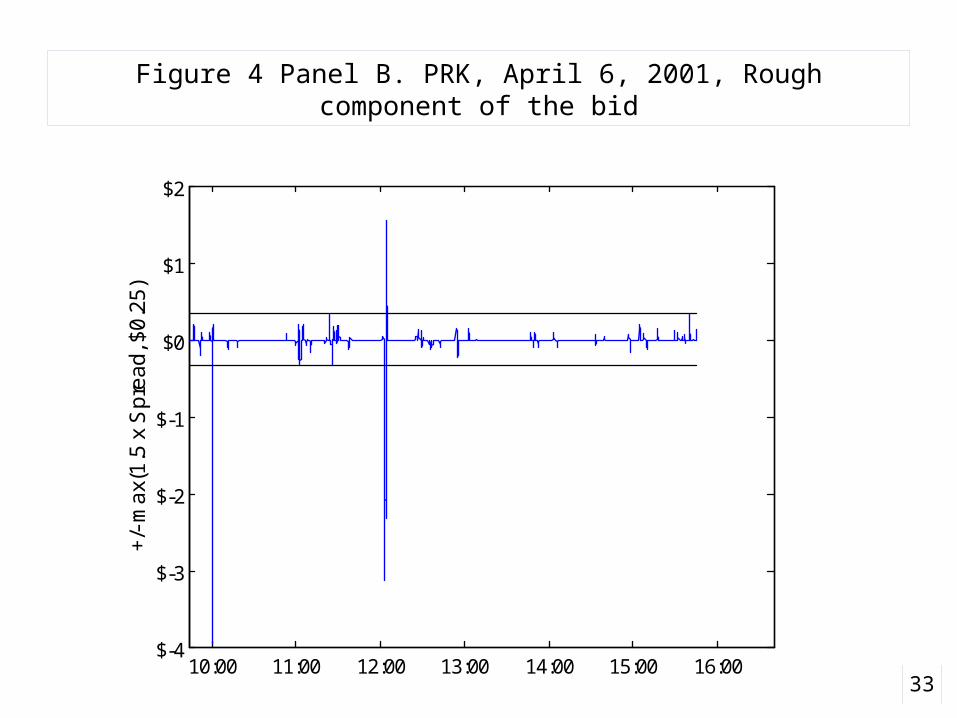
Figure 4 Panel B. PRK, April 6, 2001, Rough component of the bid
3310:00 11:00 12:00 13:00 14:00 15:00 16:00
$-4
$-3
$-2
$-1
$0
$1
$2
+/-
ma
x(1
.5 x
Sp
rea
d, $
0.2
5)
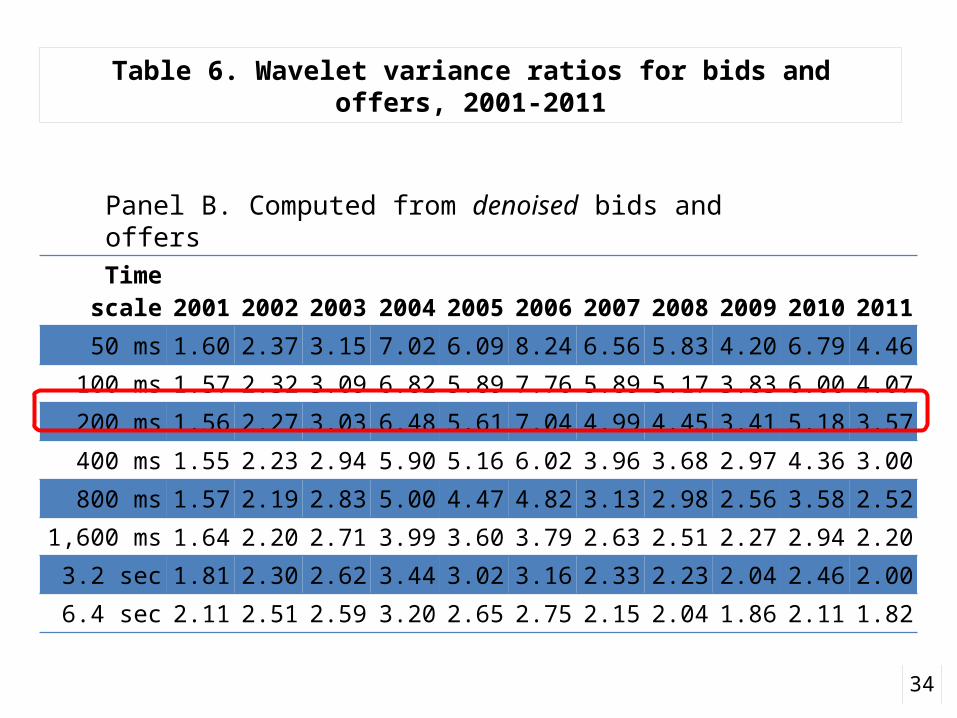
Table 6. Wavelet variance ratios for bids and offers, 2001-2011
34
Time scale 2001 2002 2003 2004 2005 2006 2007 2008 2009 2010 201150 ms 1.60 2.37 3.15 7.02 6.09 8.24 6.56 5.83 4.20 6.79 4.46
100 ms 1.57 2.32 3.09 6.82 5.89 7.76 5.89 5.17 3.83 6.00 4.07200 ms 1.56 2.27 3.03 6.48 5.61 7.04 4.99 4.45 3.41 5.18 3.57400 ms 1.55 2.23 2.94 5.90 5.16 6.02 3.96 3.68 2.97 4.36 3.00800 ms 1.57 2.19 2.83 5.00 4.47 4.82 3.13 2.98 2.56 3.58 2.52
1,600 ms 1.64 2.20 2.71 3.99 3.60 3.79 2.63 2.51 2.27 2.94 2.203.2 sec 1.81 2.30 2.62 3.44 3.02 3.16 2.33 2.23 2.04 2.46 2.006.4 sec 2.11 2.51 2.59 3.20 2.65 2.75 2.15 2.04 1.86 2.11 1.82
Panel B. Computed from denoised bids and offers
So has quote volatility increased?
Apples vs. oranges The nature of quotes has changed.
Quote volatility has changed From infrequent large changes to frequent (and
oscillatory) small changes. Possibly a overall small increase,
But nothing as strong as the trend implied by the growth in quote messaging rates.
35