high energy plume impingement on spacecraft systems afosr telecon
DESCRIPTION
High Energy Plume Impingement on Spacecraft Systems AFOSR Telecon. Jarred Alexander Young May 13, 2013. Current Events. Beam Analysis Looking into CEX environment for multiple distances and pressures Hi-definition energy peak scans Ion Reflection testing Material Experiments - PowerPoint PPT PresentationTRANSCRIPT
High Energy Plume Impingement on Spacecraft Systems
AFOSR Telecon
Jarred Alexander YoungMay 13, 2013

Current Events
Beam Analysis Looking into CEX environment for multiple
distances and pressures Hi-definition energy peak scans Ion Reflection testing
Material Experiments Completed all tests with Si coupons (150 &
250 eV) Completed first round of Aluminum sample
testing

CEX Analysis
Objective: Conduct RPA analysis on ion beam at multiple pressures
Small I-V humps observed during testing of beam for axial profiling
RPA scans centered around these regions to examine beam behavior
0 50 100 150 200 250
-5.00E-07
0.00E+00
5.00E-07
1.00E-06
1.50E-06
2.00E-06
2.50E-06
I-V Comparisons as function of Pressure, Distance: 59.97 mm
Voltage (V)
Curr
ent
(A)

CEX Analysis
-5 0 5 10 15 20 25 30 352.35E-06
2.36E-06
2.37E-06
2.38E-06
2.39E-06
2.40E-06
2.41E-06
2.42E-06
I-V Curve, Distance: 59.97 mm, Pressure: 3.6E-4 torr
Collector Voltage (V)
Beam
Curr
ent
(A)

CEX Analysis
-5 0 5 10 15 20 25 30 350.00E+00
2.00E+00
4.00E+00
6.00E+00
8.00E+00
1.00E+01
1.20E+01
Energy Distribution, Distance: 59.97 mm, Pressure: 3.6E-4 torr
Particle Energy (eV)
Curr
ent
Spectr
al D
ensit
y (
A/V
)

RPA Results Summary
Distance (mm)
Beam Energy, Pressure 1(eV)
Current Spectr
al Density
, Pressur
e 1 (A/eV)
Beam Energy CEX,
Pressure 1(eV)
Current Spectr
al Density
CEX, Pressur
e 1 (A/eV)
Beam Energy, Pressure 2(eV)
Current Spectr
al Density
, Pressur
e 2 (A/eV)
Beam Energy CEX,
Pressure 2(eV)
Current Spectr
al Density
CEX, Pressur
e 2 (A/eV)
19.28 mm
147.48 1.06E-8 12.238.17E-
10151.44 1.08E-8 2.04 1.52E-9
40.66 mm
149.67 1.07E-85.21(5.5
2)
5.38E-10
(4.52E-10)
152.39 6.98E-92.11(2.4
1)
1.85E-9(1.18E-
9)
59.97 mm
147.48 1.08E-8 8.198.65E-
10151.80 6.93E-9 2.27 3.54E-9
80.71 mm
149.49 1.09E-8 ? ? 153.38 6.09E-9 ? ?

CEX Analysis
Third pressure scan reveals interesting beam current structure
Larger CEX energies observed at 14 mtorr than previous pressures ~25 eV More likely than “main
energy” ions to occur
0 20 40 60 80 100 120 140 160 180 200
-5.00E-07
0.00E+00
5.00E-07
1.00E-06
1.50E-06
2.00E-06
2.50E-06
I-V Comparison at multiple pressures
0.40 mtorr4.1 mtorr14 mtorr
Collector Voltage (V)
Beam
Curr
ent(
A)

CEX Analysis
0 5 10 15 20 25 30 35 40 45 500.00E+00
1.00E-07
2.00E-07
3.00E-07
4.00E-07
5.00E-07
6.00E-07
7.00E-07
I-V Curve, Distance: 57.09 mm, Pressure: 13.9 mtorr
Collector Voltage (V)
Beam
Curr
ent
(A)

CEX Analysis
0 5 10 15 20 25 30 35 40 45 50
-1.00E-09
-5.00E-10
0.00E+00
5.00E-10
1.00E-09
1.50E-09
2.00E-09
2.50E-09
3.00E-09
3.50E-09
Energy Distribution, Distance: 57.09 mm, Pressure: 13.9 mtorr
Particle Energy (eV)
Curr
ent
Spectr
al D
ensit
y (
A/V
)

RPA Results Summary 2
Pressure(mtorr)
Beam Energy
(eV)
Current Spectral Density, (A/eV)
Beam Energy
CEX, (eV)
Current Spectral Density
CEX, (A/eV)
0.40 147.15 8.47E-9 10.38 4.11E-10
4.1 150.3 6.66E-8 2.92 3.72E-10
14 144.29 5.83E-9 27.65 (15.53)
3.12E-9(1.04E-9)

Ion Reflection Testing
RPA pointed at right wall of chamber, about 70 mm away from beam exit
Preliminary Results Lower pressure: electron
current dominated Higher pressure: 5 nA of
ion current reported over small voltage step▪ Could be mechanical noise▪ Energy around 10 eV
0 20 40 60 80 100 120 140 160 180 200
-1.00E-08
-9.00E-09
-8.00E-09
-7.00E-09
-6.00E-09
-5.00E-09
-4.00E-09
-3.00E-09
-2.00E-09
-1.00E-09
0.00E+00
I-V Curve, Pressure: .38 mtorr
Voltage (V)
Curr
ent
(A)
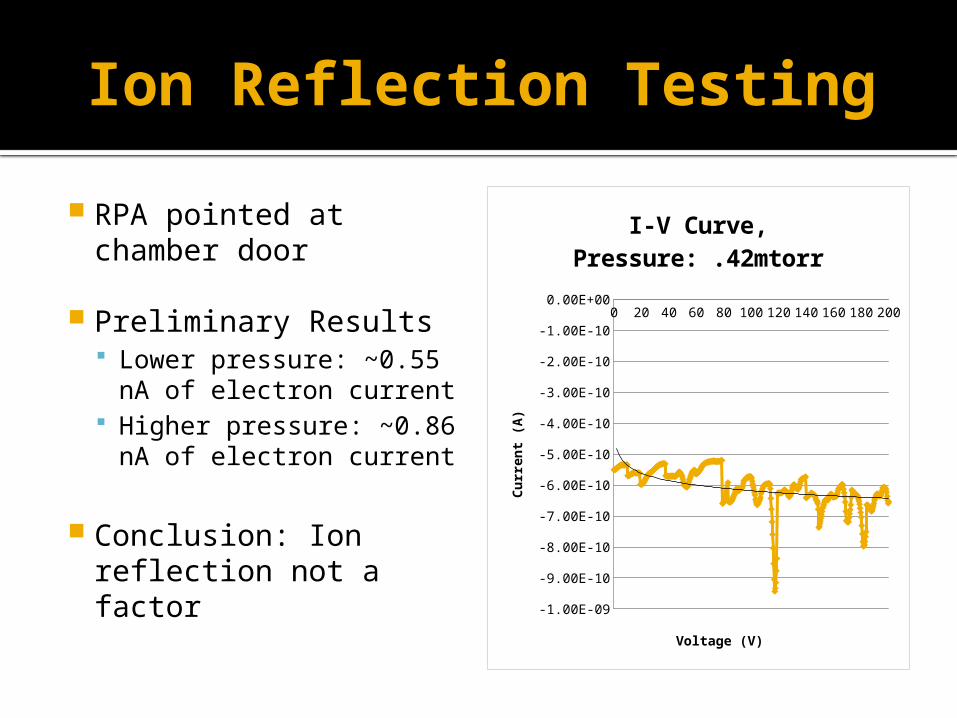
Ion Reflection Testing
RPA pointed at chamber door
Preliminary Results Lower pressure: ~0.55
nA of electron current Higher pressure: ~0.86
nA of electron current
Conclusion: Ion reflection not a factor
0 20 40 60 80 100 120 140 160 180 200
-1.00E-09
-9.00E-10
-8.00E-10
-7.00E-10
-6.00E-10
-5.00E-10
-4.00E-10
-3.00E-10
-2.00E-10
-1.00E-10
0.00E+00
I-V Curve, Pres-sure: .42mtorr
Voltage (V)
Curr
ent
(A)

Material Testing
Performed plume exposure tests on Si coupons
Test Parameters Energy levels: 150 & 250 eV Exposure times comparable
to deposition of 50, 100, or 150 monolayers
Distance from Beam Exit: ~2 cm
Scanned samples for Argon and Tungsten atoms

Si Material Testing
Tested all 150 eV and 250 eV samples
Sample 3 had multiple broken tips on top row, but majority of tips were undamaged
Broken tips doped with Aluminum according to EDS
All samples showed elevated levels of Argon Can’t confirm because no
before scans were taken
All samples returned to ISU for APT testing

Al Material Testing
Objective: Expose Al samples to ion beam at: Energy levels: 150 eV, 250
eV Exposure durations: 1, 2, &
3 hours
Aluminum 1350-O used for samples
Three types of observation Photographic/Visual SEM Imaging & EDS Contact Profilometry

Al Material Sample Results
Surface modifications Pitting and slight polishing
effects for low duration exposure
Polishing effect for higher exposure times with minor pitting
EDS scans showed evidence of Chromium Al 1350-O has low
concentration of Cr (.01%) Could be sputtered material
from RPA grids Average Concentration: 0.4%
(Error: 0.1%)

Al Sample “After” Photos
Sample 1: 150 eV, 1 hour
Sample 2: 150 eV, 2 hour
Sample 3: 150 eV, 3 hour
Sample 4: 250 eV, 1 hour
Sample 5: 250 eV, 2 hour
Sample 6: 250 eV, 3 hour

Future Work
Adapt experimental procedure for second batch of sample experiments
Work on joint abstract for Winter AIAA conference