high and hyperinflation bolivia - michael walton. applications and cases in international...
TRANSCRIPT
PED401. Applications and Cases in International Development
Teaching Notes1
High and hyperinflation: determinants and solutions
“Inflation now seemed to ‘lift off’ to a life of its own, quite divorced from the real economy, like a missile escaping the gravity of Earth”. Bruno 1993 p.82
Hyperinflation is an extreme manifestation of macroeconomic imbalances. It is highly costly, typically associated with a negative growth. While hyperinflation—with monthly rates of price increase of at least 20-30 percent2—is a relatively rare phenomenon, it has features in common with high inflation.
In this case we look at high and hyperinflation for its intrinsic interest, to illustrate the application of macro analytical frameworks, and to examine the links between levels of determinants of economic phenomena. Inflation is at one level a monetary phenomenon, but it is closely linked to fiscal performance, and this is in turn linked to both economic institutions and to the management of underlying distributional conflicts. This note first presents some analytical context, briefly surveying core analytical approaches to understanding inflationary processes—ending with the approach most applicable to high and hyperinflation. It then briefly sketches some general empirical results and features of the high inflation case of Israel. Finally the note introduces the case of Bolivia’s true hyperinflation of the mid-1980s, that will be the focus of the policy question and class discussion.
Analytical context
We outline here the links to the analytical tools presented in API-120 on Macro. In addition to these macroeconomic tools, there are underlying questions related to distributional struggles and politics. These are not included in this analytical context, but will be discussed in class.
1 These were prepared by Alexander Culiuc and Michael Walton and are solely for teaching purposes. 2 The criterion proposed by Cagan in his classic work on European hyperinflations was 50 percent per month; Bruno (1993) suggested 20-30 percent per month marks a (very rough) transition point from high to hyperinflation.

Inflation vs. hyperinflation
Both inflation and hyperinflation are caused by excessive creation of money by the central bank. However, the underlying determinants of the two phenomena are radically different.
“Normal” rates of inflation are usually brought about by the governments’ choices over output stabilization, and in particular choices to boost it during the bust phase of business cycles. The rationale behind government’s intervention are deeply rooted in the Mundell-Flemming model. In the model, the increase in the money base (expansionary monetary policy) causes an increase in the aggregate demand (at the expense of higher interest rates). In the bust phase of the cycle, the aggregate supply is assumed to infinitely elastic (flat AS curve), the shift in the aggregate demand curve translates one for one into increased output with no price increase.
Figure 1. Short-term impact of expansionary monetary policy.
In the medium term (before taking account of factor accumulation) and in boom phases of the cycle, however, the aggregate supply is vertical. Prices increase one for one with the increase in the monetary base, and the real supply of money goes back to the original value, which brings the LM curve back to its original position (since M/P goes back to its original value as P rises).

Figure 2. Long-term effect of monetary expansion.
Following the same logic, increases in the rate of money creation will lead to equal changes in the rate of change of prices, i.e. inflation. In fact, in equilibrium π=gM, i.e. inflation is equal to the rate of money creation.
Figure 3. Inflation and money (M2) growth, 1960-1995 averages.
Note: Slope of regression line is 1.115, t-stat=12.14; 94 countries, each with 10 or more observations. Source: Stanley Fischer, Ratna Saray and Carlos Vegh. 2004. “Modern Hyper- and High inflations” in Stanley Fischer (ed.) “IMF Essays from a Time of Crisis: The International Financial System. Stabilization and Development”. MIT Press.
The Mundell-Fleming model can explain isolated instances of price increases (Government using monetary policy to stabilize output). However, the model clearly shows the long-run inefficiency of expansionary monetary policy. How can we reconcile this with the high levels of inflation throughout the seventies and eighties?
Time inconsistency of monetary policy
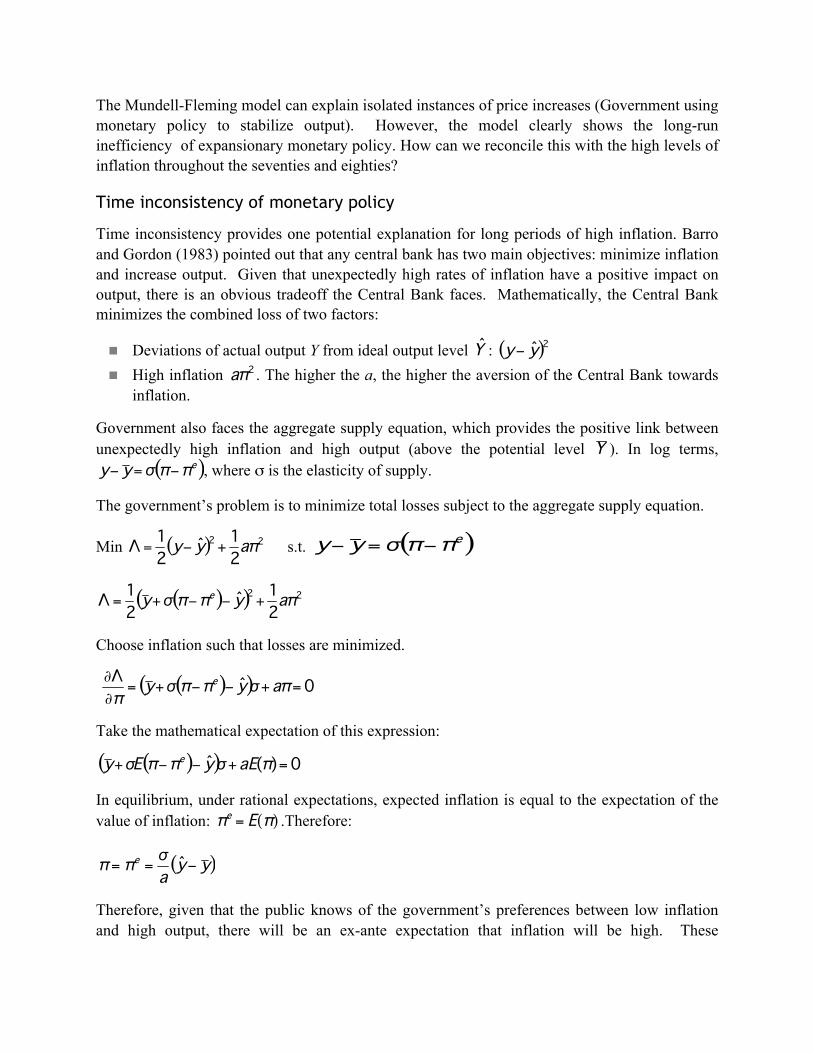
Time inconsistency provides one potential explanation for long periods of high inflation. Barro and Gordon (1983) pointed out that any central bank has two main objectives: minimize inflation and increase output. Given that unexpectedly high rates of inflation have a positive impact on output, there is an obvious tradeoff the Central Bank faces. Mathematically, the Central Bank minimizes the combined loss of two factors:
Deviations of actual output Y from ideal output level : High inflation . The higher the a, the higher the aversion of the Central Bank towards
inflation.
Government also faces the aggregate supply equation, which provides the positive link between unexpectedly high inflation and high output (above the potential level ). In log terms,
, where σ is the elasticity of supply.
The government’s problem is to minimize total losses subject to the aggregate supply equation.
Min s.t.
Choose inflation such that losses are minimized.
Take the mathematical expectation of this expression:
In equilibrium, under rational expectations, expected inflation is equal to the expectation of the value of inflation: .Therefore:
Therefore, given that the public knows of the government’s preferences between low inflation and high output, there will be an ex-ante expectation that inflation will be high. These
expectations will be factored in when unions renegotiate salaries, when companies sign long-term contracts and when banks set nominal interest rates. As a result, the inflationary bias turns into a self-fulfilling prophecy. The worst part is the fact that as long as people guess the inflation correctly, the central bank will not be able to push output beyond the potential level: unless it is able to surprise the public.
As discussed in API-120, the model suggests several options for breaking the time-inconsistency vicious circle:
Provide autonomy to the central bank in order to insulate it from political games in other institutions of government, and appoint a “conservative” central banker with a “very high a”, i.e. a person who a stronger preference for low inflation than the median voter. A variation of this solution calls for any central banker (even the low-a type) to be tough on inflation in the early period, in order to gain the reputation of a conservative one.
Pre-committing to a low inflation by announcing a nominal anchor (inflation rate, exchange rate, etc.) and strictly following the rule.
According to Dornbusch and Fischer (1993), this model could support the occurrence of steady inflation at 20 or 30 percent per year. But we are still very far from 20-30 percent inflation per month that defines the lower bound of hyperinflation. Hyperinflation is recessionary, and no government in their right mind would ever push the LM curve so far to the right in order to increase output; the result would most definitely be the opposite. We have to look into other reasons in order to explain the government’s willingness to print money in exorbitant amounts.
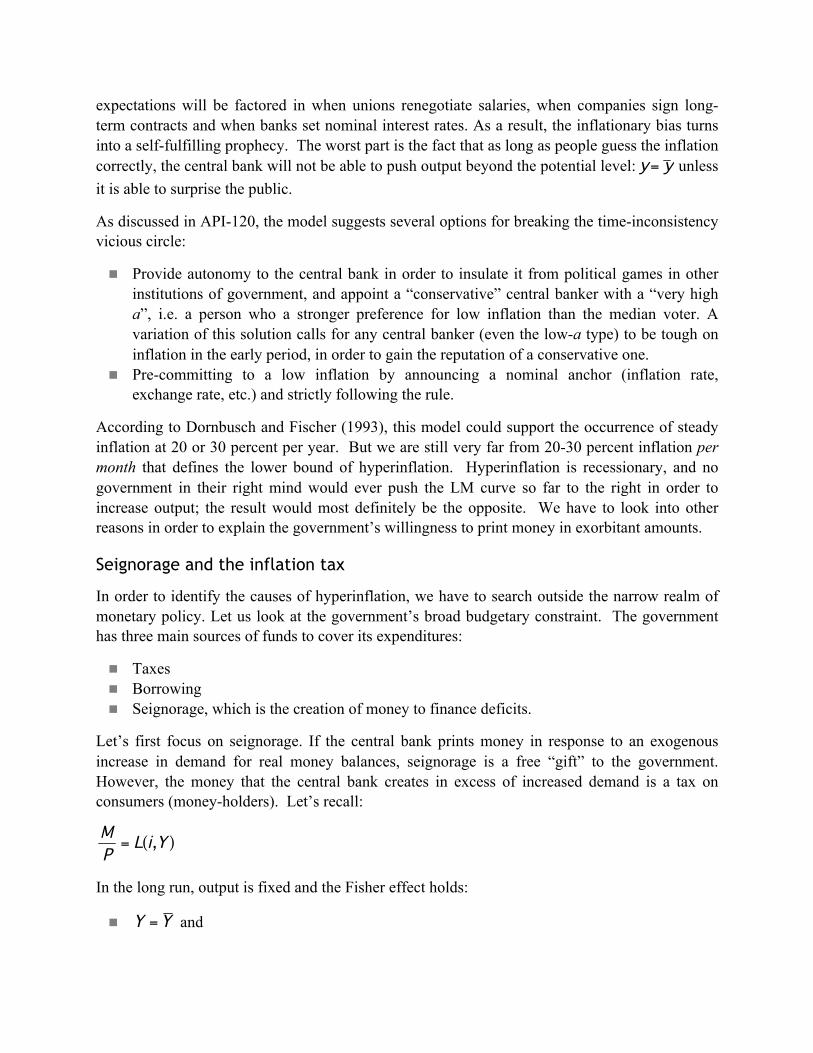
Seignorage and the inflation tax
In order to identify the causes of hyperinflation, we have to search outside the narrow realm of monetary policy. Let us look at the government’s broad budgetary constraint. The government has three main sources of funds to cover its expenditures:
Taxes Borrowing Seignorage, which is the creation of money to finance deficits.
Let’s first focus on seignorage. If the central bank prints money in response to an exogenous increase in demand for real money balances, seignorage is a free “gift” to the government. However, the money that the central bank creates in excess of increased demand is a tax on consumers (money-holders). Let’s recall:
In the long run, output is fixed and the Fisher effect holds:
and
— the Fisher effect (super-neutrality of money), where ,
i.e. inflation rate equals the rate of nominal money creation.
Therefore:
Seignorage is then defined as:
Translating back to English: inflation tax revenue = tax rate (π) × tax base (L=M/P, real money). In other terms, if I hold for one period an amount of real balances equal to Mt/Pt, the real value of such balances (their purchasing power in terms of goods) will be reduced by an amount equal to π(Mt/Pt) after one period.
We know that demand for real money balances is inversely related to the opportunity cost of money, i.e. nominal interest rates. Higher inflation leads to higher nominal interest rates (recall that i = r + π), and therefore people will respond to increased inflation by reducing their real money balances. In other words, an increase in the tax rate reduces the tax base, which results in a Laffer curve. As you’ve seen in API-120, the government may end up on the wrong side of the Laffer curve, which can result in rates of inflation in excess of 1000%.
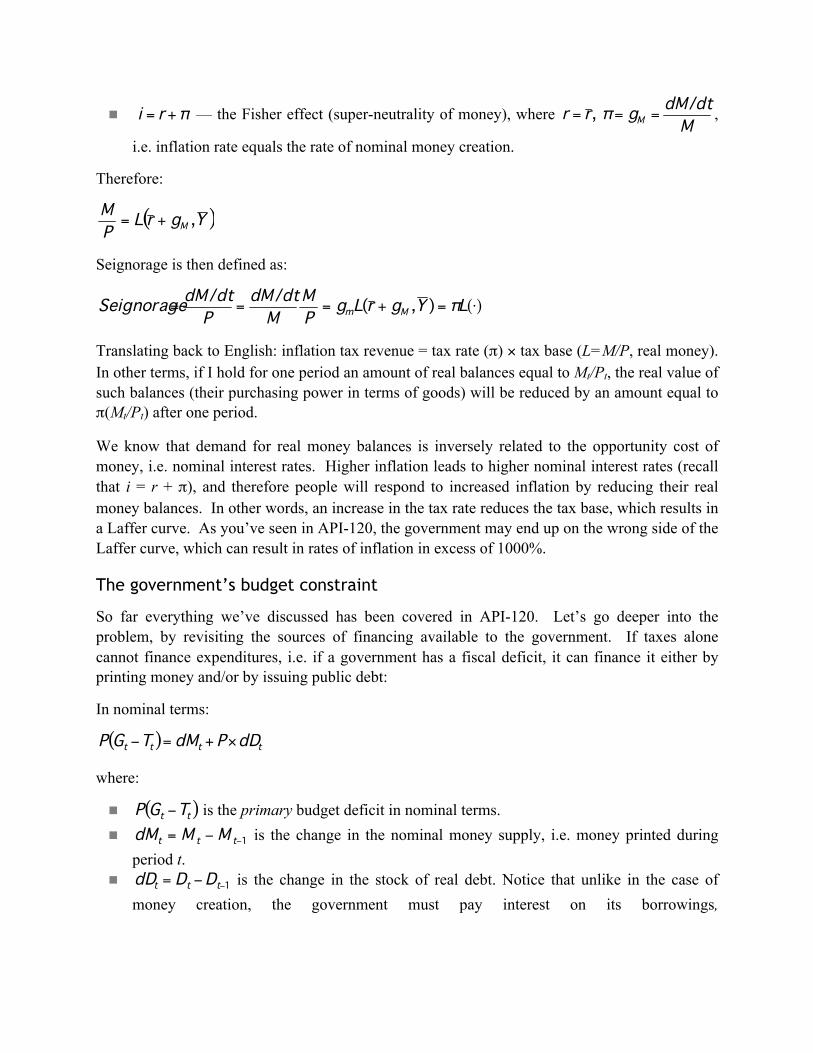
The government’s budget constraint
So far everything we’ve discussed has been covered in API-120. Let’s go deeper into the problem, by revisiting the sources of financing available to the government. If taxes alone cannot finance expenditures, i.e. if a government has a fiscal deficit, it can finance it either by printing money and/or by issuing public debt:
In nominal terms:
where:
is the primary budget deficit in nominal terms. is the change in the nominal money supply, i.e. money printed during
period t. is the change in the stock of real debt. Notice that unlike in the case of
money creation, the government must pay interest on its borrowings,
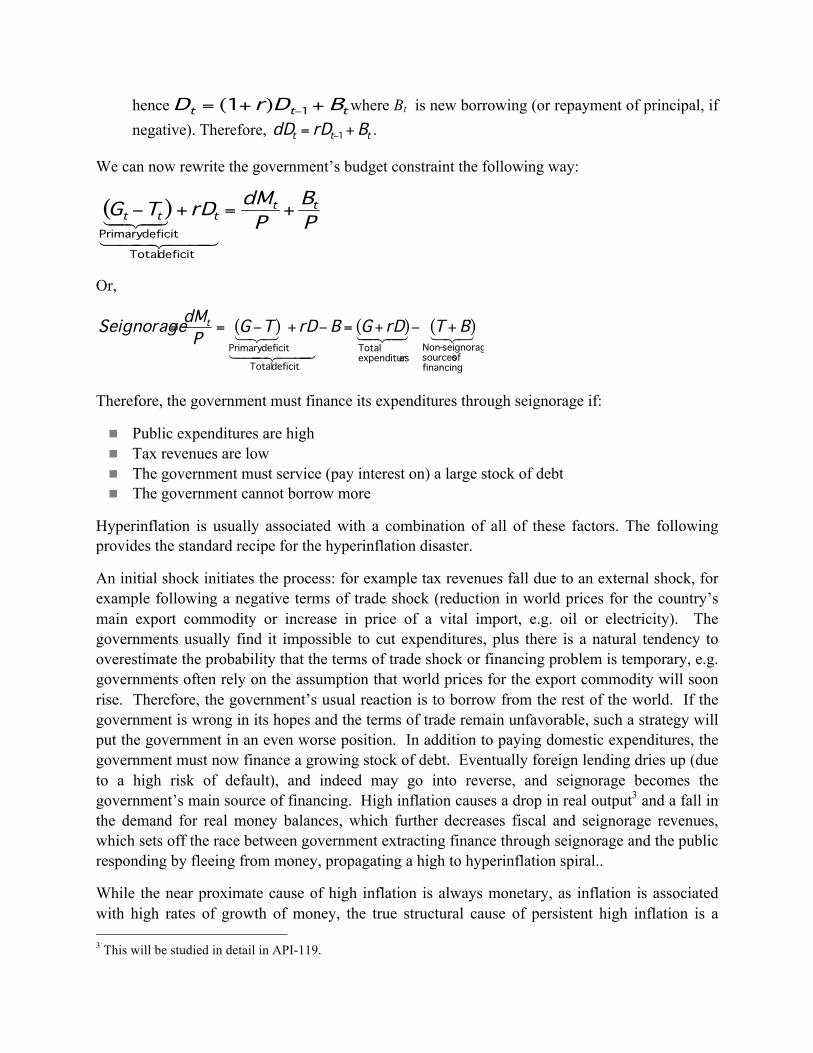
hence where Bt is new borrowing (or repayment of principal, if negative). Therefore, .
We can now rewrite the government’s budget constraint the following way:
Or,
Therefore, the government must finance its expenditures through seignorage if:
Public expenditures are high Tax revenues are low The government must service (pay interest on) a large stock of debt The government cannot borrow more
Hyperinflation is usually associated with a combination of all of these factors. The following provides the standard recipe for the hyperinflation disaster.
An initial shock initiates the process: for example tax revenues fall due to an external shock, for example following a negative terms of trade shock (reduction in world prices for the country’s main export commodity or increase in price of a vital import, e.g. oil or electricity). The governments usually find it impossible to cut expenditures, plus there is a natural tendency to overestimate the probability that the terms of trade shock or financing problem is temporary, e.g. governments often rely on the assumption that world prices for the export commodity will soon rise. Therefore, the government’s usual reaction is to borrow from the rest of the world. If the government is wrong in its hopes and the terms of trade remain unfavorable, such a strategy will put the government in an even worse position. In addition to paying domestic expenditures, the government must now finance a growing stock of debt. Eventually foreign lending dries up (due to a high risk of default), and indeed may go into reverse, and seignorage becomes the government’s main source of financing. High inflation causes a drop in real output3 and a fall in the demand for real money balances, which further decreases fiscal and seignorage revenues, which sets off the race between government extracting finance through seignorage and the public responding by fleeing from money, propagating a high to hyperinflation spiral..
While the near proximate cause of high inflation is always monetary, as inflation is associated with high rates of growth of money, the true structural cause of persistent high inflation is a 3 This will be studied in detail in API-119.

fiscal deficit that is not eliminated with cuts in spending and/or increases in (non-seigniorage) taxes. An additional mechanism, that is central to high inflation, but is often absent in hyperinflation, is the formal or informal indexing of prices—especially between wages, prices, and the exchange rate. This eases the pain of high inflation, at the cost of creating substantial inflationary inertia within the price-setting process.
Stopping hyperinflation
On the surface, curbing hyperinflation is easy—all you need is to stop the money printing press. However, on its own, this measure will not remove the underlying fiscal problems that lie behind the money creation process. There are several ways to deal with them:
Stimulating real growth. With the exception of a few extreme cases (e.g. price liberalization in the case of omnipresent price controls), this is easier to say than do, especially in the short run.
Improving the tax collection system. This is usually a lengthy process which takes time to produce sizable results.
Cutting government expenditure programs. By this point inflation becomes Problem Number One for every citizen, so generally unpopular measures such as wage-cuts (or nominal wage freeze) may be feasible to implement.
Increasing net external flows, through new support or defaulting on foreign debt. If default is the only option, this relaxes the budgetary constraint, but comes at the cost of lower access to foreign capital markets in the future (which may not be seen as a problem, since the current government will most likely be gone by then).
Since the fiscal and monetary problems were often reflections of unresolved distributional conflicts, the policy mix also needs to be consistent with at least an interim resolution of such fights.
Some international experience and the example of Israel
Dimensions of high and hyperinflation
The analytical context indicates that different mechanisms are at work for moderate and high/hyper inflation. High and hyperinflation are much more costly in economic and social terms than moderate inflation, yet one of the problems with moderate inflation is that it can be a stepping stone to higher levels: 27 percent of countries experiencing 40-60% inflation experience inflation over 100% within three years, 78 percent of countries with 100% inflation experience that level again within three years, and 29 percent experience inflation of over 1000% in this period (Table 1).
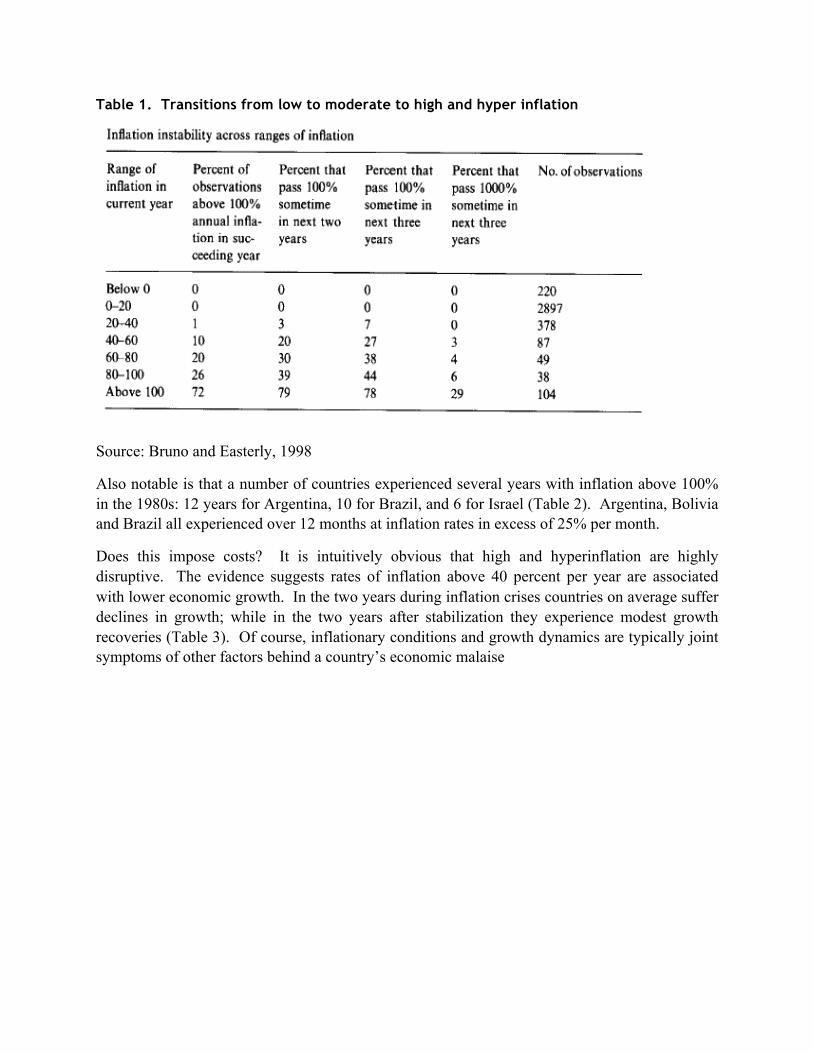
Table 1. Transitions from low to moderate to high and hyper inflation
Source: Bruno and Easterly, 1998
Also notable is that a number of countries experienced several years with inflation above 100% in the 1980s: 12 years for Argentina, 10 for Brazil, and 6 for Israel (Table 2). Argentina, Bolivia and Brazil all experienced over 12 months at inflation rates in excess of 25% per month.
Does this impose costs? It is intuitively obvious that high and hyperinflation are highly disruptive. The evidence suggests rates of inflation above 40 percent per year are associated with lower economic growth. In the two years during inflation crises countries on average suffer declines in growth; while in the two years after stabilization they experience modest growth recoveries (Table 3). Of course, inflationary conditions and growth dynamics are typically joint symptoms of other factors behind a country’s economic malaise

Table 2 High inflation and hyperinflation in various countries, 1970-91
Source: from Bruno (1993)
Source: Bruno and Easterly, 1998
To provide context for the Bolivia case, we sketch the experience of Israel. Israel is of interest because it also suffered a lengthy period of high inflation (though only a brief transition to hyperinflation), but has both contrasts and commonalities with Bolivia. In the 1980s, Israel is a democratic middle income country, relatively equal, with a well-developed industrial and service sector, a well-organized workforce and sophisticated and institutionalized economic management

skills. All this contrasts with Bolivia. Yet some of the core elements of the transition to high inflation are similar. Distributional struggles spilled over into the fiscal deficit, and when the economy hit internal productivity slowdowns and external terms of trades shocks, this underpinned the transition first to moderate and then to high inflation (Figure 4). However, a further important element of the process was the institutionalization of indexing, the linking of wage and price contracts: this greatly reduced the costs of inflation in the short run, but also made it harder to stop.
Figure 4 The public sector deficit and inflation in Israel, 1964-92
The high inflation was eventually stopped, as the figure shows—in a program designed by a group of economists that included Michael Bruno (then Governor of the Bank of Israel) and Stanley Fischer. As with many high or hyperinflations, the final stop was quick. But what is important to note is that this came after several failed attempts at stabilization, alongside internal debate on policy design and process. Securing the agreement of the major social actors was key to the success.
The policy mix had, at its core, elements described in the analytical context: a fiscal correction that allowed the printing press to stop, backed by measures to improve the external financing position and support growth. But it was a complex mix, summarized in the following list, that Bruno (1993) put together as a stylized policy mix after the experience of Israel (and other disinflations). Note the “heterodox” element of multiple nominal anchors, and managed prices through a wage freeze and temporary controls of prices. This was a necessary complement to the more orthodox elements to tackle quickly the inflationary inertia built into price contracts

Stylized lessons of Israeli stabilization program (from Bruno, 1993):
(1) Fundamentals: to restore internal and external balance
-- Permanent budget balance, upfront devaluation, bolster central bank independence, external finance, social safety net
(2) Multiple nominal anchors: to achieve rapid synchronized disinflation
-- Initial exchange rate peg, money and/or credit ceilings, wage freeze through social contract, temporary/partial price controls
(3) Extra nuts and bolts: to facilitate quick move to new macro equilibrium
-- E.g. interest rate conversion rules for nominal assets; de-indexation or de-dollarization of liquid assets; internal debt rescheduling between firms, banks and governments.
(4) Structural reforms: to remove micro-distortions (and tackle structural links with inflationary processes)
-- Liberalization and deregulation; fiscal reforms; financial sector reform
(5) Political reforms (where necessary).
--Consolidation of a fully-fledged democracy.

Bolivia’s hyperinflation
Bolivia shifted from low inflation, to moderate and high inflation and then to a spectacular hyperinflation in the mid 1980s (Figure 4). Understanding the features of this transition and how stabilization was managed is the central focus of the application we will discuss in class.
Figure 5. Inflation in Bolivia
Source: WDI
History and socio-political context
Bolivia is the poorest country in South America, with a highly diverse geography, from the Andes to the Amazon. Before the Spanish conquest, it had a sophisticated indigenous culture based in the high plateau, or altiplano. With the discovery of silver, mining became the major activity in the colonial era, that made a few people very wealthy over the centuries. Bolivia became agriculturally landlocked after it was on the losing side of the 1879-93 War of the Pacific with Chile, when it lost both access to the sea and rich nitrate fields. (See Map in Annex 1).
Bolivia is famous for its high levels of political instability, with 83 presidents and some 200 coups and countercoups since independence, and deep social fractures associated with a poor indigenous majority. A Mexican-inspired revolution in 1952 brought universal suffrage and some land redistribution, but failed to either fundamentally resolve the deep social exclusion and underlying conflicts, or create growth-supporting institutions. While land was redistributed, there was no radical redistribution of power in the society. Instead there developed new forms of patronage, alongside old forms of social exclusion. There are not reliable data on income distribution until the surveys of 1990s, that find Bolivia to be one of the most unequal countries in the world, close to Brazil in its overall inequality.
Following the Bolivian revolution there followed decades of continued political instability, marked by an alternation of power between “left” and “right” parties—the latter often associated with the military. (See the brief political chronology since 1952 in Annex 2). There was however, a consistent preference for state capitalism both by relatively populist “left” governments and more conservative, pro-elite “right” and military governments. The most severe cleavages in terms of social welfare and influence were between rural indigenous groups and urban elites of Spanish or mestizo descent. But the more salient social conflict was between mobilized working groups, notably the tin miners (also mainly indigenous), and political and economic elites. These conflicts were not resolved. Rather there was an in-built tendency to “solve” underlying tensions by the expansion of the state, backed, especially under military regimes, by repression. The relatively stable conditions under the first period of power of General Hugo Banzer between 1971 and 1978 indeed involve a repressive closure of the social tensions, channeling of state subsidies to favored economic elites especially in the lowlands, all underpinned by an unsustainable debt build up. This followed a halting return to democracy culminating in the accession of Siles Suazo to power in 1982
The path to hyperinflation
President Siles faced a volatile political situation, pent-up social and economic aspirations after years of repression. Siles was from the left wing of the MNR (the party formed around the Bolivian Revolution) and initially ruled with the support of organized labor. This meant support for wage settlements in line with inflation. As the crisis set in, the government was unable to sustain this, and protest moved to the street, with general strikes in both 1984 and 1985, that helped lead to the failure of the attempted stabilizations.
The key triggers for the crisis were two external shocks: the collapse of tin prices, and the radical shift in external debt flows. Export receipts from tin, the dominant export commodity, fell from US$235 million in 1980 to US$75 million in 1983. In parallel, there was a sudden stop of lending, as the debt built up became seen to be unsustainable (especially after the tin price crash) and lending dried up after the rise in world interest rates and the 1982 Mexican debt crisis. (A set of additional relevant data on the lead up to 1985 is given in Annex 3, based on a compilation of data prepared for a KSG case.) The net resource transfer from abroad shifted dramatically from 6.2 percent of GDP in 1980 to -6.9 percent of GDP in 1983. Much of the debt was to the public sector, creating massive problems for the public sector accounts: these lie at the heart of the fiscal dimension of hyperinflation described in the equations in the analytical context.
This provides the specific context for a classic dynamic of a rising inflation tax chasing a declining inflation tax base, whilst the traditional tax base was destroyed by the same rise to hyperinflation (Figure 6). As a share of GDP traditional taxes fell from 9 percent in 1980 to a mere 1.3 percent in 1985. With respect to the inflation tax, what is remarkable is the amount of resources raised—at between 2 and 5 percent of annual GDP per quarter (so 8-20 percent of GDP over a year)—and that the country seemed to stay on the rising part of the Laffer curve right into the peak of the hyperinflation in 1985 (Figure 7). In the race against declining demand for money, the Central Bank just stayed ahead, at the cost of the rising tax “rate”.

Figure 6. The tax base for the inflation tax (million U.S. dollars) and traditional taxes as a share of government spending
Year Monetary
base
Taxes/ Govt.
expenditures
1981 660 62
1982 225 17
1983 156 13
1984 167 8
1985 91.5 7
Source: Central Bank of Bolivia
Figure 7 Quarterly seignorage revenues as a percent of annual GDP
Source: Morales and Sachs, 1993
Several other features of the hyperinflation period are worth noting. Public spending also declined sharply, especially on public investment, but not by enough to create a surplus. Domestic prices became increasingly indexed to changes in the black market exchange rate. In contrast to Israel, other internal indexing broke down, and virtually all contracts shifted to the spot market. The government did maintain a different official exchange rate, that was persistently overvalued. It also maintained price controls on public sector goods, that included
flour and petroleum products. While there was enormous disruption, some people got rich: those who had access to foreign exchange at the official exchange rate could make killing, as could anyone who had access to government-backed low interest loans.
This was the situation faced by the new center-right government of Paz Estenssoro that came to power in 1985 and announced a “new economic policy” in August of that year.
Policy question on stopping hyperinflation
It is 1985. You are an international “expert” on macro-economic policy design and have been invited in by the new Bolivian government of President Paz Estenssoro to help design a stabilization program. This is a crucial moment for a socially fractured society with a fragile democracy. You are familiar with the history of hyperinflations (indeed, by a quirk of history, you may be familiar with the experiences of the Latin American and Israel stabilizations—successful and unsuccessful). The government is seeking your advice both on the managing the price-wage-monetary dynamics and how theses relate to underlying fiscal and social conditions. What do you recommend?
[As an alternative, pick any other high or hyperinflation episode and present a policy position. One ongoing contemporary high inflation episode of interest is that of Zimbabwe.]
Selected References. Barro, Robert and David Gordon. 1983. “A Positive Theory of Inflation in a Natural Rate Model.” Journal of Political Economy 91 (4): 589-610 Bruno, Michael. 1993. Crisis, Stabilization and Economic Reform – Therapy by Consensus. New York, NY: Oxford University Press. Dornbusch, Rudiger and Stanley Fischer. 1993. “Moderate Inflation”, The World Bank Economic Review 7(1).
Morales, Juan Antonio and Jeffrey Sachs. 1988. “Bolivia’s Economic Crisis.” NBER Working Paper #2620 Cambridge, MA: National Bureau of Economic Research

Annex 1 Map of Bolivia
Series 1980 1981 1982 1983 1984 1985 Population, million 5.36 5.47 5.59 5.71 5.84 5.96 GDP per head ($ at PPP) 2,472.50 2,322.60 2,266.40 2,183.50 2,472.50 2,322.60 Nominal GDP (US$ bn at PPP) 14.3 14.4 13.8 13.3 13.2 13.0 GDP (% real change pa) 0.3 -3.9 -4.0 -0.2 -1.7 Consumer prices (% change pa; av) 47.3 32.1 123.6 275.5 1,281.4 11,749.6 Total exports fob (m US$) 942.2 912.4 827.7 755.2 724.5 623.4 Total imports cif (m US$) 665.4 917.1 554.1 576.7 488.5 690.9
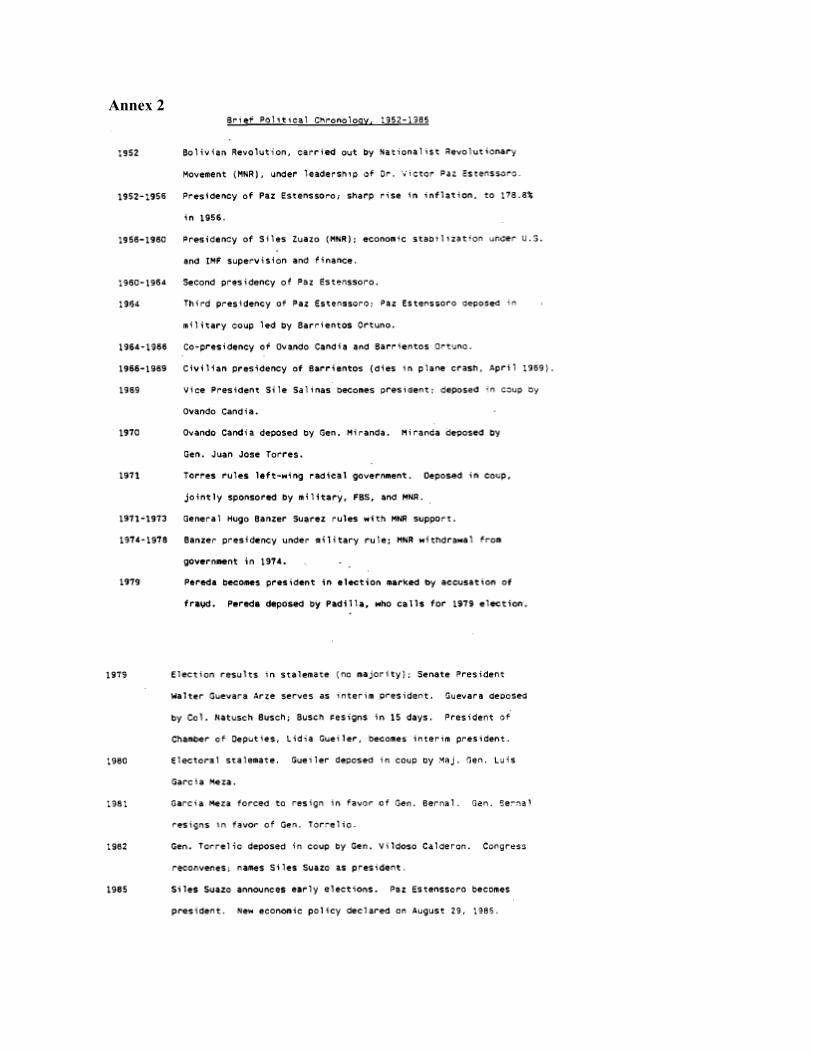
Annex 2