hiawatha light rail ridership reporting and fare compliance
TRANSCRIPT

Program Evaluation and Audit
HIAWATHA LIGHT RAIL
Ridership Reporting and Fare Compliance
May 15, 2007
2007-A09

2
INTRODUCTION
Background The Hiawatha Light Rail Transit Line (HLRT) began operation in June 2004 from downtown Minneapolis to Fort Snelling. In December 2004, the line was extended to the Mall of America and became fully operational. There are 17 stations in all beginning with the Warehouse District Station (# 1) and ending with the Mall of America Station (# 17). The Humphrey Terminal Station has been closed since September 9, 2006 due to construction. The rail operates daily from 4:00 AM until 2:30 AM of the following day. In general, Metro Transit operates 11 trains consisting of two cars each. However, scheduling of trains is adjusted down for fewer riders during the nighttime hours and up for additional riders during special events at the Metrodome.
The HLRT utilizes an open boarding system where riders can board trains freely without having to proceed through a fare collection barrier. Payment of fares is on the honor system. However, Metro Transit Police Department Officers randomly board trains and check passengers for proof of fare payment. Riders who have not paid a fare are subject to a citation and fine of $180 per incident. One challenge of an open boarding system is to establish the volume of ridership on the train each day, week and event. Without fare barriers, Metro Transit’s Revenue and Ridership Department relies on projection methodology where sample rides are chosen and counts taken to project ridership. Now that the HLRT has had two complete years of operation, it seems an appropriate time to examine the methodology for calculating rail ridership and ensuring passenger fare compliance.
Purpose This review was performed to assess Metro Transit’s methodology for collecting ridership information and projecting ridership counts. Activities conducted will verify the accuracy of ridership counts and assess the fare compliance of rail passengers.
Assurances This evaluation was conducted in conformance with the Standards for the Professional Practice of Internal Auditing (Institute of Internal Auditors) and Governmental Audit Standards (U.S. General Accounting Office).
Scope The evaluation of the HLRT ridership included an assessment of:
• The system for determining ridership counts, • Reported ridership, • Fare compliance procedures, and • Reported passenger fare compliance rate.
2007-A09

3
Data collection focused on calendar year 2006, although data for 2005 was also reviewed for comparison purposes.
Methodology To gain an understanding of HLRT ride counts and reporting, as well as fare compliance, and to verify the accuracy of data in published reports, the following methods of inquiry were used:
• Personnel were interviewed from various areas of Metro Transit, including Revenue and Ridership, Service Development and the Police Department.
• Observations and counts of riders boarding HLRT trains were conducted by Program Evaluation and Audit in October of 2006.
• Additional observation and ridership count data was obtained from the Service Development saturation counts of ridership conducted in November 2006.
• Data from Program Evaluation and Audit, Service Development, and Revenue and Ridership were reviewed, compared and analyzed.
• Fare compliance devices were tested for timeliness, accuracy and reliability. • Data collection and reporting practices of other light rail agencies were
researched.
2007-A09

4
OBSERVATIONS HLRT Ridership Weekdays Weekday ridership data is divided into three time periods: AM Peak, midday and PM Peak. Weeknight data is also captured. The associated number of HLRT trips is as follows.
Weekday AM Peak 41 oneway trips are conducted each weekday between 6:00 and 9:00 AM; 21 run southbound from the Warehouse Station to the Mall of America and 20 run northbound in the opposite direction.
Weekday midday 72 oneway trips are conducted each weekday between 9:00 AM and 3:00 PM; 36 southbound and 36 northbound.
Weekday PM Peak 51 oneway trips are conducted each weekday between 3:00 and 6:30 PM; 25 southbound and 26 northbound.
Weeknights (6:30 PM – 2:30 AM, 4:00 – 6:00 AM) 62 fulllength, oneway trips are conducted each weekday between 6:30 PM and 2:30 AM and between 4:00 and 6:00 AM; 28 southbound and 34 northbound. The HLRT does not operate between 2:30 and 4:00 AM. In addition, 5 fulllength equivalent trips are put back in service during the 4:00 to 6:00 AM time period. Six partial trips southbound begin service at Franklin Avenue and end at the Mall of America while four travel northbound beginning at Cedar Riverside and ending at the Warehouse Station.
The Ridership and Revenue (R&R) group within Metro Transit’s Finance Department samples HLRT trips to obtain ridership information. The goal is to sample, over each month, 20% of weekly scheduled HLRT trips, under the assumption that each trip in one week is identical to the same trip in other weeks. During the period May through November 2006, the actual number of trips sampled under the plan ranged from 7% to 18% of total weekly trips, averaging about 12%. This equates to sampling 1.7% 4% of total monthly trips with an average of about 2.4%. Metro Transit uses a three month rolling average convention when calculating rides to report for the current month. Ridership estimates are calculated daily using the two previous months reported rides plus all days of the current reporting month that have passed. For example, if today was September 20 th , current month estimates through September 19 th plus the reported rides for July and August would be used to determine the rides to report for September 20 th . The individual daily rides are added to determine the rides to report for each month. This
2007-A09

5
process is used because Metro Transit management personnel require current month estimates of ridership throughout the current reporting month.
Program Evaluation and Audit (Audit) counted passengers boarding trains on various days and at various stations during the period September 15 through October 23, 2006. In addition, Metro Transit’s Service Development Department (Service Development) conducted a weekday saturation count on November 3, 2006 where all passengers boarding all trains at all stations were counted. The difference between Service Development and Audit passenger counts are not significant. Therefore, the Audit data was the primary source of comparison with R&R reported ridership. For the seven month period May – November 2006, Audit estimates that R&R reported about 456,105 more rides than were actually taken during that period. The annualized result is that rides were overcounted by about 567,000. There is overall agreement that problems occurred in two areas; however, there are differences between R&R and Audit concerning the number of rides to be adjusted. Table 1 summarizes the discrepancies and their relative impact. In addition, there was a variance between Audit and R&R’s counts of 49,960 rides. This reflects a variance of approximately 1.4 riders per train which is well within the margin of error described under Sampling Techniques and Accuracy, below.
Table 1. Adjustments to R&R Reported Ridership May – November 2006 R&R Audit
Calculated ridership 6,114,297 5,708,152 Twins audit adjustment (252,557) Trip count adjustment (203,548) TOTAL RIDERSHIP 5,658,192 5,708,152 Variance 49,960
Total Adjustments (456,105) The adjustments made can be explained as follows:
Minnesota Twins Adjustment During baseball season, the Minnesota Twins play home games at the Metrodome adjacent to the Downtown East/Metrodome station. Games are played at either 12:10 PM or 7:10 PM. Rides taken to and from Twins games are counted separately by R&R as special events. However, our review of the trips sampled by R&R disclosed that some sampling trips began during a period two hours prior to the start of a game or within two to four hours after the start of a game. For example, the Twins played a 7:10 PM game on Friday, July 28, 2006. Metro Transit included a calculation of riders going to and from the Twins game in their special event ridership count. At the same time, two southbound trains leaving at 9:58 PM and 10:13 PM were included in ridership sampling that generates the daily ridership numbers. The double count is apparent in reviewing the data. The two rides on July 28 had 413 and 345 riders, respectively. Similar southbound passenger counts taken during June, July, October and November averaged only 67 passengers per trip. Including trips taken during an event like a Twins game would be
2007-A09

6
appropriate if ridership were determined purely by sampling. However, R&R isolates special events and counts them separately. Any ridership counts taken during those same periods can result in counting the same passengers twice. As a result, we estimate that during the period from May through October 2006, about 165,000 rides were double counted as both special event rides and weekday rides. Another 88,000 rides were double counted due to the July Twins over count being carried forward into August and September through the three month rolling average reporting convention. R&R calculates this total adjustment to be approximately 212,000 rides, slightly lower than the Audit figure.
Trip Count Adjustment When Metro Transit opened the Hiawatha line in 2004, 49 peak and 75 midday trips were scheduled. In March 2006, trips were reduced to 41 and 72, respectively. Calculations used to determine monthly rides from May through November 2006 used the old number of trips, resulting in overreporting HLRT rides by about 204,000 during this seven month period. R&R calculates that this adjustment is approximately 187,000, again somewhat lower than the Audit calculation.
Sampling Techniques and Accuracy This section addresses statistical techniques for measuring the accuracy of sample averages as well as the accuracy of R&R sampling. Audit statistically analyzed R&R ridership estimates to ascertain the accuracy of R&R sampling techniques. R&R estimates were also compared to the average ridership found by the Service Development saturation count. When sampling is used to measure average ridership, there are several statistical tools that help measure the reliability of the sample average. These tools include standard error, margin of error and confidence interval. The standard error determines the accuracy of the sample average by measuring the variability in sample observations. A smaller standard error indicates a more reliable sample average. While it is not always possible to observe homogenous data in order to decrease the size of the standard error, it is possible to reduce standard error by increasing the sample size.
Margin of error and confidence interval are both calculated from the standard error. They also both depend on the confidence level, the most common of which is a 95% confidence level. The 95% confidence level means that the corresponding confidence interval will include the real average 95% of the time. The confidence interval provides a range of numbers estimated through sampling that is likely to include the true average, and the confidence level indicates that likelihood in statistical terms. The margin of error is equal to about twice the standard error and is added and subtracted from the sample average to determine the confidence interval. See Appendix A for a more detailed discussion.
Audit examined R&R sample data collected during November 2006 to ascertain the accuracy of ridership estimates. Service Development data was also collected in November, making that month the best basis for comparison. Only sample data from weekdays was examined as night and weekend data is not regularly collected given
2007-A09

7
staffing difficulties. R&R divides the day into AM Peak, Midday and PM Peak for the purpose of estimating average ridership. Audit compared Service Development data from comparable time periods to R&R estimates. Table 2 presents the R&R and Service Development ridership averages, as well as the difference between the two and the R&R acceptable margin of error. The 95% confidence level was used to calculate the margin of error as that is the most common level. For example, the 95% confidence level is required for reporting ridership numbers to the Federal Transit Administration’s National Transit Database (NTD), although the data examined here was not restricted to NTD data.
Table 2. R&R Ridership vs. Service Development Estimates for November 2006, Difference Compared to Acceptable Margin of Error (R&R) Time R&R
Boarding Averages
Service Development Boarding Averages
Difference (R&R – Service)
R&R Margin of Error (95% level)
AM Peak 127.85 122.71 5.14 23.18 Midday 96.61 99.35 2.74 7.43 PM Peak 150.56 136.29 14.27 25.30
Audit used the margin of error for R&R sample data to test whether the differences between R&R and Service Development ridership averages were significant. Given that the margin of error is calculated using a 95% confidence level, there is only a 5% chance that the Service Development average would be different from the R&R average by an amount greater than the margin of error (in absolute terms). The current sampling techniques appear to be sufficient according to this test given that the differences between R&R and Service Development averages are all less than the margin of error in absolute terms.
According to R&R estimates, the average boardings during the AM Peak hours are 128 people plus or minus 23 people per trip, given the margin of error. The average boardings during Midday are 97 people plus or minus 7, and the average PM Peak boardings are 151 people plus or minus 25. Audit found that sample averages for AM Peak and PM Peak are less accurate than Midday estimates as indicated by the margin of error. This is due to the large variation in boardings during AM and PM Peak times.
Increasing the number of sampled trips during peak hours would decrease the margin of error and increase the reliability of ridership numbers. R&R currently samples as many train trips as is possible based upon the availability of the two employees who perform the counts.
Another way to decrease the margin of error is to combine AM Peak and PM Peak sampling for the purpose of internal reporting. Doing so effectively doubles the sample size without any additional sampling of trips. Table 3, below shows the average ridership and margin of error after combining AM and PM peak samples.
2007-A09

8
Table 3. Ridership Reported and Margin of Error with Combined AM and PM Peak Time R&R
Boarding Averages
Service Development Boarding Averages
Difference (R&R – Service)
R&R Margin of Error (95% level)
Peak 140.51 130.24 10.27 17.53 Midday 96.61 99.35 2.74 7.43
Combining AM and PM Peak samples decreases the margin of error to about 18 people per trip, where it was previously 23 and 25 people per trip for AM and PM Peak periods respectively.
The example above is only one way to decrease the margin of error. Any method that increases the number of ridership observations would have similar positive effects in decreasing the margin of error and making the sample average more accurate. While such methods may not be appropriate for NTD reporting, they could be used to estimate ridership for internal reporting.
Ideal Sampling Due to staffing restrictions, R&R currently relies on availability sampling for many HLRT ridership observations. Availability sampling can result in biased statistical estimates and its practice is inferior to the use of random sampling. The ideal sampling of HLRT would be the random selection of train trips from all available train trips. Night, weekend and early morning trips would be selected as well using a random selection model. Currently, these times of ridership are sampled by R&R less frequently or not at all, raising the risk of reporting incorrect ride counts.
2007-A09

9
Best Practices: Passenger Counts for Other Light Rail Systems There are 25 revenue generating light rail agencies currently operating or under development in the United States, according to the NTD. The majority (13) of currently operating systems uses proofofpayment or open boarding systems like the HLRT. Given that riders do not enter through turnstiles, most of these systems depend on sampling techniques to determine ridership. Sampling requires that passengers be counted on randomly selected train trips.
All light rail agencies report ridership statistics to the NTD. The NTD currently requires that all reported ridership numbers estimated through sampling have a 95% confidence level and a precision level (margin of error) of plus or minus 10%. Both the confidence and precisions levels are mainly determined by sample size. Transit agencies can sample on a monthly or quarterly basis to be able to draw the necessary sample size. For example, Dallas currently draws a sample from all train trips in a three month period to have a greater level of precision in its sampling. NTD accepts both manual sampling with individual counters and machineaided sampling using Automated Passenger Counters (APCs). According to a June 2006 survey conducted by the Sacramento Regional Transit District, six light rail agencies currently determine ridership using APCs (see Table 4). Half of these agencies employ APC technology in all light rail cars (Houston, Seattle and St. Louis), and the other half use APCs only in selected cars (Denver, Portland and San Jose). Both Houston and San Jose continue to employ manual ridership counters in addition to the APCs.
Table 4. Light Rail Agencies Employing APC Technology Agency APC
Coverage # Rail Routes
Operating Expenses
Annual Trips
Svc. Area Population
Year Est.
Sound Transit (Seattle)
All vehicles 1 $5,707,004 398,580 1,788,300 NA
METRORail (Houston)
All vehicles 1 $14,134,691 5,349,726 2,796,994 2003
RTD (Denver) 70% 3 $21,689,060 10,028,459 2,545,000 1994 Metro (St Louis) All vehicles 2 $36,293,685 14,509,522 1,480,365 1993 VTA (San Jose) 20% 2 $45,752,516 5,473,024 1,731,400 1987 TriMet (Portland) 25% 3 $56,965,750 31,516,208 1,253,502 1980 Sources: 2004 NTD Agency Data, 2006 Sacramento Regional Transit District Survey, Agency websites.
The survey reported 11 agencies that manually count ridership on randomly selected trains, including Metro Transit (see Table 5). Of those 11, two contract out ridership counts (San Diego and Dallas). The other nine agencies employ ridership counters in house, although the survey does not specify whether ridership counters are full or part time workers. Metro Transit employs the smallest number of ridership checkers.
Background information for light rail agencies is taken from the NTD as well as individual transit agency websites. Please note that operating expenses, unlinked passenger trips and service area population are for the year 2004. Ridership numbers and expenses are most likely higher today, particularly for agencies just establishing light rail service around 2004 such as HLRT.
2007-A09

10
Table 5. Light Rail Agencies Employing Manual Ridership Counts Agency #
Checkers # Rail Routes
Operating Expenses
Annual Trips
Svc. Area Population
Year est.
Ratio Trips/Chec ker
Muni (SF) 16 5 $105,899,508 45,187,031 792,700 1920 2,824,189 UTA (Salt Lake)
4 2 $80,052,740 10,019,863 1,744,417 NA 2,504,966
Metro Transit (Mpls)
2 1 $8,367,914 2,938,777 1,780,649 2004 1,469,389
Port Authority (Pittsburgh)
7 4 $35,589,571 6,654,554 1,415,244 1987 950,651
METRO (Buffalo)
6 1 $18,271,154 5,478,002 1,182,165 1985 913,000
MTA (Los Angeles)
50 3 $111,654,283 32,852,335 8,493,281 1990 657,047
SEPTA (Philadelphia)
45* 9 $46,088,287 25,158,140 3,325,435 1970 559,070
RTA (Cleveland)
8 2 $12,765,722 2,560,710 1,412,140 1920 320,089
SDT (San Diego)
Contract 3 $41,830,450 26,538,239 2,102,396 1981 NA
NJT (Newark)
NA 6 $54,713,647 9,868,904 17,799,861 2002 NA
DART (Dallas)
Contract 3 $57,023,065 16,375,995 2,224,300 1996 NA
* = temporary checkers. Sources: 2004 NTD Agency Information, 2006 Sacramento Regional Transit Survey, Agency websites.
APC Accuracy APCs offer a convenient method of sampling for statistically accurate ridership data. It can be difficult to manually collect data for night, weekend and early morning train trips due to staffing difficulties. R&R currently struggles with staff availability at these times. APC technology allows light rail agencies to gather ridership data 24 hours a day as it does not rely on the presence of staff. While the technology is new and there is understandable concern over its accuracy, there is some preliminary data on its success on light rail. Audit identified two sources of APC accuracy data: Houston METRORail testing and an academic paper examining the Portland TriMet APC system. Houston METRORail conducted testing in 2004 to measure the accuracy of their new APC system. Houston uses an APC unit with Infra Red Motion Sensors and Analyzers (IRMAs) by INIT. INIT advertises an error rate of less than 5% for all passengers, and less than 10% when counting boardings or alightings only. APC units were installed in all Houston light rail vehicles by April 21, 2004. Manual counts were conducted and compared to APC ridership estimates in the months of April through September 2004. Ridership data was examined for weekday and special events. According to the testing, APC units counted 2.61% fewer passengers on average compared to manual counters. The largest variances occurred in special event counts.
2007-A09

11
The APC counted 8.5% fewer riders for a baseball game in July, and 4.54% fewer riders for a football game in September.
The Center for Urban Studies at Portland State University examined the TriMet APC system in 2005. TriMet employs IRMA APC units manufactured by irisGmbH in its light rail vehicles. The paper compared manual passenger counts of boardings and alightings to APC counts. The research found that the APC units undercounted boardings by 5.4% and over counted alightings by 6.9%. The authors recommended adjustments to the APC mechanism to fix this systematic error.
Although these are the only agencies with actual test data on APC accuracy, many others report that they believe the APCs are at least as accurate as manual methods, or more so. APCs may not be the only answer for problems in collecting accurate ridership data, but they can be a valuable tool, especially when used in concert with manual methods to provide additional sampling data where manual efforts may be difficult or impossible.
Fare Enforcement on HLRT
Metro Transit Police Department Under the HLRT’s open boarding system, although there is no ticket taker or scanner before entering the train, passengers are expected to buy their tickets on the platform or utilize other allowable fare media, such as bus transfers to rail, to pay their fare (see Appendix B). To encourage fare compliance, there is a fine of $180 that can be assessed if a passenger is found on the train without a ticket. The Metro Transit Police Department (MTPD) is responsible for fare enforcement on the HLRT. Officers regularly ride trains and check passengers for tickets documenting paid fare. At the same time, the officers’ primary responsibility is always public safety. So, fare enforcement activities can be interrupted by felony arrests, assaults or other immediate concerns to which police officers must respond.
During the months of September and October 2006, Audit staff rode 98 trains to observe ticket enforcement practices on the HLRT as well as MTPD presence on the rail line. We observed the MTPD conducting fare checks approximately 9% of the time and observed the presence of officers on the line (at stations or on trains) approximately 39% of the time. MTPD officers maintain logs of the number of passengers checked for fare compliance, the number of tickets issued, the number of warnings issued, and the number of arrests made during each shift. Audit staff rode along with MPTD officers on several shifts in January 2007 to gain insight on how the enforcement system worked and how the officers viewed their duties. We walked with officers during the periods 6:00 AM – 10:00 AM, 10:30 AM – 2:00 PM, 3:00 PM – 6:30 PM, and 6:30 PM – 10:00 PM. We collected fare enforcement data which we then compared to data collected by MTPD in October 2006 during the time of our ridership data collection. For October 2006, excluding special events, MTPD conducted fare compliance checks on 2,556 trains. They checked 64,555 passengers for fare compliance, issued 285 warnings
2007-A09

12
and 181 citations. The fare compliance rate was 99.3%. Audit found that the reported compliance rate was consistent with our observations in January 2007. As part of their fare enforcement activities, MTPD Officers took 14 individuals into custody, including a runaway and several individuals with current warrants. Each time a person is taken into custody, the MTPD officer spends about 90 minutes processing the prisoner, thereby removing that officer as a presence on the trains.
During our observations, we found the officers to be very courteous when dealing with the commuters. They explained the proper way to utilize various fare media to many customers. The officers issued warning tickets in instances where they felt the customer had a legitimate reason for not having the proper fare. We also noted that the presence of the officers deterred some people from boarding the train or entering the platform. It is possible that these individuals decided not to board when they realized that they might be ticketed and fined for not having a ticket or evidence of a paid fare. In addition to the officers regularly scheduled to perform compliance checks, the MTPD has conducted concentrated enforcement sweeps. In September, the MTPD conducted four saturation details on four separate dates, three evenings and one day. Both uniformed and plainclothes officers were used. If passengers left the train or failed to board when a uniformed officer entered, the plainsclothes officers checked those who remained on the platform or got off the train. In all 5,375 passengers were checked during the saturations and compliance rates were 99% during the day and 96% at night.
The MTPD conducted a more limited sweep in January, focusing on a single station where reportedly many riders boarded without paying fare because the MTPD presence was limited there at that time of day.
Handheld Inspection Terminals The MTPD has 16 handheld inspection terminals (HIT machines). The machines are used to read and validate “smart cards” used by commuters, including Metropasses and a limited number of stored value GoTo cards. This relatively new fare media has expanded in use and is expected to continue to do so as Metro Transit moves toward fully implementing smart card farecards throughout the system. MTPD officers should have a HIT machine with them when conducting fare enforcement work. During our observations, we found that the machines were used less than 1/3 of the time. MTPD officers indicated to us that the machines often did not work and because of that, the officers did not take the machines with them on the train. Audit noted that when we visited the MTPD on February 1, 2007, 12 of the 16 machines were not working. The HIT machines were plagued with problems since they were first put into use. The project manager for Cubic, the contractor for the new smartcard system, had been handling HIT machine problems personally and visiting the MTPD weekly through much of 2006. Since early November 2006, the project manager was reassigned and the issues with the HIT machines did not receive as much attention. After the MTPD tested their HIT machines and found only four working properly on the day we visited, Metro Transit’s Revenue Operations Department worked on the machines and were able to repair 7 machines so that 11 of the 16 were in working order within 23 days. Two weeks later, Audit conducted tests on the machines and found only nine working properly. Of
2007-A09

13
the nine that were working, five had to be rebooted, a process that takes between 2 and 5 minutes, before they were functional. Revenue Operations indicated that 34 machines needed new backup batteries, even though all of the machines had new backup batteries installed in November 2006 and, according to the vendor, backup batteries should last for 35 years. Having batteries fail prematurely in 34 of 16 machines is an unacceptably high rate of error.
In addition, review of the manual for the HIT machines, revealed that the machine’s performance can be severely impaired by moisture and belowfreezing temperatures, which are common occurrences in Minnesota. It seems odd that MTPD would be given these as fare enforcement tools for light rail riders when the machines are unreliable.
During the first months of use, the MTPD logged the issues they had with the HIT machines. After a few months, they were told not to keep the logs; the issues would be resolved with weekly visits from the project manager. The weekly support is no longer in place and no formal procedures have been implemented to document the issues with the HIT machines or the corrective actions taken. The HIT machines are an integral part of fare enforcement with the emergence of smartcards. There are 25,212 Metropasses and 3,113 non metro pass/college cards currently in use. As more fare media are converted to smart cards, it is imperative that these machines have the confidence of the MTPD officers and are used consistently. Although most of the current smartcard volume is prepaid, there are a growing number of smartcards that are no longer valid (expended, stolen, etc.). It is estimated that since April of 2004, 7,850 cards have been “hotlisted” or categorized as invalid. Lacking the ability to consistently and accurately assess the validity and use of smartcards during fare checks, there are opportunities for free riding passengers that are likely to result in high rates of fare evasion without consequences.
Juvenile Offenders The MTPD has been assigning officers on a regular basis to perform ticket checks at platforms in the vicinity of several area high schools. This has become a very labor intensive deployment of officers on a daily basis. The MTPD has asked the various schools for assistance and some schools have provided staff to help control students and ensure fare compliance, but the workload for MTPD remains high.
Juvenile fare evaders create an exceptional amount of work for the officers. When a juvenile is ticketed, reports are required at both MTPD and either the Bloomington or Minneapolis Police Department, depending on jurisdiction. Officers estimate that juvenile reports take nearly twice as much processing time as adult reports. When convicted, juvenile offenders may be required to perform community service, but one officer felt that was little consequence for failing to comply with fare regulations.
2007-A09

14
CONCLUSIONS
1. The sampling method for calculating and reporting light rail ridership is generally adequate. However, problems that occurred in 2006 point to inadequate controls on the methodology and calculation of the numbers.
Generally, the statistical sampling being done by Revenue and Ridership is sound. However, calculation errors indicate poor reporting controls. R&R over reported HLRT ridership to Twins games attendees in 2005 by about 189,000 or 2.4%. Added to this systemic error, in 2006, was a double counting of riders due to a July Twins over count being carried forward into August and September through the three month rolling average reporting convention and an isolated error, a change in vehicle deployment, that significantly affected the reported numbers, and resulted in overcounting riders by about 6% for the year. For the seven month period reviewed, when these errors occurred, the error rate was 7.5%.
The responsibility for developing methodology, calculating ridership, analyzing and reviewing data and reporting ride estimates lies with a single person. That individual also does a similar process to report NTD ridership on bus and rail. This makes it unlikely that errors made, like those listed above, will be promptly noticed and rectified. Ridership is perhaps the most important performance indicator for Metro Transit. Its development and calculation could be better controlled and more frequently reviewed for possible omissions and errors.
2. Tools and techniques are available to provide more and better data about ridership and would reduce reliance on sampling and manual errors and decrease the error rate for calculation of ridership.
There are several limitations for the current sampling methods used by Metro Transit: controlling counts around special events to avoid overcounting, availability of staff to do the counts throughout the schedule, including nights and early mornings, and inherent limitations of having only two individuals to conduct counts on trains and/or platforms that are full. Audit’s comparison with other transit agencies shows that among agencies using manual ridership counts, Metro Transit has one of the highest ratios of trips to counters. Only San Francisco and Salt Lake City have more trips per checker than Metro Transit does. Six other agencies developing light rail in other metropolitan areas are relying on APCs to collect sample data and not staff. Also, the current split of rides between AM Peak, PM Peak and Midday complicates sampling, and serves to increase the error rate for the calculation.
3. Fare compliance is currently at an acceptable rate.
Based on MTPD logs and Audit observations, fare compliance on the HLRT is at a very high rate, generally between 96% and 99%. It appears that the combination of fare
2007-A09

15
compliance checks and sweeps, together with the significant fine for fare evasion, have created incentives for most passengers to pay their fare.
4. The HIT machines are unreliable, inconsistent, and prone to malfunction. HIT machine error rates could affect prosecution of fare evasion as well as create a new incentive to ride without paying the fare.
Given the increasing reliance on the new smartcard fare collection system, the HIT machines are becoming a critical tool for MTPD Officers to enforce fare compliance on the trains. Fare cards must be swiped at the train station to ensure that appropriate fares have been paid and tracked for all card users. Without a dependable HIT machine, there is no way to determine if a Metro Pass, Stored Value Card or other smartcard farecard is valid, if it was swiped at the time of boarding to deduct the fare, or if it is hotlisted as a stolen or missing card.
More than 33% of the HIT machines were not functioning properly during Audit’s testing of the machines. The backup battery performance is substandard. No documentation was available about what problems have been addressed by the contractor or how they were addressed. MTPD officers sometimes resist carrying the HIT machines because many think the machines are never ready or capable of performing for an entire shift.
2007-A09

16
RECOMMENDATIONS
Program Evaluation and Audit recommendations are categorized according to the level of risk they pose for the Metropolitan Council. The categories are:
• Essential – Steps must be taken to avoid the emergence of critical risks to the Council or to add great value to the Council and its programs. Essential recommendations are tracked through the audit database and status is reported twice annually to the Council’s Audit Committee and the Regional Administrator,
• Significant – Adds value to programs or initiatives of the Council, but is not necessary to avoid major control risks or other critical risk exposures. Significant recommendations are also tracked with status reports to the Audit Committee and Regional Administrator.
• Considerations – The recommendation would be beneficial, but may be subject to being set aside in favor of higher priority activities for the Council, or it may require collaboration with another program area or division. Considerations are not tracked. Their implementation is solely at the hands of the management.
1. (Essential) Metro Transit should strengthen its internal controls to ensure that ridership data is appropriately gathered and reviewed prior to the final release of any numbers. One isolated error (trip counts) and one systemic one (Twins game attendees) resulted in reporting nearly ½ million more riders than there were for the system in 2006. For the sevenmonth period reviewed, this constitutes over reporting by approximately 7.5%. Annualizing the errors for 2006 ridership in total reduces the percentage over reported to 6%, but that rate is still too high. Ridership is the most frequently cited performance indicator for the transit system, making it critical that the information be subject to some secondary review to ensure that no errors or omissions are overlooked in calculating the number to be reported. Having all of the responsibility residing primarily with one individual increases the risk of errors influencing reported ridership.
Metro Transit should create a structured process for preparing and reviewing the data involving more than one person to perform the analysis and reconciliation. Although this may require investing more resources in this function, in the long run, it is imperative to have adequate staffing and sufficient controls in place to provide a reasonable assurance of accuracy of the ridership calculations.
Management Response: This review was performed by Internal Audit to assess Metro Transit’s methodology for collecting ridership information and projecting ridership counts. Due to the fact that Metro Transit is a barrier free system, a methodology for ridership estimation was developed for the operations of Hiawatha Light Rail. We are very pleased by the conclusion reached by Internal Audit that the statistical sampling method used for calculating and reporting light rail ridership is sound and is generally adequate.
2007-A09

17
Internal Audit identified two count variances: Trip Counts and Twins game attendees. We have reviewed these variances with Internal Audit and do agree each of these items is a noted variance, but have calculated different amounts for each count variance. The differences noted by Metro Transit are detailed below. a) Twins Game Attendees: Metro Transit performs two types of sampling of trips
and ridership during the calendar year. (1) FTA Trips are statistically randomly selected and are counted for use in FTA reporting. (2) Additional Other Trips are selected during the year to approximate a total of 20% of the weekday trips. These trips are selected to fill in times between the FTA statistically selected trips. Upon review, Metro Transit does concur that performing ridership counting around the times of special events like Twins games may have an impact on ridership estimates. Metro Transit has reviewed all of the Special Events ridership counts for 2006 and has identified those counts that may have impacted the overall ridership estimates. Based on this detailed analysis, Metro Transit has calculated the potentital Special Events Ridership Impact for the period at 212,496 rides all based on the exact date of the respective games and the exact count included for the special event ridership. Internal Audit estimated the Special Events Ridership Impact for the period at 252,557 rides. Metro Transit does agree and has adjusted its procedures and will not include any ridership counts for approximately 2 hours before or 4 hours after the start of a special event. Metro Transit has discussed their calculated count variances with Internal Audit and have come to agreement the Metro Transit adjustment be used as it is based on the exact date of the respective games and the exact count included for the special event ridership.
b) Trip Count: When the Hiawatha Light Rail opened in June 2004, the schedule included 49 peak and 75 midday trips based on run times and number of trains available for service. This level of trips has remained consistent through February 2006. Based on Service Scheduling review of service and measures to obtain financial efficiencies in provided service, in March 2006 headway run times and two car consist trains were adjusted to meet ridership demand and also to reduce overall operating expenses. These adjustments reduced the total number of peak and midday trips operated, and were not known by the revenue and ridership department. Metro Transit does agree that the change in trips operated resulted in an unknown trip adjustment ridership difference. Metro Transit has adjusted its procedures and will review the trip schedules with Service Scheduling during each quarterly Operator Pick to ensure the number of scheduled trips is used in the ridership sampling. Internal Audit estimated the Trip Count impact for the period at 203,548 rides. Metro Transit has recalculated this difference by month based on the number of trips and based on the exact counts used for that month and has calculated the trip count adjustment for the period at 186,574 rides. Metro Transit has discussed their calculated count variances with Internal Audit and have come to agreement the Metro Transit adjustment be used as it is based on the exact number of trips and ridership counts for each month.
2007-A09

18
Based on the above count variances noted above, Metro Transit and Internal Audit have agreed to the following ridership adjustments for calendar year 2006 and for all financial reporting.
Total Ridership Adjustment noted by Internal Audit: 456,105 Special Event Adjustment: (40,061) Trip Count Adjustment: (16,974) Final 2006 Ridership Adjustment: 399,070 Original Reported 2006 Rail Ridership: 9,356,982 Less Ridership Adjusted (399,070) Final 2006 Rail Ridership: 8,957,912
Metro Transit is reviewing its rail ridership counting and reporting procedures and is reviewing current controls with the goal of strengthening monthly and annual reporting. In addition, Metro Transit is working closely with Internal Audit and has already had a meeting to discuss methods that can be used to improve and strengthen rail ridership counting methods.
2. (Essential) Metro Transit should work with Cubic Systems, the contractor for the HIT machines and ensure that HIT machines are consistently functional, reliable and timely for checking validity of farecards on light rail trains. Visible enforcement and stiff penalties for fare violations have created an environment where fare evasion is fairly uncommon; 9699% of rail passengers pay their fare correctly. However, the deterrent effect will be lessened if MTPD Officers are unable to consistently validate farecards and handle violations, which could include hotlisted cards, passengers who have stored value cards that they have not tagged to pay the fare, and cards that are out of money. If enforcement of the smartcards is hampered, it could increase fare noncompliance and creates a risk of allowing free riding by passengers who understand the system and its weaknesses.
The HIT machines are currently unreliable. They have demonstrated hardware problems, including batteries that repeatedly fail, no functionality in below freezing temperatures, and inconsistent performance in damp weather conditions. Also, software problems have resulted in frequent rebooting, time discrepancies that affect whether a given card is read as valid or invalid, and inconsistent results for some screens showing detailed card history. All of the problems should be logged, “fixes” noted as they are performed, and later performance tracked to make sure that all major issues are resolved.
As GoTo cards grow in usage on the rail, it is imperative that the cards not hamper effective fare enforcement by the MTPD to ensure that Transit continues to have high rates of fare compliance among rail passengers.
Management Response: Metro Transit is currently working on the operability issues with the HIT machines. Metro Transit repair staff are in close contact with the police department to ensure continued operability of the HIT machines. Each machine malfunction is being individually tracked from notation of an issue to resolution. This
2007-A09

19
tracking will also allow Metro Transit to identify any repair trends with the HIT machines. Metro Transit is also working very closely with Cubic and has been able to expedite the repairs on some nonfunctioning pieces of equipment. This close monitoring measures by Metro Transit Repair Staff and the Police Department will help to ensure continual fare inspection with continued high rates of fare compliance among rail passengers.
3. (Significant) Metro Transit should implement changes to the current calculation methodology to minimize potential errors. The use of manual counting and restrictions of staffing physical counts at odd hours and at some events increases the possibility of errors occurring within the sampling routine. To try to minimize that risk, Transit should implement changes to lessen the error rate. Some possibilities discussed in this report include combining morning and evening peak into a single group for sampling purposes, increasing the number of trips sampled and working with other Metro Transit departments collecting ridership information, such as Service Development (saturation counts) and the MTPD (passengers and violations data) to have more data for use without deploying additional resources to collect it. Currently, the MTPD data is only used to determine compliance rates. Although Service Development has not planned any further saturation counts, performing such counts on an annual basis would provide valuable comparison data to analyze the accuracy of the ridership calculations made by sampling.
Management Response: As previously stated, Metro Transit is pleased the statistical method used for calculating and reporting light rail ridership is sound and is generally adequate. Also, Metro Transit is working closely with Internal Audit and has already had a meeting to discuss methods and recommendations. The goal of any improvement to the process will be to strengthen the overall statistical validity of all methodologies used for collecting ridership information and projecting ridership counts.
4. (Significant) Metro Transit, the MTPD and Service Development should develop a standard set of assumptions to use for counts on full trains. In the course of our review, we saw virtually all counters, whether from R&R, Service Development or the MTPD, use estimates of ridership on full trains because it was difficult, if not impossible, to count every individual on a full car. The assumptions used, however, are significantly different even among colleagues in the same Division. Metro Transit should provide a list of standard assumptions, like “A full car is about 160 passengers,” so that all parties count those trains consistently, thereby decreasing the likelihood of errors and inconsistency among the data collected.
Management Response: Metro Transit will work to develop a consistent set of standards and assumptions to use when estimating ridership. This will also help to
2007-A09

20
strengthen the overall statistical validity of all methodologies used for collecting ridership information.
5. (Significant) Metro Transit should include a provision for variance reporting to adjust the three month rolling average that is reported to the actual monthly count when it is available. The most current three month rolling average is used to calculate rides reported for the current month. Variances occur between the number reported and the actual estimate once current month rides are calculated, yet there is no provision to account for such variances.
Management Response: Metro Transit has analyzed the impact of the 3 month average versus the monthly count for the entire annual year 2006. Based on this annual detail analysis, Metro Transit has calculated the estimated impact of the 3 month average versus the monthly count for the Annual 2006 at 32,000 rides. If ridership is consistent with seasonality and impacts of events, ridership differences will diminish over an annualized period of time. Metro Transit is going to review this proposed change in methodology and will review any impacts from moving from a 3 month average versus a monthly count.
6. (Consideration) Metro Transit should consider using APCs to help gather additional ridership data and add samples to decrease error rates and provide a basis to help validate ridership reports. APCs have limitations, but many appear to operate within the NTDmandated rate of error and could provide additional data without requiring additional counters or sampling in difficult circumstances like overly full trains at special events or late nights.
As Metro Transit looks ahead toward more rail projects in the future, given the limitations and expense of staffing manual checks, beginning to deploy APCs and determining the best way to utilize them in the current and future fleet of light rail vehicles is worthwhile.
Management Response: Metro Transit has included a capital project in the 2007 Capital Budget for Automatic Passenger Counters for LRV’s. Metro Transit is reviewing APC’s to determine if the technology has matured and is ready for installation on light rail vehicles. Metro Transit will also be contacting other transit properties to gain knowledge and information from their utilization of APC’s.
2007-A09

Appendix A
21
Statistical Methods
Standard Error, Margin of Error and Confidence Interval and
Linear Regression When sampling is used to measure average ridership, there are several statistical tools that help measure the reliability of the sample average. These tools include standard error, margin of error and confidence interval. Linear Regression is used to project ridership. A detailed description of each will be provided below. The standard error will be addressed first as margin of error and confidence intervals are extensions of the standard error measure. Linear Regression will be addressed last as a method for projecting weekday night and Saturday and Sunday ridership.
Standard Error The standard error estimates the accuracy of a sample average. When an average is based on sampling, as is the case with light rail ridership, it is subject to chance variability. Chance variability means that sample data will be different depending on selected observations. In the case of light rail, this simply means that one will observe different ridership numbers based on the trains that are selected for a sample, which affects the calculation of average ridership. The standard error is calculated to get an idea of how much average ridership could vary based on the selection of one train trip and not another. A large standard error means that there is a lot of variability in the observations of the sample, and therefore the sample average is not very accurate.
There are two factors that affect the size of a standard error: 1) the variation in sample observations and 2) the number of observations in a sample. If the observations in a sample are very different from one another, then the standard error will be larger because the data is more ‘spread out.’ However, increasing the size of the sample can decrease the standard error. A numerical example of standard error is provided below.
Station A Station B Observation # Boardings Boardings
1 25 100 2 21 52 3 22 89 4 25 90 5 19 22 6 27 55 7 22 156 8 22 50 9 21 98
Average 22.67 79.11 Standard Error 0.83 13.10
In this example, we are hypothesizing that two samples have been taken to measure the number of people boarding light rail at two different stations. For each sample, nine trains were randomly selected and boardings were counted on the selected trains.
2007-A09

Appendix A: Statistical Methods 22
At Station A, the observations in the sample are relatively homogenous, particularly when compared to the boardings at Station B. At Station A, boardings only varied between 19 and 27 people, whereas at Station B the boardings ranged between 22 and 156 people. Because there is much more variation in the Station B sample, the standard error is greater than for the Station A sample. The standard error is less than one at Station A whereas the standard error is over 13 for the Station B sample.
The standard errors indicate that the sample average of boardings is much less accurate for Station B than for Station A. Increasing the number of observations in the sample for Station B would increase the accuracy of the average ridership estimate. How a standard error is calculated can further display what causes it to increase or decrease. The equation for calculating standard error is explained below.
N obs avg
dardError S ∑ − =
2 ) ( tan
Avg = average of data Obs = observed data point
∑ = Sum N = number of observations
To find the standard error, you subtract each observed number of boardings in the sample from the sample average, square the difference between the two, repeat this process for every observed data point, and then add all the numbers together and take the square root. Finally, you divide this number by the number of observations.
Understanding exactly how to calculate the standard error is not particularly important. Most of these calculations are done by computer. However, the point of explaining the equation is to outline the two factors that increase the size of a sample standard error. The first factor is the difference between the sample average and each observation in the sample. If the observed data varies greatly from the sample average, the standard error will be quite large. The second factor is the number of observations in a sample. If a sample has many observations, the standard error will be smaller than if a sample had only a few observations. In sum, there are two ways to make the standard error of a sample smaller: 1) observe homogenous data, 2) take a large sample with many observations.
The second strategy for decreasing standard error is particularly important for light rail sampling. In general, one cannot control the number of people boarding a train. So if a train station has large fluctuations in boardings over time, the only solution to decrease standard error is to take many observations in a sample.
Margin of Error and Confidence Interval (CI) Both margin of error and confidence interval (CI) are calculated using the standard error. However a confidence level needs to be chosen before proceeding with any calculations. Confidence levels are either 90%, 95% or 99%. The 95% confidence level is the most common and will be used in the examples here. This is explained further below.
2007-A09

Appendix A: Statistical Methods 23
The margin of error is equal to two times the standard error and is another way to measure the accuracy of the average. As with standard error, a large margin of error indicates a less accurate sample average. The CI is the sample average plus or minus the margin of error. As mentioned above, calculating the CI requires choosing a confidence level of 90%, 95% or 99%. The most common level is 95% confidence. One must choose a confidence level because a CI provides a range of numbers that are likely to include the true average. The confidence level is the statistical likelihood of including the true average. So, for a 95% confidence level, the CI will include the true average 95% of the time. Conversely, there is a 5% chance that the CI does not include the true average.
Changing the confidence level will change how the margin of error is calculated. The calculation method above is for a 95% confidence level. For a 99% confidence level the margin of error would be larger and the CI would be larger as well. To return to the ridership example, the margin of error and 95% CI are calculated for Station A and B below.
Station A Station B Average 22.67 79.11 Standard Error 0.83 13.10 Margin of Error 1.67 26.19 95% Confidence Interval 21.00, 24.34 52.92, 105.30
The margin of error for Station A is 1.67, and when added and subtracted from the sample average, the confidence interval ranges from 21 to 24 boardings. This means that it is 95% likely that the true average boardings are between 21 and 24 persons. For Station B, the margin of error is 26.19 and the confidence interval ranges from 53 to 105 people. There is only a 5% chance that the true average is not within this range.
National Transit Database (NTD) and Margin of Error The National Transit Database (NTD) requires that all light rail agencies estimating ridership through sampling use a 95% confidence level and 10% precision (margin of error). The significance of a 95% confidence level is discussed above. Requiring a 10% margin of error is a method of requiring a certain level of accuracy in sample estimates. To ascertain if a margin of error maintains these standards, one measures the margin of error as a percentage of the sample average. Station A and B samples will be used as an example.
Station A Station B Average 22.67 79.11 Standard Error 0.83 13.10 Margin of Error 1.67 26.19 Margin of Error (%) 7.35% 33.11%
When measured as a percentage of the sample average, the margin of error at Station A is about 7%. This percentage would meet the NTD accuracy requirements. However, the margin of error for Station B is over 30% which is much larger than NTD standards. Examining the margin of error as a percentage is helpful in deciding when the margin of error is too large according to an objective standard. Aiming for 5% and 10% margins of
2007-A09

Appendix A: Statistical Methods 24
error is common. Increasing the sample size can decrease the margin of error when it is larger than the required percentage.
Ridership Projection Ridership numbers are limited for certain times of day, particularly early morning (before 6am) and late night times (after 9pm.) In order to project ridership numbers during these times, Audit used linear regression forecasting methods.
Comparison of R&R and Service Development data found that patterns of high ridership and low ridership are temporally consistent from day to day, although the actual magnitude of ridership may change with seasonality and other factors. Furthermore, ridership numbers rarely increase and decrease dramatically from one train trip to the next. Audit found that when they occur dramatic changes in ridership are most often due to special events.
Consistent patterns of ridership support the use of regression forecasting models. Regression forecasting models are appropriate when a general linear trend is visible in data. Regression uses the linear trend of the available points to create a line through those points which can be used to predict ridership on trains for which there is no data. The Rsquare statistic measures how well the regression line fits the existing data points. Specifically, the Rsquare statistic displays the percentage of the time that the regression line predicts ridership better than the average of the data would predict ridership.
Audit used existing data points for night and morning ridership to create a linear regression model that is then used to predict ridership numbers for train trips that lack actual ridership counts. This method is used to predict late night and early morning ridership for weekdays and weekends. In order to create the most meaningful linear trends, ridership data is divided into northbound and southbound trips.
Weekday Night Ridership Projections Weekday late night ridership is projected using available night ridership data for the months of October and November. Ridership estimates are projected for four southbound trips and six northbound trips. Existing ridership data for trips after 8:00 p.m. is used to make these projections.
Table 1 shows the data and regression model for southbound late night trips. To ascertain the ridership numbers for the four missing trips, the train sequence number is plugged into the regression line equation. The regression line equation is displayed in the table along with the Rsquare statistic. According to the Rsquare statistic, the regression model predicts ridership better than the average 41.3% of the time.
2007-A09

Appendix A: Statistical Methods 25
Table 1. Weekday Late Night Ridership Forecasting, Southbound
R&R Data Weekday Night Southbound Ridership, OctNov
y = 2.7319x + 91.418 R 2 = 0.413
0
20
40
60
80
100
120
1 2 3 4 5 6 7 8 9 10 11 12 13 14
Train Sequence #
Boa
rdings
Table 2 shows the actual and projected ridership numbers for the southbound train trips using the regression model equation. Projected ridership numbers are highlighted in grey.
These same methods are used to predict northbound ridership for weekday nights. Table 3 displays the data and regression model, as well as the regression equation and Rsquare statistic. Once again, the train sequence number is plugged into the regression equation to project ridership. Table 4 shows the actual and projected ridership numbers for the northbound train trips using the regression model equation. Projected ridership numbers are highlighted in grey.
2007-A09

Appendix A: Statistical Methods 26
Table 2. Weekday Late Night Ridership Forecasting, Southbound Time Sequence # Board # Direction
8:13 PM 1 83 S 8:13 PM 2 104 S 8:21 PM 3 73 S 8:28 PM 4 96 S 8:28 PM 5 51 S 8:43 PM 6 77 S 9:13 PM 7 84 S 9:28 PM 8 66 S 9:43 PM 9 49 S 9:58 PM 10 84 S
10:43 PM 11 61 S 11:13 PM 12 50 S 11:13 PM 13 63 S 11:13 PM 14 52 S 11:46 PM 15 50 S 12:16 AM 16 48 S 12:46 AM 17 45 S 1:16 AM 18 42 S
Table 3. Weekday Late Night Ridership Forecasting, Northbound
R&R Data Weekday Night Northbound Ridership, OctNov
y = 2.9667x + 91.167 R 2 = 0.2901
0
20
40
60
80
100
120
1 2 3 4 5 6 7 8 9 Train Sequence #
Boa
rdings
2007-A09
Appendix A: Statistical Methods 27
Table 4. Weekday Late Night Ridership Forecasting, Northbound Time Sequence # Board # Direction
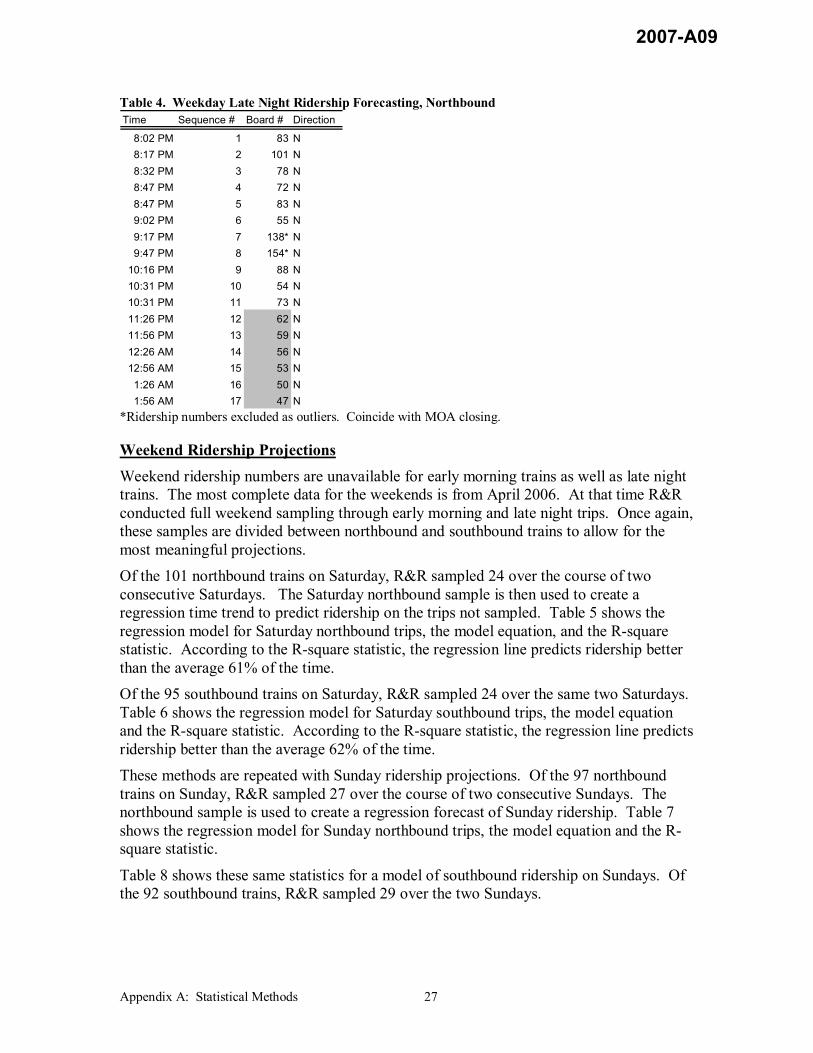
8:02 PM 1 83 N 8:17 PM 2 101 N 8:32 PM 3 78 N 8:47 PM 4 72 N 8:47 PM 5 83 N 9:02 PM 6 55 N 9:17 PM 7 138* N 9:47 PM 8 154* N 10:16 PM 9 88 N 10:31 PM 10 54 N 10:31 PM 11 73 N 11:26 PM 12 62 N 11:56 PM 13 59 N 12:26 AM 14 56 N 12:56 AM 15 53 N 1:26 AM 16 50 N 1:56 AM 17 47 N
*Ridership numbers excluded as outliers. Coincide with MOA closing.
Weekend Ridership Projections Weekend ridership numbers are unavailable for early morning trains as well as late night trains. The most complete data for the weekends is from April 2006. At that time R&R conducted full weekend sampling through early morning and late night trips. Once again, these samples are divided between northbound and southbound trains to allow for the most meaningful projections. Of the 101 northbound trains on Saturday, R&R sampled 24 over the course of two consecutive Saturdays. The Saturday northbound sample is then used to create a regression time trend to predict ridership on the trips not sampled. Table 5 shows the regression model for Saturday northbound trips, the model equation, and the Rsquare statistic. According to the Rsquare statistic, the regression line predicts ridership better than the average 61% of the time. Of the 95 southbound trains on Saturday, R&R sampled 24 over the same two Saturdays. Table 6 shows the regression model for Saturday southbound trips, the model equation and the Rsquare statistic. According to the Rsquare statistic, the regression line predicts ridership better than the average 62% of the time. These methods are repeated with Sunday ridership projections. Of the 97 northbound trains on Sunday, R&R sampled 27 over the course of two consecutive Sundays. The northbound sample is used to create a regression forecast of Sunday ridership. Table 7 shows the regression model for Sunday northbound trips, the model equation and the R square statistic.
Table 8 shows these same statistics for a model of southbound ridership on Sundays. Of the 92 southbound trains, R&R sampled 29 over the two Sundays.
2007-A09

Appendix A: Statistical Methods 28
Table 5. Saturday Ridership Forecasting, Northbound
R & R Data Saturday Northbound Ridership, April
y = 0.0398x 2 + 4.6997x 4.7229 R 2 = 0.6122
0
50
100
150
200
250
1 8 15 22 29 36 43 50 57 64 71 78 85 92 99
Train Sequence #
Boardings
Table 6. Saturday Ridership Forecasting, Southbound
R & R Data Saturday Southbound Ridership, April
y = 0.0395x 2 + 4.3225x + 6.0451 R 2 = 0.6159
0
50
100
150
200
250
1 6 11 16 21 26 31 36 41 46 51 56 61 66 71 76 81 86 91
Train Sequence #
Boa
rdings
2007-A09

Appendix A: Statistical Methods 29
Table 7. Sunday Ridership Forecasting, Northbound
R&R Data Sunday Northbound Ridership, April
y = 0.0327x 2 + 3.4731x + 7.3152 R 2 = 0.4995
0
50
100
150
200
250
1 6 11 16 21 26 31 36 41 46 51 56 61 66 71 76 81 86 91 96 Train Sequence #
Boa
rdings
Table 8. Sunday Ridership Forecasting, Southbound
R&R Data Sunday Southbound Ridership, April
y = 0.0371x 2 + 3.5247x + 15.178 R 2 = 0.7574
0
50
100
150
200
250
1 6 11 16 21 26 31 36 41 46 51 56 61 66 71 76 81 86 91
Train Sequence #
Boardings
2007-A09

Appendix B
Appendix B: Train Fare Media 30
Train Fare Media
Trip Tickets Single
Commuters may purchase single train ride tickets on the train platform. These tickets allow the commuter to ride the train for 2 ½ hours. Cash Fare
$2.00 Adult fare peak hours $1.50 Adult fare nonpeak hours $ .50 Metro Mobility fare $ .50 Senior Citizen and 12 and under nonpeak hours
Fare enforcement requires the officer to check the ticket for date and time. For Metro Mobility and Senior Citizen fares the commuter must provide identification.
6 Hour Pass Commuters may purchase a ticket good for six hours on the train platform. This ticket allows the commuter to ride the train for six hours.
Cash Fare $3.50 Fare enforcement requires the officer to check ticket for date and time.
Day Pass
Commuter may purchase a ticket valid for 24 hours on the train platform. Cash Fare $6.00
Fare enforcement requires the officer to check ticket for date and time.
Super Saver 31 Day Pass
The Super Saver 31 Day Pass is good for both the bus and the train for 31 days from the date of first use. In order to use the pass on the train it must first be activated on a bus. The 31 day passes are priced as follows:
Cash Fare Purchase Price $2.75 $104.00 $2.00 $ 76.00 $1.50 $ 50.00 $ .50 $ 21.00 (Valid only for limited mobility commuters.)
Fare enforcement process requires officer to look at date of first usage. If not dated the officer will write the current date on the pass and explain that it needs to be activated on a bus. The 31 day countdown for the card does not occur until it has been activated. This allows a person to use the card as appropriate fare media on a train until such time as an officer dates the ticket or it is activated on a bus.
2007-A09

Appendix B: Train Fare Media 31
Super Saver Stored Value Card
The Super Saver Stored Value Card is recommended for commuters who do not use public transportation everyday. The card can only be used on buses. When the commuter uses the card the fare is deducted from the card and the detail is printed on the card. If the commuter is going to ride the train they must get a rail transfer from the bus driver. There currently is no mechanism for the rider to utilize the card on the train. The Stored Value cards are priced as follows:
Purchase Price Value in Rides $40.00 $44.00 $20.00 $22.00 $10.00 $11.00
Fare enforcement of the Stored Value Cards requires that the passenger present the card along with a rail transfer from the bus. If they do not have the rail transfer the officer will review the card to see when it was last used on a bus and will explain the transfer process to the commuter.
Monthly Pass
Monthly Pass cards replaced the Rail Pass which was used in the introductory stage of the Hiawatha Light Rail. The Monthly Pass can be used on the rail or the bus. The monthly pass equates to a fare of $2.00 for a bus trip. The cost of the Monthly Pass is $76.00. Fare enforcement for the Monthly Pass requires the commuter to show the officer the pass.
Metro Pass
Employees of more than 500 companies may buy monthly passes at discounted rates through their employers. These passes will have the employee’s picture on one side of the pass along with company name. The costs to the employee may vary depending on the employer. The commuter is supposed to swipe the card at the GoTo card reader on the train platform prior to boarding.
Fare enforcement for the Metro Pass requires the officer to scan the pass with a handheld inspection terminal.
College Pass
Several colleges sell College Passes to students. These cards are a version of the GoTo card. The commuter should swipe the card at the GoTo card reader prior to boarding the train. The card is printed with an expiration date. Fare enforcement for the College Pass requires the officer to check the expiration date.
2007-A09

Appendix B: Train Fare Media 32
GoTo Cards
GoTO cards are currently being piloted by close to 3000 commuters. The commuter initially purchases a GoTo card with a stored value amount on the card. The commuter has the option to add cash value to the card at either a transit store or at a terminal on the train platform. The commuter must swipe the card prior to boarding the train. When the card is swiped at the GoTo card reader the fare will be deducted from the card.
Fare enforcement for the GoTo card requires the officer to scan the card with the handheld inspection terminal.
2007-A09