heta #2000-0410-2891 stn cushion company thomasville ... · health hazard evaluation report...
TRANSCRIPT

NIOSH HEALTH HAZARD EVALUATION REPORT:
DEPARTMENT OF HEALTH AND HUMAN SERVICESCenters for Disease Control and Prevention
National Institute for Occupational Safety and Health
HETA #2000-0410-2891STN Cushion CompanyThomasville, North Carolina
August 2002
This Health Hazard Evaluation (HHE) report and any recommendations made herein are for the specific facility evaluated and may not be universally applicable. Any recommendations made are not to be considered as final statements of NIOSH policy or of any agency or individual involved. Additional HHE reports are available at http://www.cdc.gov/niosh/hhe/reports
This Health Hazard Evaluation (HHE) report and any recommendations made herein are for the specific facility evaluated and may not be universally applicable. Any recommendations made are not to be considered as final statements of NIOSH policy or of any agency or individual involved. Additional HHE reports are available at http://www.cdc.gov/niosh/hhe/reports
This Health Hazard Evaluation (HHE) report and any recommendations made herein are for the specific facility evaluated and may not be universally applicable. Any recommendations made are not to be considered as final statements of NIOSH policy or of any agency or individual involved. Additional HHE reports are available at http://www.cdc.gov/niosh/hhe/reports
This Health Hazard Evaluation (HHE) report and any recommendations made herein are for the specific facility evaluated and may not be universally applicable. Any recommendations made are not to be considered as final statements of NIOSH policy or of any agency or individual involved.
This Health Hazard Evaluation (HHE) report and any recommendations made herein are for the specific facility evaluated and may not be universally applicable. Any recommendations made are not to be considered as final statements of NIOSH policy or of any agency or individual involved. Additional HHE reports are available at http://www.cdc.gov/niosh/hhe/reports
applicable. Any recommendations made are not to be considered as final statements of NIOSH policy or of any agency or individual involved. Additional HHE reports are available at http://www.cdc.gov/niosh/hhe/reports
ii
PREFACE
The Hazard Evaluations and Technical Assistance Branch (HETAB) of the National Institute forOccupational Safety and Health (NIOSH) conducts field investigations of possible health hazards in theworkplace. These investigations are conducted under the authority of Section 20(a)(6) of the OccupationalSafety and Health (OSHA) Act of 1970, 29 U.S.C. 669(a)(6) which authorizes the Secretary of Health andHuman Services, following a written request from any employer or authorized representative of employees,to determine whether any substance normally found in the place of employment has potentially toxic effectsin such concentrations as used or found.
HETAB also provides, upon request, technical and consultative assistance to Federal, State, and localagencies; labor; industry; and other groups or individuals to control occupational health hazards and to preventrelated trauma and disease. Mention of company names or products does not constitute endorsement byNIOSH.
ACKNOWLEDGMENTS AND AVAILABILITY OF REPORT
This report was prepared by Josh Harney, Jeffery Hess, and Doug Trout of HETAB, Division of Surveillance,Hazard Evaluations and Field Studies (DSHEFS). Field assistance was provided by Chris Reh, VinceMortimer, Calvin Cook, Ann Krake, Amber Rogers, Kristin Gwin, Barbara Mackenzie, Edward Hitchcock,and James Kesner. Analytical support was provided by Datachem Laboratories. Desktop publishing wasperformed by David Butler. Review and preparation for printing were performed by Penny Arthur.
Copies of this report have been sent to employee and management representatives at STN Cushion Co. andthe OSHA Regional Office. This report is not copyrighted and may be freely reproduced. Single copies ofthis report will be available for a period of three years from the date of this report. To expedite your request,include a self-addressed mailing label along with your written request to:
NIOSH Publications Office4676 Columbia ParkwayCincinnati, Ohio 45226
800-356-4674
After this time, copies may be purchased from the National Technical Information Service (NTIS) at5825 Port Royal Road, Springfield, Virginia 22161. Information regarding the NTIS stock number may beobtained from the NIOSH Publications Office at the Cincinnati address.
For the purpose of informing affected employees, copies of this report shall beposted by the employer in a prominent place accessible to the employees for aperiod of 30 calendar days.

iii
Highlights of the NIOSH Health Hazard Evaluationa
a
Health Study of Workers Exposed to Bromopropane at STN CushionCompany, Thomasville, North Carolina
NIOSH got a confidential request from workers worried about nerve problems, weakness, dizziness, legnumbness, and headaches they thought were from glue chemicals.
What NIOSH Did
# We measured air concentrations of1-bromopropane (1-BP) and 2-bromopropane(2-BP) in the Fabrication area and in otherareas of the plant.
# We checked the exhaust ventilation in theFabrication area before and afterimprovements were made to the spray tables.
# We did a medical survey that included aquestionnaire, blood and urine testing,neurobehavioral testing, and a femalereproductive health study.
What NIOSH Found
# Air concentrations of 1-BP and 2-BPdecreased in the Fabrication area by almost2/3 after the ventilation improvements weremade.
# Workers in the Fabrication area reporteddizziness and blurred vision more frequentlythan those in other areas.
# Worker urinary bromine levels correspondedwith the airborne 1-BP concentrations.
# We could not tell if the exposures to 1-BP atSTN were related to health problems amongemployees.
What STN Managers Can Do
# Purchase only 1-BP based solvent containingthe lowest possible amount of 2-BP (which ispresent as a contaminant).
# Decrease unused space in each spray booth tomake the ventilation work as well as it can.
# Keep the Fabrication room emergency exitdoor and Poly room garage door closed whenspraying glue.
# Provide gloves [not latex] that protect theskin of Sprayers from 1- & 2-BP.
# Change work practices so that employees arenot allowed to eat or drink at theirworkstations.
# Share information on potential hazards ofworking with 1- & 2-BP to all workers whocan be exposed.
What STN Employees Can Do
# Participate in all hazard communicationsessions.
# Wear the correct gloves when spraying glue.
# Wash hands before eating, drinking, orsmoking, and at the end of the day.
# Do not eat or drink at your workstation.
# If you have health effects that might berelated to the workplace you should see adoctor experienced in occupational healthissues.
Highlights of the HHE Report

iv
What To Do For More Information:We encourage you to read the full report. If you would likea copy, either ask your health and safety representative to
make you a copy or call 1-513-841-4252 and ask for
HETA Report #2000-0410-2891
Health Hazard Evaluation Report 2000-0410-2891STN Cushion Company
Thomasville, North CarolinaAugust 2002
Joshua M. Harney, MSJeff Hess, MD
Christopher Reh, Ph. D., CIHDoug Trout, MD, MHS
SUMMARY
On August 28, 2000, the National Institute for Occupational Safety and Health (NIOSH) received aconfidential request for a health hazard evaluation (HHE) at STN Cushion Company (STN) in Thomasville,North Carolina. The request was submitted by employees concerned about health effects potentiallyassociated with 1-bromopropane (1-BP, also called n-propyl bromide) and 2-bromopropane (2-BP, also calledisopropyl bromide) exposures during the spray application of an adhesive. The employees’ concerns centeredaround neuropathy (abnormal nerve function), weakness and numbness in the lower extremities, dizziness,and headaches.
Site visits were conducted in November 2000 (exposure monitoring and informal [confidential] employeeinterviews), April 2001 (ventilation assessment), and July-August 2001 (medical evaluation and repeatexposure and ventilation evaluations). After April 2001, STN improved the local ventilation in the area ofconcern based on recommendations made by the NIOSH ventilation engineer. During both exposureassessments, employees were monitored for full-shift 1-BP and 2-BP inhalation exposure. Short-term (15-minute) and ceiling (5-minute) 1-BP and 2-BP inhalation exposure measurements were also collected fromthe adhesive sprayers (Sprayers). Area air sampling for 1-BP and 2-BP was conducted also. The ventilationassessments included an evaluation of local exhaust ventilation at the workstations (consisting of spray tablesand spray booths).
The medical survey, consisting of a questionnaire, a complete blood count, start-of-week and end-of -weekurine analysis for bromine, and a battery of neurobehavioral tests, was performed on all employees within thefacility who were willing to participate. Additionally, a reproductive study was performed which included alleligible female employees who were willing to participate. The purpose of the medical survey was: 1) toassess whether hematological (blood), neurobehavioral (postural stability and psychomotor ability), andreproductive effects might be associated with 1-BP exposure; 2) to assess whether health effects reportedon the questionnaire were associated with 1-BP exposure; and 3) to evaluate urinary bromine levels at the

v
start and end of the week and compare these results to airborne 1-BP levels (to see if urinary bromineconcentration can be used as a biomarker of exposure). The “exposed” population consisted primarily ofthose employees who worked in the Fabrication area performing spraying activities. The comparison (“lessexposed”) population consisted of all other employees who worked in the facility.
At the first site visit the mean (average) airborne 1-BP exposure for the Sprayers was 65.9 parts per million(ppm) (range 41.3 to 143.0 ppm). The mean full-shift airborne 2-BP exposure for Sprayers was 0.66 ppm(range 0.33 to 1.35 ppm). At the second site visit, the mean concentration of 1-BP for the Sprayers increasedfrom the first (16.6 ppm) to the third (23.3 ppm) day of sampling, but was lower than the concentration foundduring the first site visit. Two individual spray booths (Stations #6 and #11) did, however, yield a 3-dayaverage exposure above a recommended level of 25 ppm. The initial ventilation assessment revealed thatall of the workstations had exhaust flow rates which were lower than recommended values. Enclosure ofspray tables led to improved ventilation at each of the workstations; however, factors were identif ied whichwould lead to further improvement in ventilation effectiveness.
Of the 84 individuals employed at STN at the time of the survey, 32 (38%) volunteered to participate in themedical survey. The symptoms most often reported from all participants included: headache (reported by48%), trouble falling asleep or staying asleep (reported by 28%), dizziness or feeling “off balance” (reportedby 25%), and blurred vision (reported by 24%). Two of the symptoms in the questionnaire, blurred vision anddizziness or feeling “off-balance,” were significantly more common among the exposed versus the comparisongroups. Of the exposed employees, five of six reporting blurry vision and four of six reporting dizziness notedsymptom improvement during time away from the work environment.
All of the results for blood indices were within the normal value ranges provided by the testing laboratory;however, because of the small number of blood specimens available for analysis, a statistical determinationregarding the blood tests and their relationship to 1-BP exposure could not be made. The start-of-week andend-of-week urine bromine concentrations for the exposed group were both significantly higher than thecorresponding values for the comparison group. We found no significant elevation in urine bromine level inthe end-of-week urine samples compared to the start-of-week urine samples—in other words, we did notdetect an increase in urine bromine from the first urine sample (start-of-week) to the second urine sample(end-of-week). Urinary bromine concentrations were highly correlated to the airborne concentration of 1-BP,and it was concluded that urinary bromine may be a good indicator of 1-BP exposure. A total of 30participants participated in the neurobehavioral testing. We found no differences in the Postural Stability testresults between employees in the exposed and comparison groups. Of the 16 Psychomotor Abilityparameters tested, 3 demonstrated a statistically significant difference between the exposed and comparisongroups. Specifically, we found indications of increased tremor in the right hand of participants in the exposedgroup. Although we cannot determine the cause of the tremor observed by our testing, we believe that thisunilateral tremor is likely due to muscle fatigue (a known cause of the type of tremor observed), as 1-BPexposure, if sufficient to cause tremor, would likely cause bilateral tremor (tremor on both sides) due to apotential mechanism involving the central nervous system. And lastly, we collected insufficient data amongexposed workers in the reproductive evaluation part of the survey to be able to make any comparisonsbetween exposed and comparison workers in that portion of the HHE.
Although we found the Sprayers at STN to have greater exposure to 1-BP than other employees, we areunable to determine if these exposures constitute a health hazard. By enclosing the spray booths in theFabrication area, STN has dramatically reduced Sprayers’ exposures to 1-BP and 2-BP. Because of

vi
symptoms consistent with excessive solvent exposure reported among the exposed workers, concerns raisedin other studies, and the lack of definitive information, efforts should continue to minimize 1-BP and 2-BPexposures. Recommendations are provided in this report to assist in this, and include improving the ventilationof spray booths #6 and #11 as well as improving personal protective equipment use.
Keywords: SIC Code 2392 (House furnishing, Except Curtains and Draperies); 1-bromopropane, 1-BP,2-bromopropane, 2-BP, solvent, neuropathy, neurobehavioral, reproductive.

TABLE OF CONTENTS
Preface . . . . . . . . . . . . . . . . . . . . . . . . . . . . . . . . . . . . . . . . . . . . . . . . . . . . . . . . . . . . . . . . . . . . . . . ii
Acknowledgments and Availability of Report . . . . . . . . . . . . . . . . . . . . . . . . . . . . . . . . . . . . . . . . . . . . . ii
Summary . . . . . . . . . . . . . . . . . . . . . . . . . . . . . . . . . . . . . . . . . . . . . . . . . . . . . . . . . . . . . . . . . . . . iv
Introduction . . . . . . . . . . . . . . . . . . . . . . . . . . . . . . . . . . . . . . . . . . . . . . . . . . . . . . . . . . . . . . . . . . . 1
Background . . . . . . . . . . . . . . . . . . . . . . . . . . . . . . . . . . . . . . . . . . . . . . . . . . . . . . . . . . . . . . . . . . . . 1
Methods . . . . . . . . . . . . . . . . . . . . . . . . . . . . . . . . . . . . . . . . . . . . . . . . . . . . . . . . . . . . . . . . . . . . . . 1Air Sampling . . . . . . . . . . . . . . . . . . . . . . . . . . . . . . . . . . . . . . . . . . . . . . . . . . . . . . . . . . . . . . . . 1Ventilation Assessment . . . . . . . . . . . . . . . . . . . . . . . . . . . . . . . . . . . . . . . . . . . . . . . . . . . . . . . . . 2Medical Survey . . . . . . . . . . . . . . . . . . . . . . . . . . . . . . . . . . . . . . . . . . . . . . . . . . . . . . . . . . . . . . 3
Survey Population . . . . . . . . . . . . . . . . . . . . . . . . . . . . . . . . . . . . . . . . . . . . . . . . . . . . . . . . . 3Questionnaire . . . . . . . . . . . . . . . . . . . . . . . . . . . . . . . . . . . . . . . . . . . . . . . . . . . . . . . . . . . . 3Blood . . . . . . . . . . . . . . . . . . . . . . . . . . . . . . . . . . . . . . . . . . . . . . . . . . . . . . . . . . . . . . . . . . 4Urine . . . . . . . . . . . . . . . . . . . . . . . . . . . . . . . . . . . . . . . . . . . . . . . . . . . . . . . . . . . . . . . . . . 4Neurobehavioral Testing . . . . . . . . . . . . . . . . . . . . . . . . . . . . . . . . . . . . . . . . . . . . . . . . . . . . . 4
Postural Stability . . . . . . . . . . . . . . . . . . . . . . . . . . . . . . . . . . . . . . . . . . . . . . . . . . . . . . . 4Psychomotor Ability . . . . . . . . . . . . . . . . . . . . . . . . . . . . . . . . . . . . . . . . . . . . . . . . . . . . 5
Reproductive Study . . . . . . . . . . . . . . . . . . . . . . . . . . . . . . . . . . . . . . . . . . . . . . . . . . . . . . . . 5Statistical Analysis . . . . . . . . . . . . . . . . . . . . . . . . . . . . . . . . . . . . . . . . . . . . . . . . . . . . . . . . . 6
Evaluation Criteria . . . . . . . . . . . . . . . . . . . . . . . . . . . . . . . . . . . . . . . . . . . . . . . . . . . . . . . . . . . . . . . 61-Bromopropane and 2-Bromopropane . . . . . . . . . . . . . . . . . . . . . . . . . . . . . . . . . . . . . . . . . . . . . . 7Local Exhaust Ventilation . . . . . . . . . . . . . . . . . . . . . . . . . . . . . . . . . . . . . . . . . . . . . . . . . . . . . . . 7
Results . . . . . . . . . . . . . . . . . . . . . . . . . . . . . . . . . . . . . . . . . . . . . . . . . . . . . . . . . . . . . . . . . . . . . . . 8Air Sampling . . . . . . . . . . . . . . . . . . . . . . . . . . . . . . . . . . . . . . . . . . . . . . . . . . . . . . . . . . . . . . . . 8
November 2000—before enclosure of spray tables . . . . . . . . . . . . . . . . . . . . . . . . . . . . . . . . . . 8July/August 2001—after enclosure of spray tables . . . . . . . . . . . . . . . . . . . . . . . . . . . . . . . . . . . 9
Local Exhaust Ventilation . . . . . . . . . . . . . . . . . . . . . . . . . . . . . . . . . . . . . . . . . . . . . . . . . . . . . . . 9Spray Table Evaluation— November 2000—before enclosure of spray tables . . . . . . . . . . . . . . . . 9Spray Booth Evaluation— July/August 2001—after enclosure of spray tables . . . . . . . . . . . . . . . 10
Medical Survey . . . . . . . . . . . . . . . . . . . . . . . . . . . . . . . . . . . . . . . . . . . . . . . . . . . . . . . . . . . . . 10Questionnaire . . . . . . . . . . . . . . . . . . . . . . . . . . . . . . . . . . . . . . . . . . . . . . . . . . . . . . . . . . . 10Blood . . . . . . . . . . . . . . . . . . . . . . . . . . . . . . . . . . . . . . . . . . . . . . . . . . . . . . . . . . . . . . . . . 10Urine . . . . . . . . . . . . . . . . . . . . . . . . . . . . . . . . . . . . . . . . . . . . . . . . . . . . . . . . . . . . . . . . . 11Neurobehavioral Testing . . . . . . . . . . . . . . . . . . . . . . . . . . . . . . . . . . . . . . . . . . . . . . . . . . . 11
Postural Stability Testing . . . . . . . . . . . . . . . . . . . . . . . . . . . . . . . . . . . . . . . . . . . . . . . . . 11Psychomotor Ability Testing . . . . . . . . . . . . . . . . . . . . . . . . . . . . . . . . . . . . . . . . . . . . . . 11
Reproductive Evaluation . . . . . . . . . . . . . . . . . . . . . . . . . . . . . . . . . . . . . . . . . . . . . . . . . . . . 12
Discussion . . . . . . . . . . . . . . . . . . . . . . . . . . . . . . . . . . . . . . . . . . . . . . . . . . . . . . . . . . . . . . . . . . . 12Exposure Survey . . . . . . . . . . . . . . . . . . . . . . . . . . . . . . . . . . . . . . . . . . . . . . . . . . . . . . . . . . . . 12

viii
Ventilation Assessment . . . . . . . . . . . . . . . . . . . . . . . . . . . . . . . . . . . . . . . . . . . . . . . . . . . . . . . . 12Medical Survey . . . . . . . . . . . . . . . . . . . . . . . . . . . . . . . . . . . . . . . . . . . . . . . . . . . . . . . . . . . . . 13
Questionnaire . . . . . . . . . . . . . . . . . . . . . . . . . . . . . . . . . . . . . . . . . . . . . . . . . . . . . . . . . . . 13Hematological Effects . . . . . . . . . . . . . . . . . . . . . . . . . . . . . . . . . . . . . . . . . . . . . . . . . . . . . . 13Urinary Bromine . . . . . . . . . . . . . . . . . . . . . . . . . . . . . . . . . . . . . . . . . . . . . . . . . . . . . . . . . 13Neurobehavioral . . . . . . . . . . . . . . . . . . . . . . . . . . . . . . . . . . . . . . . . . . . . . . . . . . . . . . . . . 14
Psychomotor Ability Testing . . . . . . . . . . . . . . . . . . . . . . . . . . . . . . . . . . . . . . . . . . . . . . 14Postural Stability Testing . . . . . . . . . . . . . . . . . . . . . . . . . . . . . . . . . . . . . . . . . . . . . . . . . 14
Survey Limitations . . . . . . . . . . . . . . . . . . . . . . . . . . . . . . . . . . . . . . . . . . . . . . . . . . . . . . . . . . . 14
Conclusions . . . . . . . . . . . . . . . . . . . . . . . . . . . . . . . . . . . . . . . . . . . . . . . . . . . . . . . . . . . . . . . . . . 15
Recommendations . . . . . . . . . . . . . . . . . . . . . . . . . . . . . . . . . . . . . . . . . . . . . . . . . . . . . . . . . . . . . . 15
References . . . . . . . . . . . . . . . . . . . . . . . . . . . . . . . . . . . . . . . . . . . . . . . . . . . . . . . . . . . . . . . . . . . 15
Tables . . . . . . . . . . . . . . . . . . . . . . . . . . . . . . . . . . . . . . . . . . . . . . . . . . . . . . . . . . . . . . . . . . . . . . . 19
Appendix . . . . . . . . . . . . . . . . . . . . . . . . . . . . . . . . . . . . . . . . . . . . . . . . . . . . . . . . . . . . . . . . . . . . 34

Health Hazard Evaluation Report No.2000-0410-2891 Page 1
INTRODUCTION
On August 28, 2000, the National Institute forOccupational Safety and Health (NIOSH)received a confidential request for a health hazardevaluation (HHE) at STN Cushion Company(STN) in Thomasville, North Carolina. Therequest was submitted by employees concernedabout health effects potentially associated with 1-bromopropane (1-BP, also called n-propylbromide) and 2-bromopropane (2-BP, or isopropylbromide) exposures during the spray application ofan adhesive. The employees’ concerns includedneuropathy (abnormal nerve function), weaknessand numbness in the lower extremities, dizziness,and headaches. On November 14, 2000, NIOSHinvestigators conducted an initial site visit at STNwhich included an exposure assessment ofemployees applying the adhesive and informal(confidential) interviews to learn more aboutemployee health concerns. A NIOSH ventilationengineer assessed the performance of the existinglocal exhaust ventilation (LEV) in the Fabricationarea on April 18, 2001. Based onrecommendations made by NIOSH following theApril site visit, STN enclosed the spray tables onfour sides to improve the capture efficiency of thelocal exhaust ventilation, thus creating ‘spraybooths.’ On July 31 to August 2, 2001, NIOSHconducted follow-up exposure monitoring,ventilation assessment, and medical evaluations ofworkers.
In January 2002, each study participant was senta copy of all personal test results from the medicalevaluation. Results of the industrial hygienesampling were initially sent to STN and anemployee representative in letters dated February21, 2001 (for the sampling conducted in November2000), and September 12, 2001 (for samplingconducted July-August 2001). A letter containinga preliminary analysis of the data (including datafrom biologic samples, neurobehavioral testing, andthe questionnaire) was distributed on May 24,
2002. This report consolidates all previouscommunication, and includes up-to-dateconclusions and recommendations.
BACKGROUND
STN manufactures sofa cushions for variousfurniture companies. Each cushion is assembledby gluing together several pieces of cut flexiblefoam. Once two pieces of foam are gluedtogether, they are hand-pressed to achieve aproper bond. The adhesive is spray-applied usinga compressed air spray gun in the Fabricationroom. This room initially contained 13 spraystations having a slotted LEV hood and one down-draft spray table. Following the LEVimprovements, the downdraft spray table wasdiscarded, and only 12 spray stations were used.The adhesive is Whisper Spray (ImperialAdhesives, Cincinnati, Ohio), which contains 55%by weight 1-BP. This product also contains 1–5%VM&P naphtha and 1–5% ethyl acetate. Inaddition, small amounts of 2-BP are usuallypresent in most 1-BP-containing formulations.Occasionally, a water-based spray adhesive(Simalfa® 309, Alfa Adhesives, Inc., NorthHaledon, New Jersey) that contains nohydrocarbon solvent is used at up to four spraystations. Adjacent to the Fabrication room are theSaw room and the Poly room, neither of which usethe spray adhesive.
METHODS
Air Sampling
During the November 2000 exposure assessment,employees in the Fabrication room were monitoredfor full-shift inhalation exposures to 1- and 2-BPinhalation exposure. Short-term (15-minute) andceiling (5-minute) 1-BP and 2-BP inhalationexposure measurements were also collected fromthe Sprayers. In addition, area air sampling for 1-and 2-BP was conducted in the Fabrication, Saw,

Page 2 Health Hazard Evaluation Report No.2000-0410-2891
and Poly rooms to determine the degree of vapormigration away from the spray tables. For theinhalation exposure measurements, the samplingpumps and sample trains were worn by theemployees, and the sample media were placed inthe subjects’ breathing zones. Air sampling was conducted using a NIOSH draftsampling and analytical method for 1-BP and 2-BP. In this method, air is drawn through astandard charcoal tube (SKC Anasorb® CSC Lot2000) at a nominal flowrate of 50–250 millilitersper minute using a calibrated personal samplingpump. After sampling, the charcoal tubes arecapped and shipped refrigerated to the analyticallaboratory. The front and back sections of thecharcoal tubes are placed in glass vials, and eachsection is desorbed for 30 minutes with 1 milliliterof carbon disulfide. Each sample is analyzed forboth 1-BP and 2-BP using gas chromatographywith a flame ionization detector.
The 1-BP limit of detection (LOD) and limit ofquantification (LOQ) were 0.001 milligram persample (mg/sample) and 0.004 mg/sample,respectively. The LOD and LOQ for 2-BP are0.001 and 0.003 mg/sample, respectively. LODsand LOQs are values determined by the analyticalprocedure used to analyze the samples, and arenot dependent on sample volume. Minimumdetectable concentrations (MDCs) and minimumquantifiable concentrations (MQCs) aredetermined by dividing the LODs and LOQs by airsample volumes appropriate for the given set ofsamples. For this HHE, the average samplevolume for a given set of samples was used tocalculate these values. MDCs and MQCs for thefull-shift exposure measurements can be found atthe bottom of Table 1, for the short-term exposuremeasurements at the bottom of Table 2, for theceiling exposure measurements at the bottom ofTable 3, and for the area air sampling at thebottom of Table 4. While the LODs and LOQsare listed above in terms of mg/sample, the MDCsand MQCs in the tables have been converted to
parts per million (ppm) to be consistent with theevaluation criterion.
During the second exposure assessment, full-shift,short-term, and ceiling personal breathing zone(PBZ) samples were again collected fromSprayers. The 1-BP LOD and LOQ for theanalytical method used were 0.0007 mg/sampleand 0.002 mg/sample, respectively. The LODand LOQ for 2-BP were 0.0006 and 0.002mg/sample, respectively. MDCs and MQCs forfull-shift, short-term, and ceiling exposuremeasurements from this portion of exposuremonitoring can be found at the bottom of theirrespective tables (Tables 5, 6, 7) at the end of thisreport.
Ventilation Assessment
The LEV at the Sprayer’s workstations wasassessed both before and after the enclosure ofthe spray tables into spray booths. For thepurposes of this report, the spray stations in theFabrication area will be referred to by anumbering system. As one walks through theplastic curtain from the Saw room into Fabricationand turns to face the wall on the right, Station #1is the rightmost workstation (nearest the lavatory).Station #2 is immediately to the left of Station #1,and shares its spray booth. Numbering thenproceeds with Station #3, immediately to the rightof Station #4. Station #4 is to the right of the exitdoor. Station #5 is on the left side of this exitdoor, followed in a row along the wall by Stations#6 through #12. At the end of the Fabricationroom directly opposite Stations #1 and #2 isStation #12, next to the doorway to the Poly room.Tw o work- stations that were present during theNovember 2000 survey were not during theJuly/August 2001 survey (the downdraft spraytable, and a booth along the wall between theFabrication room door and the lavatory).
Air velocity into the LEV plena was measuredwith a hot-wire anemometer (TSI® Velocicalc

Health Hazard Evaluation Report No.2000-0410-2891 Page 3
Plus, model #8360) during both evaluations.During the November 2000 evaluation, fivevelocities were recorded for each slot, giving 20readings for each slot hood. Three rows of fourmeasurement points were used for the downdrafttable, and 128 readings for each double-stationhood. For computation, each 16-grid filter wasaveraged separately to give 4 values for eachsingle-station hood, and 8 values for each double-station hood. Additionally, air velocity 12-inchesabove the work surface was measured at 6-inchintervals out from the back wall of the work-station. Some groups of measurements weretaken more than once, and the readings wereaveraged to give one set of values.
The movement of air was also observed using“smoke tubes” (MSA #458481, Mine SafetyAppliances Company, Pittsburgh, Pennsylvania).The direction of air movement between the insideand the outside of the building was observed usinga smoke tube. The “smoke” was released at thebottom of the door, and observed to note whetherit was drawn out of the building or blown in acrossthe floor. If the door was sealed at the bottom torestrict air infiltration, the door was opened slightlyto check air flow along the edge.
After the April 2001 site visit, the spray tableswere enclosed to become spray booths; eachstation had its own spray booth, except for #1  and #9 & #10, which shared spray booths.Measurements of the spray booths were madeduring the July/August 2001 evaluation. Two ofthe spray booths (at Stations #3 and #6) are 8' x44" x 46". Six booths are 10' x 44" x 45"(Station#4, #5, #7, #8, #11, #12). Two spray booths arelarge enough to accommodate two spray Stationseach (#1 & #2, and #9 & #10): 14' x 43" x 45". Athermoanemometer was used to measure the facevelocity at evenly distributed points across themouth of each spray booth where the Sprayerwould normally stand. Measurements were
collected under two different conditions: ‘doorsopen’ and ‘doors closed.’ This refers either toboth the Poly room garage door and Fabricationroom outdoor exit door being open or both beingclosed. These measurements were combined toyield the average face velocity for each spraybooth.
Medical Survey
The medical survey, consisting of a questionnaire,a complete blood count, pre- and post-exposureurine analysis for bromine, and a battery ofneurobehavioral tests was performed on allemployees within the facility who were willing toparticipate. Additionally, a reproductive study wasperformed and included all female employees whowere willing to participate. The purpose of themedical survey portion of this HHE was: 1) toassess whether objective evidence forhematological (blood), neurobehavioral, andreproductive adverse effects were associated with1-BP exposure; 2) to assess whether adversehealth effects reported on the questionnaire wereassociated with 1-BP exposure; and 3) to evaluateurinary bromine levels of employees and compare

Page 4 Health Hazard Evaluation Report No.2000-0410-2891
these results to airborne 1-BP levels (to see ifurinary bromine concentration can be used as abiomarker of exposure). The survey wasapproved by the NIOSH Human Subjects ReviewBoard and was conducted over a three-day periodbeginning on Monday, July 31, 2001. Allemployees working at the facility were given theopportunity to enroll in the survey following a 15-minute presentation conducted at STN by NIOSHrepresentatives in the week prior to the survey. Inthat presentation, the purpose of the study, thetests that would be performed, and the risks andbenefits of participation were discussed.Following the presentation, each employee wasgiven the opportunity to enroll in all, portions of, ornone of the study. Informed consent was obtainedfrom each employee choosing to participate.
Survey Population
For this survey, the “exposed” populationconsisted of those employees who worked asFabrication Sprayers for any part of their workshift, and employees who performed activitiesother than spraying in the Fabrication area for atleast one half of their typical work shift. Thecomparison (“less exposed”) population consistedof all other employees who worked in the facilityand who did not perform activities in theFabrication area or who performed non-sprayingactivities in the fabrication area for less than onehalf of their typical work shift.
Questionnaire
On August 1, 2001, each participant was asked tocomplete a questionnaire. The questionnaireincluded questions concerning demographicfactors (age, gender, etc.), job factors, medicaland work history, non-occupational exposures, andsymptoms. The questionnaire was self-administered and a NIOSH staff member wasavailable to explain the questions, define medicalterms for participants, and check the questionnairefor completeness and errors. For evaluation of the
questionnaire, positive responses were determinedby a “yes” or “unsure” response to any question.Negative responses were determined by a “no”response.
Blood
Blood samples were analyzed for blood cell countsbecause the medical literature has suggested thatexposure to brominated solvents may beassociated with pancytopenia (a decrease in thenumber of all blood cell types). A 6-milliliter bloodsample was collected from each participant duringthe afternoon of August 2, 2001. Venipuncturewas performed by a trained technician followinguniversal precautions for working with blood andblood products.1 After venipuncture, bloodsamples were placed on ice and shipped to theNIOSH contract laboratory for analysis. Analysisconsisted of determining the white blood cell(WBC) count, red blood cell (RBC) count, andplatelet cell (PC) count of each specimen. Thecounts of these cell types were comparedbetween the exposed and comparison groups.
Urine
Urine specimens were collected early in themorning of July 31 (prior to the work shift—“start-of-week” sample) and in the afternoon of August2, 2001 (at the end of the work shift—“end-of-week” sample). After collection, urine sampleswere frozen, stored on ice, and shipped to theNIOSH contract laboratory for analysis. Analysisconsisted of measuring the bromine and creatinineconcentration of each specimen. At present, thereis not an established normal range for theconcentration of bromine in human urine and sovalues obtained were compared between theexposed and comparison groups.
For the purposes of this HHE, pre- or post-exposure urine specimens with a creatinine valueoutside of the acceptable range (creatinine lessthan 0.3 grams/liter [g/L] or greater than 3.0 g/L)

Health Hazard Evaluation Report No.2000-0410-2891 Page 5
were not reported or used for analysis, becausethey cannot be relied upon to accurately reflectthe true body burden of bromine.2 Urinarybromine levels were not corrected for creatinineconcentration. Start-of-week urine bromineconcentrations were compared to end-of-weekconcentrations so that the change over the 3-dayperiod could be determined.
Neurobehavioral Testing
Neurobehavioral testing measures basic psycho-physiological functions (alertness, reaction time,memory, tremor, sensory and motor performance).Two neurobehavioral test types (Postural Stabilityand Psychomotor Ability) were used in this surveyto evaluate the presence of neurologic changespotentially related to 1-BP exposure. Otherresearchers have used these or similar tests toevaluate neurologic changes due to solventexposure.3,4,5,6 Neurobehavioral testing waschosen over electromyography (tests of individualmuscle function) because it was felt to be a moresensitive measure of neurological change.Analysis of each test parameter, comparingexposed and comparison groups, was performedto determine if a significant difference existsbetween the group’s performance (between-groupanalysis).
Postural Stability
Each participant was tested on a microcomputer-controlled force platform using protocolsestablished by NIOSH and the University ofCincinnati.7,8,9 ,10 Test conditions were designed totest the three main afferents (variables)responsible for maintaining postural stability (e.g.,vision, vestibular perception, and proprioception).After one practice trial, each participant wasasked to stand on the force platform whileperforming each of six different posturalmaneuvers lasting 30 seconds. For the firstmaneuver, participants were instructed to removetheir shoes and stand still on the platform with
arms at their sides focusing on a fixed mark on thewall directly in front of them. The next maneuverrequired the participant to maintain the sameposture but with their eyes closed. These two testmaneuvers were then repeated while theparticipant stood on a 4-inch thick foam pad. Thefinal two test maneuvers required the participantto stand still on one leg with eyes open, butfocusing on the fixed mark on the wall was notrequired. This maneuver was then repeated whilestanding on the opposite leg. Sway area and swaylength were measured during each test. Swayarea represents the area within the sway path insquare centimeters, and sway length is the lengthof the sway path in centimeters.
Psychomotor Ability
A commercially available test system (CATSYS®)from Danish Product Development was used totest psychomotor ability.11 Eight tests wereselected to evaluate arm-hand tremor, simplereaction time, and rhythmic finger/hand tappingability. Test procedures and device characteristicsare described in a previous NIOSH publication.12
The test researcher explained and demonstratedeach test to the participant before allowing theindividual to perform that test. Participants wereallowed to repeat a test only if they did not startthe test within 5 seconds of when the equipmentwas activated and the researcher indicated thesubject should begin, or the computer determinedthat there were insufficient responses during thetest period to calculate an accurate test result.The system had a volume control which was set tomaximum volume so that any subject with hearingdifficulties could clearly hear the audible “clicks”produced for certain tests.
Tremor was measured using a tremor pen. Eachsubject held the pen first in the right hand and thenin the left hand (referred to as tremor pen rightand tremor pen left), similar to an ordinary pencil,in front of their chest with their elbow bent at 90degrees, and the forearm away from their body

Page 6 Health Hazard Evaluation Report No.2000-0410-2891
for a prescribed period of time while theequipment recorded movements of the pen. Eachhand was tested twice with results from thesecond test retained for data analysis. Tremorintensity (i.e., amplitude), the root-mean square ofaccelerations recorded in the 0.9 Hertz (Hz) to15.0 Hz band during a 16-second test, and centerfrequency (i.e., average frequency ofaccelerations at the mid-point of the energy band)were the principal measurements used foranalysis.
Simple auditory reaction time was assessed via ahand-held thumb switch (referred to as reactiontime). The participant was instructed to hold theswitch in his or her dominant hand and press thethumb switch every time he or she heard thesystem produce an audible ‘click.’ The testcomputer produced each ‘click’ at randomintervals for a total of 30 seconds. Mean responselatency (milliseconds) is the measurement used foranalysis.
The rhythmic finger tapping was assessed via ashock sensor. Each participant was instructed touse his or her dominant hand for the test. Thepalmar surface of the wrist rested on the tablesurface in front of the shock sensor and theparticipant was instructed not to elevate the wris toff the table surface during the test. When thetest began the participant was to tap their indexfinger on the sensor once for each audible ‘click’produced by the test computer. The first test useda long interval between each ‘click’ (referred toas slow rhythmic frequency finger tap). Thesecond test used a short interval between each‘click’ (referred to as fast rhythmic frequencyfinger tap). The last test used a crescendo,decreasing interval, between each ‘click’ (referredto as maximum frequency finger tap). Rhythmichand tapping was assessed using the same sensor.The participant was instructed to tap theirdominant hand on the sensor alternately using thesupinated (hand extended with palm surface up)then pronated (hand extended with palm surface
down) surface of their dominant hand with each‘click’ produced by the test computer. The firsttest used a long interval between each ‘click’(referred to as slow pronation/supination rhythmicfrequency). The second test used a crescendo,decreasing interval, between each ‘click’ (referredto as maximum frequency pronation/supination).
Reproductive Study
The reproductive portion of this HHE wasdesigned to evaluate changes in women’shormonal cycle that might be related to 1-BPexposure. A reproductive study of males was notconducted at STN primarily because there is onlyone male employee considered “exposed” at STN.The study included a questionnaire, first morningurine samples (5–10 milliliters) collected daily forone complete menstrual cycle (or, in the event ofamenorrhea, for at least 42 days), and daily diarydocumentation during the urine collection phase.The questionnaire for this portion of the studyincluded questions primarily pertaining toreproductive health history. Urine samples wereanalyzed (at the NIOSH ReproductiveEndocrinology Laboratory) for luteinizing hormone(LH), follicle stimulating hormone (FSH), and theprimary urinary metabolites of estrogen (estrone3-glucuronide [E,3G]) and progesterone(pregnanediol 3-glucuronide [Pd3G]). The dailydiary was used to document sample collection,presence of menses, and use of medications orbirth control.
At the time that the questionnaire wasadministered, NIOSH investigators provided eachparticipant with a collection kit and detailed verbaland written instructions on the urine collectionprocess. Participants were instructed to storeurine samples in their own freezer (at home)during the collection process; vials contained 7%glycerol to prevent freeze-induced activity loss ofLH and FSH.

Health Hazard Evaluation Report No.2000-0410-2891 Page 7
Women who volunteered in the femalereproductive health portion of the study (Phase II)were paid $100 for participation.
Statistical Analysis
Statistical analyses for this survey was performedusing SPSS for Windows Release 11.0.1 (SPSSInc., Chicago, IL). A p-value of 0.05 and 95%confidence intervals (95% CI) which excluded thevalue one were used to determine statistic alsignificance. The odds ratio (OR), a measure ofthe strength of association between reportedsymptoms and exposure, was used to evaluatequestionnaire responses. The OR represents theodds of an outcome in the “exposed” grouprelative to the odds in the “unexposed” group. AnOR of one means there is no association betweenthe outcome and “exposure.” An OR of greaterthan one indicates that there is evidence of anassociation. For example, an OR of two wouldmean that a person in the “exposed” group mayhave two times the odds of reporting the outcomethan a person in the “unexposed” group.
EVALUATION CRITERIA
As a guide to the evaluation of the hazards posedby workplace exposures, NIOSH field staffemploy environmental evaluation criteria for theassessment of a number of chemical and physicalagents. These criteria are intended to suggestlevels of exposure to which most workers may beexposed up to 10 hours per day, 40 hours perweek for a working lifetime without experiencingadverse health effects. It is, however, importantto note that not all workers will be protected fromadverse health effects even though theirexposures are maintained below these levels. Asmall percentage may experience adverse healtheffects because of individual susceptibility, a pre-existing medical condition, and/or ahypersensitivity (allergy). In addition, somehazardous substances may act in combination with
other workplace exposures, the generalenvironment, or with medications or personalhabits of the worker to produce health effectseven if the occupational exposures are controlledat the level set by the criterion. These combinedeffects are often not considered in the evaluationcriteria. Also, some substances are absorbed bydirect contact with the skin and mucousmembranes, and thus potentially increases theoverall exposure. Finally, evaluation criteria maychange over the years as new information on thetoxic effects of an agent become available.
The primary sources of environmental evaluationcriteria for the workplace are: (1) NIOSHRecommended Exposure Limits (RELs),13 (2) theAmerican Conference of Governmental IndustrialHygienists’ (ACGIH®) Threshold Limit Values(TLVs®), 14 and (3) the U.S. Department ofLabor, Occupational Safety and HealthAdministration (OSHA) Permissible ExposureLimits (PELs).15 Employers are encouraged tofollow the OSHA limits, the NIOSH RELs, theACGIH TLVs, or whichever are the moreprotective criteria.
OSHA requires an employer to furnish employeesa place of employment that is free fromrecognized hazards that are causing or are likely tocause death or serious physical harm[Occupational Safety and Health Act of 1970,Public Law 91-596, sec. 5(a)(1)]. Thus,employers should understand that not all hazardouschemicals have specific OSHA exposure limitssuch as PELs and short-term exposure limits(STELs). An employer is still required by OSHAto protect their employees from hazards, even inthe absence of a specific OSHA PEL.
A time-weighted average (TWA) exposure refersto the average airborne concentration of asubstance during a normal 8- to 10-hour workday.Some substances have recommended STEL orceiling values which are intended to supplement

Page 8 Health Hazard Evaluation Report No.2000-0410-2891
the TWA where there are recognized toxiceffects from higher exposures over the short-term.
1-Bromopropane and2-Bromopropane
Laboratory studies of the toxicology of 1-BP haveshown that excessive exposure of animals to 1-BPcan lead to reproductive and neurologic effects.The limited published information concerningoccupational exposure to 1-BP suggestsneurologic and reproductive effects in humans. Areview of the scientific literature relevant tooccupational exposure to 1-BP is presented in theAppendix.
Currently, there are no NIOSH, ACGIH, orOSHA exposure evaluation criteria for 1-BP.Albemarle Corporation (a manufacturer of 1-BP)has recommended an occupational exposureguideline for 1-BP, based on the initial, unauditeddata from a two-generation reproductive study inrats.16 In that study, young male and female ratsreceived a daily 6-hour inhalation exposure to aknown concentration of 1-BP for a minimum of 70days. After this period, the animals were pairedfor mating, and the daily exposures continuedthrough the 14-day mating period, and through day20 of gestation. No litters were observed in the750 parts per million (ppm) exposure group, and asignificant decrease was observed in the numberand size of litters in the 500 ppm exposure group.A slight (insignificant) decrease was observed inthe mean number of pups born and live pups perlitter for the 250 ppm exposure group. Based onthese results and a 10-fold safety factor,Albemarle set their 1-BP recommended exposureguideline at 25 ppm as an 8-hour TWAexposure.17
The South Korea Ministry of Labor is the onlygovernment agency to develop an occupationalexposure level (OEL) for 2-BP. In 1998, theMinistry issued a 2-BP OEL of 1 ppm as an 8-
hour TWA.18 This standard is based on a limitednumber of workplace epidemiological studies andtoxicological (animal) studies which found that 2-BP exposure produces reproductive effects inboth males (low sperm count) and females(ovarian dysfunction), and also affects theh e m a t o p o i e t i c ( b l o o d f o r m i n g )system.19,20,21,22,23,24,25
Local Exhaust Ventilation
The velocity of air at any point in front of a hoodnecessary to overcome opposing air currents andto capture the contaminated air at that point bycausing it to flow into the hood is called thecapture velocity.26 The velocity with which thecontaminant is released and other factors willdetermine the appropriate value for the capturevelocity. For the adhesive spraying operation atSTN, the contaminant dispersion would at least becharacterized as “low velocity release intomoderately still air,” for which the range ofrecommended capture velocities is 100–200ft/min. For some workstations, the contaminantdispersion might be better characterized as “activegeneration,” for which the range of recommendedcapture velocities is 200–500 ft/min.27
The lower end of these ranges is acceptable whenthe air currents at the point of capture are minimalor favorable to capture, the contaminant(s) is (are)of low toxicity or of nuisance value only, theproduction rate is low or intermittent, or the hoodis large enough to cover the work area and containthe air mass moving toward the hood. However,when disturbing air currents are present, thecontaminant(s) is (are) highly toxic, productionrates/contaminant-source-substance usage is highand/or the hood is small and capable of providinglocal control only, the upper end of the range isrecommended.27
For the adhesive spraying operation at STN,although disturbing room air currents were notprevalent, neither were they minimal or favorable

Health Hazard Evaluation Report No.2000-0410-2891 Page 9
to capture. Although not classifiable as highlytoxic, bromopropane toxicity is unknown (and wasnot classified as low toxicity). Production wasfairly steady, and the hood openings did not extendthe full width of the workstations. This indicatesthat the capture velocity should be at least 150ft/min and, for some workstations, as high as 350ft/min.
The capture velocity at the furthest point ofcontaminant release in front of a hood is related tothe required exhaust air flow by the equation28
Q = 0.75v(10x2 + A)
Where: Q = the required exhaust air flow in cubicfeet per minute (cfm)v = the capture velocity in feet per minute(ft/min)x = the distance in feet from the hoodface to the furthest point of contaminantrelease
and A = the hood face opening area insquare feet (ft2).29
The opening area is the width of the opening orslots multiplied by the distance from the bottom ofthe lowest slot or opening edge to the top of thehighest slot or opening edge.28
For the adhesive spraying operations in front ofthe back-draft hoods, the furthest point ofcontaminant release would be approximately 3 ftin front of the back wall of the workstations. Foreither: 1) the single 26-inch wide opening (7 incheshigh), or 2) the four 30-inch wide slots (1 inchhigh, spaced 6 inches apart), the exhaust flow rateshould be at least 10,000 cubic feet per minute(CFM). For the down-draft table with a 21-inchlong opening, 12 inches wide, the exhaust flowrate at 18 inches above the surface should be atleast 2700 CFM.
RESULTS
Air Sampling
November 2000—beforeenclosure of spray tables
A total of 14 full-shift 1-BP and 2-BP exposuremeasurements were collected from workers in theFabrication room (Table 1). Twelve of thesemeasurements were from Sprayers, and two werefrom floaters. The mean (average) 1-BP airconcentration for the Sprayers was 65.9 ppm,ranging from 41.3 to 143.0 ppm. All 12 of theSprayers had exposures which exceeded theAlbemarle exposure guideline of 25 ppm. The 1-BP concentrations for the two floaters were 8.7and 19.4 ppm.
The mean full-shift 2-BP concentration forSprayers was 0.66 ppm, ranging from 0.33 to 1.35ppm. One of these concentrations exceeded theSouth Korean OEL of 1 ppm. The 2-BPconcentrations for the floaters were 0.19 and 0.28ppm.
Random short- term (15-minute) and ceiling (5-minute) exposure measurements were obtained inorder to characterize acute 1-BP and 2-BPexposures in Sprayers. Nine short-term exposuremeasurements were obtained from Sprayers(Table 2). The short-term 1-BP concentrationsranged from 33.7 to 173.9 ppm, and the short-term2-BP concentrations ranged from 0.30 to 1.56ppm.
Eleven ceiling exposure measurements were alsoobtained from the Sprayers (Table 3). The 1-BPceiling concentrations ranged from 39.5 to 151.9ppm, and the 2-BP concentrations ranged from0.37 to 1.13 ppm.
Page 10 Health Hazard Evaluation Report No.2000-0410-2891
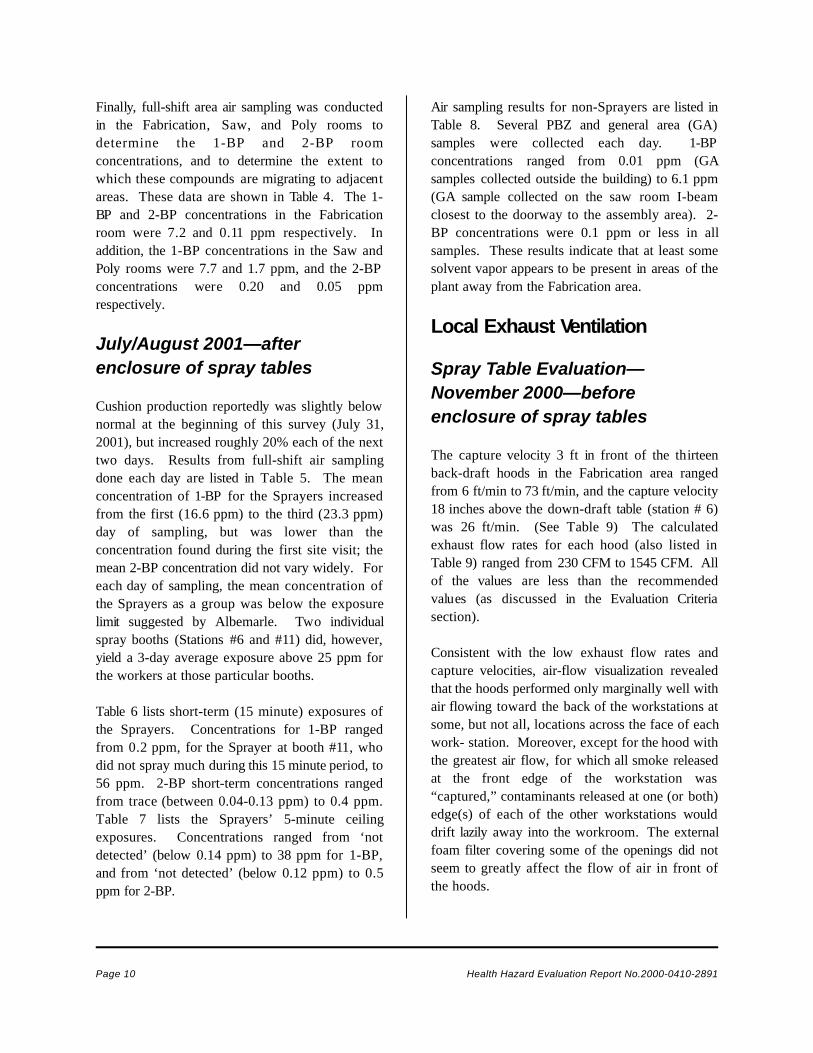
Finally, full-shift area air sampling was conductedin the Fabrication, Saw, and Poly rooms todetermine the 1-BP and 2-BP roomconcentrations, and to determine the extent towhich these compounds are migrating to adjacentareas. These data are shown in Table 4. The 1-BP and 2-BP concentrations in the Fabricationroom were 7.2 and 0.11 ppm respectively. Inaddition, the 1-BP concentrations in the Saw andPoly rooms were 7.7 and 1.7 ppm, and the 2-BPconcentrations were 0.20 and 0.05 ppmrespectively.
July/August 2001—afterenclosure of spray tables
Cushion production reportedly was slightly belownormal at the beginning of this survey (July 31,2001), but increased roughly 20% each of the nexttwo days. Results from full-shift air samplingdone each day are listed in Table 5. The meanconcentration of 1-BP for the Sprayers increasedfrom the first (16.6 ppm) to the third (23.3 ppm)day of sampling, but was lower than theconcentration found during the first site visit; themean 2-BP concentration did not vary widely. Foreach day of sampling, the mean concentration ofthe Sprayers as a group was below the exposurelimit suggested by Albemarle. Two individualspray booths (Stations #6 and #11) did, however,yield a 3-day average exposure above 25 ppm forthe workers at those particular booths.
Table 6 lists short-term (15 minute) exposures ofthe Sprayers. Concentrations for 1-BP rangedfrom 0.2 ppm, for the Sprayer at booth #11, whodid not spray much during this 15 minute period, to56 ppm. 2-BP short-term concentrations rangedfrom trace (between 0.04-0.13 ppm) to 0.4 ppm.Table 7 lists the Sprayers’ 5-minute ceilingexposures. Concentrations ranged from ‘notdetected’ (below 0.14 ppm) to 38 ppm for 1-BP,and from ‘not detected’ (below 0.12 ppm) to 0.5ppm for 2-BP.
Air sampling results for non-Sprayers are listed inTable 8. Several PBZ and general area (GA)samples were collected each day. 1-BPconcentrations ranged from 0.01 ppm (GAsamples collected outside the building) to 6.1 ppm(GA sample collected on the saw room I-beamclosest to the doorway to the assembly area). 2-BP concentrations were 0.1 ppm or less in allsamples. These results indicate that at least somesolvent vapor appears to be present in areas of theplant away from the Fabrication area.
Local Exhaust Ventilation
Spray Table Evaluation—November 2000—beforeenclosure of spray tables
The capture velocity 3 ft in front of the thirteenback-draft hoods in the Fabrication area rangedfrom 6 ft/min to 73 ft/min, and the capture velocity18 inches above the down-draft table (station # 6)was 26 ft/min. (See Table 9) The calculatedexhaust flow rates for each hood (also listed inTable 9) ranged from 230 CFM to 1545 CFM. Allof the values are less than the recommendedvalues (as discussed in the Evaluation Criteriasection).
Consistent with the low exhaust flow rates andcapture velocities, air-flow visualization revealedthat the hoods performed only marginally well withair flowing toward the back of the workstations atsome, but not all, locations across the face of eachwork- station. Moreover, except for the hood withthe greatest air flow, for which all smoke releasedat the front edge of the workstation was“captured,” contaminants released at one (or both)edge(s) of each of the other workstations woulddrift lazily away into the workroom. The externalfoam filter covering some of the openings did notseem to greatly affect the flow of air in front ofthe hoods.

Health Hazard Evaluation Report No.2000-0410-2891 Page 11
Observed work practices revealed that pieces offoam for seat cushions were stacked in front ofthe slot hoods at some workstations, preventingadhesive spraying in the region of the workstationwhere exhaust ventilation would be mosteffective. Some large pieces blocked the localexhaust ventilation slots while being sprayed withadhesive, restricting the effectiveness of the localexhaust ventilation.
Spray Booth Evaluation—July/August 2001—afterenclosure of spray tables
Table 10 shows the average capture velocitymeasured at each spray booth under two sets ofconditions: ‘doors open’ and ‘doors closed.’Capture velocities at the spray booths ranged from18 ft/min (Station #12) to 70 ft/min (Stations #1 ) with the doors closed. Operating with thedoors closed did not have a clear effect on thecapture velocity of all the spray hoods comparedto when the doors were open.
Medical Survey
Questionnaire
Of the 84 individuals employed at STN at the timeof the survey, 32 (38%) volunteered to participatein the medical survey. A total of 30 (36% of the84) employees completed the study questionnaire;included in this number were 12 (92%) of 13employees in the exposed group, and 18 (25%) of71 in the comparison group. Table 11 listsselected characteristics of participating employeeswho completed the questionnaire. Of note, theemployees in the groups were primarily women,and were of similar age. Employees in theexposed group had a mean length of employmentat STN of 13 years, compared to 21 years foremployees in the comparison group. Two (17%)in the exposed group and 7 (39%) in the
comparison group provided positive answers to thequestion concerning exposure (occupationally orthrough other activities) to other substances ofconcern (defined in the questionnaire as arsenic,mercury, lead, cadmium, solvents, or pesticides).The two subjects from the exposed groupresponding positively to this question had marked“don’t know” as their response and did not giveany further detail concerning their exposure in theexplanation section.
Regarding data collected concerning workpractices, 92% of exposed workers respondedthey always wore some type of protective clothing(such as an apron) while working; our observationof work practic es revealed that the aprons worndid not protect the arms from contact withsolvents. Two (17%) exposed and 1 (6%)comparison subject responded that they smoked“sometimes” or “rarely” in the work area. Sixteenpercent of the exposed group washed their hands“always” or “sometimes” before smoking andafter performing work activities. All participantsreported that they washed their hands beforeeating or chewing gum after performing workactivities.
Table 12 presents data concerning reportedsymptoms by exposure status (exposed versuscomparison group). The symptoms most oftenreported from all participants included: headache(reported by 48%), trouble falling asleep or stayingasleep (reported by 28%), dizziness or feeling “offbalance” (reported by 25%), and blurred vision(reported by 24%). The data in Table 12 revealthat two of the symptoms in the questionnaire hada statistically significant odds ratio between theexposed and comparison groups (indicating thatthose two symptoms were reported morecommonly among the exposed employees versusthe comparison group). The exposed groupreported 16 times the odds of experiencing blurredvision (95% CI 1.6 - 162), and 15 times the oddsof experiencing dizziness or a feeling of being “offbalance” (95% CI 1.5 - 153) within the last 30

Page 12 Health Hazard Evaluation Report No.2000-0410-2891
days. None of the odds ratios for the remainingsymptoms were statistically significantly elevated.Of the exposed employees, five of six reportingblurry vision and four of six reporting dizzinessnoted symptom improvement during time awayfrom the work environment. Two of six reportingblurry vision and two of six reporting dizzinessreported experiencing that symptom on the day thequestionnaire was administered.
Blood
A total of 24 (29% of the 84 total employees)participants agreed to have their blood drawn.Within this group, venipuncture was unsuccessfulon three participants, and 9 of the samplescollected clotted before arriving at the lab, makingthese specimens unsuitable for analysis.Consequently, only 3 (23%) of 13 exposed, and 9(13%) of 71 comparison blood samples wereavailable for analysis. All of the results for WBC,CBC, and PC were within the normal value rangeprovided by the testing laboratory.30 Nostatistically significant differences were detectedbetween the means of the blood indices for theexposed and comparison groups.
Urine
A total of 23 (27% of 84) participants providedstart-of-week and end-of-week urine specimens.Within this group 4 partic ipants were unable toprovide a start-of-week specimen and 2participants were unable to provide an end-of-week specimen. One specimen was excludedfrom analysis because it had a creatinineconcentration that fell outside the acceptablerange for this analysis (indicating that it cannot berelied upon to accurately reflect the true bodyburden of bromine). Consequently, there were 6(46%) of 13 exposed and 10 (14%) of 71comparison paired urine specimens available foranalysis.
Results of the urine bromine statistical analysesare in Table 13. The start-of-week and end-of-week urine bromine concentrations for theexposed group were both statistically significantlyhigher than the corresponding values for thecomparison group (p < 0.01). We found nosignificant elevation in urine bromine level in theend-of-week urine samples compared to the start-of-week urine samples—in other words, we didnot detect an increase in urine bromine from thefirst urine sample (start-of-week) to the secondurine sample (end-of-week). Regression analysisof both start-of-week and end-of-week urinarybromine concentrations versus personal breathingzone air concentrations of 1-BP demonstrated astatistically significant positive correlation.
Neurobehavioral Testing
A total of 30 participants participated in theneurobehavioral testing portion of the study;included in this number were 12 (92%) of 13exposed, and 18 (25%) of 71 comparisonemployees.
Postural Stability Testing
Not all study subjects were able to complete theentire Postural Stability test battery. Six subjects(one from the exposed group) were unable tostand on either their right or left leg for a longenough period of time to complete both of the lasttwo tests. Three subjects (all in the comparisongroup) were unable to stand for a long enoughperiod of time on either their right or left leg tocomplete one of the last two tests. We found nodifferences in the Postural Stability test resultsbetween employees in the exposed andcomparison groups.
Psychomotor Ability Testing
Results for each of the Psychomotor Ability testscan be found in Table 14. Every employee takingpart in the neurobehavioral testing completed the

Health Hazard Evaluation Report No.2000-0410-2891 Page 13
entire Psychomotor Ability test battery. Of the 16parameters tested, 3 demonstrated a statisticallysignificant difference between the exposed andcomparison groups. In each case the mean testvalue was higher (demonstrating increased effect)in the exposed group. These three parametersincluded right tremor pen intensity, right tremorpen frequency, and slow rhythmic frequencyfinger tap standard deviation.
Regression analysis of each of these variables(r ight tremor pen frequency, right tremor penintensity, and standard deviation of slow rhythmicfrequency finger tap) against PBZ airconcentrations of 1-BP demonstrated astatistically significant positive correlation only forright tremor pen frequency. No statisticallysignificant correlation was demonstrated for righttremor pen frequency when compared againsturine bromine concentrations, and neither of theother two variables mentioned above (right tremorpen intensity or slow rhythmic frequency fingertap standard deviation) demonstrated a statisticallysignificant correlation with any of the measures ofexposure.
Reproductive Evaluation
Ten women agreed to participate in thereproductive portion of the evaluation. Four of thewomen did not finish the study or provide urinesamples or diaries. Only one of the women whocompleted the study was in the exposed group(working in the Fabrication area); all the otherswere in the comparison (less exposed) group.Additionally, upon analysis of the urine specimens,it became apparent that the one exposed workerdid not follow the correct procedure for urinecollection. Therefore, none of the data wecollected for this portion of the survey was able tobe compared between exposed and comparisonworkers, and we will not be able to make anydeterminations of potential female reproductiveeffects of 1-BP exposure in this HHE. The
results of these menstrual cycle function analyseshave been provided to the participants.
DISCUSSION
Exposure Survey
The 1-BP exposure data from the November 2000sampling indicated that all 12 Sprayers had full-shift 1-BP exposures above the Albemarleexposure guideline of 25 ppm. Considering thesefindings, and the results of our ventilationassessment, the NIOSH investigators concludedthat the LEV system was not adequately removingor controlling the 1-BP vapors. Additionally, thearea air sampling data indicated that lowconcentrations of 1-BP and 2-BP were migratingto nearby areas. Follow-up air sampling inJuly/August 2001, revealed decreased mean 1-BPexposure of Sprayers by over 60% (22.5 ppm vs.62.1 ppm). 2-BP exposures also decreased over60% (0.2 ppm vs. 0.62 ppm). However,measurements at two spray booths (Station #6 and#11) revealed concentrations of 1-BP thatremained above the Albemarle exposure guideline.Our observation of work practices at thosestations indicates that individual work habits ofSprayers (e.g., the amount of adhesive sprayed oneach cushion) are likely important factorscontributing to the higher exposures observed atthose two spray booths.
Of note, some work practices which might havebeen expected to affect measured PBZ exposuresappeared not to have a measurable impact in oursurvey. For example, some Sprayers stayed attheir workstations during their morning, lunch,and/or afternoon breaks, while others left theFabrication room and went outdoors or to otherareas of the building. Additionally, Station #3, #6,#8, and #12 were set up to use a water-basedspray adhesive (not containing 1-BP), which ifused extensively during the day could result indecreased BP exposures for workers. However,

Page 14 Health Hazard Evaluation Report No.2000-0410-2891
the water-based spray adhesive was used onlysporadically during this survey, and had no obviouseffect on BP exposures received by the Sprayersusing it.
Some Sprayers used natural latex rubber gloves toprevent adhesive from getting on their skin. Whilethis may be effective in keeping adhesive off theirskin, it does not protect against dermal exposure to1-BP and 2-BP. At least one manufacturer of BPproducts recommends using gloves made offlexible laminates, such as Viton®.31
Ventilation Assessment
Whenever there is a potential for a hazardousexposure in a workplace, traditional industrialhygiene practice dictates that the followinghierarchy of controls, in decreasing order ofdesirability and effectiveness, be implemented toprotect worker health:
1. Elimination of the toxic substance fromthe workplace.
2. Substitution of the toxic substance with aless toxic substance.
3. Installation of engineering controlsdesigned to reduce exposure.
4. Use of administrative controls to reduceexposure.
5. Use of personal protective equipment toreduce exposure.
In many instances, it is not possible to eliminate orsubstitute a chemical or material from a productionprocess without altering the integrity of the desiredproduct. Thus, many strategies for reducinghazardous exposures center on the use ofengineering controls such as process isolationand/or local exhaust ventilation. At STN, 1-BPvapors have largely been controlled using thespray booths at each workstation, with each boothdischarging the captured air and vapors outside ofthe building. While spray booth operation as of theAugust 2001 site visit was an improvement over
conditions observed during the NIOSH survey ofNovember 2000, two things can be done to furtherimprove LEV effectiveness. With the Poly roomgarage door and Fabrication room outdoor exitdoor closed, the plastic curtain separating theAssembly room from the Saw room beganflapping due to the dramatic increase in airflowthrough this doorway into the Fabrication room.This did not occur with the doors open. Keepingthe doors closed is therefore more likely tominimize the migration of solvent vapors into theSaw room and rest of the building. Also, thereappeared to be a large amount of unused space inseveral of the spray booths. Minimizing theunused volume within each spray booth, while notdecreasing the work space so much that cushionassembly is hindered, will result in an increase inface velocity, without changing the exhaust fanspeed, duct size, etc.
Medical Survey
Questionnaire
Blurry vision and dizziness were reported morecommonly among the workers exposed to 1-BPcompared to those who were less exposed.Additionally, five of the six workers reportingblurry vision, and four of the six reportingdizziness, reported that the symptoms resolvedafter leaving the work environment. Previousstudies have demonstrated vision changes relatedto solvent exposure,32,33 and other studies havefound that chronic mixed solvent exposure cancause an increase in the subjective symptom ofdizziness.34,35 One of the two published casereports concerning occupational 1-BP exposuredid mention that individuals reported experiencingdizziness during exposure, but neither of thepublished reports noted exposed persons reportingblurry vision.20,21 The blurry vision and dizzinessreported in our questionnaire, however, arenonspecific symptoms which could have manypotential causes, and the low participation rate in

Health Hazard Evaluation Report No.2000-0410-2891 Page 15
the study makes it difficult to determine whetherthese findings are generalizable to the overallstudy population.
Hematological Effects
Our evaluation detected no association betweenoccupational exposure to 1-BP and changes inhematological indices; however, because of thesmall number of blood specimens available foranalysis, we cannot make a definite determinationregarding the blood test results and theirrelationship to 1-BP exposure.
Urinary Bromine
Our survey demonstrated that airborne 1-BPconcentrations were correlated with both start-of-week and end-of-week urine bromineconcentrations. This finding is consistent with thefindings of a previous 1-BP biological monitoringstudy.36 However, we did not demonstrate anincrease in urine bromine concentrations in theend-of-week sample compared to the start-of-week sample for individuals or the group as awhole. Possible explanations for this finding are:1) bodily elimination of bromine via the kidneysmay be slow, so that exposure to airborne 1-BPover a 3-day period (the time over which wecollected our samples) does not affect urinarybromine concentration at a level we can detect;and 2) exposure to 1-BP in the time period prior toour survey may have been greater than that duringour survey, leading to declining urine brominelevels (reflecting the decreased exposure).
Neurobehavioral
Psychomotor Ability Testing
In our survey the neurobehavioral test parametersfor frequency and intensity of tremor in the righthand were increased in the exposed group; righthand tremor frequency alone was correlated withairborne 1-BP concentrations. Many differenttypes of occupational exposures, includingexposure to solvents, have been associated withtremor.37 In general, tremors related to toxicexposures are thought to be due to effects of thetoxins on the central nervous system and not theperipheral nervous system.38,39 If 1-BP were tohave the same type of central mechanism, it is notlikely that overexposure to 1-BP would cause aunilateral tremor (tremor of one hand/arm and notthe other), which was the type of tremor ourtesting detected. Our findings of increasedunilateral tremor among the exposed workerscould be related to muscle fatigue of the right handand arm. Holding an adhesive spray gun(weighing 1 to 1.5 pounds) in one handc onsistently while performing job activities couldfatigue the muscles of that hand, arm andshoulder. Because the exposed group was testedlate in the work day (after performing job activitiesfor 4–6 hours), it is likely that some level of handor arm fatigue was present in these individuals.Muscle fatigue can cause a mild tremor, which thetremor pen test is sensitive enough to detect, andthe pen tremor test is unable to distinguishbetween muscle fatigue tremor and neurologicalbased tremor of the hand and arm. We did notcollect information concerning participants’dominant hand, or which hand they preferred touse when holding the adhesive spray gun, so weare unable to directly address that issue.
The time frame over which our tests wereadministered makes it impossible for us todistinguish whether the tremor detected might bedue to an acute or chronic condition or effect. It

Page 16 Health Hazard Evaluation Report No.2000-0410-2891
is possible that, in some cases, the tremor wenoted is a result of a chronic neurological conditionunrelated to current work activities or exposures(and which may have existed prior to work atSTN). Therefore, for all the reasons listed above,we are not able to determine the cause(s) of thetremor we observed with our medical testing.
A third parameter, the standard deviation of slowrhythmic frequency finger tap, was also increasedin the exposed group versus the comparison group.However, because the corresponding testparameter, slow rhythmic frequency finger tapmean, was not increased in the exposed group, itis likely that the finding related to the standarddeviation is not meaningful.
Postural Stability Testing
The postural sway studies we conducted failed todemonstrate any significant difference in balancebetween test groups despite the fact that thesymptom of dizziness was reported morefrequently among the exposed group. Onepossible reason for this could be that the“dizziness” reported in the questionnaire actuallyrepresented symptoms consistent with“lightheadedness,” rather than vertigo or alteredbalance. Additionally, the questionnaire addressedsymptoms occurring within the 30 days prior to ourevaluation. If the symptom was transient (notoc curring on the day of testing) the reportedsymptoms would not necessarily correlate withobjective testing.
Survey Limitations
The ability of this survey to detect any potentialassociations between 1-BP exposure and healtheffects was limited by several factors in additionto those limitations listed above. The firstlimitation was the small number of partic ipants,decreasing our ability to detect differencesbetween the exposed and comparison groups ifthey in fact existed. A second limitation was the
low participation rate, which could lead to aselection bias (persons who participated may notbe representative of all the workers). A thirdlimitation involves the fact that the 1-BPexposures at STN were moderate in comparisonto other facilities in the U.S., particularly afterventilation improvements were made at the plant.
CONCLUSIONS
Although we found the Sprayers at STN to havegreater exposure to 1-BP than other employeesdoing different work, we are unable to determineif these exposures constitute a health hazard.Further investigation of potential health effectsrelated to occupational exposure to 1-BP isneeded before any definitive conclusions can bemade. Nevertheless, because of symptomsreported in our survey which are consistent withknown effects of solvents, and because ofconcerns raised in other studies, until moredefinitive information is available we believe thatevery reasonable effort should be taken tominimize 1-BP exposures. By enclosing the spraybooths in the Fabrication area, STN hasdramatically reduced Sprayers’ exposures to 1-BPand 2-BP, as evidenced by reductions in full-shift,short-term, and ceiling exposures measured beforeand after LEV improvements were made.Improvements in the ventilation of spray booths #6and #11 are needed to bring those workstations upto the level of the remainder of the stations. Wealso found that the latex gloves used by Sprayersdo not protect them from dermal exposure to 1- or2-BP. Regarding our survey of urinary bromineconcentrations, we found that urinary bromineconcentrations were highly correlated to theairborne concentration of 1-BP to whichindividuals were occupationally exposed at thisfacility. We conclude that urinary bromine may bea good indicator of 1-BP exposure, however,further research is needed to confirm our findings.

Health Hazard Evaluation Report No.2000-0410-2891 Page 17
1. CDC [1989]. Guidelines for prevention oftransmission of human immunodeficiency virusand hepatitis B virus to health-care and publicsafety workers. MMWR 37(suppl. S-6):1–37.
2. Szava K [2001]. Personal communication.Email of July 16, 2001, from S. Szava, Director ofEducat ion , Amer ican Conference ofGovernmental Industrial Hygienists Worldwide(ACGIH®), to J. Nemhauser, Medical Officer,Medical Section, Hazard Evaluations andTechnical Assistance Branch, National Institutefor Occupational Safety and Health, Centers forDisease Control and Prevention, Public HealthService, U.S. Department of Health and HumanServices.
3. Dick RB, Setzer JV, Taylor BJ, Shukla R[1989]. Neurobehavioral effects of short durationexposures to acetone and methyl ethyl ketone. BrJ Ind Med 46:111–121.
4. Dick RB, Setzer JV, Wait R, Hayden MB,Taylor BJ, Tolos B, Putz-Anderson V [1984].Effects of acute exposure of toluene and methylethyl ketone on psychomotor performance.International Archives of OccupationalEnvironmental Health 54:91–109.
5. Dick RB, Kreig EF Jr., Setzer J, Taylor B[1992]. Neurobehavioral effects from acuteexposures to methyl isobutyl ketone and methylethyl ketone. Fundamental and Applied Toxicology19:453–473.
6. Mikkelsen S, Jorgensen M, Browne E,Gyldensted C [1989]. Mixed solvent exposure andorganic brain damage. A study on painters. ActaNeurologica Scandinavica Supplement 118:1–143.
RECOMMENDATIONS
The following recommendations are made to assistin minimizing worker exposure to 1-BP (and 2-BP).
1) STN should continue investigating the use ofnon-hydrocarbon solvent adhesives. This mayrequire experimentation with the flow of cushionparts within Fabrication, since the water-basedadhesives do not ‘set up’ as quickly as does thecurrent adhesive most frequently used at STN.
2) When buying a 1-BP based adhesive, STNshould choose the one with the lowest amount ofresidual 2-BP.
3) STN should provide Fabrication Sprayers withgloves that protect against dermal exposure to 1-BP and 2-BP; materials to consider include glovesand aprons made from flexible laminates (e.g.,Viton™, 4H™ (PE/EVAL), Silver Shield™).
4) The Fabrication room outdoor exit and the Polyroom garage doors should remain closed so thatvapor migration into other areas of the building isminimized.
5) The unused volume in each spray booth shouldbe decreased as much as possible to optimize thecurrent ventilation. This should increase the LEVcapture velocity and further lower workerexposures.
6) Sprayers, and other employees using chemicals,should not eat or drink at their workstations.
7) The findings of our medical survey do not bythemselves indicate that medical follow-up isneeded for any specific employees or groups ofemployees. However, employees who areexperiencing health effects potentially related tothe workplace should be evaluated by a healthcare
provider who has experience with occupational orenvironmental health issues.
REFERENCES

Page 18 Health Hazard Evaluation Report No.2000-0410-2891
7. Dick RB, Bhattacharya A, Shukla R [1990].Use of a computerized postural swaymeasurement system for neurobehavioraltoxicology. Neurotoxicology and Teratology12:1–6.
8. N I O S H [ 1 9 9 5 ] . R e s e a r c hProtocol-DBBS-95-02: Neurobehavioral healthrisks in farmworkers. Cincinnati, OH: U.S.Department of Health and Human Services,Public Health Service, Centers for DiseaseControl and Prevention, National Institute forOccupational Safety and Health.
9. Bhattacharya A, Morgan R, Shukla R,Rarnakrishanan H K, Wang L [1987].Noninvasive estimation of afferent inputs forpostural stability under low levels of alcohol.Annals Biomed Eng 15:533–550.
10. Bhattacharya A, Shukla R, Dietrich K,Bornschein R, Berger O [1995]. Effect of earlylead exposure on children's postural balance.Developmental Med Child Neurol 37:861–878.
11. Danish Product Development Ltd. [1994].TREMOR 3.0 Users Manual. Snekkersten,Denmark.
12. NIOSH [1999]. Hazard evaluation andtechnical assistance report: Mercury WasteSolutions, Inc., Union Grove, WI. Cincinnati, OH:U.S. Department of Health and Human Services,Public Health Service, Centers for DiseaseControl and Prevention, National Institute forOccupational Safety and Health, NIOSH HETAReport No. 1998-0320-2751.
13. NIOSH [1992]. Recommendations foroccupational safety and health: compendium ofpolicy documents and statements. Cincinnati, OH:U.S. Department of Health and Human Services,Public Health Service, Centers for DiseaseControl and Prevention, National Institute forOccupational Safety and Health, DHHS (NIOSH)Publication No. 92-100.
14. ACGIH [2002]. 2002 TLVs® and BEIs®:threshold limit values for chemical substances andphysical agents. Cincinnati, OH: AmericanConference of Governmental IndustrialHygienists.
15. CFR [2002]. 29 CFR 1910.1000. Code ofFederal Regulations. Washington, DC: U.S.Government Printing Office, Office of the FederalRegister.
16. Stump D [2001]. An inhalation two-generation reproductive toxicity study of 1-bromopropane in rats. Study No. WIL-380001.Ashland, OH: WIL Research Laboratories.Unpublished. (Study sponsored by BrominatedSolvents Consortium [BSCO]).
17. Smith RL [2000]. Presentation titled “N-Propyl Bromide” which was given on November6, 2000, at a meeting between the U.S.Environmental Protection Agency and theBrominated Solvents Consortium.
18. Korean Ministry of Labour [2002]: Regulationon threshold limit values for chemical substancesand physical agents. Announcement No. 2002-8.Korean Ministry of Labour, Seoul, Korea.
19. Park JS, Kim Y, Park DW, et al. [1997]. Anoutbreak of hematopoietic and reproductivedisorders due to solvents containing 2-bromopropane in an electronic factory, SouthKorea: epidemiological survey. J Occup Health39:138–143.
20. Kim Y, Jung K, Hwan T, et al. [1996].Hematopoietic and reproductive hazards of SouthKorean electronics workers exposed to solventscontaining 2-bromopropane. Scand J WorkEnviron Health 22:387–391.
21. Ichihara Y, Yu S, Kamijima M, et al. [1997].An occupational health investigation of a factoryproducing 2-bromopropane in China. J OccupHealth 39 suppl: S327.

Health Hazard Evaluation Report No.2000-0410-2891 Page 19
22. Ichihara G, Aseda N, Kumazawa T, et al.[1997]. Testicular and hematopoietic toxicity of2-bromopropane, a substitute for ozone layerdepleting chlorofluorocarbons. J Occup Health39:57–63.
23. Kamijima M, Ichihara G, Yu X, et al. [1997].Disruption of ovarian cyclicity due to2-bromopropane in the rat. J Occup Health39:3–4.
24. Yu IJ, Chung YH, Lim CH, et al. [1997].Reproductive toxicity of 2-bromopropane inSprague Dawley Rats. Scand J Work EnvironHealth 23:281–288.
25. Lim CH, Maeng SH, Lee JY, et al. [1997].Effects of 2-bromopropane on the femalereproductive function in Sprague Dawley rats. IndHealth 35:278–284.
26. ACGIH [1998]. Industrial Ventilation. 23rd
ed., A Manual of Recommended Practice.Cincinnati, OH: American Conference ofGovernmental Industrial Hygienists. Fig 3-1, p.3-3.
27. ACGIH [1998]. Industrial Ventilation. 23rd
ed., A Manual of Recommended Practice.Cincinnati, OH: American Conference ofGovernmental Industrial Hygienists. Table 3-1, p.3-6.
28. ACGIH [1998]. Industrial Ventilation. 23rd
ed., A Manual of Recommended Practice.Cincinnati, OH: American Conference ofGovernmental Industrial Hygienists. Fig 3-11, p. 3-12.
29. ACGIH [1998]. Industrial Ventilation. 23rd
ed., A Manual of Recommended Practice.Cincinnati, OH: American Conference ofGovernmental Industrial Hygienists. Fig 3-8, p.3-9.
30. Normal range values for hematologic indices,Medtox Laboratories, Inc., St. Paul, MN, August7, 2001.
31. Ensolv MSDS. World Wide Web[URL=www.ensolv.com. ], August 27, 2001.
32. Yasugi T, Kawai T, Mizunuma K, Kishi R,Harabuchi I, Yuasa J, Eguchi T, Sugimoto R, SeijiK, Ikeda M [1994]. Exposure monitoring andhealth effect studies of workers occupationallyexposed to cyclohexane vapor. InternationalArchives of Occupational & Environmental Health65(5):343–350.
33. Kishi R, Eguchi T, Yasugi T, Katakura Y,Arata Y, Harabuchi I, Kawai T, Masuchi A[2001]. Effects of low-level occupational exposureto styrene on color vision: dose relation wit h aurinary metabolite. Environmental Research85(1):25–30.
34. Horstman SW, Browning SR, Szeluga R,Burzycki J, Stebbins A [2001]. Solvent exposuresin screen printing shops. Journal of EnvironmentalScience & Health Part A—Toxic/HazardousSubstances & Environmental Engineering36(10):1957–1973.
35. Juntunen J [1993]. Neurotoxic syndromesand occupational exposure to solvents.Environmental Research 60(1):98–111.
36. Kawai T, Takeuchi A, Miyama Y, SakamtoK, Zhang ZW, Higashikawa K, Ikeda M [2001].Biological monitoring of occupational exposure to1-bromopropane by means of urinalysis for 1-bromopropane and bromide ion. Biomarkers6(5):303–312.
37. Dick F, Semple S, Chen R, Seaton A [2000].Neurological deficits in solvent-exposed painters:a syndrome including impaired colour vision,cognitive deficits, tremor and loss of vibrationsense. QJM 93(10):655–661.

Page 20 Health Hazard Evaluation Report No.2000-0410-2891
38. Troster AI, Woods SP, Fields JA, Lyons KE,Pahwa R, Higginson CI, Koller WC [2002].Neuropsychological deficits in essential tremor: anexpression of cerebello-thalamo-corticalpathophysiology? Eur J Neurol 9(2):143–51.
39. Deuschl G, Bergman H [2002].Pathophysiology of nonparkinsonian tremors. MovDisord 17 (Suppl 3):S41–48.

Health Hazard Evaluation Report No.2000-0410-2891 Page 21
Table 1Full-Shift PBZ air sampling results for 1- and 2-BP
STN Cushion CompanyThomasville, North Carolina
HETA 2000-0410-2891November 14, 2000
Tables
Job Title DepartmentSampleTime(min.)
SampleVolume
(L)
Concentration, ppm, 8-hr.TWA
1-BP 2-BP
Sprayer Fabrication 498 25.0 41.3* 0.5*
Sprayer Fabrication 496 25.0 143.0* 1.4*
Sprayer Fabrication 495 25.0 74.7* 0.8*
Sprayer Fabrication 296 15.0 29.4 0.2
Sprayer Fabrication 494 24.9 73.4* 0.7*
Sprayer Fabrication 487 24.5 48.6* 0.5*
Sprayer Fabrication 492 24.9 75.8* 0.8*
Sprayer Fabrication 494 24.9 78.3* 0.7*
Sprayer Fabrication 491 24.8 51.3* 0.6*
Part Time Fabrication 350 17.5 34.7 0.4
Part Time Fabrication 282 14.1 32.3 0.3
Part Time Fabrication 350 17.5 41.3 0.5
Floater Fabrication 345 17.3 6.3 0.1
Floater Fabrication 349 17.5 14.1 0.2
Recommended exposure guideline 25 1
Minimum Detectable Concentration (MDC) 0.01 0.01
Minimum Quantifiable Concentration (MQC) 0.03 0.02
* For sampling periods longer than 8 hrs., the average concentrations for the time sampled is given.
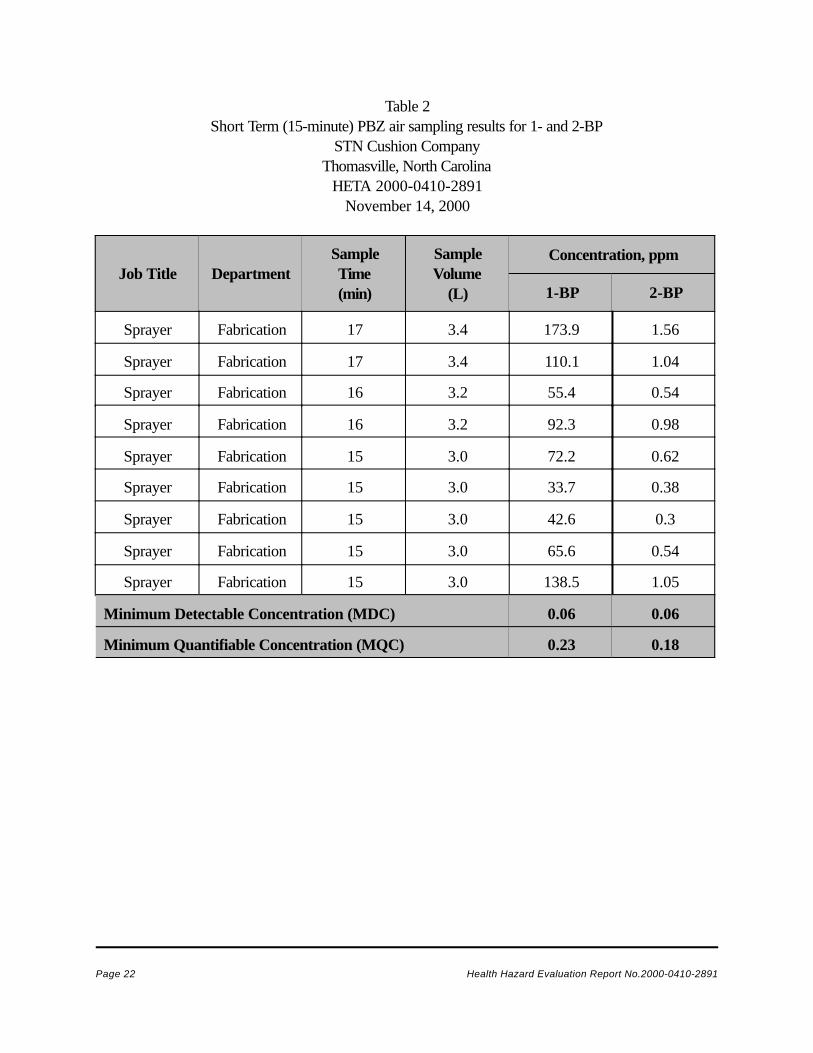
Page 22 Health Hazard Evaluation Report No.2000-0410-2891
Table 2Short Term (15-minute) PBZ air sampling results for 1- and 2-BP
STN Cushion CompanyThomasville, North Carolina
HETA 2000-0410-2891November 14, 2000
Job Title DepartmentSampleTime(min)
SampleVolume
(L)
Concentration, ppm
1-BP 2-BP
Sprayer Fabrication 17 3.4 173.9 1.56
Sprayer Fabrication 17 3.4 110.1 1.04
Sprayer Fabrication 16 3.2 55.4 0.54
Sprayer Fabrication 16 3.2 92.3 0.98
Sprayer Fabrication 15 3.0 72.2 0.62
Sprayer Fabrication 15 3.0 33.7 0.38
Sprayer Fabrication 15 3.0 42.6 0.3
Sprayer Fabrication 15 3.0 65.6 0.54
Sprayer Fabrication 15 3.0 138.5 1.05
Minimum Detectable Concentration (MDC) 0.06 0.06
Minimum Quantifiable Concentration (MQC) 0.23 0.18

Health Hazard Evaluation Report No.2000-0410-2891 Page 23
Table 3Ceiling (5-minute) PBZ air sampling results for 1- and 2-BP
STN Cushion CompanyThomasville, North Carolina
HETA 2000-0410-2891November 14, 2000
Job Title DepartmentSampleTime (min)
SampleVolume
(L)
Concentration, ppm
1-BP 2-BP
Sprayer Fabrication 5 1.2 151.9 1.13
Sprayer Fabrication 6 1.6 51.9 0.49
Sprayer Fabrication 6 1.5 44.3 0.59
Sprayer Fabrication 5 1.2 114.3 1.13
Sprayer Fabrication 5 1.3 70 0.81
Sprayer Fabrication 6 1.5 102.8 1.08
Sprayer Fabrication 6 1.6 48.7 0.63
Sprayer Fabrication 6 1.6 39.5 0.37
Sprayer Fabrication 6 1.6 72.2 0.8
Sprayer Fabrication 5 1.2 49.7 0.56
Sprayer Fabrication 5 1.5 67.6 0.69
Minimum Detectable Concentration (MDC) 0.12 0.12
Minimum Quantifiable Concentration (MQC) 0.5 0.37

Page 24 Health Hazard Evaluation Report No.2000-0410-2891
Table 4Full-Shift Area Air Sampling Data for 1- and 2-Bromopropane
STN Cushion CompanyThomasville, North Carolina
HETA 2000-0410-2891November 14, 2000
Sample LocationSampleTime(min)
SampleVolume
(L)
Concentration, ppm
1-BP 2-BP
In the middle of the Saw room 480 46.3 7.7 0.2
In the middle of the Fabrication room 478 47.0 7.2 0.11
In the middle of the Poly room 474 45.9 1.7 0.05
Minimum Detectable Concentration 0.004 0.004
Minimum Quantifiable Concentration 0.02 0.01

Health Hazard Evaluation Report No.2000-0410-2891 Page 25
Table 5 – Full shift PBZ air sampling results for 1- and 2-BPHETA 2000-0410-2891
STN Cushion Company, Thomasville, North CarolinaJuly 31 to August 2, 2001
Samplelocation
Concentration (ppm), 8-hr TWAAverage
1-BP exposure
July 31 August 1 August 2
sample vol(L)
1-BP 2-BP sample vol(L)
1-BP 2-BP sample vol(L)
1-BP 2-BP
Station #1 43.6 8.8 0.1
Station #2 43.8 15 0.2 45.8 10.6 0.1 48.3 20.7 0.1 15.4
Station #3 43.4 15.1 0.1 48.6 14.2 0.1 47.4 24.8 0.2 18
Station #4 42.7 21.1 0.2 49.2 16.3 0.2 37.3 19.9 0.2 19.1
Station #5 34.6 14.71,2
0.2 44 16.11 0.2 46.7 23.81,2,3 0.2 18.2
Station #6 35.9 31.9 0.3 30.1 17W,1 0.1 45.9 34.9 0.4 27.9
Station #7 35 16.51,2
0.1 44.9 17.3 0.2 47.3 15.31,2,3 0.2 16.4
Station #8 31.1 13.91 0.1 32.5 17.5 0.1 45.3 14.3 0.2 15.2
Station #9 34.3 15.11 0.2 27.8 7.7 0.1 49.3 28.43 0.3 17
Station#10
34 11.8 0.1 42 21.81 0.2 23.7 17.82,3 0.2 17
Station#11
33.8 15.81 0.2 44.4 29 0.2 47.4 32.71 0.3 25.8
Station#12
34 18.9W
0.2 45.3 17.81 0.2 46.5 24.11,3 0.2 20.2
Mean 16.6 0.2 16.8 0.1 23.3 0.1
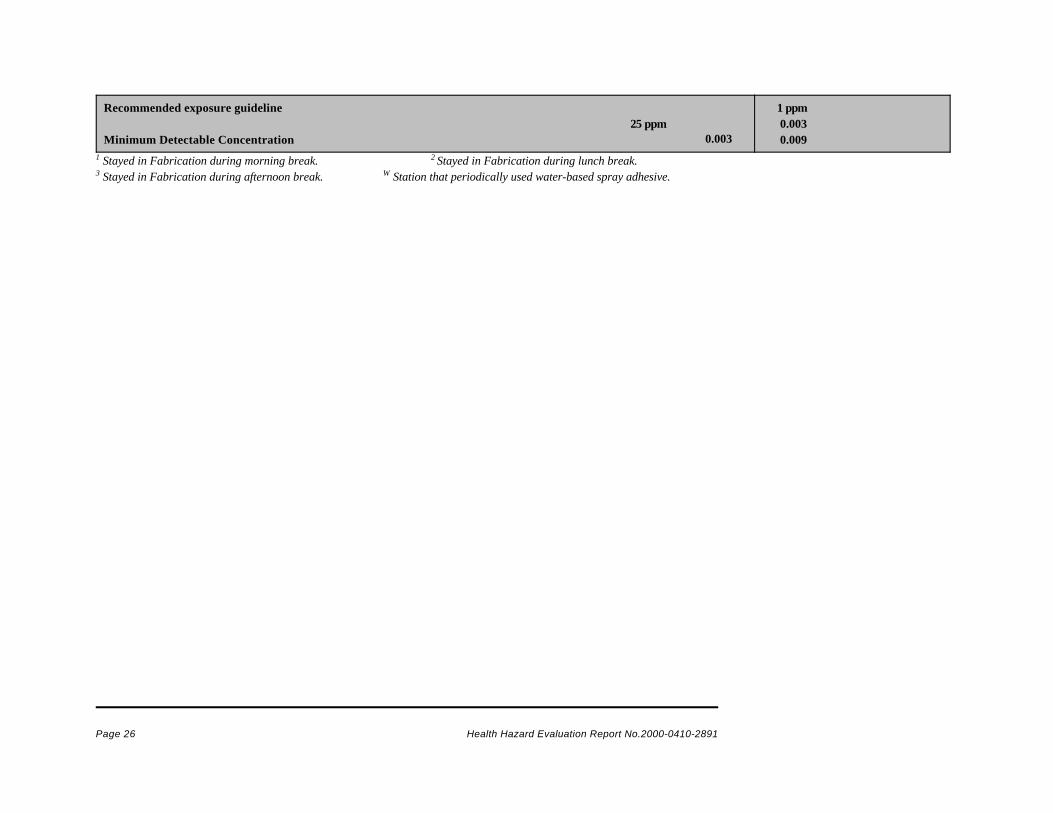
Page 26 Health Hazard Evaluation Report No.2000-0410-2891
Recommended exposure guideline 25 ppm
Minimum Detectable Concentration 0.003
1 ppm 0.003 0.009
1 Stayed in Fabrication during morning break. 2 Stayed in Fabrication during lunch break.3 Stayed in Fabrication during afternoon break. W Station that periodically used water-based spray adhesive.

Health Hazard Evaluation Report No.2000-0410-2891 Page 27
Table 6Short term (15 minute) PBZ air sampling results for 1- and 2-BP
HETA 2000-0410-2891STN Cushion Company
Thomasville, North CarolinaJuly 31 to August 2, 2001
Sample location Sample volume (L) 1-BP, ppm 2-BP, ppm
Station #2 3 8 Trace*
Station #3 3 16 0.2
Station #5 3.2 26 0.3
Station #6 3 47 0.4
Station #7 3 31 0.3
Station #8 3 7 Trace
Station #9 3 56 0.2
Station #10 3 40 0.4
Station #11 3 0.2 Trace
Station #12 3 25 0.2
Minimum Detectable Concentration 0.05 0.04Minimum Quantifiable Concentration 0.13 0.13
* Trace concentrations fall between the MDC and the MQC.

Page 28 Health Hazard Evaluation Report No.2000-0410-2891
Table 7Ceiling (5 minute) PBZ air sampling results for 1- and 2-BP
HETA 2000-0410-2891STN Cushion Company
Thomasville, North CarolinaJuly 31 to August 2, 2001
Sample location Sample vol. (L) 1-BP, ppm 2-BP, ppm
Station #2 1 32 ND*
Station #3 1.1 21 ND
Station #4 1 35 0.5
Station #5 1 26 ND
Station #6 1 ND ND
Station #7 1 ND ND
Station #8 1 ND ND
Station #9 & 12** 1.1 ND ND
Station #10 1.3 29 ND
Station #11 1 38 ND
Minimum Detectable Concentration 0.14 0.12Minimum Quantifiable Concentration 0.4 0.4
* ND—‘Not Detected’, concentrations are below the MDC. **Worker worked at both booths during this time.

Health Hazard Evaluation Report No.2000-0410-2891 Page 29
Table 8Air sampling results from non-sprayers
HETA 2000-0410-2891STN Cushion Company
Thomasville, North CarolinaJuly 31 to August 2, 2001
Sample type Date Location Sample vol(L)
1-BP, ppm,8-hr TWA
2-BP, ppm,8-hr. TWA
PBZ 1 37102 Shipping 36.1 5.8 0.1
PBZ 37102 Tick cutting 36 5.4 0.1
PBZ 37102 Sewing 36.1 5 0.1
PBZ 37102 Pattern room 35.9 4.6 0.1
PBZ 37102 Front office 36.5 4.2 0.1
GA 2 37102 Outside on fence 19.5 0.01 ND*
GA 37102 Outside near fab. AC unit 22.6 0.01 ND
PBZ 37103 Poly cut 45.6 2.4 0.04
PBZ 37103 Feather room 11.8 1.1 0.03
GA 37103 Pattern room 48 5 0.09
PBZ 37103 Fabric cut 19.8 2 0.04
GA 37104 Fabrication doorway intoSaw room
43.4 6.1 0.1
GA 37104 Poly cut 44.9 4.1 0.1
PBZ 37104 Sewing 47.2 5.2 0.1
PBZ 37104 Poly cut 47 3.8 0.1
GA 37104 Front office 44.9 3.1 0.1
GA 37104 I-beam in Poly cut 42.4 5 0.1
Minimum Detectable Concentration 0.004 0.003Minimum Quantifiable Concentration 0.011 0.011
1 PBZ—Personal Breathing Zone.2 GA—General Area.

Page 30 Health Hazard Evaluation Report No.2000-0410-2891
* ND—‘Not Detected’, concentrations are below the MDC.
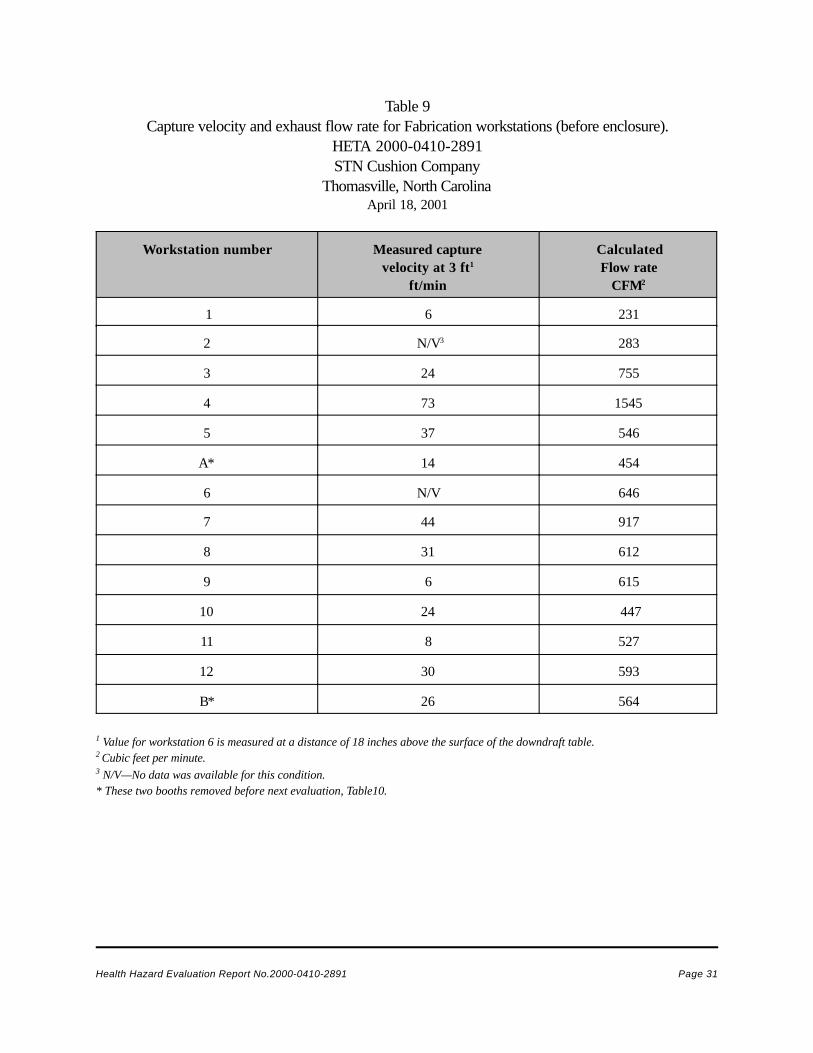
Health Hazard Evaluation Report No.2000-0410-2891 Page 31
Table 9Capture velocity and exhaust flow rate for Fabrication workstations (before enclosure).
HETA 2000-0410-2891STN Cushion Company
Thomasville, North CarolinaApril 18, 2001
Workstation number Measured capturevelocity at 3 ft1
ft/min
CalculatedFlow rate
CFM2
1 6 231
2 N/V3 283
3 24 755
4 73 1545
5 37 546
A* 14 454
6 N/V 646
7 44 917
8 31 612
9 6 615
10 24 447
11 8 527
12 30 593
B* 26 564
1 Value for workstation 6 is measured at a distance of 18 inches above the surface of the downdraft table.2 Cubic feet per minute.3 N/V—No data was available for this condition.* These two booths removed before next evaluation, Table10.

Page 32 Health Hazard Evaluation Report No.2000-0410-2891
Table10Average Spray Booth Ventilation Hood Face Velocity (after enclosure)
HETA 2000-0410-2891STN Cushion Company
Thomasville, North CarolinaJuly 31 to August 2, 2001
Station # # measurementsused to average
Capture Velocity*w/doors open (ft/min)
Capture Velocity w/doorsclosed (ft/min)
1 & 2 28 57 70
3 20 30 50
4 20 34** 37
5 20 35 37
6 20 41 39
7 20 25 27**
8 20 17 24
9 & 10 28 26** 25
11 20 19 21
12 20 18 18
* Measured at 3 ft from the LEV hood.** Indicates that measurements were only taken once, rather than twice as done for the other average values.

Health Hazard Evaluation Report No.2000-0410-2891 Page 33

Page 34 Health Hazard Evaluation Report No.2000-0410-2891
Table 11Characteristics of Study Participants Completing Questionnaire
HETA 2000-0410-2891STN Cushion Company
Thomasville, North CarolinaJuly 31 to August 2, 2001
CharacteristicParticipants in Exposed
Group (N=12)Participants in Comparison
Group (N=18)
# (%) Female 12 (100%) 15 (83%)
Mean Age in Years (Range) 44 (29-65) 36 (21-55)
# (%) White 8 (67%) 16 (89%)
# (%) Black 4 (33%) 2 (11%)
Mean Length of Employment atSTN in Months
(Range)13 (2-24) 21 (1-85)
# (%) Reporting PrescriptionMedication Use
6 (50%) 7 (39%)
# (%) Reporting Exposure toOther Substances of Concern1 2 (17%) 7 (39%)
# (%) Smoking Cigarettes2 5 (42%) 10 (56%)
1 Question asked if individual had any hobbies, household chores, part-time jobs or other activities that involveuse of arsenic, mercury, lead, cadmium, solvents, pesticides or other chemicals.
2 Individuals who responded “yes” to the question “Do you currently smoke cigarettes?”

Health Hazard Evaluation Report No.2000-0410-2891 Page 35
Table 12Reported Symptoms and Odds Ratios Among 1-Bromopropane Exposed and Comparison Groups
HETA 2000-0410-2891STN Cushion Company
Thomasville, North CarolinaJuly 31 to August 2, 2001
Symptom
# (%) ofParticipantsReporting
Symptom - Exposed Group
N=12
# (%) ofParticipantsReporting
Symptom - Comparison
GroupN=18
OddsRatio
95 % ConfidenceInterval
Lower - Upper
Anxiety, nervousness 2 (17%) 2 (11%) 1.78 0.21 14.86Appetite increase 0 (0%) 2 (11%) § § §Appetite decrease 0 (0%) 0 (0%) § § §Blurred vision 6 (50%) 1 (6%) 16.00* 1.58 162.10Trouble concentrating 1 (8%) 0 (0%) § § §Depression 3 (25%) 1 (6%) 6.00 0.54 67.28Diarrhea 1 (8%) 1 (6%) 1.60 0.09 28.57Dizziness; feeling “offbalance”
6 (50%) 1 (6%) 15.00* 1.48 152.50
Felt drunk, “high,”“stoned”
1 (8%) 0 (0%) 1.10 0.91 1.33
Headache 7 (58%) 7 (39%) 2.00 0.45 8.96Memory loss;forgetfulness
2 (17%) 2 (11%) 1.50 0.18 12.46
Nausea 4 (33%) 2 (11%) 3.75 0.56 25.12Numbness or “pinsand needles” feeling inhands
3 (25%) 3 (17%) 1.67 0.28 10.09
Numbness or “pinsand needles” feeling infeet
4 (33%) 1 (6%) 9.71 0.92 103.04
Sleeping too much 2 (17%) 1 (6%) 3.78 0.30 47.56Trouble falling asleepor staying asleep
5 (42%) 3 (17%) 4.17 0.75 23.18
Tremor or shakiness 2 (17%) 1 (6%) 4.25 0.33 54.07Weakness/clumsinessin hands
1 (8%) 2 (11%) 0.80 0.06 10.01
Problems with handwriting
1 (8%) 1 (6%) 1.70 0.10 30.28
Weakness in arms 3 (25%) 3 (17%) 1.88 0.31 11.52Weakness in feet 2 (17%) 0 (0%) 1.22 0.93 1.62Weakness in legs 3 (25%) 1 (6%) 6.38 0.57 71.27Walking problems 1 (8%) 0 (0%) 1.10 0.91 1.33Weight loss 1 (8%) 1 (6%) 1.70 0.10 30.28
§ One or more of the contingency table counts was equal to zero.

Page 36 Health Hazard Evaluation Report No.2000-0410-2891
* Asterisks indicate a significant difference from the comparison group (*p<0.05.)

Health Hazard Evaluation Report No.2000-0410-2891 Page 37
Table 13Urine Bromine Analysis Of 1-Bromopropane Exposed and Comparison Groups
HETA 2000-0410-2891STN Cushion Company
Thomasville, North CarolinaJuly 31 to August 2, 2001
Measure (MatchedPair)
PopulationNumberSubjects
GeometricMean1
MinimumValue1
MaximumValue1
Probability (p value)
Start-of-week UrineBromine
Concentration
Exposed 7 6.4 1.8 14.0 0.005*
Comparison 10 1.9 1 3.5
End-of-week UrineBromine
Concentration
Exposed 7 7.7 2.5 38.0 0.003*
Comparison 12 2 0.8 6.2
Post Minus Pre-Exposure
Concentration(Difference)
Exposed 6 -0.42 -3 3.1 0.7103
Comparison 10 0.12 -1.3 3.6 0.9173
1 Concentration is reported in milligrams per liter.2 Value is arithmetic mean (Geometric mean can not evaluate negative numeric data.)3 Test Value = 0, Ho: mean of sample = 0 (For exposed group expect mean to be > 0, for comparison group expect mean to be = 0.)* Asterisks indicate a significant difference from the comparison group (*p<0.05.)

Page 38 Health Hazard Evaluation Report No.2000-0410-2891
Table 14Neurobehavioral Test Parameter Analysis Of 1-Bromopropane Exposed and Comparison Groups
HETA 2000-0410-2891STN Cushion Company
Thomasville, North CarolinaJuly 31 to August 2, 2001
Measure PopulationNumberSubjects
Mean Minimum
ValueMaximum
ValueProbability
(p value)Tremor Pen Right – Intensity
(meter/second2)Exposed 12 0.14 0.10 0.22 0.033*
Comparison 18 0.11 0.06 0.16Tremor Pen Right –Frequency (Hertz)
Exposed 12 7.5 5.7 8.8 0.001*Comparison 18 6.3 4.5 8.8
Tremor Pen Right –Harmonic Index
Exposed 12 0.92 0.85 0.99 0.717Comparison 18 0.92 0.85 0.98
Tremor Pen Left – Intensity(meter/second2)
Exposed 12 0.11 0.07 0.19 0.241Comparison 18 0.10 0.06 0.16
Tremor Pen Left – Frequency(Hertz)
Exposed 12 6.5 4.4 9.2 0.882Comparison 18 6.4 4.7 8.4
Tremor Pen Left – HarmonicIndex
Exposed 12 0.90 0.87 0.95 0.100Comparison 18 0.88 0.79 0.98
Reaction Time – MeanExposed 12 0.264 0.183 0.354 0.415
Comparison 18 0.248 0.189 0.310Reaction Time –
Standard DeviationExposed 12 0.048 0.020 0.090 0.917
Comparison 18 0.049 0.029 0.105
Slow RF1 Finger Tap – MeanExposed 12 -0.0563 -0.158 0.022 0.253
Comparison 18 -0.0713 -0.164 0.027Slow RF1 Finger Tap –
Standard DeviationExposed 12 0.059 0.018 0.114 0.015*
Comparison 18 0.044 0.029 0.096

Health Hazard Evaluation Report No.2000-0410-2891 Page 39
Table 14 (Continued)Neurobehavioral Test Parameter Analysis Of 1-Bromopropane Exposed and Comparison Groups
HETA 2000-0410-2891STN Cushion Company
Thomasville, North CarolinaJuly 31 to August 2, 2001
Measure PopulationNumberSubjects
Mean Minimum
ValueMaximum
ValueProbability
Fast RF1 Finger Tap – MeanExposed 12 -0.0603 -0.154 -0.001 0.755
Comparison 18 -0.0513 -0.139 0.014Fast RF1 Finger Tap –
Standard DeviationExposed 12 0.047 0.008 0.115 0.062
Comparison 18 0.029 0.016 0.131Maximum Frequency Finger
TapExposed 12 5.0 1.6 7.5 0.819
Comparison 18 5.2 3.2 7.5
Slow P/S2 RF1 – MeanExposed 12 -0.0653 -0.138 0.004 0.692
Comparison 18 -0.0663 -0.149 0.077Slow P/S2 RF1 –
Standard DeviationExposed 12 0.066 0.032 0.155 0.602
Comparison 18 0.056 0.032 0.136
Maximum Frequency P/S2 Exposed 12 3.7 2.5 6.0 0.491
Comparison 18 3.2 1.0 4.9
1 Rhythmic Frequency.2 Pronation/Supination.3 Value is arithmetic mean (Geometric mean can not evaluate negative numeric data.)* Asterisks indicate a significant difference from the comparison group (*p<0.05.)

Page 40 Health Hazard Evaluation Report No.2000-0410-2891
APPENDIX
Brominated SolventsBackground and Significance
In 1990 the Clean Air Act (CAA) was amendedto include more stringent provisions for theprotection of stratospheric ozone and the phase-out of several ozone-depleting substances underTitle VI of the law.1 The law targeted thecomplete phase-out of several substancesi n c l u d i n g c h l o r o f l u o r o c a r b o n s ,hydrochlorofluorocarbons, and methylchloroform, each of which was being used byindustry at that time. Industrial applications ofthese substances included non-aerosol solventcleaning, adhesive coatings applications, andsolvent applications.2 The CAA amendmentprovisions were in part enacted to abide by theterms of a United Nations (UN) internationalagreement, The Montreal Protocol onSubstances that Deplete the Ozone Layeradopted in 1987, which committed to reduce andeventually eliminate the use of ozone-depletingsubstances. As a result, several countriesdiscontinued and prohibited further use of ozone-depleting substances.3 Under Section 612 of theCAA, ozone-depleting substances were to bereplaced with alternative substances or processesthat reduced the risks to human health and theenvironment.1 To fulfill the law’s requirement, theEnvironmental Protection Agency (EPA) initiatedthe Significant New Alternatives Policy (SNAP)program intended to approve safe alternatives forozone-depleting substances.4
The solvents 1-bromopropane (1-BP) and 2-bromopropane (2-BP) were introduced intoworkplaces around the world as substitutes forozone-depleting substances following initiation of
the 1987 UN international treaty. The physicalproperties of these two solvents, including highvolatility and low flammability, were seen asfavorable characteristics for a non-aerosolsolvent. Due to photochemical breakdown, thesolvents have a relatively short atmospheric half-life (17.5 to 24 days), possibly decreasing theirozone-damaging capacity.5,6
At the present time, 2-BP is not produced forcommercial use in the United States (U.S.).However, 1-BP is produced and commerciallyavailable in the U.S. The purity of 1-BP is listedas 99% in Material Safety Data Sheets (MSDS)from two laboratory reagent manufacturers.7,8 A1999 Occupational Safety and HealthAdministration (OSHA) analysis of severalcommercial samples of 1-BP found them tocontain 2-BP in concentrations ranging from 0.1to 0.2 percent.9 A voluntary consensus standard(D6368-00) published by the American SocietyFor Testing and Materials has since beenreleased covering vapor degreasing and generalgrade 1-BP and specifies that the content of 2-BP in these solvent grades remain below 0.1percent.10 Currently only 1-BP is being reviewedunder the SNAP program as a potentialalternative to ozone-depleting substances.2 Atthis time, the EPA has not disapproved the use of1-BP, so it may be used for any purpose in theU.S. (while 2-BP may not).9
Review of Literature—1-Bromopropane
Animal exposure studies have demonstratedreproductive toxicity for both male and femalerats when exposed to concentrations greater thanor equal to 200 parts per million (ppm) of1-BP.11,12 Two studies noted mild hepatic

Health Hazard Evaluation Report No.2000-0410-2891 Page 41
changes in rats exposed to greater than or equalto 800 ppm of 1-BP; these changes wereconsidered adaptive and reversible due to theabsence of other signs of hepatotoxicity.11,13,14
Although 2-BP exposure has been associatedwith pancytopenia, animal studies evaluatingpotential hematopoietic effects of 1-BP exposurehave yielded no firm conclusions. The medianlethal inhalation concentration of 1-BP forSprague-Dawley rats has been estimated to be14,374 ppm.13
Four studies have demonstrated some form ofneurotoxicity in rats exposed to 1-BP. Allstudies involved exposure concentrations greaterthan or equal to 800 ppm. Three of the studiesdemonstrated decreased peripheral nervefunctioning by electrophysiologic testing andmorphologic or histopathologic abnormalities ofcentral and peripheral nerves.15,16,17 Two ofthese three studies also demonstrated aprominent weakness of the hind limbs followingexposure.15,17 A fourth study demonstrateddecreased peripheral nerve functioning byelectrophysiologic testing alone.18 One of the fivestudies established that the muscle weakness anddecreased electrophysiologic findings were bothdependent on concentration and length ofexposure period.17 This same study and oneother came to the conclusion that 1-BP was amore potent neurotoxicant than 2-BP; anotherstudy that evaluated the neurotoxicity of both 1-BP and 2-BP was unable to conclude that 1-BPwas a more potent neurotoxicant.15,18
A total of four persons with health effectsconsidered related to 1-BP exposure have beendescribed in two published case reports. Thefirst case report concerned a 19-year-old maleworking as a metal ‘stripper’.19 He was exposedon a daily basis over a two-month period to an
industrial solvent (containing greater than 95.5percent 1-BP by weight) used for degreasing andcleaning. His right hand was most commonlyexposed to the solvent. The air concentration of1-BP and type of ventilation were not discussedin the article. Presenting symptoms included“numbness and mild but progressive weakness ofthe proximal lower extremities and the righthand… transient dysphagia and urinarydifficulties.”19 The physical findings, magneticresonance imaging (MRI) of the brain, andelectromyography (EMG) findings supported thediagnosis of a “primary demyelinating condition,predominantly affecting the lower extremities, inthe distribution of an acquired neuropathy, butwith evidence of central nervous systeminvolvement as well.” The EMG did not indicateany evidence of muscle denervation. Theindividual did demonstrate improvement followingremoval from exposure, but was lost to follow-upbefore it was determined if the health effectswould fully resolve.
The second case report concerned three females,ages 35, 30, and 50, each working at cushionmanufacturing companies in North Carolina.20
The workers sprayed glue (containing 55 percent1-BP as the base solvent) with a spray gun ontopolyurethane foam pieces. A total of 15 workersperformed this process in an open work area.Exhaust ventilation provided at each workstationwas operated intermittently and workers worelatex gloves for dermal exposure protection. Thefirst worker’s symptoms developed one yearfollowing the replacement of a dichloromethane-based glue with the 1-BP-based glue. Theremaining two workers developed symptoms sixmonths and two months, respectively, followingcommencement of their employment in theexposure area. Airborne exposures of the threeworkers were not well described; the case report

Page 42 Health Hazard Evaluation Report No.2000-0410-2891
did state that one worker was found to havetime-weighted average (TWA) exposures ofbetween 60 to 261 ppm of 1-BP over severaldays of monitoring 5 months after symptoms hadstarted.
“The three workers showed the commonsymptoms of staggering, numbness andparesthesia/dysesthesia with a similar distributionin their feet, legs, thighs, lower back and hips aswell as a remarkable decrease in vibration sense,along with various symptoms of the centralnervous system and autonomic symptoms.”20
Other symptoms experienced by the workersincluded temporary menstrual cycle disruption fortwo of the three women, diarrhea, abnormalsweating, and urinary incontinence. Theresearchers concluded that 1-BP likely causedthe peripheral and central nervous system deficitsand that the other noted symptoms were likelyrelated to autonomic system disruption secondaryto 1-BP exposure. The study did not indicate ifthe symptoms improved or resolved uponremoval from exposure.
Limited information is available from anunpublished abstract submitted at the 2002Annual Meeting of the Society of Toxicologyregarding the only 1-BP human health effectstudy performed to date.21 The study evaluateda group of 25 female workers, exposed to lowlevels of 1-BP, for neurological effects,comparing them to a group of 27 unexposedcont ro ls . Neurobehaviora l andelectrophysiological assessments of nervefunction were performed on both groups.Because of the limited nature of the informationpresented in this abstract, it is difficult to drawconclusions from this study.
Review of Literature— 2-Bromopropane
Following report of the occurrence of secondaryamenorrhea among female workers in a tactileswitch assembly section of a South Koreanfactory, two studies were performed to evaluatethe health effects of workers in the factory.22,23
The studies found background area air sampleconcentrations of 2-BP to range from 9.2 to 19.6ppm. The concentration of 2-BP detected duringa short-term sample inside the hood of a cleaningbath was 4,140.7 ppm. One study theorized thatworkers might be exposed to higherconcentrations of 2-BP for short periods of timewhen performing operations at the cleaningbath.22 The other study theorized that becausethere were two uncovered 2-BP baths in the areaand ventilated air was recirculated, 2-BPconcentrations were routinely elevated in thework area.23 Both studies concluded that 2-BPexposure was the probable cause of the healtheffects (ovarian failure in females, azoospermia oroligospermia in males, and pancytopenia) notedin the exposed workers.
Following these reports, several studies designedto evaluate health effects associated withexposure of rats to 2-BP were initiated; thesestudies demonstrated ovarian, testicular, andhematopoietic dysfunction beginning at exposurelevels of greater than 300 ppm or 250 milligramper kilogram (mg/kg).24,25,26,27,28 Two studiesrecently demonstrated peripheral neurotoxicchanges and peripheral neuropathy in ratsexposed to 1,000 ppm of 2-BP.18,29 The medianlethal inhalation concentration of 2-BP for theSprague-Dawley rat has been estimated to be31,171 ppm.30

Health Hazard Evaluation Report No.2000-0410-2891 Page 43
1. United States Code [1990]. 42 USC7401 et. seq. Washington, DC: U.S. GovernmentPrinting Office.
2. 65 Federal Register 78977 [2000].Environmental Protection Agency: Protection ofstratospheric ozone: Notice 14 for significant newalternatives policy program; notice ofacceptability; request for information.
3. United Nations Environmental Programme[ 2 0 0 0 ] . O z o n e T r e a t i e s .[http://www.unep.ch/ozone/treaties.shtml]. Dateaccessed: May 5, 2002.
4. 58 Fed. Reg. 54892 [1993]. EnvironmentalProtection Agency: Protection of stratosphericozone; final rule.
5. Donaghy T, Shanahan I, Hande M, FitzpatrickS [1993]. Rate constants and atmosphericlifetimes for the reactions of OH radicals and Clatoms with haloalkanes. Int J Chem Kinet25(4):273–84.
6. Meylan WM, Howard PH [1993]. Computerestimation of the atmospheric gas-phase reactionrate of organic compounds with hydroxyl radicalsand ozone. Chemosphere 26(12):2293–2300.
7. Aldrich Chemical Company. Material safetydata sheet for 1-bromopropane, 99%. May 2002.
8. Acros Organics N.V. Material safety datasheet for 1-bromopropane, 99%. May 2002.
9. OSHA [1999]. Nomination of 1-bromopropane (1-BP) and 2-bromopropane (2-BP) for testing by the National ToxicologyProgram. Washington, DC: Department of Labor,Directorate of Health Standards Programs, U.S.Occupational Safety and Health Administration,DOL (OSHA).
10. ASTM [2001]. D6368-00 Standardspecification for vapor-degreasing grade andgeneral grade normal-propyl bromide. West
One study has been conducted to evaluate thehealth effects of 2-BP on employees working ata 2-BP manufacturing plant. During the study,conducted in 1996, worker breathing zoneexposure concentrations ranged from 0.80 to16.18 ppm as an 8-hour TWA. The studyincluded worker interviews, medicalexaminations, and specific testing of reproductiveand hematological indices. “No severe cases ofreproductive or hematopoietic disorders werefound at (exposures) less than 10 ppm (TWA),but a possible adverse effect of 2-bromopropaneon hematopoiesis could not be disproved.”31
1-Bromopropane Biomarker ofExposure
A study has demonstrated that among sevendifferent solvents, 1-BP was the only solvent thatsignificantly (p < 0.01) influenced theconcentration of 1-BP and bromine in the urine ofexposed subjects, and thus either measure can beused as a biomarker of exposure.32 In that study,1-BP concentration in the urine was shown to bemore highly correlated to the airborne 1-BPexposure (p < 0.01, r = 0.952) than was bromineconcentration in the urine (p < 0.01, r = 0.738).However, urinary 1-BP detection requires gaschromatography-mass spectrometry (GCMS)instrumentation and the specimen must beimmediately analyzed after collection. Mostclinical laboratories can perform brominedetection, and analysis may be delayed withoutserious degradation of specimen quality. Costconstraints would be the main reason whybromine analysis might be chosen over GCMSanalysis in a study.
Appendix References

Page 44 Health Hazard Evaluation Report No.2000-0410-2891
Conshohocken, PA: American Society for TestingMaterials.
11. Ichihara G, Yu X, Kitoh J, Asaeda N,Kumazawa T, Iwai H, Shibata E, Yamada T,Wang H, Xie Z, Maeda K, Tsukamura H,Takeuchi Y [2000]. Reproductive toxicity of 1-bromopropane, a newly introduced alternative toozone layer depleting solvents, in male rats.Toxicological Sciences 54:416–423.
12. Stump D [2001]. An inhlation two-generationreproductive toxicity study of 1-bromopropane inrats. Study No. WIL-380001.
Ashland, OH: WIL Research Laboratories.Unpublished. (Study sponsored by BrominatedSolvents Consortium [BSCO]).
13. Kim HY, Chung YH, Jeong JH, Lee YM, SurGS, Kang JK [1999]. Acute and repeatedinhalation toxicity of 1-bromopropane in SD rats.J Occup Health 41:121–128.
14. NTP [2002]. NTP-CERHR expert panelreport on the reproductive and developmentaltoxcity of 1-bromopropane. Washington, DC:U.S. Department of Health and Human Services,National Institutes of Health, National Institute ofEnvironmental Health Sciences, NationalToxicology Program, DHHS (NTP) PublicationNo. NTP-CERHR-1-BP-02.
15. Yu X, Ichihara G, Kitoh J, Xie Z, Shibata E,Kamijima M, Takeuchi Y [2001]. Neurotoxicityof 2-bromopropane and 1-bromopropane,alternative solvents for chlorofluorocarbons.Environmental Research 85(1):48–52.
16. Wang H, Ichihara G, Ito H, Kato K, Kitoh J,Yamada T, Yu X, Tsuboi S, Moriyama Y,Sakatani R, Shibata E, Kamijima M, Itohara S,Takeuchi Y [2002]. Biochemical changes in thecentral nervous system of rats exposed to 1-bromopropane for seven days. Toxicological
Sciences 67:114–120.
17. Ichihara G, Kitoh J, Yu X, Aseda N, Iwai H,Kumazawa T, Shibata E, Yamada T, Wang H, XeiZ, Takeuchi Y [2000]. 1-bromopropane, analternative to ozone layer depleting solvents, isdose-dependently neurotoxic to rats in long-terminhalation exposure. Toxicological Sciences55:116–123.
18. Zhao W, Aoki K, Xie T, Misumi J [1999].Electrophysiological changes induced by differentdoses of 1-bromopropane and 2-bromopropane. JOccup Health 41:1–7.
19. Sclar G [1999]. Encephalomyelo-radiculoneuropathy following exposure to an
industrial solvent. Clinical Neurology andNeurosurgery 101:199–202.
20. Ichihara G, Miller JK, Ziolkowska A, ItoharaS, Takeuchi Y [2002]. Neurological disorders inthree workers exposed to 1-bromopropane.J Occup Health 44:1–7.
21. Ichihara G, Li W, Shibata E, Ding X,Kamijima M, Wang H, Liang Y, Peng S, ItoharaS, Fan Q, Zhang Y, Zhong W, Wu X, ValentineWM, Takeuchi Y [2002]. Neurologicalabnormality in workers of 1-bromopropane factory[Abstract]. Presented at the 41st Annual Meetingof the Society of Toxicology, Nashville, TN,March 17–21.
22. Kim Y, Jung K, Hwang T, Jung G, Kim H,Park H, Kim J, Park J, Park D, Park S, Choi K,Moon Y [1996]. Hematopoietic and reproductivehazards of Korean electronic workers exposed tosolvents containing 2-bromopropane. Scand JWork Environ Health 22:387–391.
23. Park J, Kim Y, Park DW, Choi KS, Park S,Moon Y [1997]. An outbreak of hematopoeticand reproductive disorders due to solventscontaining 2-bromopropane in an electronic

Health Hazard Evaluation Report No.2000-0410-2891 Page 45
factory, South Korea: epidemiological survey.J Occup Health 39:138–143.
24. Kamijima M, Ichihara G, Yu X, Kitoh J,Tsukamura H, Maeda K, Yu X, Xie Z, NakajimaT, Asaeda N, Hisanaga N, Takeuchi Y [1997].Ovarian toxicity of 2-bromopropane in the non-pregnant female rat. J Occup Health 39:144–149.
25. Kamijima M, Ichihara G, Yu X, Xie Z, KitohJ, Tsukamura H, Maeda K, Nakajima T, AsaedaN, Hisanaga N, Takeuchi Y [1997]. Disruption inovarian cyclicity due to 2-bromopropane in the rat.J Occup Health 39:3–4.
26. Lim CH, Maeng SH, Lee JY, Chung YH,Kim TG, Park JH, Moon YH, Yu IJ [1997].Effects of 2-bromopropane on the femalereproductive function in Sprague-Dawley rats.Industrial Health 35:278–284.
27. Yu IJ, Chung YH, Lim CH, Maeng SH, LeeJY, Kim HY, Lee SJ, Kim CH, Kim TG, Park JS,Moon YH [1997]. Reproductive toxicity of 2-bromopropane in Sprague-Dawley rats. Scand JWork Environ Health 23:281–288.
28. Ichihara G, Asaeda N, Kumazawa T,Tagawa Y, Kamajima M, Yu X, Kondo H,Nakajima T, Kitoh J, Yu IJ, Moon YH, HisanagaN, Takeuchi Y [1997]. Testicular andhematopoietic toxicity of 2-bromopropane, asubs t i tu te for ozone layer-deple t ingchlorofluorocarbons. J Occup Health 39:57–63.
29. Yu X, Ichihara G, Xie Z, Shibata E, KamijimaM, Asaeda N, Hisanaga N, Takeuchi Y [1999].Effect of inhalation exposure to 2-bromopropaneon the nervous system in rats. Toxicology135:87–93.
30. Kim HY, Chung YH, Yi KH, Kim JG, Yu IJ[1996]. LC50 of 2-bromopropane. IndustrialHealth 34:403–407.
31. Ichihara G, Ding X, Yu X, Wu X, KamijimaM, Peng S, Jiang X, Takeuchi Y [1999].
Occupational health survey on workers exposed to2-bromopropane at low concentrations. Am J IndMed 35:523–531.
32. Kawai T, Takeuchi Y, Moriyama Y,Sakamoto K, Zhang ZW, Higashikawa K, IkedaM [2001]. Biological monitoring of occupationalexposure to 1-bromopropane by means ofurinalysis for 1-bromopropane and bromide ion.Biomarkers 6(5):303–312.

DEPARTMENT OF HEALTH AND HUMAN SERVICESCenters for Disease Control and PreventionNational Institute for Occupational Safety and Health4676 Columbia ParkwayCincinnati, OH 45226-1998
OFFICIAL BUSINESSPenalty for private use $300
Delivering on the Nation's promise: Safety and Health at work for all peoplethrough research and prevention
To receive NIOSH documents or informationabout occupational Safety and Health topics
contact NIOSH at:
1-800-35-NIOSH (356-4674) Fax:1-513-533-8573 E-mail: [email protected]
or visit the NIOSH web site at:www.cdc.gov/niosh/homepage.html
S A F E R • H E A L T H I E R • P E O P L E™