hernandez masters report - repositories.lib.utexas.edu
TRANSCRIPT

Copyright
by
Marinoelle Hernandez
2010

The Report Committee for Marinoelle Hernandez Certifies that this is the approved version of the following report:
Climate Action Strategies for The University of Texas at Austin
APPROVED BY
SUPERVISING COMMITTEE:
David Eaton
Jim Walker
Supervisor:

Climate Action Strategies for The University of Texas at Austin
by
Marinoelle Hernandez, B.A.
Report
Presented to the Faculty of the Graduate School of
The University of Texas at Austin
in Partial Fulfillment
of the Requirements
for the Degree of
Master of Public Affairs
The University of Texas at Austin
May 2010

iv
Acknowledgements
This report would not have been possible without the invaluable input and
guidance from Dr. David Eaton and Jim Walker. The author would also like to thank
faculty and staff of The University of Texas at Austin who participated in the “Survey on
Feasibility of Carbon Reduction Strategies for UT-Austin.”
May 2010
v
Abstract
Climate Action Strategies for The University of Texas at Austin
Marinoelle Hernandez, M.P.Aff.
The University of Texas at Austin, 2010
Supervisor: David Eaton
This report analyzes the current greenhouse gas emissions inventory for The
University of Texas at Austin (UT-Austin), reviews the carbon reduction strategies being
implemented at UT-Austin and other peer institutions, and offers recommendations for
strategies that could reduce greenhouse gas emissions at UT-Austin in the future.
vi
Table of Contents
List of Tables ................................................................................................... viii
List of Figures.....................................................................................................ix
Chapter 1: Executive Summary ............................................................................1
Chapter 2: Introduction ........................................................................................8
Chapter 3: Greenhouse Gas Emissions Inventory .................................................9
Chapter 4: Energy Efficiency and Carbon Reduction Strategies..........................14
Supply Side Energy Management Strategies..............................................16
Demand Side Management Strategies........................................................18 Purchasing ........................................................................................20
Transportation...................................................................................21
Student-led Initiatives – Bike Loan Service and Waste Reduction.....21 Campus Awareness Outreach............................................................22
Future Initiatives...............................................................................22
Chapter 5: Peer University Carbon Mitigation Strategies....................................24
Infrastructure Strategies.............................................................................25 Buildings and Equipment..................................................................26
Power Generation .............................................................................29
Behavioral Strategies.................................................................................31
Campus Awareness and Programs ....................................................31 Purchasing ........................................................................................33
Transportation...................................................................................34
Waste................................................................................................36
Chapter 6: Analysis............................................................................................37 Feasibility..................................................................................................38
Ease of Implementation .............................................................................39

vii
Cost...........................................................................................................40
Impact on Greenhouse Gas Emissions .......................................................41
Chapter 7: Recommendations.............................................................................43
Short-term.................................................................................................44
Mid-term...................................................................................................44
Long-term .................................................................................................44
Chapter 8: Conclusion........................................................................................46
Bibliography ......................................................................................................55
Vita... .................................................................................................................59

viii
List of Tables
Table 1: UT-Austin 2006 Greenhouse Gas Emissions by Source..................................... 2 Table 2: UT-Austin’s Supply and Demand Side Management Strategies ......................... 3 Table 3: Peer University Carbon Reduction Strategies..................................................... 5 Table 4: Strategies Categorized Under Timeframes......................................................... 6 Table 5: UT-Austin GHG Emissions by Source for Years 2003-2006............................ 10 Table 6: UT-Austin’s Energy Efficiency and Carbon Reduction Strategies.................... 15 Table 7: Hal C. Weaver Power Plant Energy Efficiency Strategies ................................ 16 Table 8: UT-Austin Power Plant Energy Efficiency and Carbon Mitigation Strategies .. 17 Table 9: UTakeCharge Program Demand Side Management Projects............................ 19 Table 10: Peer Institution List of Infrastructure Carbon Reduction Strategies ................ 26 Table 11: Peer Institution List of Behavioral Carbon Reduction Strategies .................... 32 Table 12: Evaluation of Strategies................................................................................. 38 Table 13: Strategy Implementation Timeframes ............................................................ 43

ix
List of Figures
Figure 1: UT-Austin 2006 GHG Emissions by Source..................................................... 2 Figure 2: UT-Austin 2006 Overall GHG Emissions Percentages by Source................... 11

1
Chapter 1: Executive Summary
The University of Texas at Austin (UT-Austin) is on a path toward becoming a
more sustainable campus. Through the adoption of a campus sustainability policy, the
completion of a greenhouse gas (GHG) emissions inventory and the implementation of
strategies that reduce GHG emissions, UT-Austin has taken great strides toward
understanding its impact on the environment and reducing that impact. This report
provides recommendations on how UT-Austin can continue to reduce its carbon footprint
by examining the following: UT-Austin’s greenhouse gas emissions inventory, current
carbon reduction strategies being used by UT-Austin, and peer university carbon
reduction strategies.
In 2009, UT-Austin completed a greenhouse gas emissions inventory for the years
2000 to 2006 that accounted for its direct (Scope I) and indirect (Scopes II and III)
emissions sources. Scope I emissions sources include the burning of natural gas for
electricity, fleet vehicle and shuttle bus fuel consumption, refrigerants and landscape
compost. Scope II emissions result from electricity purchased from local utility Austin
Energy. Scope III emissions sources include solid waste, air travel, purchased goods and
services, student/staff/faculty commute, water and wastewater. Table 1 lists UT-Austin’s
greenhouse gas emissions by source for 2006.1

2
Table 1: UT-Austin 2006 Greenhouse Gas Emissions by Source Emissions Source 2006
Natural gas 233,839 Refrigerant 19,629 Fleet fuel 9,798 Purchased electricity 29,328 Solid waste 2,937 Landscape compost -160 Purchased goods and services 125,000 Campus commute 29,000 Air travel 24,000 Water & wastewater 2,300 TOTAL EMISSIONS 475,671 Source: Good Company, “2009 Greenhouse Gas Inventory,” http://www.utexas.edu/facilities/documents/2008UTAustinGHGInventoryrev03052009.pdf
Total 2006 greenhouse gas emissions were 475,671 metric tons of carbon dioxide
equivalent (MtCO2e). The consumption of natural gas at UT-Austin’s power plant
accounts for about half of total emissions at 233,839 MtCO2e. Figure 1 illustrates the
amount of greenhouse gas emissions produced by each emission source, excluding
landscape compost, at UT-Austin in 2006.
Figure 1: UT-Austin 2006 GHG Emissions by Source
Source: Good Company, “2009 Greenhouse Gas Inventory,” http://www.utexas.edu/facilities/documents/2008UTAustinGHGInventoryrev03052009.pdf
Scope III Scope II Scope I

3
Several energy efficiency and carbon reduction strategies have been adopted by
UT-Austin to address the greenhouse gases emitted as a result of university operations.
The university has made significant investments in energy efficiency improvements at the
Hal C. Weaver Power Plant while also focusing on reducing energy demand throughout
its two campuses. Table 2 lists the 21 supply and demand side energy management
strategies implemented by UT-Austin to date.
Table 2: UT-Austin’s Supply and Demand Side Management Strategies
Strategy Program
Addition of steam turbine (25 MW)
Installation of variable frequency drives
Steam boiler upgrades
Steam/feedwater by-pass
Refrigerant conversion
Addition of chilling station
Real-time optimization system
Cooling tower replacement
Inlet air chilling
Addition of gas turbine
Thermal energy storage
Utilities & Energy Management
LEED silver building standards Campus Policy
Lighting retrofits and repair
Steam system upgrades
Water conservation
UTakeCharge
Purchasing Energy Star equipment Campus Policy
Life cycle cost analysis Project Management & Construction
Services
UT Share program Parking & Transportation
Bike loan service
Waste reduction and recycling Campus Environmental Center
Campus awareness outreach Campus departments Source: The University of Texas at Austin, Utilities and Energy Management, Facilities Services and Project Management and Construction Services, Parking and Transportation Services, Campus Environmental Center, www.utexas.edu

4
The energy efficiency measures taken at the power plant have reduced GHG
emissions by over 363,000 MtCO2e.2 Through upgrades to steam traps and lighting and
plumbing fixtures, the UTakeCharge program has substantially reduced energy demand
and contributed to GHG emissions savings of approximately 13,630 MtCO2e.3 Other
strategies that help to reduce carbon emissions at UT-Austin include campus awareness
programs, purchasing practices that prioritize energy efficiency, transportation services
like the UT Shuttle, a student bike loan service, and waste reduction and recycling
practices.
Peer universities have begun to formalize climate action plans to reduce their
carbon footprints. This study focuses on the carbon reduction strategies identified by the
climate action plans of 11 universities, including Arizona State University (ASU),
Cornell University (Cornell), University of California at Berkeley (UC-Berkeley),
University of California at Los Angeles (UCLA), University of Colorado at Boulder
(CU-Boulder), University of Florida (UF), University of North Carolina at Chapel Hill
(UNC), University of Washington (UW), University of Wisconsin at Madison (UW-
Madison), University of Wisconsin at Oshkosh (UW-Oshkosh), and Virginia Tech (VT).
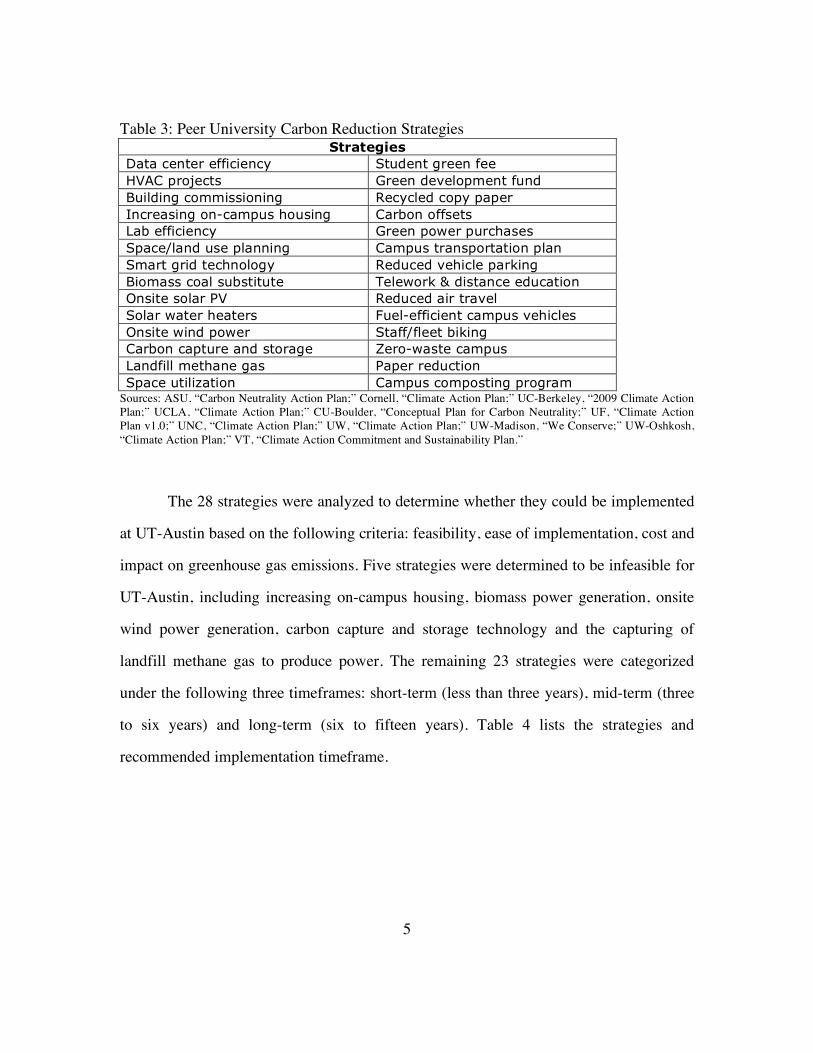
Table 3 lists the current and planned strategies for the 11 peer universities, excluding the
strategies already implemented by UT-Austin.
5
Table 3: Peer University Carbon Reduction Strategies Strategies
Data center efficiency Student green fee HVAC projects Green development fund Building commissioning Recycled copy paper Increasing on-campus housing Carbon offsets Lab efficiency Green power purchases Space/land use planning Campus transportation plan Smart grid technology Reduced vehicle parking Biomass coal substitute Telework & distance education Onsite solar PV Reduced air travel Solar water heaters Fuel-efficient campus vehicles Onsite wind power Staff/fleet biking Carbon capture and storage Zero-waste campus Landfill methane gas Paper reduction Space utilization Campus composting program
Sources: ASU, “Carbon Neutrality Action Plan;” Cornell, “Climate Action Plan;” UC-Berkeley, “2009 Climate Action Plan;” UCLA, “Climate Action Plan;” CU-Boulder, “Conceptual Plan for Carbon Neutrality;” UF, “Climate Action Plan v1.0;” UNC, “Climate Action Plan;” UW, “Climate Action Plan;” UW-Madison, “We Conserve;” UW-Oshkosh, “Climate Action Plan;” VT, “Climate Action Commitment and Sustainability Plan.”
The 28 strategies were analyzed to determine whether they could be implemented
at UT-Austin based on the following criteria: feasibility, ease of implementation, cost and
impact on greenhouse gas emissions. Five strategies were determined to be infeasible for
UT-Austin, including increasing on-campus housing, biomass power generation, onsite
wind power generation, carbon capture and storage technology and the capturing of
landfill methane gas to produce power. The remaining 23 strategies were categorized
under the following three timeframes: short-term (less than three years), mid-term (three
to six years) and long-term (six to fifteen years). Table 4 lists the strategies and
recommended implementation timeframe.

6
Table 4: Strategies Categorized Under Timeframes
Short-term (<3 yrs) Mid-term (3-6 yrs) Long-term (6-15 yrs) Space utilization Space/land use planning Zero-waste campus
Student green fee Green power purchases Solar water heaters Green fund Staff/fleet biking Carbon offsets
PCW copy paper Fuel efficient vehicles Building commissioning Transportation plan Data center efficiency Smart grid technology
Reduced parking HVAC projects Solar PV Paper reduction Lab efficiency
Telework/distance education Campus composting Reduced air travel
The following nine strategies could be implemented at UT-Austin within the next
three years due to ease of implementation and low cost: efficient space utilization, student
green fee, green development fund, recycled copy paper purchasing initiative, campus
transportation plan, reduced vehicle parking, paper use reduction, reduced air travel
through teleconferencing and increased use of telework, flex scheduling, distance
education. The eight strategies that could be implemented within three to six years
include: space/land use planning, green power purchases through Austin Energy,
staff/fleet biking, fuel efficient vehicles, efficient data centers, laboratory efficiency,
campus composting program and heating, ventilation and air conditioning projects. The
long-term strategies include: zero-waste campus initiative, solar water heaters, carbon
offsets, building commissioning, smart grid technology and solar photovoltaic power
generation.
The implementation of the carbon reduction strategies listed above is dependent
upon a few other factors, including the political feasibility of adopting the strategies, UT-
Austin’s financial limitations, and the potential future carbon risk. The University of
Texas at Austin should assess these factors during its review of the recommended

7
strategies. Because of the likelihood of future legislation or regulations that could
effectively put a price on an institution’s greenhouse gas emissions, UT-Austin should
immediately begin to analyze new carbon reduction strategies and create a formal,
comprehensive plan of action to simultaneously reduce its carbon footprint,
environmental impact, as well as its financial risks. The University of Texas at Austin has
the opportunity to become a leader in campus sustainability and can continue to show that
sustainable practices are a priority through the adoption of strategies that further reduce
its greenhouse gas emissions.

8
Chapter 2: Introduction
In April 2008, The University of Texas at Austin (UT-Austin) adopted a campus
sustainability policy, committing to environmental stewardship and sustainability in all
university activities, policies and practices.4 Sustainability, as defined by the Campus
Sustainability Policy, “refers to societal efforts that meet the needs of present users
without compromising the ability of future generations to meet their own needs.”5 The
University of Texas at Austin has a challenge to achieve sustainability in its own terms,
as any efforts to reduce energy consumption and avoid greenhouse gas emissions require
the cooperation of 50,000 students and 21,000 faculty and staff.
The university took some initial steps toward its sustainability commitment in
2009 when it completed its first inventory of greenhouse gas emissions.6 This inventory
can be used to identify and target supply and demand side management strategies that can
increase energy efficiency, enhance conservation, and prevent or reduce pollution and
carbon emissions.
This professional report analyzes UT-Austin’s greenhouse gas inventory, the steps
taken by the university to improve energy efficiency and reduce carbon emissions, the
university’s future plans for energy efficiency and conservation, and carbon reduction
strategies employed by peer universities. The report closes with an assessment of options
for action that UT-Austin can take in the near-term to prevent and reduce pollution, limit
its greenhouse gas emissions, and continue towards sustainability.

9
Chapter 3: Greenhouse Gas Emissions Inventory
In 2009, The University of Texas at Austin (UT-Austin) released an initial
calculation of its greenhouse gas (GHG) emissions for the years 2000 to 2006. This
greenhouse gas emissions inventory evaluated UT-Austin’s direct (Scope I) and indirect
(Scopes II and III) emissions sources. This chapter will include an analysis of the GHG
emissions inventory to provide an understanding of the magnitude of greenhouse gases
emitted by each different source at UT-Austin.
Scope I emissions include an entity’s direct emissions that result from the
equipment and facilities that it owns and/or operates, such as the burning of natural gas at
UT-Austin’s power plant, fuel consumption from fleet vehicles and the campus shuttle
buses, refrigeration and air conditioning systems that leak refrigerants, and landscape
compost. Scope II greenhouse gas emissions are indirectly controlled by an entity
through its purchase of electricity from a utility company, which in UT-Austin’s case
result from the burning of fossil fuels by local electric utility Austin Energy and are
accounted for in the university’s overall emissions total. Scope III emissions include
indirect emissions that originate from sources controlled by other entities. These
emissions can be more difficult to quantify and include those associated with solid waste,
air travel, student/staff/faculty commute to and from campus, water, wastewater as well
as purchased goods and services.
Scopes I and II emissions plus solid waste are considered core emissions sources,
as UT-Austin has more control over them and relatively accurate data on the amount of

10
emissions they produce. Scope III emissions, as well as landscape compost, are
considered additional emissions sources. The university has less control over these
sources and there is more uncertainty regarding the magnitude of the GHG emissions.
Table 5 lists UT-Austin’s greenhouse gas emissions by source for the years 2003 through
2006.7
Table 5: UT-Austin GHG Emissions by Source for Years 2003-2006
Calendar Year Category 2003 2004 2005 2006
Core Emissions Sources
Natural gas 248,293 262,289 244,851 233,839 Refrigerant 16,174 16,852 9,196 19,629
Fleet fuel 9,203 9,500 9,369 9,798
Purchased electricity 30,812 27,777 30,874 29,328
Solid waste 415 418 422 2,937
TOTAL CORE EMISSIONS 304,896 316,837 294,712 295,531
Additional Emissions Sources (estimated)
Landscape compost -70 -70 -70 -160
Embodied purchasing emissions 125,000
Campus commute 30,000 29,000 29,000 29,000
Air travel 24,000 25,000 24,000 24,000
Water & wastewater 2,400 2,300 2,300 2,300
TOTAL ADDITIONAL EMISSIONS 56,330 56,230 55,230 180,140
TOTAL EMISSIONS 361,226 373,067 349,942 475,671 Source: Good Company, “2009 Greenhouse Gas Inventory,” http://www.utexas.edu/facilities/documents/2008UTAustinGHGInventoryrev03052009.pdf
Overall emissions for UT-Austin in 2006 were an estimated 475,671 metric tons
of carbon dioxide equivalent (MtCO2e), with core emissions totaling 295,531 MtCO2e
and additional emissions estimated at 180,140 MtCO2e. A metric ton of “carbon dioxide
equivalent” is equal to 1,000 kilograms, or 2,205 U.S. pounds, of carbon dioxide or other

11
greenhouse gas expressed in terms of global warming potential in relation to carbon
dioxide. Embodied emissions in purchased goods and services were estimated for the
year 2006 only. Figure 2 shows the relative percentages of emissions from both core and
additional emissions sources.8
Figure 2: UT-Austin 2006 Overall GHG Emissions Percentages by Source
Source: Good Company, “2009 Greenhouse Gas Inventory,” http://www.utexas.edu/facilities/documents/2008UTAustinGHGInventoryrev03052009.pdf
The burning of natural gas to produce electricity, chilled water and steam
accounts for about 50 percent of overall carbon emissions, at 233,839 MtCO2e in 2006.
The university’s combined heat and power facility (Hal C. Weaver Power Plant) located
at the main campus consumes natural gas to produce electricity and steam, comprising

12
approximately 98 percent of natural gas use at UT-Austin. The remaining two percent is
consumed to produce heating and cooling products at the Pickle Research Campus,
located nine miles north of UT-Austin’s main campus.
Other core emissions sources, including refrigerant, fleet fuel, purchased
electricity and solid waste, account for a combined 13 percent of overall emissions.
Refrigerants are used in refrigeration/cooling units and ventilation and air conditioning
systems and are emitted into the atmosphere through leaks within the cooling system.
Fleet fuel sources include 619 vehicles owned by the university and 68 campus shuttle
buses that are owned and managed by Capital Metro. The university-owned vehicle fleet
consumes unleaded gasoline (577 vehicles), B20 bio-diesel (42 vehicles) and propane (2
vehicles), while all shuttle buses run on low-sulfur diesel.9 The university purchases
electricity from Austin Energy for consumption at Pickle Research Campus as well as on
the main campus during shutdowns or peak energy consumption periods when the power
plant’s generation capacity is exceeded. Emissions from solid waste disposal increased
dramatically in 2006 due to a switch to an uncapped landfill facility without a methane
collection system or a methane-to-power generation facility.
For additional emissions sources, the embodied emissions in purchased goods and
services represent the estimated greenhouse gas emissions that occur from the life cycle
activities, including raw material extraction, production and transportation, of goods and
services purchased by the university’s Employee and Campus Services department.
Campus commute emissions encompass travel by university staff, students and faculty to
and from the campus by bus or car. The data used to calculate campus commute

13
emissions is based on a transportation survey from December 2000. Air travel emissions
were estimated from flights booked through the campus travel agency, which comprise
about 75 percent of all university-related flights. The remaining 25 percent were booked
as reimbursement travel and were difficult to track and quantify in the university’s
accounting system. The emissions resulting from UT-Austin’s water use and wastewater
generation are estimated based on electricity consumption of water and wastewater
pumping and also include wastewater treatment emissions.
The greenhouse gas emissions inventory for UT-Austin provides baseline
emissions data that can be used to assess the effectiveness of current carbon mitigation
strategies and determine how best to focus future carbon reduction efforts. The most
significant emissions source is the consumption of natural gas at UT-Austin’s power
plant, followed by purchased goods and services, purchased electricity,
student/faculty/staff commute, air travel, refrigerant, fleet fuel, solid waste, water and
wastewater. The next chapter will identify the strategies currently in place at UT-Austin
to reduce greenhouse gases emitted from each source.

14
Chapter 4: Energy Efficiency and Carbon Reduction Strategies
Over the last 30 years, The University of Texas at Austin has invested in several
energy efficiency and carbon reduction strategies. These strategies have successfully
increased the efficiency of power generation and delivery, decreased energy demand,
reduced waste and travel-related emissions and raised campus awareness of energy use
and conservation. This chapter evaluates the current carbon reduction strategies being
implemented at UT-Austin.
The University of Texas at Austin operates one of the largest university power
plants in the U.S.10 The Hal C. Weaver Power Plant, a combined heat and power plant
with a generating capacity of 140 megawatts, has been the focus of many of UT-Austin’s
energy efficiency and carbon reduction efforts on campus.11 These power generation, or
supply side, energy management strategies are important components of the university’s
overall carbon reduction plan. Decreasing energy demand in buildings throughout UT-
Austin campuses and changing energy consumption behavior are considered demand side
management strategies. Demand side management strategies are implemented to reduce
energy demand, especially during peak energy demand periods. Targeting other areas of
its carbon footprint, UT-Austin also uses strategies to address its emissions due to
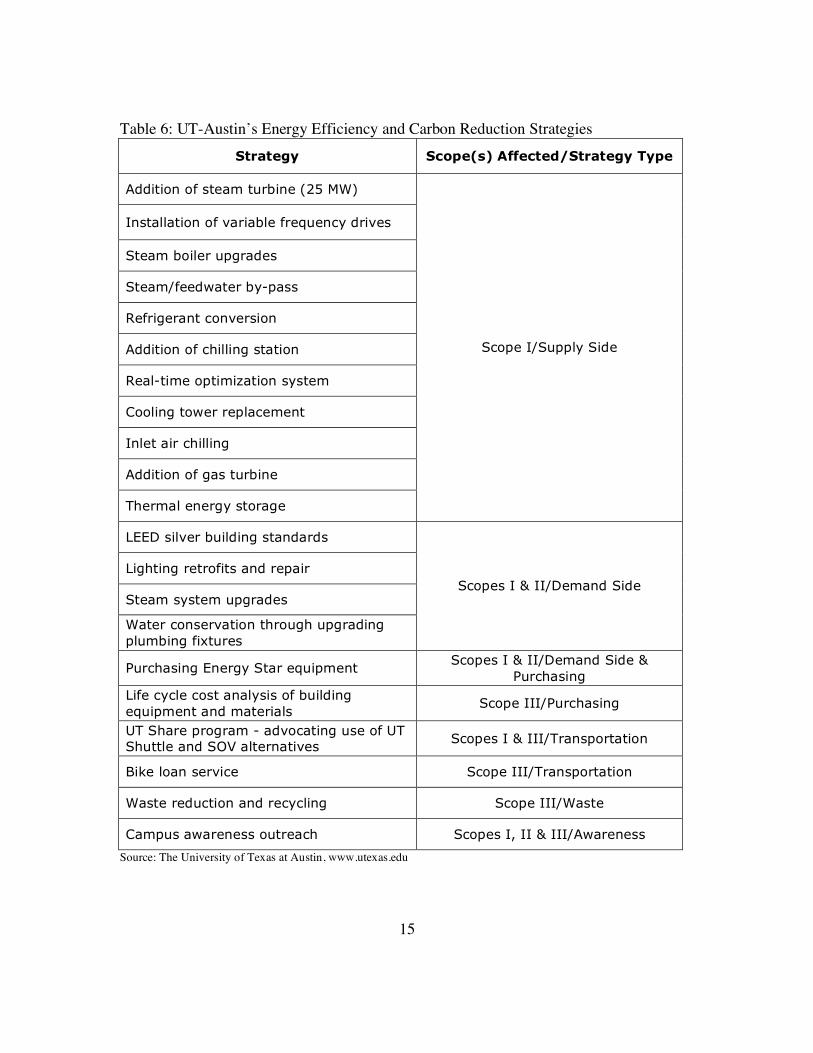
purchasing practices, transportation and waste. Table 6 lists UT-Austin’s current energy
efficiency and carbon reduction strategies.
15
Table 6: UT-Austin’s Energy Efficiency and Carbon Reduction Strategies
Strategy Scope(s) Affected/Strategy Type
Addition of steam turbine (25 MW)
Installation of variable frequency drives
Steam boiler upgrades
Steam/feedwater by-pass
Refrigerant conversion
Addition of chilling station
Real-time optimization system
Cooling tower replacement
Inlet air chilling
Addition of gas turbine
Thermal energy storage
Scope I/Supply Side
LEED silver building standards
Lighting retrofits and repair
Steam system upgrades
Water conservation through upgrading plumbing fixtures
Scopes I & II/Demand Side
Purchasing Energy Star equipment Scopes I & II/Demand Side &
Purchasing Life cycle cost analysis of building equipment and materials
Scope III/Purchasing
UT Share program - advocating use of UT Shuttle and SOV alternatives
Scopes I & III/Transportation
Bike loan service Scope III/Transportation
Waste reduction and recycling Scope III/Waste
Campus awareness outreach Scopes I, II & III/Awareness
Source: The University of Texas at Austin, www.utexas.edu

16
SUPPLY SIDE ENERGY MANAGEMENT STRATEGIES The Hal C. Weaver Power Plant is both the largest source of greenhouse gas
(GHG) emissions at UT-Austin and also an extremely energy efficient source of
electricity. Through supply side energy management strategies, the university has been
able to increase the overall energy efficiency of its power plant from 62 percent to 75
percent and substantially reduce GHG emissions in the Scope I emissions category.12
Table 7 lists the energy efficiency measures taken at UT-Austin’s power plant to date.
Table 7: Hal C. Weaver Power Plant Energy Efficiency Strategies
Strategies
Installation of a 25 megawatt (MW) steam turbine that was 9 percent more efficient than previous turbines13 Installation of variable frequency drives on the pumps and fans for one of the cooling towers
Natural-gas-fired steam boilers upgrades/retrofits
Controlling the boil over of feedwater in the largest boiler and the installation of a "quench valve" system that allows for the operation of fewer steam turbines14 Conversion of three out of four electric chillers from refrigerant R-12 to refrigerant R-134a Installation of a chilling station that is 30 percent more efficient than the one it replaced15 Implementation of a real-time optimization system that allows for power plant energy optimization16
Installation of a new cooling tower to replace a wooden cooling tower built in 195817
Installation of a 3,000 ton chilled water coil to cool the intake air of the largest combustion turbine18
Installation of a new gas turbine to replace an existing turbine and boiler19
Installation of a thermal energy storage facility to store more than four million gallons of chilled water20
Source: Utilities and Energy Management, The University of Texas at Austin, www.utexas.edu

17
Energy efficiency strategies and improvements at UT-Austin’s power plant have
resulted in the avoidance of over 363,000 metric tons of carbon dioxide equivalent
(MtCO2e) emissions since 1996.21 Table 8 lists the strategies implemented by UT-Austin
to increase energy efficiency and reduce carbon emissions at its power plant and
associated costs and benefits.22 Energy savings represent the reduction of natural gas
consumption at the Hal C. Weaver Power Plant and is expressed in terms of million
British thermal units (MMBTU). One British thermal unit is a unit of energy equal to
about 1,000 joules, or the amount of heat generated by striking a match.
Table 8: UT-Austin Power Plant Energy Efficiency and Carbon Mitigation Strategies
Project Cost Energy Savings
(MMBTU/yr)
Annual Cost
Savings
Emissions Reduction
(MtCO2e/yr)
Steam turbine (25 MW)
$15,864,000 200,000 $1,400,000 9,979
Variable frequency drives
$150,000 50,000 $350,000 2,495
Steam boiler upgrades
$3,000,000 200,000 $1,400,000 9,979
Steam/feedwater by-pass
$900,000 500,000 $3,500,000 24,948
Refrigerant conversion
$3,780,000 20,000 $140,000 998
Chilling station $35,200,000 71,500 $500,500 3,568
Real-time optimization system
$250,000 200,000 $1,400,000 9,979
Cooling tower $8,500,238 50,000 $350,000 2,495
Inlet air chilling $4,000,000 120,000 $840,000 5,987
Gas turbine $39,350,000 399,400 $2,795,800 19,928
Thermal energy storage
$10,700,000 40,000 $280,000 1,996
Source: Juan Ontiveros, Utilities and Energy Management, The University of Texas at Austin

18
DEMAND SIDE MANAGEMENT STRATEGIES The Project Management and Construction Services (PMCS) department at UT-
Austin promotes green building in the design, construction and renovation of campus
buildings. Through purchasing practices that include life cycle cost evaluations of
building materials and equipment and encouraging environmental sensitivity in
construction projects, the PMCS department aims to add to the sustainability efforts on
campus and help to reduce the university’s Scope III emissions. Additionally, UT-Austin
recently set a new standard for campus buildings: all new construction must meet
Leadership in Energy and Environmental Design (LEED) standards.23 Of the four LEED
ratings (platinum, gold, silver and certified), the university now requires that any new
building have at least a silver rating.24 Energy efficient building design and construction
reduce energy demand, thus decreasing GHG emissions from onsite power generation or
purchased electricity (Scopes I and II emissions categories).
In October 2007, UT-Austin’s Facilities Services and PMCS departments
launched the UTakeCharge program to conserve energy and water and reduce greenhouse
gas emissions (Scopes I and II emissions categories).25 These projects have sought to
reduce energy demand and promote conservation in three main areas: lighting, steam and
water. Table 9 lists the projects completed through UTakeCharge and the resulting
energy, cost and emissions savings per year.26

19
Table 9: UTakeCharge Program Demand Side Management Projects
Project
Annual Energy Savings
(MMBTU/yr)
Annual Cost Savings
Annual Emissions Savings
(MtCO2e/yr)
Retrofit/repair 183,000 lighting fixtures & install 2,300 occupancy sensors
95,536 $1,900,000 10,886
Replace/repair 420 steam traps and radiator valves
23,480 $235,000 2,631
Install/replace/repair 5,941 plumbing fixtures
983 $572,000 113
Source: Facilities Services and Project Management and Construction Services, University of Texas at Austin, http://www.utexas.edu/utakecharge/projects/update.html
The lighting project (completed in January 2009) retrofitted or repaired over
183,000 lighting fixtures and installed 2,300 occupancy sensors in general and education
buildings at UT-Austin.27 The newly repaired or retrofitted light fixtures offer sufficient
lighting while requiring less energy. The occupancy sensors reduce energy consumption
by automatically turning the lights off when a room is vacant. The university estimates
that this project reduces greenhouse gas emissions by 10,886 MtCO2e per year, decrease
energy demand 95,536 MMBTU annually and save UT-Austin approximately $1.9
million.28
Steam system upgrades, which included the renovation of steam traps and radiator
valves, were completed in December 2008.29 Overall, 420 steam traps were either
repaired or replaced in campus buildings over five years old.30 The university has
reported that these upgrades amount to estimated annual savings of 23,480 MMBTU in
electricity use, $235,000, and 2,631 MtCO2e emissions.31
20
Under UTakeCharge, UT-Austin has installed, replaced or repaired 5,941
plumbing fixtures, including showerheads, aerators and toilet valves, to reduce water
consumption.32 More efficient plumbing fixtures decrease the pump power necessary to
move water, which provides estimated savings of 60 million gallons of water per year,
which, in turn, results in annual energy savings of 983 MMBTU, cost savings of
$572,000, and emissions reductions of 113 MtCO2e per year.33
Since the 1980s, UT-Austin has operated a water recovery program that has
recycled more than 1.3 billion gallons of water through reuse of air conditioning
condensate, swimming pool drain water and water used for cooling laboratory
equipment.34 This recycled water is then used to offset evaporation losses in the power
plant’s cooling towers.35 Additionally, water conservation measures have been applied to
the outdoor decorative fountains on campus, as almost all have been converted to
recirculating fountains.36
Purchasing
In 2008, UT-Austin became an official Energy Star partner.37 As an Energy Star
partner, the university pledges to track the energy performance of all of its facilities,
reduce energy consumption of its buildings by ten percent or more, promote campus
awareness of energy use, and encourage other universities to become Energy Star
partners.38 In taking this step, UT-Austin committed to purchasing energy efficient
equipment across campus to reduce energy demand and greenhouse gas emissions. For
example, the Division of Housing and Food Service at UT-Austin purchased Energy Star

21
appliances for campus residence halls and apartments, including laundry machines,
microfridges and central heat/air conditioning units.39 To increase energy efficient
performance in campus buildings, the PMCS department is using life cycle cost analysis
in its purchasing of building materials and equipment, ensuring that total costs from
construction, operation, maintenance, renovation and deconstruction are accounted for,
rather than just the initial costs of a project.40
Transportation The Parking and Transportation Services Department developed UT Share, an
alternative transportation program that advocates for the use of alternative modes of
transportation in order to reduce commuter reliance on single occupancy vehicles and
reduce carbon emissions. The UT Share program encourages UT-Austin students,
faculty, staff and visitors to consider commuting to and from the university campuses via
mass transit (UT Shuttle or regular Capital Metro buses), carpools, vanpools, biking or
walking.41 As the largest university shuttle system in the nation,42 the UT Shuttle connects
over 7.5 million passengers to the UT-Austin campuses annually.43
Student-led Initiatives – Bike Loan Service and Waste Reduction Student-run organizations have spearheaded key environmental initiatives on
campus. The Campus Environmental Center promotes campus sustainability through the
Orange Bike Project, the Trash to Treasure Program and campus-wide recycling efforts.
The Orange Bike Project operates a bike loan service, which lends bikes to students for a
22
semester at no cost.44 Its Trash to Treasure program allows students to get rid of
unwanted goods at the end of the school year; those goods can then be purchased and
reused by incoming students at the beginning of the next school year.45 Other efforts to
reduce waste at UT-Austin include the placement of recycling bins for paper, plastic and
aluminum throughout campus and student awareness programs, like RecycleMania,
which is a national recycling competition among universities.46
Campus Awareness Outreach
Several campus departments and organizations provide awareness outreach to
educate UT-Austin students, faculty and staff about sustainability issues on campus,
including Project Management and Construction Services, Facilities Services, the
Campus Environmental Center, the School of Nursing, the McCombs School of Business,
the Division of Housing and Food Service, and the Environmental Science Institute.
These groups promote energy conservation, recycling and waste reduction through
meetings, events, posters and campus outreach. Through UT-Austin’s Office of
Sustainability, students can learn about research projects related to sustainability efforts
on campus.
Future Initiatives
Going forward, UT-Austin will continue to implement demand- and supply-side
energy management strategies to promote energy efficiency and conservation on campus.
Through UTakeCharge, the Facilities Services and PMCS departments will ensure that
future construction and renovation projects meet design standards that “incorporate
resource-conserving materials and equipment.”47 In addition, the program will oversee

23
the phasing out and replacement of electrical and mechanical systems that become
outdated.48
By spring 2011, UT-Austin plans to use reclaimed water for irrigation and to help
continue to offset evaporative losses in the power plant’s cooling towers.49 This use of
highly treated wastewater will “allow the university to replace consumption of about 400
million gallons of drinking water per year with non-potable water, helping to lessen the
burden on city’s infrastructure and delaying the costly construction of a new drinking
water treatment plant.”50
Through current and planned energy efficiency and conservation strategies, The
University of Texas at Austin has shown its commitment to a more sustainable future. In
order to reduce its greenhouse gas emissions even further, UT-Austin can choose to
implement other demand and supply side energy management strategies that are being
used by other institutions. The next chapter analyzes the carbon reduction strategies that
are being adopted by peer universities to show the range of options available to UT-
Austin.

24
Chapter 5: Peer University Carbon Mitigation Strategies
Universities across the country have begun to address the greenhouse gas
emissions that result from their operating activities. These universities reduce the amount
of carbon dioxide and other pollutants that are being emitted into the atmosphere through
various mitigation strategies. This chapter analyzes the carbon reduction strategies being
utilized by 11 peer universities to reveal new strategies that could be implemented at UT-
Austin.
The 11 peer institutions evaluated in this study include the following universities:
Arizona State University (ASU); Cornell University (Cornell); University of California at
Berkeley (UC-Berkeley); University of California at Los Angeles (UCLA); University of
Colorado at Boulder (CU-Boulder); University of Florida (UF); University of North
Carolina at Chapel Hill (UNC); University of Washington (Washington); University of
Wisconsin at Madison (UW-Madison); University of Wisconsin at Oshkosh (UW-
Oshkosh); and Virginia Tech (VT). Several of these universities were identified as peer
institutions through the American Association of Universities (AAU) National
Comparison Group, including UC-Berkeley, UCLA, UNC, Washington and UW-
Madison. Six other universities included in UT-Austin’s National Comparison Group
(University of Illinois, University of Indiana, University of Michigan, Michigan State
University, University of Minnesota and Ohio State University) were not analyzed in this
study because they do not currently have formal Climate Action Plans (CAPs). A Climate
Action Plan includes strategies that will be implemented by a university to increase
25
campus sustainability and reduce overall energy consumption and greenhouse gas
emissions. Although not listed as peer institutions, ASU, Cornell, CU-Boulder, UF, UW-
Oshkosh and VT were selected for this study because they are large universities and have
adopted CAPs.
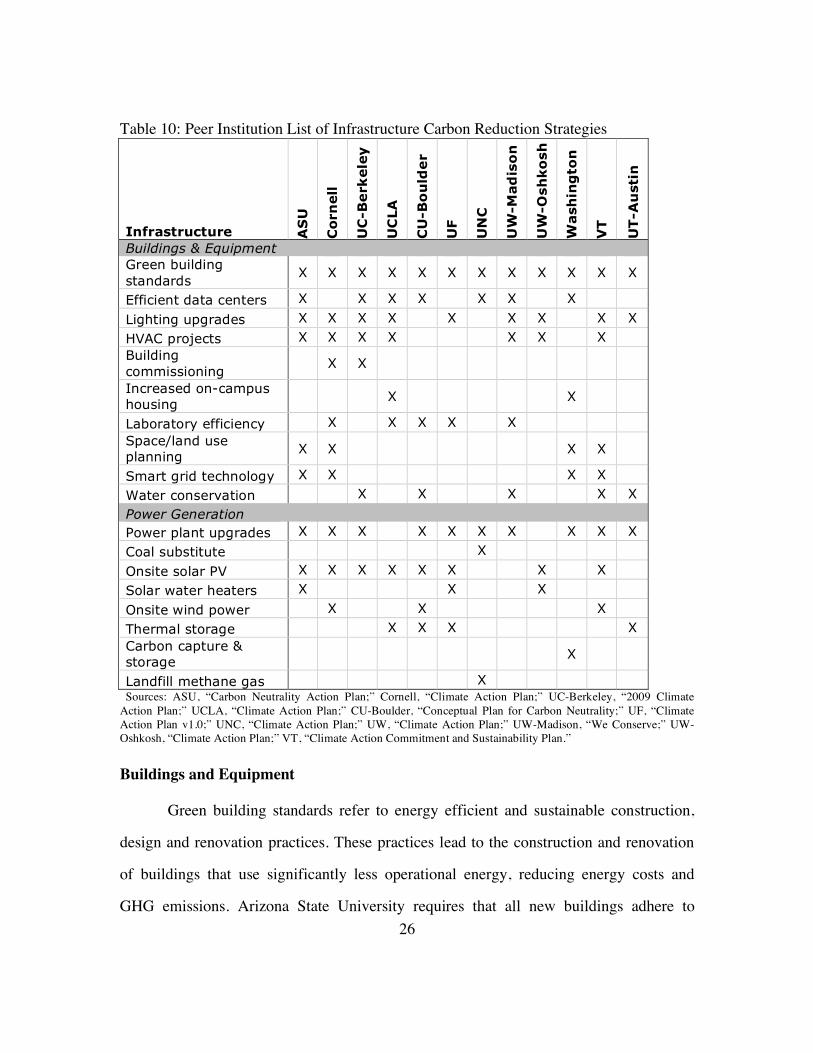
INFRASTRUCTURE STRATEGIES Table 10 lists the carbon reduction strategies employed by peer institutions. These
18 strategies were identified in each institution’s respective CAP and relate to current and
future infrastructure projects. The strategies are organized in the table under the headings
“Buildings and Equipment” and “Power Generation” and do not represent an exhaustive
list of strategies, as several were consolidated under broad initiative titles. The strategies
listed were compiled through research on each university’s respective CAP.
26
Table 10: Peer Institution List of Infrastructure Carbon Reduction Strategies
Infrastructure AS
U
Corn
ell
UC
-Berk
ele
y
UC
LA
CU
-Bo
uld
er
UF
UN
C
UW
-Mad
iso
n
UW
-Osh
ko
sh
Wash
ing
ton
VT
UT-A
ust
in
Buildings & Equipment Green building standards
X X X X X X X X X X X X
Efficient data centers X X X X X X X
Lighting upgrades X X X X X X X X X
HVAC projects X X X X X X X Building commissioning
X X
Increased on-campus housing
X X
Laboratory efficiency X X X X X Space/land use planning
X X X X
Smart grid technology X X X X
Water conservation X X X X X
Power Generation
Power plant upgrades X X X X X X X X X X
Coal substitute X
Onsite solar PV X X X X X X X X
Solar water heaters X X X
Onsite wind power X X X
Thermal storage X X X X Carbon capture & storage
X
Landfill methane gas X Sources: ASU, “Carbon Neutrality Action Plan;” Cornell, “Climate Action Plan;” UC-Berkeley, “2009 Climate Action Plan;” UCLA, “Climate Action Plan;” CU-Boulder, “Conceptual Plan for Carbon Neutrality;” UF, “Climate Action Plan v1.0;” UNC, “Climate Action Plan;” UW, “Climate Action Plan;” UW-Madison, “We Conserve;” UW-Oshkosh, “Climate Action Plan;” VT, “Climate Action Commitment and Sustainability Plan.”
Buildings and Equipment
Green building standards refer to energy efficient and sustainable construction,
design and renovation practices. These practices lead to the construction and renovation
of buildings that use significantly less operational energy, reducing energy costs and
GHG emissions. Arizona State University requires that all new buildings adhere to

27
Leadership in Energy and Environmental Design (LEED) standards at the silver
certification level or above.51 Currently, ASU has 22 LEED-certified buildings (12 silver,
9 gold, 1 platinum).52 Though upfront costs are higher, LEED buildings are at least 25
percent more energy efficient than non-LEED buildings.53 Although LEED standards are
becoming common among peer universities, programs like the Architecture 2030
Challenge and the Commercial Buildings Initiative are included under green building
standards as well.
Peer universities have opted for varying strategies to reduce the energy consumed
by their campus computers and data centers. For example, UC-Berkeley is replacing
computer monitors with more energy efficient liquid crystal display monitors, as well as
utilizing power management systems, which require its networked computers to have
Energy Star settings and active sleep/standby modes.54 Arizona State University plans to
eliminate server rooms and construct a single data center.55 Similarly, UCLA plans to
establish consolidated server room locations to reduce the amount of energy consumed in
air conditioning the currently dispersed data center locations.56 The University of
Colorado-Boulder will evaluate airflow in its data centers and use engineering modeling
to adjust exhaust systems to improve heat recovery and conserve energy.57 The estimated
cost for the CU-Boulder project to renovate three data centers is $250,000, with annual
cost savings of $49,826 and annual emissions savings of 617 metric tons of carbon
dioxide equivalent (MtCO2e).58
Lighting projects include retrofitting and repairing light fixtures, installing
occupancy sensors and reducing light levels. Cornell’s strategy involves a campus-wide
retrofit program that is estimated to reduce annual energy use from lighting by 25
percent.59 Through the installation of occupancy sensors in 146 classrooms, Virginia Tech

28
estimates annual energy cost savings of $10,370.60 The University of Wisconsin-Oshkosh
plans to reduce light intensity in campus building hallways and corridors by 20 percent.61
Peer universities are upgrading heating, ventilating and air conditioning (HVAC)
systems through retrofits, direct digital controls and the replacement of inefficient units.
Both ASU and UC-Berkeley plan to implement variable air volume (VAV) retrofits on
their HVAC systems and install direct digital controls to help control heating and cooling
within buildings.62,63 Cornell has identified two HVAC initiatives: a conservation-focused
preventative maintenance program and the installation of direct digital controls.64 The
University of California-Los Angeles has replaced aging chillers in buildings and
installed efficient motors with variable-speed drives.65
Building commissioning, or monitoring-based commissioning, is the tracking of
building systems through metering to achieve energy savings. At UC-Berkeley, building
meters are being installed to monitor electricity, hot water, steam, chilled water and
natural gas use at a total capital cost of $4,732,000.66 The projected annual cost savings
for the project are $833,000 and the emissions savings potential is 7,077 MtCO2e per
year.67 Cornell will use building commissioning to direct its maintenance efforts.68
Constructing additional on-campus housing, though not a strategy to reduce
energy consumption, can affect carbon emissions related to student, faculty and staff
commutes. The University of Washington plans to build additional housing at two of its
campuses to decrease the commute distance for some students, faculty or staff.69 Taking a
similar approach, UCLA plans to add 1,525 student-housing units by 2013 and 1,000
employee-housing units on campus by 2020.70
Several peer universities plan to use strategies to reduce the energy consumption
within campus laboratories. To reduce energy use, CU-Boulder plans to install heat
recovery systems that capture heat that can then be used to supplement building heat,
29
which could lead to annual emissions savings of 153 MtCO2e.71 The estimated cost to
install heat recovery systems in three labs is expected to be between $250,000 and
$500,000, and the annual cost savings equal $21,371.72 Cornell will be deactivating ten
percent (125) of its unused fume hoods, from which it estimates an annual emissions
abatement of 1,089 MtCO2e.73
By utilizing space efficiently, universities can reduce the need for new buildings.
Cornell will be evaluating the way existing space is used within its buildings and develop
space management guidelines and principles.74 To reduce travel distances on campus,
Virginia Tech plans to incorporate compact development policies to encourage in-fill
development.75
Smart grid technology refers to the implementation of metering on buildings that
provides real-time information on energy use and allow the energy supplier greater
control over that use. Cornell, ASU, Washington and Virginia Tech plan to use some
form of smart grid technology.76,77,78,79 Washington plans to use networked metering to
gather information about building energy use on its three campuses, set energy use goals
and target energy conservation opportunities.80
Water conservation typically involves the installation of water-efficient toilets,
appliances and plumbing fixtures. Virginia Tech has installed low flow water fixtures,
toilets and urinals, as well as auto shutoff faucets.81 The University of Wisconsin-
Madison has instituted controlled watering of campus grounds and has planted drought-
resistant, native plants.82
Power Generation
Power plant upgrades include the installation, replacement or upgrading of gas
turbines, chillers, cooling towers, variable frequency drives, steam turbines, and boilers.

30
The University of Florida is considering optimizing its chiller plant, which would result
in emissions savings of 6,340 MtCO2e at a cost of $3 million.83
Several peer institutions plan to integrate renewable energy generation
technologies into their generation mixes. The University of North Carolina plans to
replace 20 percent of its coal-generated power with torrefied wood in its cogeneration
boilers.84 The University of Colorado-Boulder plans to install 210 kilowatts of solar
photovoltaic (PV) panels on three of its campus buildings through third party financing
which will allow the university to purchase the solar PV system for $400,000 after seven
years (total cost covered by third party financing would be $1.5 million).85 Total project
savings are estimated at $474,185 and emissions savings are approximately 6,850
MtCO2e.86 The University of Florida has evaluated the possibility of adding solar water
heating at an estimated cost of $3.5 million, a project that could potentially provide
emissions savings of 5,069 MtCO2e.87 Virginia Tech plans to implement a distributed
generation plan to include solar PV and wind generation.88
The University of California-Los Angeles operates a thermal energy storage
system that produces and stores excess chilled water at night to take advantage of low
energy prices.89 The chilled water is then used to during the day to cool campus
buildings.90 The University of Florida estimates that a thermal storage facility would cost
$4 million and save 4,038 MtCO2e.91
Other methods to reduce carbon emissions due to power generation include
carbon capture and storage, and the capture and combustion of landfill methane gas. The
University of Washington is considering the use of carbon capture and storage
technologies.92 This involves separating the carbon dioxide directly from the power
plant’s exhaust stream and injecting it into subsurface reservoirs. One of UNC’s
strategies is to capture landfill methane gas and burn it to produce energy.93

31
BEHAVIORAL STRATEGIES
Table 11 lists the current and future behavioral strategies that have been identified
by the 11 peer institution CAPs. These 22 strategies are categorized under the headings
“Campus Awareness and Programs,” “Purchasing,” “Transportation,” and “Waste.” The
strategies were compiled through research on each university’s respective CAP.
Campus Awareness and Programs
Campus outreach on sustainability can be an effective tool to promote awareness,
encourage behavior change and garner support for carbon mitigation strategies. As part of
its student culture and engagement initiative, Virginia Tech plans to incorporate a
sustainability education session during orientation, develop a sustainable living guide for
new students and create a sustainability internship program.94 Both Virginia Tech and
ASU encourage research projects that connect students to sustainability efforts on
campus, which also helps to promote awareness.95,96
To reduce energy usage during off-peak times, some universities are
consolidating classroom usage. For example, UW-Oshkosh includes this strategy in its
campus sustainability plan, suggesting that classroom use be confined to the most energy
efficient buildings during the summer and holidays.97 This would allow lights to be
turned off or dimmed in other buildings and heating and air conditioning needs would be
reduced.

32
Table 11: Peer Institution List of Behavioral Carbon Reduction Strategies
Behavioral AS
U
Corn
ell
UC
-Berk
ele
y
UC
LA
CU
-Bo
uld
er
UF
UN
C
UW
-Mad
iso
n
UW
-Osh
ko
sh
Wash
ing
ton
VT
UT-A
ust
in
Campus Awareness & Programs Campus awareness X X X X X X X X X X X X Research projects X X X Space utilization X X Student "green fee" X X Green fund X X X X X X
Purchasing Life cycle cost analysis
X X X X X X
Energy Star equipment
X X X X X X X X X X X X
PCW copy paper X X X X
Carbon offsets X X X X Green power purchases
X X X X
Transportation
Transportation plan X X X
Public transit options X X X X X X Reduced vehicle parking
X X X X
Telework & distance education
X X X X X X
Reduced air travel X X X X X X Fuel-efficient campus vehicles
X X X X X X X X
Bicycle plans & projects
X X X X X X X
Staff or fleet biking X X
Waste
Zero-waste campus X X X Paper reduction X X X
Composting program X X X X X X
Increase recycling X X X X X X X X Sources: ASU, “Carbon Neutrality Action Plan;” Cornell, “Climate Action Plan;” UC-Berkeley, “2009 Climate Action Plan;” UCLA, “Climate Action Plan;” CU-Boulder, “Conceptual Plan for Carbon Neutrality;” UF, “Climate Action Plan v1.0;” UNC, “Climate Action Plan;” UW, “Climate Action Plan;” UW-Madison, “We Conserve;” UW-Oshkosh, “Climate Action Plan;” VT, “Climate Action Commitment and Sustainability Plan.”

33
A student green fee involves adding a small increase to student fees that is set
aside specifically for sustainability projects. Virginia Tech has proposed a small green fee
that would begin at $2 per semester and increase $1 every semester until it reaches $5,
which would represent less than one percent of the current student fee of $650 per
semester.98 These funds would immediately increase the available funds for sustainability
projects, while also improving student awareness of sustainability issues.99 If the strategy
is adopted, Virginia Tech would select a grant-making committee and develop a proposal
process associated with the funds to ensure that students are involved in the decision
making process.100 The University of Washington is also considering the implementation
of a student green fee, proposing to increase quarterly student fees by $5.101
A green development fund is an endowment fund dedicated to campus
sustainability programs. Virginia Tech plans to establish a green fund to attract donations
that will support initiatives proposed in its sustainability plan.102 Arizona State University
and UCLA are considering establishing funds to offset airline travel.103,104 These funds
could be used to support carbon reduction strategies on campus or to purchase formal
carbon offsets.
Purchasing
Purchasing practices are another way that institutions can reduce their carbon
footprints. One purchasing strategy is to use life cycle cost analysis (LCCA), which is a
tool used to evaluate the total cost of ownership (total capital, operational, maintenance
and replacement costs). The University of Washington plans to use LCCA to make
informed, energy efficient decisions on large building projects.105 To ensure that energy
efficiency goes beyond construction, all peer universities either encourage or require the
purchase of Energy Star equipment and appliances on their campuses. Another strategy
being used is the purchase of post-consumer waste (PCW) paper. Purchasing paper with

34
higher recycled contents can help reduce virgin material use at the front end of the
process. Virginia Tech is proposing that all campus departments purchase copy paper that
is at least 30 percent PCW.106
Carbon offsets and green power purchases can also be used to reduce greenhouse
gas emissions. Entities can use carbon offsets to balance out the carbon emissions that
they are unable to reduce, and can take the form of third-party offsets (certified and
uncertified) and local carbon offset projects. For example, ASU will use its
environmental impact fee to offset airline travel for campus carbon reduction in the short
term and plans to purchase formal carbon offsets in 2035 to reach net zero carbon
emissions.107 Formal or third-party validated offset projects can include renewable
energy, energy efficiency and reforestation. Another strategy is to limit purchased power
to renewable energy sources. The University of Wisconsin-Oshkosh plans to increase the
amount of purchased electricity that comes from renewable energy generated by
Wisconsin Public Service, which is currently at 23 percent and is mostly composed of
wind power.108
Transportation
Universities can influence student, faculty and staff commute emissions through
various transportation programs. The University of Wisconsin-Oshkosh is creating a
comprehensive campus transportation plan to reduce vehicle trips to campus by 20
percent by 2012 and encourage the use of alternative modes of transit.109 Through student
transportation fees, the University of Florida provides bus passes for students, faculty and
staff to access the Gainesville Regional Transit System.110 Virginia Tech is working with
Blacksburg Transit to provide real-time transit information to users in order to increase
ridership.111

35
Aside from providing public transit options, universities can also discourage the
amount of single occupancy vehicle commuters by limiting on-campus parking. Arizona
State University plans to implement a parking ban for freshman students who live on
campus.112 Virginia Tech is considering a freshman parking ban, which it estimates will
reduce the number of vehicles on campus by 1,500 and result in annual emissions savings
of about 18 MtCO2e.113 Limiting parking can create other benefits, such as reducing the
need to construct additional parking lots on campus property, decreasing the land needed
for parking lots and the ability to convert parking lots to open space or other uses.
Telework, flex scheduling and distance education are other strategies to reduce
emissions from commuter travel. Through the opportunity to work, teach and learn from
home or satellite offices, students, faculty and staff can reduce their number of trips to
campus. The University of Washington is proposing to develop a comprehensive effort to
expand the use of telework and distance education on its campuses.114 To address
emissions from air travel, many institutions have committed to encouraging the use of
teleconferencing when possible. Cornell plans to develop a business travel model
decision system, which could educate travelers about air travel impacts and offer
suggestions on lower carbon-intensive travel options.115 Cornell is also increasing its
investment in teleconferencing and encouraging its use as an alternative to air travel.116
The majority of UT-Austin’s peer institutions have created policies to ensure that
new and existing campus vehicles are fuel efficient. The University of California-
Berkeley plans to replace its older campus fleet vehicles with fuel efficient models, such
as hybrid vehicles.117 Virginia Tech has estimated that it could reduce its carbon
emissions by up to 14 MtCO2e if it replaces 11 units in its fleet with higher efficiency
vehicles.118

36
Bicycle plans and projects can enhance transportation options in and around
campuses. These projects can include providing bike loan services, repair assistance and
secure and adequate bike racks. Virginia Tech plans to institute a campus bike share
program to reduce short vehicle trips across campus.119 For the 30-bike pilot program, VT
estimates the set up fee would be $200,000 and the emissions savings would be about 10
MtCO2e.120 The University of California-Berkeley is planning to introduce fleet biking,
which could produce emissions saving of 3 MtCO2e per year.121
Waste
Waste minimization initiatives include composting programs, recycling efforts
and paper reduction practices. Arizona State University has committed to becoming a
zero waste campus by 2025 through aggressively implementing sustainable purchasing
practices and solid/water waste management practices.122 One of ASU’s planned practices
that will reduce the amount of paper being used on campus is double-sided copying and
printing.123 Through introducing a campus composting program, UC-Berkeley estimates
that it could reduce annual greenhouse gas emissions by 294 MtCO2e.124 The University
of Colorado-Boulder is considering expanding its recycling practices by providing
additional campus outreach, adding recycling collection containers in buildings and
providing refillable mugs to employees.125
The climate action plans of the 11 peer universities reviewed in this study have
identified 40 carbon reduction strategies that are either being implemented or are listed as
future strategies. Twenty-eight of those strategies are not currently being used by UT-
Austin. The following chapter will analyze the 28 peer university strategies to determine
the strategies that could be implemented at UT-Austin.

37
Chapter 6: Analysis
The University of Texas at Austin (UT-Austin) has the opportunity to incorporate
the sustainable practices being implemented at other peer universities into its own climate
action plan. Some of the strategies may not be feasible or cost-effective for UT-Austin,
but others may be well suited to address the university’s greenhouse gas (GHG)
emissions. This chapter will provide an analysis of peer institution strategies to determine
appropriate strategies for UT-Austin based on four criteria: feasibility, ease of
implementation, cost and estimated reduction of GHG emissions. A qualitative survey
instrument was distributed to a select group of UT-Austin faculty and staff, chosen for
their knowledge of campus operations and sustainability practices. However, there were
too few survey respondents for the survey to be useful. Therefore, the following analysis
is based solely on a prima facie assessment of the strategies and their appropriateness for
UT-Austin.
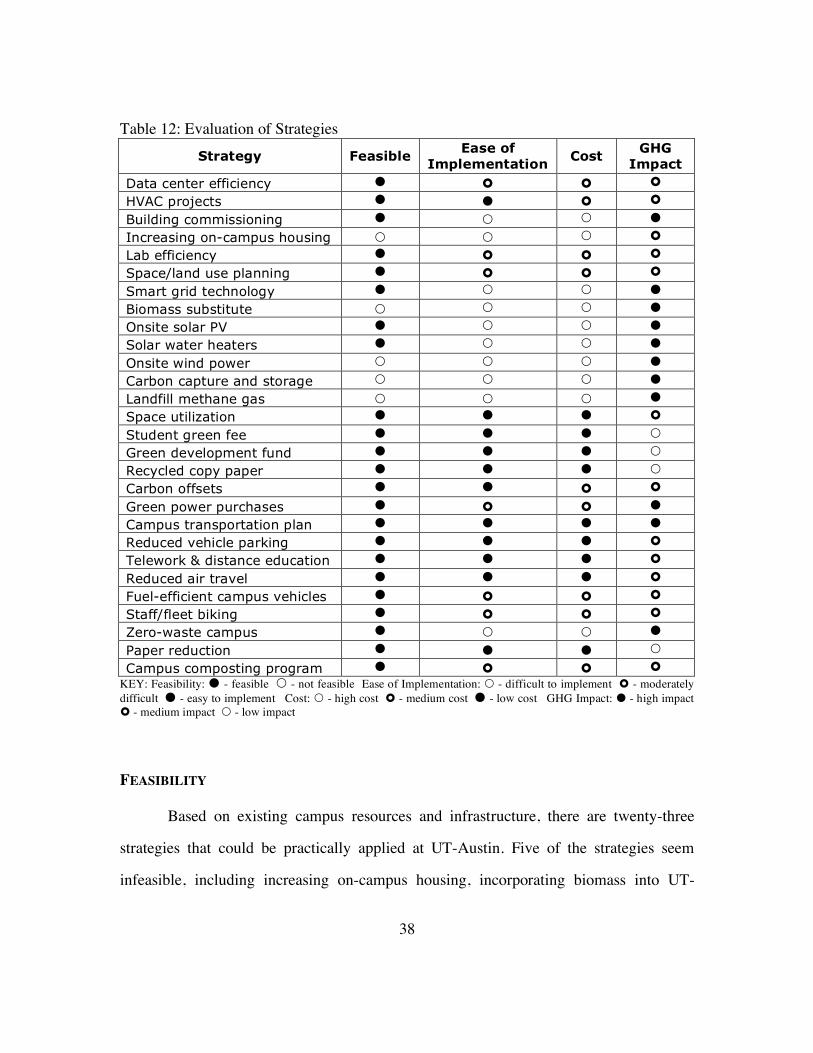
Table 12 lists 28 peer institution strategies and provides an assessment of each
strategy’s feasibility, ease of implementation, cost, and impact on GHG emissions.
Feasibility refers to a strategy’s practical application at UT-Austin campuses or, in the
case of capturing landfill methane gas to generate power, at the Texas Disposal Systems
landfill facility. Ease of implementation is a measure of the degree of difficulty involved
in adopting and executing a strategy. Cost refers to total cost of the strategy. Greenhouse
gas emissions impact is a measure of how much the strategy reduces GHG emissions
attributed to UT-Austin.
38
Table 12: Evaluation of Strategies
Strategy Feasible Ease of
Implementation Cost
GHG Impact
Data center efficiency
HVAC projects
Building commissioning
Increasing on-campus housing
Lab efficiency
Space/land use planning
Smart grid technology
Biomass substitute
Onsite solar PV
Solar water heaters
Onsite wind power
Carbon capture and storage
Landfill methane gas
Space utilization
Student green fee
Green development fund
Recycled copy paper
Carbon offsets
Green power purchases
Campus transportation plan
Reduced vehicle parking
Telework & distance education
Reduced air travel
Fuel-efficient campus vehicles
Staff/fleet biking
Zero-waste campus
Paper reduction
Campus composting program KEY: Feasibility: - feasible - not feasible Ease of Implementation: - difficult to implement - moderately difficult - easy to implement Cost: - high cost - medium cost - low cost GHG Impact: - high impact - medium impact - low impact
FEASIBILITY
Based on existing campus resources and infrastructure, there are twenty-three
strategies that could be practically applied at UT-Austin. Five of the strategies seem
infeasible, including increasing on-campus housing, incorporating biomass into UT-

39
Austin’s power generation mix, adding onsite wind power generation, installing carbon
capture and storage technology at UT-Austin’s power plant, and capturing landfill
methane gas to produce electricity. Constructing a greater number of on-campus housing
units is an unlikely strategy due to the limited amount of space on and near campus.
Space constraints would also make it difficult to install carbon capture and storage
technology at the Hal C. Weaver Power Plant or wind turbines at either UT-Austin
campus. Generating power using biomass or landfill methane gas would be difficult on
campus, as the existing power plant uses only natural gas and there is no landfill near
campus. The Texas Disposal Systems landfill facility used by UT-Austin is uncapped and
not equipped with a methane management system.126
EASE OF IMPLEMENTATION
The following 11 strategies are listed as being easy to implement: heating,
ventilation and air conditioning (HVAC) upgrades and maintenance projects; space
utilization; student green fee; green fund; recycled copy paper; carbon offsets; campus
transportation plan; reduced vehicle parking; telework and distance education; reduced
air travel; and paper reduction. These projects would not involve substantial changes to
campus infrastructure and could be implemented in a relatively short amount of time. For
example, the efficient use of space during holidays and summer months could be
implemented by adopting a policy that requires that classroom usage be confined to the
most efficient buildings during off-peak periods. A campus policy on the purchasing of at
least 30 percent post consumer waste copy paper could be adopted to change paper
purchasing practices across campus.
The seven strategies listed as moderately difficult to implement represent
strategies that might require in-depth, costly analysis or the addition of new resources or

40
staff, including efficient data centers, lab efficiency, space/land use planning, green
power purchases, fuel efficient campus vehicles, staff/fleet biking and campus
composting program. For example, replacing older vehicles with fuel efficient ones
would involve an analysis of UT-Austin’s current fleet and the purchase of fuel efficient
vehicles. The added cost of the new vehicles might create a barrier to implementation due
to current budget limitations. As another example, the strategy of becoming a Green
Choice subscriber with Austin Energy to ensure that purchased power comes from
renewable sources would depend on program availability and the evaluation of higher
costs to the university, which could make it more difficult to implement.
The remaining ten strategies would be difficult to implement because they would
involve changes to infrastructure and/or significant investments in new technologies and
resources in addition to any in-depth analysis required. Those more complex options
include: building commissioning; on-campus housing; biomass power generation; onsite
solar photovoltaic (PV) power generation; solar water heaters; onsite wind power
generation; carbon capture and storage (CCS); landfill methane gas; and zero waste
campus. Implementing a smart grid system would involve installing meters on UT-Austin
campus buildings, a costly and time-intensive project. To add onsite solar photovoltaic
(PV) power generation, UT-Austin would need to conduct an evaluation to determine
appropriate building rooftop space as well as assess financing options to cover the
substantial cost of the project.
COST
Costs for each strategy are assessed as low, medium or high. There are nine
strategies ranked as low cost, including HVAC upgrades and maintenance projects,
efficient space utilization, the implementation of a student green fee or a green

41
development fund, purchasing recycled copy paper, creating a campus transportation
plan, reducing vehicle parking on campus, decreasing paper consumption and increasing
the use of telework, flex scheduling, distance education and teleconferencing. The nine
strategies listed as medium cost include efficient data centers, laboratory efficiency,
space/land use planning, carbon offsets, green power purchases, fuel efficient fleet
vehicles, staff/fleet biking, and a campus composting program. The ten high cost
strategies include building commissioning, on-campus housing, smart grid technology,
biomass power generation, onsite solar PV, solar water heaters, onsite wind, CCS,
landfill methane gas and zero-waste campus.
IMPACT ON GREENHOUSE GAS EMISSIONS
The impact that each strategy has on GHG emissions was ranked high, medium or
low. The higher the impact, the greater the reduction of GHG emissions. The following
strategies have a high GHG impact: building commissioning, smart grid technology,
biomass power generation, onsite solar PV, solar water heaters, onsite wind, CCS,
landfill methane gas, green power purchases, campus transportation plan, and zero-waste
campus. The strategies with a medium GHG impact include efficient data centers, HVAC
upgrades and maintenance projects, on-campus housing, lab efficiency, space/land use
planning, efficient space utilization, carbon offsets, reduced vehicle parking, telework,
flex scheduling and distance education, reduced air travel, fuel efficient fleet vehicles,
staff/fleet biking and campus composting program. The strategies that have a low impact
on GHG emissions include: student green fee, green development fund, recycled copy
paper and paper reduction.
The 28 peer university strategies were evaluated in this chapter based on
feasibility, ease of implementation, cost and impact on greenhouse gas emissions. The

42
preceding analysis is a prima facie assessment of each strategy regarding the decision
criteria. The following chapter will provide recommendations on carbon reduction
strategies that could be implemented at UT-Austin.
43
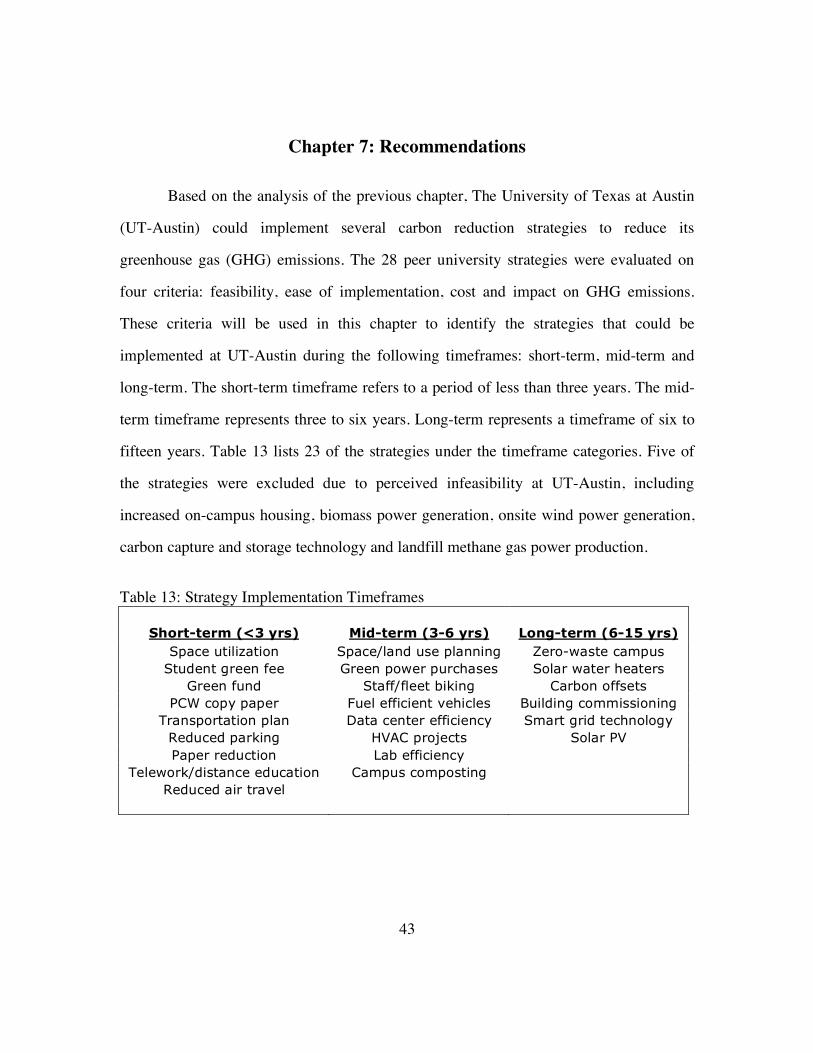
Chapter 7: Recommendations
Based on the analysis of the previous chapter, The University of Texas at Austin
(UT-Austin) could implement several carbon reduction strategies to reduce its
greenhouse gas (GHG) emissions. The 28 peer university strategies were evaluated on
four criteria: feasibility, ease of implementation, cost and impact on GHG emissions.
These criteria will be used in this chapter to identify the strategies that could be
implemented at UT-Austin during the following timeframes: short-term, mid-term and
long-term. The short-term timeframe refers to a period of less than three years. The mid-
term timeframe represents three to six years. Long-term represents a timeframe of six to
fifteen years. Table 13 lists 23 of the strategies under the timeframe categories. Five of
the strategies were excluded due to perceived infeasibility at UT-Austin, including
increased on-campus housing, biomass power generation, onsite wind power generation,
carbon capture and storage technology and landfill methane gas power production.
Table 13: Strategy Implementation Timeframes
Short-term (<3 yrs) Mid-term (3-6 yrs) Long-term (6-15 yrs) Space utilization Space/land use planning Zero-waste campus
Student green fee Green power purchases Solar water heaters Green fund Staff/fleet biking Carbon offsets
PCW copy paper Fuel efficient vehicles Building commissioning Transportation plan Data center efficiency Smart grid technology
Reduced parking HVAC projects Solar PV Paper reduction Lab efficiency
Telework/distance education Campus composting Reduced air travel

44
SHORT-TERM
The ideal short-term strategies would be feasible, easy to implement, low cost and
have a high impact on GHG emissions. The following nine strategies could be
implemented at UT-Austin within the next three years: efficient space utilization, student
green fee, green development fund, recycled copy paper, campus transportation plan,
reduced vehicle parking, paper reduction, reduced air travel and telework, flex scheduling
and distance education. These strategies have varying degrees of impact on GHG
emissions, but they are all feasible, easy to implement and could be adopted with little
cost.
MID-TERM
Mid-term strategies are feasible, can be more difficult to implement, have
medium costs and medium to high impact on GHG emissions. The following eight
strategies are categorized as mid-term strategies: space/land use planning, green power
purchases, staff/fleet biking, fuel efficient vehicles, data center efficiency, heating,
ventilation and air conditioning upgrades and maintenance projects, lab efficiency and
campus composting program. These strategies could be added within three to six years
after an in-depth evaluation of how to best implement and invest in each strategy.
LONG-TERM
Long-term strategies include zero-waste campus, solar water heaters, carbon
offsets, building commissioning, smart grid technology and solar photovoltaic (PV)
power generation. These strategies are feasible and have a high impact on GHG
emissions, but they are extremely costly and difficult to implement. Carbon offsets are

45
included in the long-term timeframe, but could be used at any stage to reduce greenhouse
gas emissions through the purchase of third party verified offsets or the investment in
local sustainability projects.
Based on feasibility, ease of implementation, cost and impact on GHG emissions,
23 carbon reduction strategies could possibly be adopted by UT-Austin in the next 15
years. It would be prudent for UT-Austin to conduct more thorough analyses of the
strategies within the next year to determine whether they might be suitable for UT-Austin
and the most appropriate timing for their implementation. The timeframes listed could be
used as guidelines, but strategy implementation will also depend upon economic
conditions at the university, political will and potential legislation that could create an
incentive for carbon reduction.

46
Chapter 8: Conclusion
This report has evaluated The University of Texas at Austin’s (UT-Austin)
greenhouse gas (GHG) emissions inventory, its current carbon reduction strategies and
the strategies being implemented by eleven peer universities to provide recommended
actions that UT-Austin can take to reduce its carbon footprint. Twenty-three peer
university carbon mitigation strategies were identified as possible future strategies for
UT-Austin, including space utilization, student green fee, green fund, recycled copy
paper, campus transportation plan, reduced vehicle parking, paper reduction, reduced air
travel, telework and distance education, green power purchases, staff/fleet biking, fuel
efficient campus vehicles, efficient data centers, heating, ventilation and air conditioning
upgrades and projects, laboratory efficiency, campus composting plan, space/land use
planning, smart grid technology, building commissioning, solar photovoltaic power
generation, zero-waste campus, carbon offsets and solar water heaters.
By analyzing the feasibility, ease of implementation, cost and impact on GHG
emissions, the strategies were categorized under the following timeframes: short-term
(less than three years), mid-term (three to six years) and long-term (six to fifteen years).
The nine recommended short-term strategies include: efficient space utilization, student
green fee, green development fund, recycled copy paper, campus transportation plan,
reduced vehicle parking, paper reduction, reduced air travel and telework, flex scheduling
and distance education. The mid-term strategies include: space/land use planning, green
power purchases, staff/fleet biking, fuel efficient vehicles, data center efficiency, heating,
ventilation and air conditioning upgrades and maintenance projects, lab efficiency and
campus composting program. The strategies identified as long-term carbon reduction

47
strategies include: zero-waste campus, solar water heaters, carbon offsets, building
commissioning, smart grid technology and solar photovoltaic (PV) power generation.
The University of Texas at Austin should review the recommended strategies
within the next year to formalize its sustainability commitment into a climate action plan.
The adoption of new carbon reduction strategies will allow UT-Austin to continue to
reduce its greenhouse gas emissions through reduced energy demand, energy
conservation and awareness, and the investment in new technologies. Through the
implementation of the strategies, UT-Austin can also become an influential leader in
sustainability and an example for other universities.
1 Good Company, “2009 Greenhouse Gas Inventory,” February 2009, http://www.utexas.edu/facilities/documents/2008UTAustinGHGInventoryrev03052009.pdf (accessed March 6, 2010). 2 Reid, Ryan. “Carl J Eckhardt Heating and Power Complex: A Study in the Benefits of Efficiency Improvements to Emissions and Fuel Costs,” http://www.utexas.edu/utilities/sustainability/power-plant-efficiency.pdf (accessed March 13, 2010). 3 Facilities Services and Project Management and Construction Services, “UTakeCharge,” University of Texas at Austin, http://www.utexas.edu/utakecharge/ (accessed March 17, 2010). 4 University of Texas at Austin, “Campus Sustainability Policy,” April 22, 2008, http://www.utexas.edu/policies/hoppm/01.A.03.html (accessed March 17, 2010). 5 Ibid.

48
6 Good Company, “2009 Greenhouse Gas Inventory,” February 2009, http://www.utexas.edu/facilities/documents/2008UTAustinGHGInventoryrev03052009.pdf (accessed March 6, 2010). 7 Ibid. 8 Ibid. 9 Ibid. 10 Business Wire, “University of Texas Austin Utilities Chief to Chair International District Energy Association Board: New board members also elected,” July 1, 2009, http://www.businesswire.com/portal/site/home/permalink/?ndmViewId=news_view&newsId=20090701005849&newsLang=en (accessed March 13, 2010). 11 Utilities and Energy Management, “Current UEM Projects,” University of Texas at Austin, http://www.utexas.edu/utilities/projects/ (accessed March 13, 2010). 12 Utilities and Energy Management, “Sustainability,” University of Texas at Austin, http://www.utexas.edu/utilities/sustainability/ (accessed March 13, 2010). 13 Utilities and Energy Management, “Past Projects,” University of Texas at Austin, http://www.utexas.edu/utilities/projects/past.html (accessed March 13, 2010). 14 Utilities and Energy Management, “Power Plant and Chilling Stations,” University of Texas at Austin, http://www.utexas.edu/utilities/services/powerplant/ (accessed March 13, 2010). 15 Utilities and Energy Management, “Chilling Station 6 and the Thermal Energy Storage Facility,” University of Texas at Austin, http://www.utexas.edu/utilities/projects/TES-Flyer.pdf (accessed March 13, 2010). 16 Utilities and Energy Management, “Other Internal Projects,” University of Texas at Austin, http://www.utexas.edu/utilities/projects/internal.html (accessed March 13, 2010). 17 Juan Ontiveros, email message to author, April 6, 2010. 18 Ibid. 19 Utilities and Energy Management, “Current UEM Projects,” University of Texas at Austin, http://www.utexas.edu/utilities/projects/ (accessed March 13, 2010). 20 Ibid. 21 Reid, Ryan. “Carl J Eckhardt Heating and Power Complex: A Study in the Benefits of Efficiency Improvements to Emissions and Fuel Costs,” http://www.utexas.edu/utilities/sustainability/power-plant-efficiency.pdf (accessed March 13, 2010). 22 Juan Ontiveros, email message to Marinoelle Hernandez, April 6, 2010. 23 White, Audrey, “Construction Junction: University aims for sustainability with building projects,” The Daily Texan, February 3, 2010, http://www.utexas.edu/facilities/about/news/documents/construction-juncti.pdf (accessed April 2, 2010). 24 Ibid. 25 Facilities Services and Project Management and Construction Services, “UTakeCharge,” University of Texas at Austin, http://www.utexas.edu/utakecharge/ (accessed March 17, 2010).

49
26 Facilities Services and Project Management and Construction Services, “Project Update,” University of Texas at Austin, http://www.utexas.edu/utakecharge/projects/update.html (accessed March 17, 2010). 27 Ibid. 28 Ibid. 29 Ibid. 30 Ibid. 31 Ibid. 32 Ibid. 33 Ibid. 34 Utilities and Energy Management, “Mechanical Distribution,” University of Texas at Austin, http://www.utexas.edu/utilities/services/mechanical/#conserve (accessed March 17, 2010). 35 Ibid. 36 Ibid. 37 Facilities Services and Project Management and Construction Services, “The University of Texas at Austin Announces Partnership with Energy Star,” University of Texas at Austin, http://www.utexas.edu/utakecharge/news/documents/UT_ENERGYSTAR.pdf (accessed March 17, 2010). 38 Ibid. 39 The Division of Housing and Food Service, “Environmental Initiatives,” University of Texas at Austin, http://www.utexas.edu/student/housing/index.php?site=16&scode=0&id=1901 (accessed April 12, 2010). 40 Project Management and Construction Services, “Sustainability at PMCS,” University of Texas at Austin, http://www.utexas.edu/pmcs/sustainability/ (accessed March 18, 2010). 41 Parking and Transportation Services, “Transportation,” University of Texas at Austin, http://www.utexas.edu/parking/transportation/index.html (accessed March 18, 2010). 42 Parking and Transportation Services, “Shuttles,” University of Texas at Austin, http://www.utexas.edu/parking/transportation/shuttle/index.html (accessed March 18, 2010). 43 Ibid. 44 Campus Environmental Center, “Orange Bike Project,” University of Texas at Austin, http://www.utenvironment.org/our_projects/orange_bike_project (accessed April 2, 2010). 45 Campus Environmental Center, “Trash to Treasure,” University of Texas at Austin, http://utenvironment.org/our_projects/trash_to_treasure (accessed April 2, 2010). 46 White, Audrey, “UT recycling program to expand with awareness,” The Daily Texan, March 22, 2010, http://www.utexas.edu/facilities/about/news/documents/ut-recycling-program-ex.pdf (accessed April 2, 2010).

50
47 Facilities Services and Project Management and Construction Services, “Project Update,” University of Texas at Austin, http://www.utexas.edu/utakecharge/projects/update.html (accessed March 18, 2010). 48 Ibid. 49 Utilities and Energy Management, “Mechanical Distribution,” University of Texas at Austin, http://www.utexas.edu/utilities/services/mechanical/#conserve (accessed March 18, 2010). 50 Ibid. 51 Arizona State University, “Carbon Neutrality Action Plan,” September 15, 2009, http://carbonzero.asu.edu/CarbonPlan022410.pdf (accessed April 12, 2010). 52 Ibid. 53 Malin, Nadav, “LEED Delivers on Predicted Energy Savings,” December 1, 2007, Environmental Building News, http://www.buildinggreen.com/auth/article.cfm/2007/12/4/LEED-Delivers-on-Predicted-Energy-Savings/ (accessed April 12, 2010). 54 University of California at Berkeley Office of Sustainability, “2009 Climate Action Plan,” 2009, http://calcap.berkeley.edu (accessed April 12, 2010). 55 Arizona State University, “Carbon Neutrality Action Plan,” September 15, 2009, http://carbonzero.asu.edu/CarbonPlan022410.pdf (accessed April 12, 2010). 56 University of California at Los Angeles, “Climate Action Plan,” December 2008, http://www.sustain.ucla.edu/media/files/UCLA_Climate_Action_Plan.pdf (accessed April 12, 2010). 57 University of Colorado Carbon Neutrality Working Group, “Conceptual Plan for Carbon Neutrality at the University of Colorado at Boulder,” August 2009, http://www.colorado.edu/climatenergy/downloads/CUBoulderCAP-Approved10-8.pdf (accessed April 12, 2010). 58 Ibid. 59 Cornell University, “Cornell Climate Action Plan,“ http://www.sustainablecampus.cornell.edu/climate/ (accessed April 12, 2010). 60 Virginia Tech, “Virginia Tech Climate Action Commitment and Sustainability Plan,” http://www.facilities.vt.edu/sustainability/sustPlan.pdf (accessed April 12, 2010). 61 Lizotte, Michael, “Climate Action Plan,” November 10, 2009, University of Wisconsin at Oshkosh, http://acupcc.aashe.org/upload/cap/MzMzLWNhcC5wZGY=.dl (accessed April 12, 2010). 62 Arizona State University, “Carbon Neutrality Action Plan,” September 15, 2009, http://carbonzero.asu.edu/CarbonPlan022410.pdf (accessed April 12, 2010). 63 University of California at Berkeley Office of Sustainability, “2009 Climate Action Plan,” 2009, http://calcap.berkeley.edu (accessed April 12, 2010). 64 Cornell University, “Cornell Climate Action Plan,“ http://www.sustainablecampus.cornell.edu/climate/ (accessed April 12, 2010).

51
65 University of California at Los Angeles, “Climate Action Plan,” December 2008, http://www.sustain.ucla.edu/media/files/UCLA_Climate_Action_Plan.pdf (accessed April 12, 2010). 66 University of California at Berkeley Office of Sustainability, “2009 Climate Action Plan,” 2009, http://calcap.berkeley.edu (accessed April 12, 2010). 67 Ibid. 68 Cornell University, “Cornell Climate Action Plan,“ http://www.sustainablecampus.cornell.edu/climate/ (accessed April 12, 2010). 69 University of Washington, “Climate Action Plan,” September 2009, http://f2.washington.edu/oess/sites/default/files/file/UW%20Climate%20Action%20Plan%2010_9.pdf (accessed April 12, 2010). 70 University of California at Los Angeles, “Climate Action Plan,” December 2008, http://www.sustain.ucla.edu/media/files/UCLA_Climate_Action_Plan.pdf (accessed April 12, 2010). 71 University of Colorado Carbon Neutrality Working Group, “Conceptual Plan for Carbon Neutrality at the University of Colorado at Boulder,” August 2009, http://www.colorado.edu/climatenergy/downloads/CUBoulderCAP-Approved10-8.pdf (accessed April 12, 2010). 72 Ibid. 73 Cornell University, “Cornell Climate Action Plan,“ http://www.sustainablecampus.cornell.edu/climate/ (accessed April 12, 2010). 74 Ibid. 75 Virginia Tech, “Virginia Tech Climate Action Commitment and Sustainability Plan,” http://www.facilities.vt.edu/sustainability/sustPlan.pdf (accessed April 12, 2010). 76 Cornell University, “Cornell Climate Action Plan,“ http://www.sustainablecampus.cornell.edu/climate/ (accessed April 12, 2010). 77 Arizona State University, “Carbon Neutrality Action Plan,” September 15, 2009, http://carbonzero.asu.edu/CarbonPlan022410.pdf (accessed April 12, 2010). 78 University of Washington, “Climate Action Plan,” September 2009, http://f2.washington.edu/oess/sites/default/files/file/UW%20Climate%20Action%20Plan%2010_9.pdf (accessed April 12, 2010). 79 Virginia Tech, “Virginia Tech Climate Action Commitment and Sustainability Plan,” http://www.facilities.vt.edu/sustainability/sustPlan.pdf (accessed April 12, 2010). 80 University of Washington, “Climate Action Plan,” September 2009, http://f2.washington.edu/oess/sites/default/files/file/UW%20Climate%20Action%20Plan%2010_9.pdf (accessed April 12, 2010). 81 Virginia Tech, “Virginia Tech Climate Action Commitment and Sustainability Plan,” http://www.facilities.vt.edu/sustainability/sustPlan.pdf (accessed April 12, 2010). 82 University of Wisconsin at Madison, “Program Goals and Strategies,” http://www.conserve.wisc.edu/goals_strategies.htm (accessed April 12, 2010). 83 Ibid.
52
84 University of North Carolina at Chapel Hill, “Climate Action Plan,” http://www.climate.unc.edu/portfolio/cap2009/at_download/file (accessed April 12, 2010). 85 Ibid. 86 Ibid. 87 Ibid. 88 Virginia Tech, “Virginia Tech Climate Action Commitment and Sustainability Plan,” http://www.facilities.vt.edu/sustainability/sustPlan.pdf (accessed April 12, 2010). 89 University of California at Los Angeles, “Climate Action Plan,” December 2008, http://www.sustain.ucla.edu/media/files/UCLA_Climate_Action_Plan.pdf (accessed April 12, 2010). 90 Ibid. 91 University of Florida, “Climate Action Plan (CAP) v1.0,” September 2009, http://acupcc.aashe.org/upload/cap/MjUyLWNhcC5wZGY=.dl (accessed April 12, 2010). 92 University of Washington, “Climate Action Plan,” September 2009, http://f2.washington.edu/oess/sites/default/files/file/UW%20Climate%20Action%20Plan%2010_9.pdf (accessed April 12, 2010). 93 University of North Carolina at Chapel Hill, “Climate Action Plan,” http://www.climate.unc.edu/portfolio/cap2009/at_download/file (accessed April 12, 2010). 94 Virginia Tech, “Virginia Tech Climate Action Commitment and Sustainability Plan,” http://www.facilities.vt.edu/sustainability/sustPlan.pdf (accessed April 12, 2010). 95 Ibid. 96 Arizona State University, “Carbon Neutrality Action Plan,” September 15, 2009, http://carbonzero.asu.edu/CarbonPlan022410.pdf (accessed April 12, 2010). 97 Lizotte, Michael, “Climate Action Plan,” November 10, 2009, University of Wisconsin at Oshkosh, http://acupcc.aashe.org/upload/cap/MzMzLWNhcC5wZGY=.dl (accessed April 12, 2010). 98 Virginia Tech, “Virginia Tech Climate Action Commitment and Sustainability Plan,” http://www.facilities.vt.edu/sustainability/sustPlan.pdf (accessed April 12, 2010). 99 Ibid. 100 Ibid. 101 University of Washington, “Climate Action Plan,” September 2009, http://f2.washington.edu/oess/sites/default/files/file/UW%20Climate%20Action%20Plan%2010_9.pdf (accessed April 12, 2010). 102 Virginia Tech, “Virginia Tech Climate Action Commitment and Sustainability Plan,” http://www.facilities.vt.edu/sustainability/sustPlan.pdf (accessed April 12, 2010). 103 Arizona State University, “Carbon Neutrality Action Plan,” September 15, 2009, http://carbonzero.asu.edu/CarbonPlan022410.pdf (accessed April 12, 2010). 104 University of California at Berkeley Office of Sustainability, “2009 Climate Action Plan,” 2009, http://calcap.berkeley.edu (accessed April 12, 2010).
53
105 University of Washington, “Climate Action Plan,” September 2009, http://f2.washington.edu/oess/sites/default/files/file/UW%20Climate%20Action%20Plan%2010_9.pdf (accessed April 12, 2010). 106 Virginia Tech, “Virginia Tech Climate Action Commitment and Sustainability Plan,” http://www.facilities.vt.edu/sustainability/sustPlan.pdf (accessed April 12, 2010). 107 Arizona State University, “Carbon Neutrality Action Plan,” September 15, 2009, http://carbonzero.asu.edu/CarbonPlan022410.pdf (accessed April 12, 2010). 108 Lizotte, Michael, “Climate Action Plan,” November 10, 2009, University of Wisconsin at Oshkosh, http://acupcc.aashe.org/upload/cap/MzMzLWNhcC5wZGY=.dl (accessed April 12, 2010). 109 Ibid. 110 University of Florida, “Climate Action Plan (CAP) v1.0,” September 2009, http://acupcc.aashe.org/upload/cap/MjUyLWNhcC5wZGY=.dl (accessed April 12, 2010). 111 Virginia Tech, “Virginia Tech Climate Action Commitment and Sustainability Plan,” http://www.facilities.vt.edu/sustainability/sustPlan.pdf (accessed April 12, 2010). 112 Arizona State University, “Carbon Neutrality Action Plan,” September 15, 2009, http://carbonzero.asu.edu/CarbonPlan022410.pdf (accessed April 12, 2010). 113 Virginia Tech, “Virginia Tech Climate Action Commitment and Sustainability Plan,” http://www.facilities.vt.edu/sustainability/sustPlan.pdf (accessed April 12, 2010). 114 University of Washington, “Climate Action Plan,” September 2009, http://f2.washington.edu/oess/sites/default/files/file/UW%20Climate%20Action%20Plan%2010_9.pdf (accessed April 12, 2010). 115 Cornell University, “Cornell Climate Action Plan,“ http://www.sustainablecampus.cornell.edu/climate/ (accessed April 12, 2010). 116 Ibid. 117 University of California at Berkeley Office of Sustainability, “2009 Climate Action Plan,” 2009, http://calcap.berkeley.edu (accessed April 12, 2010). 118 Virginia Tech, “Virginia Tech Climate Action Commitment and Sustainability Plan,” http://www.facilities.vt.edu/sustainability/sustPlan.pdf (accessed April 12, 2010). 119 Ibid. 120 Ibid. 121 University of California at Berkeley Office of Sustainability, “2009 Climate Action Plan,” 2009, http://calcap.berkeley.edu (accessed April 12, 2010). 122 Arizona State University, “Carbon Neutrality Action Plan,” September 15, 2009, http://carbonzero.asu.edu/CarbonPlan022410.pdf (accessed April 12, 2010). 123 Ibid. 124 University of California at Berkeley Office of Sustainability, “2009 Climate Action Plan,” 2009, http://calcap.berkeley.edu (accessed April 12, 2010). 125 University of Colorado Carbon Neutrality Working Group, “Conceptual Plan for Carbon Neutrality at the University of Colorado at Boulder,” August 2009,

54
http://www.colorado.edu/climatenergy/downloads/CUBoulderCAP-Approved10-8.pdf (accessed April 12, 2010). 126 Good Company, “2009 Greenhouse Gas Inventory,” February 2009, http://www.utexas.edu/facilities/documents/2008UTAustinGHGInventoryrev03052009.pdf (accessed March 6, 2010).
55
Bibliography
Arizona State University, “Carbon Neutrality Action Plan,” September 15, 2009, http://carbonzero.asu.edu/CarbonPlan022410.pdf (accessed April 12, 2010).
Business Wire, “University of Texas Austin Utilities Chief to Chair International District Energy Association Board: New board members also elected,” July 1, 2009, http://www.businesswire.com/portal/site/home/permalink/?ndmViewId=news_view&newsId=20090701005849&newsLang=en (accessed March 13, 2010).
Campus Environmental Center, “Orange Bike Project,” University of Texas at Austin, http://www.utenvironment.org/our_projects/orange_bike_project (accessed April 2, 2010).
Campus Environmental Center, “Trash to Treasure,” University of Texas at Austin, http://utenvironment.org/our_projects/trash_to_treasure (accessed April 2, 2010).
Cornell University, “Cornell Climate Action Plan,“ http://www.sustainablecampus.cornell.edu/climate/ (accessed April 12, 2010).
Facilities Services and Project Management and Construction Services, “Project Update,” University of Texas at Austin, http://www.utexas.edu/utakecharge/projects/update.html (accessed March 18, 2010).
Facilities Services and Project Management and Construction Services, “The University of Texas at Austin Announces Partnership with Energy Star,” University of Texas at Austin, http://www.utexas.edu/utakecharge/news/documents/UT_ENERGYSTAR.pdf (accessed March 17, 2010).
Facilities Services and Project Management and Construction Services, “UTakeCharge,” University of Texas at Austin, http://www.utexas.edu/utakecharge/ (accessed March 17, 2010).
Good Company, “2009 Greenhouse Gas Inventory,” February 2009, http://www.utexas.edu/facilities/documents/2008UTAustinGHGInventoryrev03052009.pdf (accessed March 6, 2010).
Lizotte, Michael, “Climate Action Plan,” November 10, 2009, University of Wisconsin at Oshkosh, http://acupcc.aashe.org/upload/cap/MzMzLWNhcC5wZGY=.dl (accessed April 12, 2010).

56
Malin, Nadav, “LEED Delivers on Predicted Energy Savings,” December 1, 2007, Environmental Building News, http://www.buildinggreen.com/auth/article.cfm/2007/12/4/LEED-Delivers-on-Predicted-Energy-Savings/ (accessed April 12, 2010).
Parking and Transportation Services, “Shuttles,” University of Texas at Austin, http://www.utexas.edu/parking/transportation/shuttle/index.html (accessed March 18, 2010).
Parking and Transportation Services, “Transportation,” University of Texas at Austin, http://www.utexas.edu/parking/transportation/index.html (accessed March 18, 2010).
Project Management and Construction Services, “Sustainability at PMCS,” University of Texas at Austin, http://www.utexas.edu/pmcs/sustainability/ (accessed March 18, 2010).
Reid, Ryan. “Carl J Eckhardt Heating and Power Complex: A Study in the Benefits of Efficiency Improvements to Emissions and Fuel Costs,” http://www.utexas.edu/utilities/sustainability/power-plant-efficiency.pdf (accessed March 13, 2010).
The Division of Housing and Food Service, “Environmental Initiatives,” University of Texas at Austin, http://www.utexas.edu/student/housing/index.php?site=16&scode=0&id=1901 (accessed April 12, 2010).
University of California at Berkeley Office of Sustainability, “2009 Climate Action Plan,” 2009, http://calcap.berkeley.edu (accessed April 12, 2010).
University of California at Los Angeles, “Climate Action Plan,” December 2008, http://www.sustain.ucla.edu/media/files/UCLA_Climate_Action_Plan.pdf (accessed April 12, 2010).
University of Colorado Carbon Neutrality Working Group, “Conceptual Plan for Carbon Neutrality at the University of Colorado at Boulder,” August 2009, http://www.colorado.edu/climatenergy/downloads/CUBoulderCAP-Approved10-8.pdf (accessed April 12, 2010).
University of Florida, “Climate Action Plan (CAP) v1.0,” September 2009, http://acupcc.aashe.org/upload/cap/MjUyLWNhcC5wZGY=.dl (accessed April 12, 2010).
57
University of North Carolina at Chapel Hill, “Climate Action Plan,” http://www.climate.unc.edu/portfolio/cap2009/at_download/file (accessed April 12, 2010).
University of Texas at Austin, “Campus Sustainability Policy,” April 22, 2008, http://www.utexas.edu/policies/hoppm/01.A.03.html (accessed March 17, 2010).
University of Washington, “Climate Action Plan,” September 2009, http://f2.washington.edu/oess/sites/default/files/file/UW%20Climate%20Action%20Plan%2010_9.pdf (accessed April 12, 2010).
University of Wisconsin at Madison, “Program Goals and Strategies,” http://www.conserve.wisc.edu/goals_strategies.htm (accessed April 12, 2010).
Utilities and Energy Management, “Chilling Station 6 and the Thermal Energy Storage Facility,” University of Texas at Austin, http://www.utexas.edu/utilities/projects/TES-Flyer.pdf (accessed March 13, 2010).
Utilities and Energy Management, “Current UEM Projects,” University of Texas at Austin, http://www.utexas.edu/utilities/projects/ (accessed March 13, 2010).
Utilities and Energy Management, “Mechanical Distribution,” University of Texas at Austin, http://www.utexas.edu/utilities/services/mechanical/#conserve (accessed March 18, 2010).
Utilities and Energy Management, “Other Internal Projects,” University of Texas at Austin, http://www.utexas.edu/utilities/projects/internal.html (accessed March 13, 2010).
Utilities and Energy Management, “Past Projects,” University of Texas at Austin, http://www.utexas.edu/utilities/projects/past.html (accessed March 13, 2010).
Utilities and Energy Management, “Power Plant and Chilling Stations,” University of Texas at Austin, http://www.utexas.edu/utilities/services/powerplant/ (accessed March 13, 2010).
Utilities and Energy Management, “Sustainability,” University of Texas at Austin, http://www.utexas.edu/utilities/sustainability/ (accessed March 13, 2010).
Virginia Tech, “Virginia Tech Climate Action Commitment and Sustainability Plan,” http://www.facilities.vt.edu/sustainability/sustPlan.pdf (accessed April 12, 2010).
White, Audrey, “Construction Junction: University aims for sustainability with building projects,” The Daily Texan, February 3, 2010,

58
http://www.utexas.edu/facilities/about/news/documents/construction-juncti.pdf (accessed April 2, 2010).
White, Audrey, “UT recycling program to expand with awareness,” The Daily Texan, March 22, 2010, http://www.utexas.edu/facilities/about/news/documents/ut-recycling-program-ex.pdf (accessed April 2, 2010).

59
Vita
Marinoelle Hernandez was born in Nederland, Texas. She graduated with a
Bachelor of Arts in International Studies from the University of North Texas in Denton,
Texas in 2003. She worked as a social worker in Austin, Texas for a few years before
entering the Lyndon B. Johnson School of Public Affairs at The University of Texas at
Austin in 2008.
Email address: [email protected]
This report was typed by Marinoelle Hernandez.