herefordshire health and well-being survey 2011 final
TRANSCRIPT
Herefordshire Health and Well-being Survey 2011
Final Report
(Version 1.2)

2 | P a g e Herefordshire Health and Well‐being Survey 2011 Report
CONTENTS Acknowledgements 3 1. Key facts 4 2. Introduction 6
2.1 Background 6 2.2 Overview of survey design 6 2.3 Information gathered by the survey 7 2.4 Key quality information 10
3. Demographic characteristics of Herefordshire and the Survey 12
3.1 Population of Herefordshire 12 3.2 Sample population 13
4. Health status, illnesses and other conditions 14
4.1 Summary 14 4.2 Mental and physical well-being (SF-36 version 2®) 14 4.3 Illnesses and other conditions 23 4.4 Carers 26
5. Health-related lifestyle 27
5.1 Introduction 27 5.2 Summary 27 5.3 Smoking 27 5.4 Alcohol 29 5.5 Fruit and vegetable consumption 30 5.6 Exercise 31 5.7 Body mass index 31
6. Health service use and medicines 33 6.1 Introduction 33 6.2 Summary 33 6.3 Use of GP services 33 6.4 Use of Hospital services 34 6.5 Use of other selected Health services 34 6.6 Medicines 35 7. Technical summary 36
7.1 Introduction 36 7.2 Sampling 36 7.3 Fieldwork 37 7.4 Response 38 7.5 Data preparation 38 7.6 Weighting the sample 38 7.7 Sampling errors 40
Appendices 42
A. Glossary 42 B. Quality Assurance Report 44 C. Questionnaire 48

3 | P a g e Herefordshire Health and Well‐being Survey 2011 Report
ACKNOWLEDGEMENTS
Firstly, we would like to thank all those who contributed to the Herefordshire Health and Well-being Survey (HH&WS) and the production of this report. At the National Centre for Social Research (NatCen), Katharine Sadler was responsible for the research; Roger Stafford was responsible for managing the data, and David Hussey and Kevin Pickering for sampling and weighting. We would like to thank Pauline Burge, Rita Vaughan and their team for organising the fieldwork and data processing; and John Hurn for project programming. Our thanks also go to all the interviewers for their work on the Survey. We are also grateful to the members of Health & Well-being Survey Steering Group of NHS Herefordshire and Herefordshire Council including:
Dr Sarah Aitken Dr Alison Talbot-Smith Tony Cramp David Helm Euan McPherson Trisha Meredith Peter Stebbings (co-author)
and Harriet Yellin from the Herefordshire Council Diversity Team, who arranged all of the translation services. We are also indebted to:
Isobel Gibson, the independent statistician who reviewed the survey design, methodology and weighting, Anne Kingdon from the Welsh Government who provided valuable advice and support, and the Welsh Government for kindly giving permission to use the Welsh Health Survey methodology and questionnaires.
Finally and most importantly, we would like to thank all the Herefordshire residents who participated in the Survey and gave their time in completing the questionnaires. Dr Arif Mahmood Consultant Public Health NHS Herefordshire
If you need help to understand this document, or would like it in another format or language, please call Peter Stebbings, Public Health Dept., NHS Herefordshire on 01432 344344 ext. 7653 or e-mail [email protected]
4 | P a g e Herefordshire Health and Well‐being Survey 2011 Report
1. Key Facts
This report presents the detailed findings of the 2011 Herefordshire Health and Well-Being Survey. The survey is a source of information about the health of people in Herefordshire, the extent to which they use health services and their attitude towards some of the lifestyle factors that can affect their health.
The survey was based on a sample of the general adult population (aged 16 years and over) living in private households in Herefordshire.
The main chapters of the report focus on:
• health status, illnesses and other conditions • health-related lifestyle • health service use
This summary presents key findings from the main chapters of the report. For further information chapters 4 to 6 each begin with a summary of the main findings presented in the body of the text.
Health status, illnesses and other conditions
• Over half of adults reported that their health in general was excellent or very good, while less than a fifth reported fair or poor health.
• Men enjoy significantly better mental health than women.
• Between a fifth and a quarter of adults reported having a limiting long-term illness.
• Almost 20% of adults are currently being treated for high blood pressure.
Health-related lifestyle
• Over 1 in 5 adults reported that they currently smoke and almost a quarter of adult non-smokers reported being regularly exposed to other people’s tobacco smoke indoors or outdoors.
• Around 2 in 5 adults reported drinking above the recommended guidelines on at least one day in the past week, including around a fifth who reported binge drinking1.
• 36% of adults reported eating the recommended five or more portions of fruit and vegetables on the previous day and around 1 in 3 adults reported meeting the guidelines for physical activity2 in the past week.
1 See Glossary (Appendix A) for definition) 2 See Glossary (Appendix A) for definition)

5 | P a g e Herefordshire Health and Well‐being Survey 2011 Report
• Around 55% of adults were classified as overweight or obese3; 23% of women were classified as obese compared with 18% of men.
• In general, men were significantly more likely to smoke and to drink alcohol at above guideline levels and were significantly more likely to be either overweight or obese. Yet they are also significantly more likely to meet physical activity guidelines.
Health service use
• 15% of adults reported that they had talked to a GP - and 9% to a practice nurse - about their own health in the past two weeks.
• 8% of adults reported being in hospital as an inpatient in the past 12 months, 8% as a day patient, and 27% attended as an outpatient.
• Around 16% of adults had attended Casualty/A&E departments in the past 12 months. 4% of adults had attended hospital in the last 3 months due to an accidental injury or poisoning.
• 48% of adults reported being on regular medicine prescribed by their doctor.
3 See Glossary (Appendix A) for definition)

6 | P a g e Herefordshire Health and Well‐being Survey 2011 Report
2. INTRODUCTION
2.1 BACKGROUND
The Herefordshire Health and Well-being Survey (HH&WS) was conducted in two phases. Phase I ran from 8th November 2010 until 31st March 2011 and Phase 2 from 1st April 2011 to 30th September 2011. The Survey was designed to generate information on the health, well-being and lifestyle of the residents of Herefordshire aged 16 years and over. This report presents the results of both phases of the Survey and provides a valuable ‘snapshot’ of various aspects of the health and well-being of Herefordshire’s residents. The data can be used to:
• provide estimates of health and health-related lifestyle for Herefordshire
residents; • enable analysts to examine differences in health and health-related lifestyle
between population sub-groups by place and person; • provide evidence to inform policies and strategies for promoting better health; • provide a measurement of need for health care for resource allocation; • inform the Joint Strategic Needs Assessment produced jointly by the NHS
Herefordshire and Herefordshire Council.
The Survey was commissioned in summer 2010 by NHS Herefordshire and Herefordshire Council. The project management steering group included representatives from the Public Health Department and from Herefordshire Council Research Team, and the Public Experience Manager. Approval for the Survey was granted by the NHS National Research Ethics Service South Birmingham Research Ethics Committee. The Survey was conducted by NatCen on behalf of NHS Herefordshire and Herefordshire Council.
2.2 OVERVIEW OF SURVEY DESIGN
The Survey was based on a sample of adults aged 16 years and over living in private households throughout the County. A sample of addresses was extracted from the small user Postcode Address File (PAF), which is an up to date list of all known addresses in the United Kingdom and is maintained by the Post Office. The version used for this survey did not include residential institutions, which are home to about 1.6% of the 16+ population in Herefordshire. People living in institutions - particularly the elderly - are likely to experience poorer health than residents in private households. For this reason, it should be borne in mind that the results of this survey apply only to private household residents and may well underestimate the prevalence of certain conditions in the population as a whole.
Each address selected for inclusion in the sample was visited by NatCen field staff; some addresses were found not to be private households, or were of buildings that were either derelict, or empty, or second homes, or not yet built. These were all ineligible for further consideration. If an address contained three or less households then all households were included. If an address contained more than three resident households then three would be randomly selected for the Survey using a standard social survey technique called a Kish Grid. This was to prevent too much geographical or social “clumping” that may lead to bias in survey results. The majority of addresses related to homes with one resident private household. All selected households were then approached by the field staff for further consideration.

7 | P a g e Herefordshire Health and Well‐being Survey 2011 Report
Attempts were made to collect information both on the household and on each resident aged 16 or over living within that household. First, the field staff completed a survey form with information gathered during a face-to-face interview with a responsible individual in the household. Self-completion questionnaires were then left for each adult aged over 16 years asking questions about health, health service use and lifestyle. The questionnaires were collected by the interviewer at a subsequent date. As the personal questionnaires were reliant on self-completion, the responses reflect the individual’s own views about their health status rather than any clinical assessment of their condition. The topics covered by the two questionnaires are listed in Tables 2.1a, 2.1b and 2.2.
The survey results were weighted to take into account differential non-response4 and differences between the age / gender profile of the sample population and that of the underlying population of the County. Weighting is discussed in more detail in section 7.6.
During the fieldwork across both phases, 1178 eligible households were selected, of which 943 (80%) eventually took part in the Survey. The number of individuals aged 16+ identified within these households was 1,765, of whom 1,578 (89%) returned completed questionnaires.
Further details of the survey methodology are given in chapter 7 of this report.
2.3 INFORMATION GATHERED BY THE SURVEY
Two questionnaires formed the main survey tools. These can be seen at Appendix C.
The first questionnaire was conducted face to face with a responsible adult from the household. Some basic administrative details needed for the conduct of the survey were collected; these are not detailed here. Then some basic information about the composition of the household was requested. These questions are listed in Table 2.1a.
Table 2.1a: Information gathered about the household Information Notes
For each household member aged 16+
Sex This procedure identified individuals eligible for participation in the Survey
Age Years resident at this address General health Need for care
For each household member aged under 16
Sex Children were excluded from the Survey but their existence within the household was used to determine the household type
Age Years resident at this address General health Need for care
For the household
Tenure of the dwelling Person responsible for paying rent or mortgage
To establish which household member is the household reference person (HRP)5 Person with highest income
4 It is a common feature of social surveys that propensity to respond or participate is related to an individual’s age, gender and socio‐economic group. Older, well‐educated, wealthy females are much more likely to respond than younger, poorly educated, males of low economic status. 5 See Glossary (Appendix A).

8 | P a g e Herefordshire Health and Well‐being Survey 2011 Report
Using the information gathered above the household representative person (HRP) was identified. Further questions were asked about this person to establish the socio-economic status of the household. These questions are listed in Table 2.1b.
Table 2.1b: Topics asked about the Household Reference Person Information Notes
For the Household Reference Person
Employment status To establish the National Statistics Socio-Economic Classification (NS-SEC)6 of the HRP. The main groups are: • Managerial and professional, • Intermediate occupations,
small employers and own account workers
• Lower supervisory and technical occupations
• Semi-routine and routine occupations
• Never worked / unemployed / students / not classified
Length of time out of work if unemployed Length of time since last worked for HRP who is retired or otherwise economically inactive What the organisation / firm HRP worked for did. Job title Qualifications / training required for the job Whether employed or self-employed Management and supervisory responsibilities Part time or full time
The questions asked about the health and well-being of each individual aged 16 and over in the household via the self-completion questionnaire are shown in Table 2.2. Table 2.2: Topics covered in questions on the self‐completion form Topic Subjects
Use of various health services
Contact with GP in previous fortnight Contact with practice nurse in previous fortnight Use of Casualty / A&E in past twelve months NHS & private outpatient treatment in past twelve months NHS & private day patient treatment in past twelve months NHS & private inpatient treatment in past twelve months Use of NHS & private dentist services in past twelve months Use of NHS & private chiropodist services in past twelve months Use of NHS & private physiotherapist services in past twelve months Use of NHS & private osteopath / chiropractor services in past twelve months Use of optician services in last twelve months Use of health visitor, district nurse, community nurse services in last twelve months Use of GP out of hours services in last twelve months Use of NHS Direct in last twelve months Use of pharmacist in last twelve months Flu vaccination in last twelve months7
6 See Glossary (Appendix A) 7 The results of the question about flu vaccination are not included in this report because of small numbers as a result of flu vaccine only being offered to eligible groups of people.

9 | P a g e Herefordshire Health and Well‐being Survey 2011 Report
Use of medicines
Purchase of conventional, herbal, homeopathic medicines or mineral / vitamin supplements in past four weeks Regular medication on prescription
Chronic illnesses and conditions
Ever had treatment for heart attack, cancer or stroke Current treatment status for angina, heart failure, high blood pressure, other heart condition, asthma, emphysema, pleurisy, chronic bronchitis, other respiratory illness Current treatment status for depression, anxiety, other mental illness, arthritis, back pain, epilepsy or fits, varicose veins Diabetes status and means of control Whether being treated for other long term illness or condition
Accidents, injuries and poisoning
Accidents, injuries and poisoning in past three months Nature of incident Location of incident Food poisoning in past three months and whether doctor consulted
Eyesight, hearing & dentition
Eyesight Hearing and hearing aids Number of natural teeth
Health & Well-being (using SF368)
Own classification of health status Changes in health over past twelve months Limitations of health on vigorous activities, housework, carrying groceries, climbing stairs, flexibility, walking, bathing & dressing Physical health in past four weeks and impact on regular activities Emotional health in past four weeks and impact on regular activities Impact of physical and emotional health on social activities in past four weeks Pain in past four weeks Depression and anxiety in past four weeks Perceptions of general health and limiting long term illness
Smoking
Past and present smoking habits Exposure to cigarette smoke Changes in smoking habits in past twelve months Reasons for trying to give up smoking (or not)
Drinking Alcoholic drinking frequency in past 12 months Past drinker or not Consumption of alcohol in past week
Fruit & vegetable consumption
Amount of various types of fruit and vegetables eaten on previous day
Exercise Amount of light, moderate, and vigorous exercise in past week Carers Amount of care given
Biometric data
Gender Age Current pregnancy status Height Weight
Socio-demographic and economic data
Ethnic group Economic activity Highest level of educational qualification
Professional qualifications
8 Explained in Section 4.1 of this report

10 | P a g e Herefordshire Health and Well‐being Survey 2011 Report
2.4 KEY QUALITY INFORMATION Several features of the data collection and analysis need to be borne in mind when interpreting the results of the Survey. 1. A small proportion of people were ineligible for inclusion in the Survey as they
lived at addresses not listed on the small user PAF post code address file. It should be noted that people resident in care homes are generally likely to be in poorer health than those in private households.
2. The data collected on the Survey forms relies on self-completion and individual self-assessment of health status rather than on professional clinical judgement.
3. Survey results are weighted to take into account unequal selection of different
gender / age groups and differential non-response. Weights are used to ensure that the age and sex distribution of the sample population matches that of the underlying 16+ years private household population of Herefordshire.
4. Not every question was answered by every person in the sample and the
percentages presented in this report are based on the number who answered the question under discussion. Nil answers have been omitted from all tables and analysis. Usually answers are missing because respondents could not or would not answer a particular question, or the routing of the questions was such that they were not expected to answer.
5. There is always a degree of uncertainty about the accuracy of a sample estimate
of prevalence and whether it reflects the true value in the underlying population. Therefore, a range of likely values is often presented with a prevalence figure where it is either considered useful to highlight statistically significant variation (eg between sex-specific rates of prevalence) or to illustrate a relatively wide range of likely values and set the sample rate in some context. This range of values is the 95% confidence interval, shown as (CI xx – xx%). Two modes of calculating these have been used, a standard calculation which also takes into account the way the Survey was designed, and a method called Wilson Score – a methodology frequently used in medical statistics. In practice, they give very similar results. Further details are given in Section 7.
6. Rounding of percentages may result in figures that do not exactly equal 100%.
Some percentage figures taken from the Tabular Report supplied by NatCen are presented in rounded form. Others, taken from the Technical Report (also supplied by NatCen or calculated independently), are shown to one decimal place.
7. As part of a quality assurance process, various checks were made on the validity
of the results of the survey. This survey is the first of its kind carried out in Herefordshire and the results cannot be compared directly with similar work to check for plausibility but, where possible, results were compared with those of the Welsh Health Survey 20109 which uses the same questionnaire and methodology across a much larger sample of 15,000 adults. In all cases, the results of the
9 The Welsh Health Survey 2010 report can be accessed at http://wales.gov.uk/topics/statistics/publications/healthsurvey2010/?lang=en

11 | P a g e Herefordshire Health and Well‐being Survey 2011 Report
Herefordshire survey were sufficiently similar to those of the Welsh survey to increase confidence in their reliability. Although other data on prevalence of disease and lifestyle behaviours in Herefordshire do exist, they are not comprehensive and were collected by different methodologies for different purposes, eg payments to GPs. Therefore, it is felt that direct comparisons with the survey outcomes would be inappropriate.
8. The data for each survey member in the sample was given a weight to
compensate for any under- or over-representation of particular socio-demographic groups in the sample when calculating the prevalence within the population of a particular disease or lifestyle behaviour. The rationale for applying weights and the methodology for calculating them are described in Section 7. Checks were made on the weights attached to each sample member to ensure that the health and lifestyle behaviour of any individual was not given undue importance in estimating averages or prevalence for the population as a whole.

12 | P a g e Herefordshire Health and Well‐being Survey 2011 Report
3. DEMOGRAPHIC CHARACTERISTICS OF HEREFORDSHIRE AND THE SURVEY
3.1 POPULATION OF HEREFORDSHIRE
A variety of statistics about the socio-demographic characteristics of the survey participants and the households in which they reside were collected as part of the study. These are listed in Tables 3.1 and 3.2. The socio-demographic profile of the sample can be compared with other known data to ensure that the sample is representative of the private household population of Herefordshire. The best comprehensive range of statistics about the demographic and socio-economic characteristics of the population, including the total population of Herefordshire, is collected every ten years in the Census, under the auspices of the Office for National Statistics (ONS). The most recent Census took place in March 2011 and detailed results will not be available until 2013. When they are released it will be possible to compare the sample profile with that of Herefordshire’s private household population. In between the census years, ONS update the estimated total population of the County on an annual basis with an effective date of June 30th, mid-year. The estimated population is broken down by gender and five year age bands. These mid-year estimates are released about twelve months after the year they relate to. So, although this survey took place in Autumn 2010, the latest set of population estimates available at the time was mid-year 2010. The Survey was concerned with the health and well-being of the private household population (PHH) aged 16 years and over. The ONS mid-year estimated population is a measure of all residents including those living in communal establishments as well as those living in private households. The only available breakdown of the total residents of the County into private household residents and those living in communal establishments is from the Census of population – and the latest available Census information at the time of this survey was from the 2001 Census. Most of the communal establishment population aged 16+ years in Herefordshire live in nursing or care homes. In other parts of the country prisons, university halls of residence and other institutions may house substantial numbers of non-private household population. The 2010 mid-year estimates of the total population of Herefordshire were adjusted by the Herefordshire Council Research Team to remove the estimated communal establishment population. Assumptions were made that:
1. the demographic profile of persons aged under 75 resident in communal establishments would not have changed since the 2001 Census either in total number, gender breakdown, or age breakdown;
2. the proportions of older people, in age groups 75 and over resident in
communal establishments would not have changed since the 2001 Census. The resultant estimate of the total PHH in 2010 was 146,158, broken down by gender and age group is shown in table 3.1.

13 | P a g e Herefordshire Health and Well‐being Survey 2011 Report
Table 3.1: Estimated PHH, mid‐2010 Age
Group 16-24 25-34 35-44 45-54 55-64 65-74 75+ Total 16+
Male 8,526 7,916 11,195 12,901 12,939 10,070 7,388 70,935
Female 8,044 7,703 11,906 13,331 13,495 10,495 10,249 75,223
Total 16,570 15,619 23,101 26,232 26,434 20,565 17,637 146,158
3.2 SAMPLE POPULATION
The age and gender breakdown of the sample is shown in table 3.2. It can be seen that the different gender / age groups are not represented equally in the sample. For example only 0.89% of 16-24 year old males are represented compared with 1.30% of females over 65 years. Weighting was used to correct any bias arising from the differences in distribution of gender and age groups between the sample and the underlying private household population from which the sample was drawn. The weighting methodology is described in Section 7.6. Table 3.2: Age and gender breakdown of the sample and proportion of underlying Private Household Population
Age Group
16-24 25-44 45-64 65+ Total
16+
Male
Number in sample 76 163 268 208 715
Proportion of PHH in sample 0.89% 0.85% 1.04% 1.19%
Female
Number in sample 81 204 309 269 863
Proportion of PHH in sample 1.01% 1.04% 1.15% 1.30%
Total 157 367 577 477 1578

14 | P a g e Herefordshire Health and Well‐being Survey 2011 Report
4. HEALTH STATUS, ILLNESSES AND OTHER CONDITIONS
4.1 SUMMARY
• Over half of adults reported that their health in general was excellent or very good, while less than a fifth reported fair or poor health.
• Mean physical and mental health status scores for women were lower than those for men, indicating poorer health and well-being among women. Men enjoy significantly better mental health than women.
• Between a fifth and a quarter of adults reported having a limiting long-term illness.
• Around 20% of adults reported currently being treated for high blood pressure, 11% for a respiratory illness, 8% for a mental illness, 8% for a heart condition, 8% for arthritis, 8% for back pain and 7% for diabetes.
• 5% of adults reported receiving treatment for cancer at some point in their lives.
4.2 MENTAL AND PHYSICAL WELL-BEING (SF-36 version 2®)
The questionnaire included a standard set of 36 health and well-being questions known as SF-36 v.2®. The responses to these questions were then processed to produce two summary scores, the Physical Component Summary (PCS) score and the Mental Component Summary (MCS) score. These measure physical and mental well-being respectively. The population “norm” for each is estimated to be 50; higher scores indicate better health and well-being and lower scores suggest relatively poor health and well-being. The full list of questions is included in the questionnaire attached at Appendix C. In summary, the questions covered:
• categories of general health (from excellent to poor);
• changes in general health over the previous twelve months;
• limitations imposed by health problems in undertaking vigorous physical activities, moderate activities, lifting and carrying groceries, climbing stairs, bending, kneeling and stooping, walking, bathing or dressing;
• limitations on accomplishments at work and other activities in the past four weeks caused by physical health problems;
• limitations on accomplishments at work and other activities in the past four weeks caused by emotional problems;

15 | P a g e Herefordshire Health and Well‐being Survey 2011 Report
• degree to which physical health and emotional problems have interfered with social activities in the past four weeks;
• experience of bodily pain and the impact of pain on normal work activities in the past four weeks;
• prevalence of various mood states in the past four weeks;
• perception of health in comparison with that of other people;
• expectations of change in health.
Although there were 1,578 individuals in the sample, not all answered all the SF-36 v.2 questions completely and it was not possible to calculate the PCS and the MCS in these cases. It was only possible to calculate PCS for 1,492 individuals and MCS for 1,491 individuals.
The estimated PCS and MCS scores for males and females (and All) are shown in figure 4.1.
• In terms of the PCS, there is a small difference between males (50.4; CI 49.5 to 51.2) and females (49.5; CI 48.7 to 50.6), but both are close to the population “norm” of 50.
• Whereas with regards to MCS the males had a higher score 52.5 (CI 51.7 to 53.2) than the population “norm” of 50, and females had a score of 49.8 (CI 49.0 to 50.6). These results suggest better mental wellbeing for males.
Figure 4.1: Physical and Mental Component Summary Scores, by sex
0.0
10.0
20.0
30.0
40.0
50.0
60.0
Perc
ent
Physical 50.4 49.5 49.9
Mental 52.5 49.8 51.1
Males Females Persons
Physical Component Summary Score, by age group and sex
• In general, although declining slowly throughout adulthood, physical capacity scores are above the norm of 50, for both genders until their mid-50s (figure 4.2).

16 | P a g e Herefordshire Health and Well‐being Survey 2011 Report
• From 55-59 onwards male PCS is below the norm and from 60-64 onwards female PCS is below the norm. However, male PCS is higher than female PCS for the young retired age group, 65-69 and 70-74 (figure 4.2).
Figure 4.2: Physical Component Summary Score, by age group and
sex
Mental Component Summary Score, by age group and sex
• The male MCS is consistently higher than the female for all age groups. The pattern of change with age is the same for both sexes; relatively constant until late middle age (55-59) then increasing in early old age to a peak at 75-79 before falling rapidly in extreme old age (figure 4.3).
• The average MCS scores for younger females show some peaks and troughs – these may be due to sampling errors.
Figure 4.3: Mental Component Summary Score, by age group and
sex

17 | P a g e Herefordshire Health and Well‐being Survey 2011 Report
The rest of this section presents a summary of the answers to the questions underlying the calculation of the PCS and MCS scores. The results for each of the 36 SF36v2 questions are based on the data for all who answered each question, not just those who answered all 36 questions. When adults were asked about their health;
• over half of them (53%) classified their health as “very good” or “excellent”, and
• nearly three-quarters (73%) thought that there had been no change in their health over the previous twelve months (figure 4.4).
Figure 4.4: Self reported current health status and change in previous 12 months
When asked whether health problems limited their ability to undertake a range of ten normal daily activities involving walking, climbing stairs or carrying;
• The majority of adults were able to carry out moderate activities (such as
hoovering, playing golf), to lift and carry groceries, to walk a mile, to climb several flights of stairs and to bathe and dress themselves.
• Just over half (46%) were able to undertake vigorous activities such as running, lifting heavy objects or partaking in strenuous sports.
• Almost a quarter of adults were prevented to some extent from undertaking even moderate activity.
• 12% were limited in their ability to bathe and dress themselves.
The full set of results is shown in figure 4.5.
18 | P a g e Herefordshire Health and Well‐being Survey 2011 Report
Figure 4.5: Extent to which health limit activities in a typical day
When asked about the amount of the time in the past four weeks in which physical health had interfered with work or regular daily activities, the options for responding ranged from “All of the time” to “None of the time”;
• 9-12% indicated that they faced limitations all or most of the time in the amount of time spent on work/activities, in what they could accomplish, in the kind of work undertaken or in actually performing the work/activities.
• The majority were not limited at all in the amount of time spent on work or
other activities (73%), or in accomplishing what they would like (65%), or in the kind of work undertaken (70%) and 70% had no difficulty in performing work or other activities.
In Figure 4.6 the full set of results on the amount of time physical health problems had interfered with normal work or daily activities.

19 | P a g e Herefordshire Health and Well‐being Survey 2011 Report
Figure 4.6: Amount of time in the previous four weeks that there were problems with work or regular daily activities as a result of physical health
When asked about the amount of the time in the past four weeks in which emotional problems, such as depression or anxiety, had interfered with work or regular daily activities, the options for responding ranged from “All of the time” to “None of the time”;
• Well over three-quarters of adults indicated that emotional problems did not interfere with the amount of time they spent on work or other activities (82%), or with what they accomplished (77%) or with the care they took over their work and other activities (81%).
• 4%-7% indicated that they faced limitations all or most of the time in the amount of time spent on work/activities (5%), in what they could accomplish (7%), or in how carefully they did their work(4%).
The full set of results is shown in figure 4.7.
20 | P a g e Herefordshire Health and Well‐being Survey 2011 Report
Figure 4.7: Amount of time in previous four weeks that emotional problems interfered with work or usual activities
When asked how much body pain you had in past four weeks and how much it interfered with normal work:
• 75% reported having experienced no more than mild bodily pain in the past four weeks
• 61% agreed that bodily pain had not interfered with their normal work or other activities.
The full set of results is shown in figure 4.8.
Figure 4.8: Experience of bodily pain in previous 4 weeks and extent to which pain interfered with normal work (both inside and outside the

21 | P a g e Herefordshire Health and Well‐being Survey 2011 Report
home)
On a question of physical health or emotional problems interfering with normal social activities;
• over two-thirds of the adults had not experienced sufficient physical health or emotional problems to cause interference with normal social activities in the previous four weeks.
• 4 % reported that social life was interfered with all the time.
The full set of results is shown in figure 4.9.
Figure 4.9: Extent to which physical health or emotional problems interfered with normal social activities
Respondents were asked a series of nine questions relating to their moods in the past four weeks;

22 | P a g e Herefordshire Health and Well‐being Survey 2011 Report
• Over half (59%) felt ‘full of life’ all or most of the time but 8% did not feel ‘full of life’ at all. Energy wise,
• 50% had ‘a lot of energy’ all or most of the time, but 11% did not feel this way any of the time.
• Some people (3%) had not been happy any of the time; at the other end of the spectrum 70% had been happy at least most, if not all, of the time.
• Over half (60%) had felt ‘calm and peaceful’ most or all of the time, but 5% reported they had not felt like this any of the time.
• 3% had felt ‘very nervous’ all or most of the time but 62% had not felt ‘very nervous’ any of the time.
• Feeling ‘downhearted and low’ had afflicted 7% of individuals all or most of the time. Just under half (46%) had not felt this way any of the time.
• 4% had been ‘so down in the dumps that nothing could cheer you up’ either all or most of the time but 68% had not experienced this mood at all.
• Feeling ‘tired’ or ‘worn’ out was not uncommon. 13% said they felt ‘worn out’ all or most of the time and 19% had been ‘tired’ for all or most of the time.
The full set of results, including proportions and bar charts, is shown in figure 4.10.
Figure 4.10: Mood state in the past four weeks

23 | P a g e Herefordshire Health and Well‐being Survey 2011 Report
The last four questions of the SF-36 v.2 related to the respondent’s individual self-assessment of their health in comparison with anybody they knew, whether they agreed their health was excellent and their expectations of worsening health. The results are detailed in Table 4.2 and summarised graphically in figure 4.11.
• The majority disagreed with the statement that they got ill more easily than other people
• 68% thought that it was true to say that they were as healthy as anybody they knew.
• Almost 70% thought it was definitely or mostly true to say that their health was excellent.
• Nearly a quarter thought their health would decline in the future.
Table 4.2: Assessment of current health compared with others and expectations of change
Statement Definitely True
Mostly True
Don’t Know
Mostly False
Definitely False
I seem to get ill more easily than other people 2% 5% 12% 19% 62%
I am as healthy as anybody I know 32% 36% 17% 7% 8%
I expect my health to get worse 8% 14% 38% 12% 28%
My health is excellent 22% 47% 10% 10% 11%
Figure 4.11: Self‐assessment of health (percentage of adults)

24 | P a g e Herefordshire Health and Well‐being Survey 2011 Report
4.3 ILLNESSES AND OTHER CONDITIONS The questionnaire asked respondents a series of questions about whether they had ever been treated for, or were currently receiving treatment for, a variety of specific diseases and conditions.
Heart conditions and high blood pressure
• Around 20% of adults reported currently being treated for high blood pressure: 18% of men and 20% of women (figure 4.12).
• 8% of adults reported being currently treated for a heart condition (excluding high blood pressure; 10.1% of men and 6.6% of women (figure 4.12).
• 3% of adults reported ever having been treated for a heart attack.
• 3% of adults reported currently being treated for angina, 1% for heart failure, and 4% for any other form of heart condition.
Figure 4.12: Percentage of adults who reported being treated for a heart condition,
and high blood pressure, by sex
0.0
5.0
10.0
15.0
20.0
25.0
30.0
Perc
ent
Blood pressure 18.0 21.1 19.6
Heart condition 10.1 6.6 8.4
Males Females Persons
Respiratory illnesses
• Around 11% of adults reported currently being treated for any form of respiratory illness.
• 8% of adults reported currently being treated for asthma.

25 | P a g e Herefordshire Health and Well‐being Survey 2011 Report
• 2% of adults reported currently being treated for either emphysema or bronchitis and 3% for any other form of respiratory illness.
Mental illnesses
• Overall around 8% of adults reported currently being treated for any form of mental illness.
• Women were significantly more likely to be receiving treatment for a mental illness – 10.6% compared to 5.9% of men (figure 4.13)
• 6% of adults reported currently being treated for depression and 5% for anxiety.
Figure 4.13: Percentage of adults who reported being treated for a mental illness, by sex
0.0
2.0
4.0
6.0
8.0
10.0
12.0
14.0
Perc
ent
% Prevalence 5.9 10.6 8.3
Males Females Persons
Limiting long-term illness
Limiting long-term illness is defined as a health problem or disability which limits daily activities or work (including problems arising from old age).
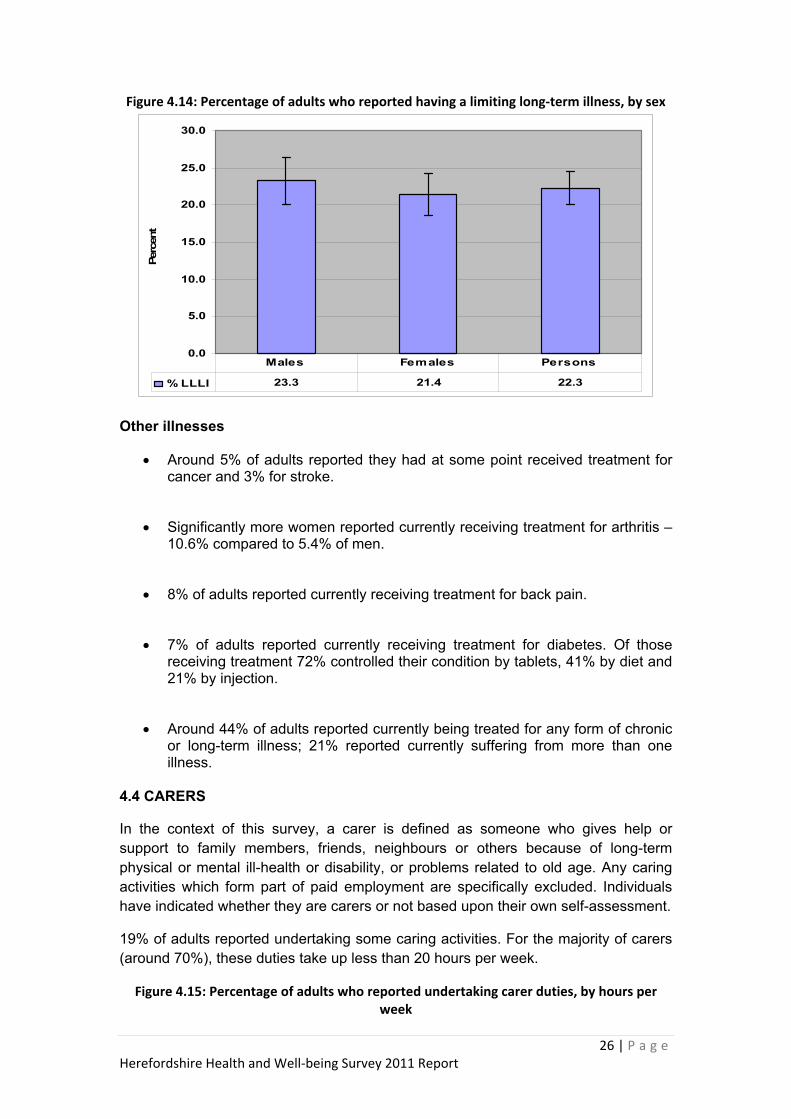
• Between a fifth and a quarter of adults reported having a limiting long-term illness with no significant variation by sex (figure 4.14).
• Adults who reported having a limiting long-term illness were asked to specify the type of illness which was the main cause of their limitation. By far the most common form of illness specified was musculoskeletal problems (49% of those with a limiting long-term illness), followed by nervous system disorders (9%) and heart and circulatory system diseases (8%).
26 | P a g e Herefordshire Health and Well‐being Survey 2011 Report
Figure 4.14: Percentage of adults who reported having a limiting long‐term illness, by sex
0.0
5.0
10.0
15.0
20.0
25.0
30.0
Perc
ent
% LLLI 23.3 21.4 22.3
Males Females Persons
Other illnesses
• Around 5% of adults reported they had at some point received treatment for cancer and 3% for stroke.
• Significantly more women reported currently receiving treatment for arthritis – 10.6% compared to 5.4% of men.
• 8% of adults reported currently receiving treatment for back pain.
• 7% of adults reported currently receiving treatment for diabetes. Of those receiving treatment 72% controlled their condition by tablets, 41% by diet and 21% by injection.
• Around 44% of adults reported currently being treated for any form of chronic or long-term illness; 21% reported currently suffering from more than one illness.
4.4 CARERS
In the context of this survey, a carer is defined as someone who gives help or support to family members, friends, neighbours or others because of long-term physical or mental ill-health or disability, or problems related to old age. Any caring activities which form part of paid employment are specifically excluded. Individuals have indicated whether they are carers or not based upon their own self-assessment.
19% of adults reported undertaking some caring activities. For the majority of carers (around 70%), these duties take up less than 20 hours per week.
Figure 4.15: Percentage of adults who reported undertaking carer duties, by hours per week

27 | P a g e Herefordshire Health and Well‐being Survey 2011 Report
4%2%
81%
13%
None
1-19 hours
20-49hours
50+ hours

28 | P a g e Herefordshire Health and Well‐being Survey 2011 Report
5. HEALTH-RELATED LIFESTYLE
5.1 INTRODUCTION
This chapter focuses on the reported health-related lifestyles of adults.
The survey asked adults (aged 16 years and over) about their lifestyle, including questions about their exposure to other people’s tobacco smoke. In addition, respondents were asked to provide their height and weight.
5.2 SUMMARY
• Over 1 in 5 adults reported that they currently smoke.
• Almost a quarter of adult non-smokers reported being regularly exposed to other people’s tobacco smoke indoors or outdoors.
• Around 2 in 5 adults reported drinking above the recommended guidelines on at least one day in the past week, including around a fifth who reported binge drinking.
• 36% of adults reported eating the recommended five or more portions of fruit and vegetables on the previous day.
• Around 1 in 3 adults reported meeting the guidelines for physical activity in the past week.
• Around 55% of adults were classified as overweight or obese, including 1 in 5 adults classified as obese. 23% of women were classified as obese compared with 18% of men.
• In general, men were significantly more likely to smoke and to drink alcohol at above guideline levels and were significantly more likely to be either overweight or obese. Yet they were also significantly more likely to meet physical activity guidelines.
5.3 SMOKING
The questionnaire included a section on past and present smoking habits and exposure to smoke from others (passive smoking). Smokers were asked where they smoked, whether they had tried to give up and whether their smoking habits had changed in the past 12 months. Smokers were also asked if they wanted to give up and their reasons for doing so.
Smoking status
• 21% of adults reported that they currently smoked (figure 5.1).

29 | P a g e Herefordshire Health and Well‐being Survey 2011 Report
• 17% of adults smoke on a daily basis.
• 29% of adults reported that they had given up smoking, and 61% of current smokers reported that they would like to quit.
Figure 5.1: Self‐reported smoking status of adults
Daily smoker17%
Occasional smoker
4%
Never smoked
50%
Ex-occasional smoker
14%
Ex-daily smoker
15%
Smoking by sex
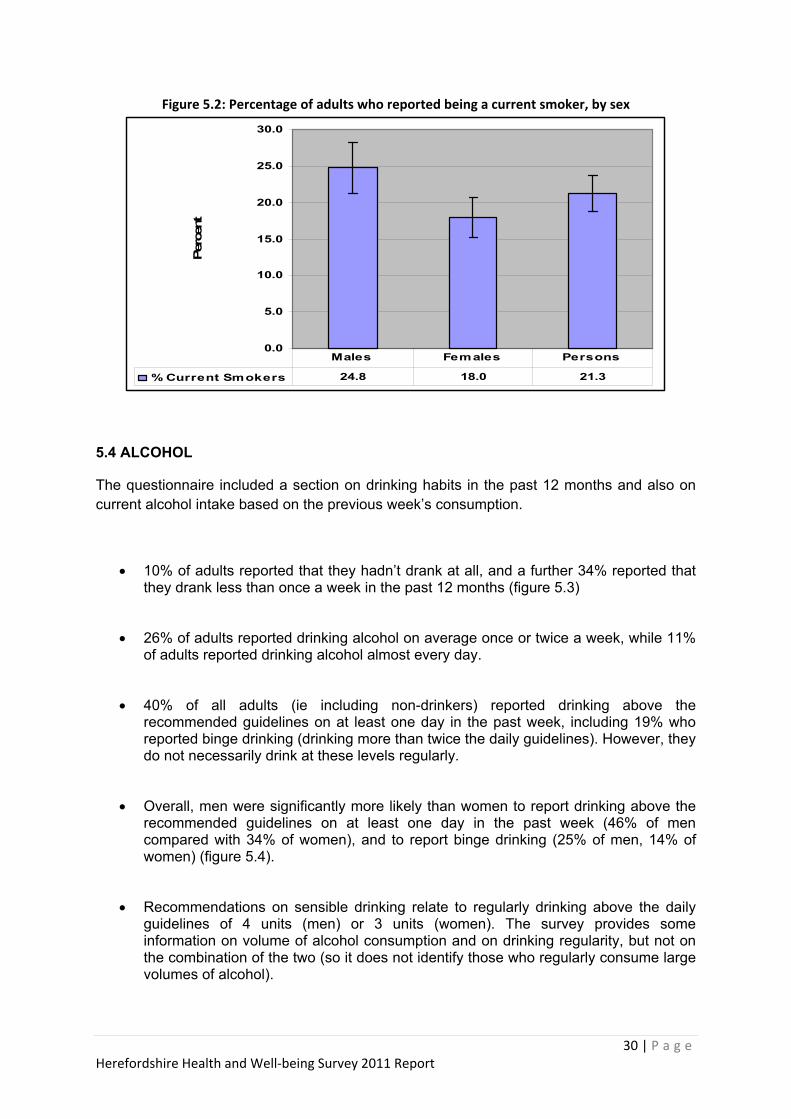
• Overall a significantly higher proportion of men were smokers compared with women (figure 5.2).
Where people smoke
• Overall, 72% of smokers reported smoking indoors in the past week, 95% outdoors.
Giving up smoking
• 61% of smokers reported that they would like to give up smoking.
• 31% of smokers had tried to give up in the last year.
Exposure to other people’s smoke
• Overall, 14% of adult non-smokers reported being regularly exposed to other people’s tobacco smoke indoors, and 24% indoors or outdoors.
30 | P a g e Herefordshire Health and Well‐being Survey 2011 Report
Figure 5.2: Percentage of adults who reported being a current smoker, by sex
0.0
5.0
10.0
15.0
20.0
25.0
30.0
Perc
ent
% Current Smokers 24.8 18.0 21.3
Males Females Persons
5.4 ALCOHOL
The questionnaire included a section on drinking habits in the past 12 months and also on current alcohol intake based on the previous week’s consumption.
• 10% of adults reported that they hadn’t drank at all, and a further 34% reported that they drank less than once a week in the past 12 months (figure 5.3)
• 26% of adults reported drinking alcohol on average once or twice a week, while 11% of adults reported drinking alcohol almost every day.
• 40% of all adults (ie including non-drinkers) reported drinking above the recommended guidelines on at least one day in the past week, including 19% who reported binge drinking (drinking more than twice the daily guidelines). However, they do not necessarily drink at these levels regularly.
• Overall, men were significantly more likely than women to report drinking above the recommended guidelines on at least one day in the past week (46% of men compared with 34% of women), and to report binge drinking (25% of men, 14% of women) (figure 5.4).
• Recommendations on sensible drinking relate to regularly drinking above the daily guidelines of 4 units (men) or 3 units (women). The survey provides some information on volume of alcohol consumption and on drinking regularity, but not on the combination of the two (so it does not identify those who regularly consume large volumes of alcohol).

31 | P a g e Herefordshire Health and Well‐being Survey 2011 Report
Figure 5.3: Adults’ reported average frequency of drinking alcohol
0
5
10
15
20
25
30
Almostevery day
Five or sixdays aweek
Three orfour daysa week
Once ortwice aweek
Once ortwice amonth
Onceevery
couple ofmonths
Once ortwice a
year
Never
Per
cent
Figure 5.4: Percentage of adults who reported drinking above guidelines and binge
drinking on at least one day in the past week, by sex
0.0
10.0
20.0
30.0
40.0
50.0
60.0
Perc
ent
% above guidelines 46.3 34.2 40.1
% binge 25.4 13.8 19.4
Males Females Persons
5.5 FRUIT AND VEGETABLE CONSUMPTION
The questionnaire included a short section on fruit and vegetable consumption for the previous day.
• 36% of adults reported eating five or more portions of fruit and vegetables the previous day.
• 64% of adults reported consuming less than five portions of fruit or vegetables on the previous day and 6% consumed no fruit or vegetables at all.

32 | P a g e Herefordshire Health and Well‐being Survey 2011 Report
5.6 EXERCISE
The questionnaire asked a series of questions regarding the frequency and intensity of exercise performed in the previous week.
• 34% of adults reported meeting the guidelines for physical activity, ie at least 30 minutes of at least moderate intensity physical activity on five or more days a week (figure 5.6).
• Overall, a significantly higher proportion of men (43%) than women (25%) met the guidelines.
• Almost 3 in 10 adults had not met physical activity guidelines on any day in the past week.
• Some adults (9%) reported that they had done no exercise or physical activity in the past week, and a further 19% had done no more than light activity.
Figure 5.6: Percentage of adults who reported meeting physical activity guidelines during the past week, by sex
0.0
10.0
20.0
30.0
40.0
50.0
Perc
ent
% RecommendedExercise
42.6 24.9 33.5
Males Females Persons
5.7 BODY MASS INDEX
The questionnaire asked respondents for their height and weight. From this data a body mass index (BMI10) was calculated. The BMI is calculated as weight (kg) divided by squared height (m2). BMI was calculated for all respondents, excluding pregnant women and those who did not answer.
10 See Appendix A for definition of BMI.

33 | P a g e Herefordshire Health and Well‐being Survey 2011 Report
• In total, 54% of adults were classified as overweight or obese (a BMI of 25 to under 30), including 20% of adults classified as obese (a BMI of 30 and over) (figure 5.7).
Figure 5.7: Body Mass Index category of adults
Healthy weight
44%
Underweight2%
Overweight34%
Obese20%
• Men were significantly more likely to be overweight than women. However, women were more likely to be obese (figure 5.8).
Figure 5.8: Percentage of adults who were overweight and obese, by sex
0.0
10.0
20.0
30.0
40.0
50.0
Perc
ent
% overweight 42.0 26.9 34.4
% obese 17.5 22.6 20.1
Males Females Persons
34 | P a g e Herefordshire Health and Well‐being Survey 2011 Report
6. HEALTH SERVICE USE
6.1 INTRODUCTION
The questionnaire asked participants a series of questions about their uptake in the past 2 weeks of a range of primary care health services, the use made of hospital and other services (e.g. dentistry) in the past 12 months, and about consumption of medicines in the past 4 weeks.
6.2 SUMMARY
• 15% of adults reported that they had talked to a GP - and 9% to a practice nurse - about their own health in the past two weeks.
• 8% of adults reported being in hospital as an inpatient in the past 12 months, 8% as a day patient, and around a quarter attended as an outpatient.
• Around 16% of adults had attended Casualty/A&E departments in the past 12 months. 4% of adults had attended hospital in the last 3 months due to an accident11.
• Women were significantly more likely to make use of the services of a pharmacist, a dentist or an optician.
• 48% of adults reported being on regular medicine prescribed by their doctor and 36% reported buying medicine (excluding prescription medicine) in the past 4 weeks.
6.3 USE OF GP SERVICES
In the past 2 weeks:
• 15% of adults reported that they had talked to a GP about their own health; a fifth of these attending more than one such appointment.
• Almost 7 in 10 of those attending a GP appointment had received a prescription.
• Almost 1 in 10 adults reported that they had talked to a practice nurse at the GP surgery about their own health; a fifth of these attending more than one such appointment.
11 Note: Includes accident, injury or poisoning needing hospital treatment or a visit to Casualty/A&E.
35 | P a g e Herefordshire Health and Well‐being Survey 2011 Report
6.4 USE OF HOSPITAL SERVICES
In the past 12 months:
• Around 27% of adults had attended the outpatient department of a hospital; 7% of these attendances had been paid for privately.
• Around 8% of adults had been admitted to hospital as a day patient; 9% of these treatments had been paid for privately.
• Around 8% of adults had been admitted to hospital as an inpatient; 5% of these stays had been paid for privately.
• Around 16% of adults had attended Casualty/A&E; almost a quarter of these attending on more than one occasion.
In the past 3 months:
• 4% of adults reported that they had attended hospital due to an accident.
• 41% of these hospital attendances were due to accidents in the home, and a further 24% due to accidents at work or in school.
6.5 USE OF OTHER SELECTED HEALTH SERVICES
In the past 12 months:
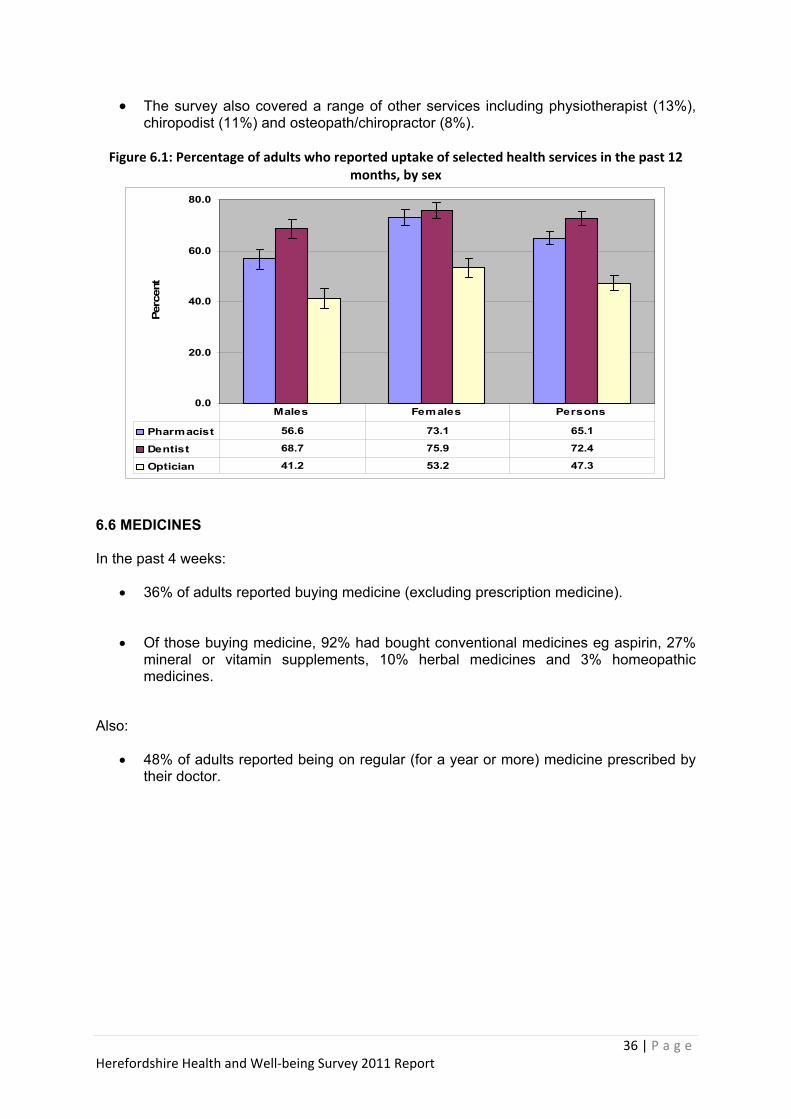
• 65% of adults reported using a pharmacist (figure 6.1).
• 72% of adults reported using a dentist.
• 47% of adults visited an optician.
• Women were significantly more likely to make use of the above services.
• 13% of adults reported using a health visitor, district or other community nurse.
• 11% and 7% of adults respectively reported using the GP out of hours and NHS Direct services.
36 | P a g e Herefordshire Health and Well‐being Survey 2011 Report
• The survey also covered a range of other services including physiotherapist (13%), chiropodist (11%) and osteopath/chiropractor (8%).
Figure 6.1: Percentage of adults who reported uptake of selected health services in the past 12
months, by sex
0.0
20.0
40.0
60.0
80.0
Perc
ent
Pharmacist 56.6 73.1 65.1
Dentist 68.7 75.9 72.4
Optician 41.2 53.2 47.3
Males Females Persons
6.6 MEDICINES In the past 4 weeks:
• 36% of adults reported buying medicine (excluding prescription medicine).
• Of those buying medicine, 92% had bought conventional medicines eg aspirin, 27% mineral or vitamin supplements, 10% herbal medicines and 3% homeopathic medicines.
Also:
• 48% of adults reported being on regular (for a year or more) medicine prescribed by their doctor.
37 | P a g e Herefordshire Health and Well‐being Survey 2011 Report
7. TECHNICAL SUMMARY
7.1 INTRODUCTION
This chapter details some of the technical information about the Survey. It draws upon a technical report produced by NatCen. The chapter includes information on sampling, fieldwork, response, data preparation, weighting and sampling errors. 7.2 SAMPLING
The Survey was carried out in two phases; the first phase ran from November 2010 until the end of March 2011. The second phase started in April and ran until the end of September 2011. The sampling procedure for each phase aimed to produce a sample of at least 600 adults aged 16 years and over who live in Herefordshire. Ideally, the sample would reflect the gender, age, and social characteristics of the population. The sample for each phase was achieved by selecting 650 households by a method known as interval sampling from the postcode address file (PAF) and approaching any resident adults for inclusion in the Survey.
For Phase 1, the first address was selected at random from the list of 78,513 addresses on the PAF. From that point in the list of addresses, about every 120th or 121st address was selected. For Phase 2, addresses that had been selected for Phase 1 were removed from the PAF list of addresses to avoid any households being sampled again. An address was then selected at random and, from that point in the list, every 199th or 120th address was selected. This ensured more representative samples - though still incorporating a random element of selection - than if a simple random sample had been picked, which could have resulted in some ‘clumping’ of addresses.
Some addresses were found to be ineligible for various reasons, and some were found to contain two households. Some households refused to take part. The following table shows the outcome of the approach to the 1300 addresses issued to field staff across both phases, and how the final number of households taking part in the Survey resulted. If there were more than three households at an address, a Kish Grid was used to randomly select three households to participate in the Survey.
Table 7.1: Household Response Addresses Issued 1300
Addresses not containing an eligible household (because dwelling was not yet built, dwelling was demolished or derelict, or vacant, or empty, or non-residential, or was a holiday home etc)
132
Addresses found to contain two or more households 9 Total number of eligible households (= 1300 -132 + 9) 1177
Unproductive households (because no contact could be made, or because there were language difficulties, or members of the household were physically or mentally unfit, or various other reasons)
41
Households refusing to participate 185 Households participating (= 1177 – 41 – 185) 943 Response Rate as a proportion of eligible sample of households 80.1%

38 | P a g e Herefordshire Health and Well‐being Survey 2011 Report
7.3 FIELDWORK
NatCen have years of experience of conducting similar surveys in Wales and used 12 of their trained social survey interviewers - some of whom had experience gained on the Welsh Health Surveys - to undertake the fieldwork. All the interviewers were CRB checked and briefed on the purpose of the Survey and given instructions on how to proceed if an interpreter was needed or they came across a household where they had concerns about the safety of a child or vulnerable adult. The field staff were managed locally and worked to performance targets aimed at achieving a high response rate.
The fieldwork period for Phase 1 was originally intended to run from October 2010 to March 2011 but the start was delayed until 8th November 2010.
The addresses were allocated to interviewers in monthly workloads and checks continually made on progress.
A few days before attempts were made to contact a household the interviewer alerted the potential respondents with a letter from the Interim Director of Public Health explaining the purpose of the Survey and giving the interviewer’s name. The letter also contained answers to frequently asked questions about the Survey and contact details of a NatCen employee for further help or information. An example letter is contained in Appendix B.
Once contact had been made with a household the interviewer conducted a short face to face interview with an adult (aged 18 years or over) and then, if the household agreed to participate, left a self-completion questionnaire, together with a sealable envelope and survey information leaflet, for each member of the household aged 16 years or above.
If the interviewer established that a language interpreter was required, the interpretation service was provided via Herefordshire Council and the questionnaire completed via a face to face interview. Translations were provided of the advance letter and information leaflet.
Interviewers were also trained to complete the questionnaire with any respondent who was unable to do so for themselves due to eyesight problems, physical impairment, literacy problems or other reasons.
The interviewer was required to establish whether any household member lacked the mental capacity to give their informed consent to participate in the Survey. Any such individuals were not asked to complete a questionnaire and were recorded as ineligible to participate in the Survey.
Participation in the Survey was entirely voluntary and confidentiality was assured. Only those who carried out the interviews and those who needed to check or process the data had access to names and addresses, and no individual outside of NatCen had such access.
Interviewers were expected to make between 6 and 9 calls to a household at different times of the day and different days of the week in order to achieve contact. If this was not achieved the address was removed from the Survey.
The questionnaires were collected by the interviewer at an agreed appointment. If no contact could be made at this stage reminders were sent by post and arrangements made for postal response. Quality checks on the fieldwork were in place.

39 | P a g e Herefordshire Health and Well‐being Survey 2011 Report
7.4 RESPONSE
The total number of eligible adults aged 16 and over identified during contacts made to households was 1,765. Thirty-three refused to participate, questionnaires were not returned from a further 106, and 48 were classified as otherwise unproductive (eg the individual was away during the survey period). This left 1,578 participants, well above the 1,200 target across both phases of the Survey. The overall response rate was 89.4% but varied between men and women, and younger and older people. The response rates for different gender / age groups are shown in table 7.2 below.
Table 7.2: Percentage response rates by age group and gender 16-24 years 25-44 years 45-64 years 65+ years All ages
Male 76.8% 81.9% 91.5% 90.8% 82.2%
Female 85.3% 87.9% 93.4% 93.7% 91.3%
All 80.9% 85.2% 92.5% 92.4% 89.4%
7.5 DATA PREPARATION
The household questionnaires were entered onto in-house computers via manual data entry. Accuracy was assured by using double entry keying, ie each form was keyed in twice, and a computer programme checked automatically for errors and omissions.
The self-completion individual questionnaires were scanned into a computer automatically by a specialist contractor. There were automatic checks for consistency and to ensure completion instructions had been followed correctly. Where individuals had written in numbers or free text manual checks were made on the accuracy of the scanning.
Measures were in place to ensure secure storage of both paper questionnaires and electronic data, and for destruction of questionnaires once they were no longer needed.
Some tick boxes and text required manual coding, e.g. turning employment information from various questions into NS-SEC code, or converting an illness into the appropriate International Classification of Diseases (ICD) group. This was undertaken by skilled data coders with experience of the Welsh Health Survey. 7.6 WEIGHTING THE SAMPLE Weighting is a technique used to adjust an achieved survey sample to reflect the population of interest (in this case people living in private households in Herefordshire) in terms of characteristics known to relate to the survey outcomes. It thereby helps to correct for distortions caused by differential non-response which might otherwise lead to biased estimates (in this case of outcomes such as the prevalence of a health condition or lifestyle factor). Usually, when a sample is used to calculate a prevalence which can then be applied to an entire population, the individuals in the sample contribute equally to the calculation of the prevalence. But if the sample is unbalanced then the prevalence rate calculated from it will be biased as the population is not fairly represented. The following very simple, hypothetical example, illustrates the point. Suppose the prevalence of a condition is 50% for over 65s and 20% for under 65s and 25% of the population are over 65 and 75% are younger. Then the overall prevalence rate is

40 | P a g e Herefordshire Health and Well‐being Survey 2011 Report
((75 x 0.2) + (25 x 0.5)) = 27.5%. But suppose we didn’t know what the prevalence was and we were using the sample to estimate it and the sample contained 40% over 65 year olds and 60% under 65 year olds. Then the estimated prevalence would be ((60 x 0.2) + (40 x 0.5)) = 32%. Therefore the prevalence rate has been over estimated because of the imbalance of age groups in the sample compared with the underlying population. In the calculation each individual in the sample made an equal contribution to the calculation irrespective of whether the individual belonged to an under- or over- represented group. To circumvent this problem, the contribution of each individual in the sample can be changed from equality. The factors used to reflect the contribution are called weights. If an individual in the sample comes from a group that is under represented, he/she is allocated a weight greater than 1 as he/she needs to reflect all the population in the group who are not in the sample. Conversely, if an individual in the sample comes from a group that is over represented, he/she is allocated a weight less than 1. In the example above, if the weights of 1.25 are applied to the under 65’s and 0.625 to the over 65’s, then the calculation of the prevalence becomes ((1.25 x 60 x 0.2) + (0.625 x 40 x 0.5)) = 27.5% - the unbiased estimate. The method for calculating the weights to correct for the imbalance in the age distribution is to divide the proportion of the underlying population in a particular age group by the proportion of the sample in the same age group. 25% of the underlying population were over 65 years but only 40% of the sample population. The weight is calculated as 25/40 = 0.625. Similarly, 75% of the underlying population were under 65 years but only 60% of the sample. Therefore the weight is calculated as 75/60 = 1.25. The weights used are the inverse of the probability of response. In terms of health and well-being, the prevalence of a particular disease or lifestyle may be related to demographic characteristics such as age, gender, socio-economic status, type of dwelling or area of residence. For example, the incidence of dementia is age-related. There are two main reasons why a sample may be imbalanced in terms of the demographic characteristics of the underlying population. Firstly, the methodology by which individuals are chosen to take part in the Survey may result in a sample that generates results which may not reflect the whole population. Secondly, participation in a Survey is usually entirely voluntary and selected individuals may choose not to take part. Different groups within the population have varying propensities to co-operate, linked with their gender, age, or social class. For the Herefordshire Health & Well-being Survey, NatCen devised a sampling methodology to generate, as far as is possible, a representative sample and field staff encouraged selected individuals to participate. NatCen examined the issue of differential non-response between socio-demographic sub-sections of the sample and underlying population. Using an advanced statistical technique called weighted logistic regression (which requires a specialist computer package) NatCen calculated the probability that an individual from a particular socio-demographic group would return a questionnaire. NatCen were able to achieve this through the collection of a limited amount of data on all household members from responding households. This information included gender, age, number of years resident at an address, general health, and whether they needed care for reasons of sickness or disability. The interviewer also asked the household reference person for their ethnicity and about their current or last job to enable the NS-SEC to be established. NatCen were then able to classify the household into one of 7 types as shown in the following table:

41 | P a g e Herefordshire Health and Well‐being Survey 2011 Report
Household Types Type Composition One adult Person aged 16-59, no children Two adult Two persons aged 16-59, no children Large adult Three or more persons aged 16-59, no children Small family Either one or two adults and one or two children
Large family Either 1 or more adults and 3 or more children, OR 3 or more adults and 2 or more children
Older adult couple Two adults aged 60 or over, no children Older single adult One adult aged 60 or over, no children
The analysis resulting from applying weighted logistic regression indicated the following: • Women were more likely to respond than men, 91.3% compared with 87.2%. • Older people were more likely to respond than younger people, 92.4% of those aged 65+
years compared with 80.9% of 16-24 year olds. • Managers and professionals were more likely to respond than other NS-SEC groups.
People who had never worked, the unemployed and students were less likely to respond, • People with less than good general health were more likely to respond than those with
good general health, • People in families were more likely to respond than individuals living in households where
there were no children. NatCen then calibrated the weights from the non-response model to correct for imbalance in terms of gender and age between the sample population and the underlying population. The underlying population numbers were based on the latest available mid-year estimates from the Office for National Statistics (ONS). These were June 2010 estimates which fell before the sampling period of November 2010 to September 2011. The 2010 population figures were adjusted by the Herefordshire Council Research Team to extract the population not living in private households, ie people living in care homes or other institutions. The calibration weighting ensured that the weighted sample came to the same total as the number of individuals in the sample, 1,578. Within the Survey sample, all the individual non-response rates and calibration weights were less than 2 and the highest combined weight was 2.97. This is generally considered evidence of good sample design and field work - were there a high proportion of individuals in the sample with associated weights greater than 4, then it would be prudent to re-examine the sample design and effectiveness of the field work. It should be noted, however, that high weights could still emerge from good quality survey designs.
7.7 SAMPLING ERRORS
When a survey is carried out, various sources of error can affect the ultimate results.
Data coding errors were minimised by techniques discussed in section 7.5.
The major source of error is sampling error which is the difference between the estimate of a factor (such as average age or prevalence of a disease) derived from a random sample, and the factor value that is true for the population as a whole. The larger the random sample, the more likely it is that the factor value calculated from the sample population will be nearer that for the population as a whole. There is a statistical technique to calculate the sampling error, called the standard error or se(p), for the estimated prevalence of a factor. The standard error measures the precision with which the estimates from the sample approximate to the true population values. This is calculated using the equation:

42 | P a g e Herefordshire Health and Well‐being Survey 2011 Report
Se(p) = √(p(100-p)/n) where p is a percentage and n is the size of the sample. So if 22% of a sample of 550 people smoke, the standard error is calculated as: √(22(100-22)/550) = 1.77% In Herefordshire Health & Well-being Survey, the sample is not a simple random sample. Although the initial address was selected randomly and interval sampling used to ensure households were not geographically clustered together, there will be links between individuals within the same household included within the sample. They are likely to be similar in age and lifestyle behaviours, such as eating habits and smoking behaviour. Consequently there is a risk of increasing in the sampling error. The way the individuals in the sample are weighted also affects the standard error. Taken together, the household clustering effect and the weighting effect are known as the ‘design effect’, or DEFT which is the number by which the standard error has to be multiplied to derive the “true” standard error. Confidence Intervals
As there is a standard error associated with each proportion calculated from the sample, a confidence interval can be calculated around the survey estimate. The confidence interval is the range within which the true value for the proportion is likely to fall. The confidence intervals presented in this report have been calculated using two closely related formulae which, where tested with these data, have yielded similar results.
In general, the following standard error is used to calculate the confidence interval through the following formula:
Confidence interval = p +/- 1.96 x DEFT x se(p)
Where p = the estimated proportion, DEFT = the design effect, se(p) = standard error Using the above example and supposing the DEFT = 1.06, then the 95% confidence interval for the proportion of people who smoke is 22% +/- 1.96 x 1.06 x 1.77% = 18.3% to 25.7% The DEFTs, true standard errors and 95% confidence intervals were calculated for many key variables by NatCen and have been published in the Technical Report. The largest DEFT, 1.26, was applied to the confidence intervals for the estimate of current smokers. The lowest DEFTs (nearer 1.0), are associated with prevalence of disease where incidence is unlikely to be influenced by others in the home.
Where NatCen did not provide a calculation of the confidence interval, the Wilson Score method was used to calculate the range of likely true prevalence. This algorithm is widely used in medical statistics and gives a more accurate result for small samples than the standard calculation. For large samples the Wilson Score Method converges to the standard formula. Software to calculate Wilson confidence intervals was available in-house. Where the formula could be tested on survey data the results were almost identical as the sample is large, but any figure given an associated Wilson confidence interval does not have an associated DEFT applied to the confidence interval.

43 | P a g e Herefordshire Health and Well‐being Survey 2011 Report
APPENDIX A: GLOSSARY This glossary explains terms used in the report, other than those fully described in particular chapters. Adults Adults are defined as persons aged 16 years or over. Adult Body Mass Index (BMI) classification The Body Mass Index (BMI) is calculated as weight (kg) divided by squared height (m2). BMI was calculated for all respondents, excluding pregnant women and those who didn’t answer. The proportion of adults who were overweight and obese was calculated according to the UK national BMI percentiles classification below. Underweight (BMI <18.5) Healthy weight (BMI 18.5 - <25) Overweight (BMI 25 - <30) Obese (BMI 30 and over) Morbidly obese (BMI 40 and over) Alcohol Consumption Definitions of above guidelines alcohol consumption are as follows:
Household A household is defined as a person or group of people for whom the accommodation is the only or main residence, and who either share at least one meal a day or share the living accommodation. Household Reference Person (HRP) The Household Reference Person (HRP) is the householder (person in whose name the property is owned or rented) with the highest income. If there is more than one householder and they have the same income, the eldest is taken as the Household Reference Person. International Classification of Diseases (ICD) A classification system for coding diseases and health problems used internationally and maintained by the World Health Organization (WHO). The Survey makes limited use of groups approximating to ICD chapter headings when covering chronic and long-term limiting illness. The groups used are shown below (along with selected examples of diseases for illustrative purposes). Further information is available at the WHO website1.

44 | P a g e Herefordshire Health and Well‐being Survey 2011 Report
NS-SEC (National Statistics Socio-Economic Classification) The National Statistics Socio-Economic Classification (NS-SEC) is an occupationally based classification of social position that was introduced in 2001 for use in official statistics and surveys. There are fourteen operational categories representing different groups of occupations and a further three residual categories for full time students and occupations that cannot be classified due to lack of information or other reasons. The main groups are:
• Managerial and professional, • Intermediate occupations, small employers and own account workers • Lower supervisory and technical occupations • Semi-routine and routine occupations • Never worked / unemployed / students / not classified
Full details of NS-SEC are in the Office for National Statistics guide ‘The National Statistics Socio-Economic Classification User Manual’2
REFERENCES AND NOTES 1. World Health Organisation: International Classification of Diseases. www.who.int/classifications/icd/en/ 2. ONS: National Statistics Socio-Economic Classification. www.ons.gov.uk
45 | P a g e Herefordshire Health and Well‐being Survey 2011 Report
APPENDIX B: Quality Assurance Steps for Health and Well-being Survey
Objective Method QA Standard Person Signing Off
Action if QA Standard not met
Verify all the data has been received
Count the number of cases in the spread sheet equates number stated by NatCen in Technical Report
All cases should be present Ok - IG Contact NatCen – Is there an error in the technical report? Is the received database complete?
Check that all the expected variables have been received by looking at columns in the database compared with the variable list
All variables should be present.
OK -IG Report missing data to NatCen
Verify the weighting is not leading to biased results
1. Produce a frequency distribution in SPSS of the two sets of weights and the combined weights.
All weights should be less than 4.0
Greatest combined weight = 2.92 IG
Go to step 2
2. For individuals with weights > 4.0, look at the characteristics. 3. For any unusual characteristic, compare weighted and unweighted prevalence rate. Eg 20 year old who has had a stroke, very elderly person doing vigorous exercise on a daily basis
Heavily weighted individuals should not be biasing the results.
Not applicable
Discuss with NatCen. If not happy about a weight. If one is changed, all would need to be recalculated to compensate and ensure age / sex distribution was same as underlying private household populations.
Verify the statistical methodology used in the technical report is appropriate.
Sampling Interval sampling used with random starting point. Methodology for households in multiple occupation appropriate.
OK - IG Discuss with NatCen
Fieldwork Carried out as per tender OK - IG Discuss with NatCen

46 | P a g e Herefordshire Health and Well‐being Survey 2011 Report
Objective Method QA Standard Person Signing Off
Action if QA Standard not met
Verify the statistical methodology used in the technical report is appropriate. – cont.
Response Rate >70% or falling off significantly from previous surveys
>80%, ( IG)
Discuss with NatCen for reasons and recommended next steps
Check that the differences between health and care needs of responders and non-responders is not significant
Chi-Square 5% significance
No significant differences (IG)
If it is significant – check that variable is included in the non-response model. If it is not discuss with NatCen
Check variables included in non-response model
Variables for inclusion in the model should represent characteristics of individuals traditionally associated with differential response.
Accepted (IG)
Discuss with NatCen
Check parameters associated with variables in non-response model
Parameters should be in the right direction, ie reflect what is known about non-response. No one parameter should be >10.0
All looks plausible (IG)
Discuss with NatCen impact on results
Check calibration weightings lead to accurate age / sex marginal distributions of private household population – particularly if new population estimates have become available
If different test effect on one or two variables known to be related to age / gender – should be < 0.2% points difference
A problem was identified some weighted age / gender distributions did not add up to sample total. Discussed with NatCen and agreed that there would be no impact on data. Calibration weightings OK IG
Discuss with NatCen if recalibration necessary
Examine DEFTs – not very important as these affect confidence intervals rather than the estimated values.
Look for DEFTs <0.9, and therefore narrowing confidence intervals
Lowest DEFT is 0.97 (IG)
Will this impact on conclusions? Is it plausible? May prefer to increase to 1.0 to be on the safe side.

47 | P a g e Herefordshire Health and Well‐being Survey 2011 Report
Objective Method QA Standard Person Signing Off Action if QA Standard not met
Check data – original variables
Run frequency distributions on all original variables
eg maximum alcohol consumption at a level that should have resulted in death!
All OK (IG)
Discuss with PCT and, if necessary, NatCen about what should be done with individual. Options are – remove from survey, change weighting, live with it, or apply survey average or other value. Note what change is made.
Check data – derived variables
Check derived variables calculated correctly
Syntax correct and correctly applied ALL OK (IG) Report back to NatCen
Run frequency distribution on derived variables
No anomalous individuals / data Eg implausible BMI
ALL OK (IG)
Discuss with PCT and, if necessary, NatCen about what should be done with individual. Options are – remove from survey, change weighting, live with it, or apply survey average or other value. Note what change is made.
Check Tabular Report
SPSS frequencies / crosstabs on each variable in Tabular Report
Result in Tabular Report can be replicated
Minor errors found in Tabular Report. Discussed with NatCen and Tabular Report amended.
Report back to NatCen if error suspected
Check Phase 2 Tabular Report with Phase I
Phase 2 prevalences should be within confidence limits of Phase I
All within CIs (IG)
Consider why difference may occur. It may be due to seasonal or other factors and be genuine. If concerned, discuss with NatCen.
Check Tabular Report and Technical Report are consistent
For prevalences in Technical Report, check values are same as in the Tabular Report
Figures in Tabular Report should be same as in Technical report, rounded to nearest whole number
One difference found and reported to NatCen. Tabular report was amended. (IG)
Triangulate with SPSS result – bring any differences to NatCen’s attention.

48 | P a g e Herefordshire Health and Well‐being Survey 2011 Report
Objective Method QA Standard Person Signing Off
Action if QA Standard not met
Benchmarking
Check results against other known data captured using similar methodology
Eg previous surveys asking same question. Welsh Health Survey
All results consistent with WHS (IG)
If new data is plausible accept. If not plausible refer to Steering Group for decision
1. Check results against other known data captured using similar methodology
Should be reconcilable Go to step 2.
2. Investigate whether differences are due to data collection timing, methodology of collecting data, survey questions, reasons other data was collected, likely biases, differences in population from who data was collected.
Differences can be explained
Use HWB survey data with caution and treat with circumspection until further research can verify result.
Final Report
Check tables consistent with NatCen tabular report Consistent values IG/PS Correct Final Report and
repeat checking
Check graphs in final report Graphs match tables DH/AM Correct and repeat checking Titles are appropriate DH/AM
Ensure narrative is clear relevant, well written and correct
Proof Read by different individuals including people not involved in writing report
LL/JB/AM Correct and repeat proof reading
LL/JB/AM LL/JB/AM LL/JB/AM

49 | P a g e Herefordshire Health and Well‐being Survey 2011 Report
APPENDIX C: HEALTH AND WELL-BEING QUESTIONNAIRE

Questionnaire to be filled in by:
This page to be removed by the interviewer when collectingthe questionnaire. If you are returning the questionnaire by
post, please remove this sheet before sending.
Herefordshire H S Questionnaire-Oct 2010-9th proof_Adult-English 7/11 19/10/2010 13:25 Page 1

Herefordshire H S Questionnaire-Oct 2010-9th proof_Adult-English 7/11 19/10/2010 13:25 Page 2

Serial NumberHhold Number CKL Person Number
Date of placementDay Month Year
Interviewer I.D. NumberVersion
CONFIDENTIAL
HEREFORDSHIRE HEALTH & WELL-BEING SURVEY
QUESTIONNAIRE
About the surveySome questions you may have about this survey are answered in theaccompanying leaflet. Should you have any further queries or if you needhelp to understand this document, or would like it in another format orlanguage, please contact:Katharine Sadler on 0207 549 7102, or email [email protected] Alternatively, you may write to her at the address given in the leaflet.
1
P3047
To be collected on:
1
2001-006 2007 2010 2008-009
2019-024 2025
2038
1
Card 02
2011-012
2013-018
Male2
Female
2039-41
Age
Chairman: Mrs Joanna Newton MA (Cantab) Chief Executive: Mr Chris Bull
Herefordshire H S Questionnaire-Oct 2010-9th proof_Adult-English 7/11 19/10/2010 13:25 Page 1

The questionnaire should be completed by the person named on the front page.
Most questions can be answered by simply ticking the box alongside the answer that applies to you.
You are sometimes told to skip over some questions in this survey. When this happens, youwill see an arrow (➔) with a note that tells you what question to answer next, like this:
Example questions (please do not fill in)
E1 Do you live in a house or a flat?
Tick one only
A house ➔ Go to E2
A flat ➔ Go to E3
E2 How many bedrooms are there in your house?
Please write in
bedrooms
E3 Do you own any of the following forms of transport?
Tick one box on each rowYes No
Car
Bicycle
Don’t worry if you make a mistake; simply cross out the mistake and tick the correct box.
When you have completed it, please return the questionnaire to the interviewer (or in the envelope provided if sent to you in the post).
2
2
HOW TO COMPLETE THIS QUESTIONNAIRE
Herefordshire H S Questionnaire-Oct 2010-9th proof_Adult-English 7/11 19/10/2010 13:25 Page 2
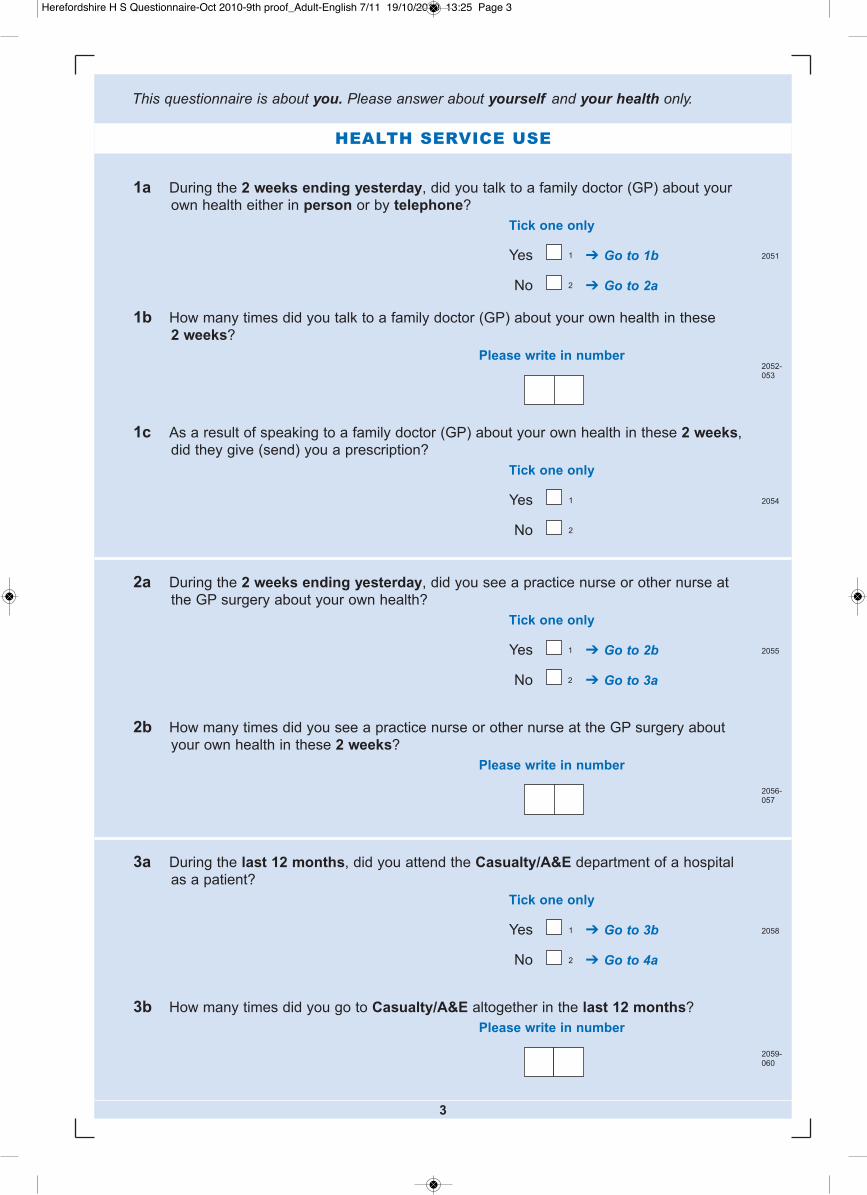
HEALTH SERVICE USE
1a During the 2 weeks ending yesterday, did you talk to a family doctor (GP) about yourown health either in person or by telephone?
Tick one only
Yes ➔ Go to 1b
No ➔ Go to 2a
1b How many times did you talk to a family doctor (GP) about your own health in these 2 weeks?
Please write in number
1c As a result of speaking to a family doctor (GP) about your own health in these 2 weeks,did they give (send) you a prescription?
Tick one only
Yes
No
2a During the 2 weeks ending yesterday, did you see a practice nurse or other nurse atthe GP surgery about your own health?
Tick one only
Yes ➔ Go to 2b
No ➔ Go to 3a
2b How many times did you see a practice nurse or other nurse at the GP surgery aboutyour own health in these 2 weeks?
Please write in number
3a During the last 12 months, did you attend the Casualty/A&E department of a hospitalas a patient?
Tick one only
Yes ➔ Go to 3b
No ➔ Go to 4a
3b How many times did you go to Casualty/A&E altogether in the last 12 months?
Please write in number
3
2051
2052-053
2054
2055
2056-057
2058
2059-060
1
2
1
2
1
2
1
2
This questionnaire is about you. Please answer about yourself and your health only.
Herefordshire H S Questionnaire-Oct 2010-9th proof_Adult-English 7/11 19/10/2010 13:25 Page 3

4a During the last 12 months, did you attend the outpatient department of a hospital as apatient (apart from straightforward ante- or post-natal visits)?
Tick one only
Yes ➔ Go to 4b
No ➔ Go to 5a
4b Did you have any outpatient visits in the last 12 months that were paid for privately?
Tick one only
Yes, at least one paid for privately
No, all visits under the NHS
5a During the last 12 months, have you been in hospital for treatment as a day patient, that is admitted to a hospital bed or day ward, but not required to remain overnight?
Tick one only
Yes ➔ Go to 5b
No ➔ Go to 6a
5b Did you have any day patient treatments in the last 12 months that were paid forprivately?
Tick one only
Yes, at least one paid for privately
No, all treatments under the NHS
6a During the last 12 months, have you stayed in hospital as an inpatient, overnight orlonger?
Tick one only
Yes ➔ Go to 6b
No ➔ Go to 7a
6b Did you have any inpatient stays in the last 12 months that were paid for privately?
Tick one only
Yes, at least one paid for privately
No, all stays under the NHS
4
2061
2062
1
2
1
2
2063
2064
2066
Spare2067-77
1
2
1
2
20651
2
1
2
Herefordshire H S Questionnaire-Oct 2010-9th proof_Adult-English 7/11 19/10/2010 13:25 Page 4

7a Which of the following services have you used for yourself in the last 12 months, either under the NHS or privately? Please exclude waiting for an appointment
Tick one box on each rowNHS Private Both NHS
Did not treatment treatment and privateuse only only treatment
Dentist 1 2 3 4
Chiropodist 1 2 3 4
Physiotherapist 1 2 3 4
Osteopath/chiropractor 1 2 3 4
7b During the last 12 months, have you used any of these services for yourself?
Tick one box on each rowYes No
Optician 1 2
Health Visitor, District Nurse or
other community nurse 1 2
GP out of hours services 1 2
NHS Direct (National NHS telephone helpline) 1 2
Pharmacist including local pharmacists and those in large stores and supermarkets (eg picked up
prescribed medicine, asked for advice, bought
medicines kept behind the counter) 1 2
8 Have you had a flu jab in the last 12 months?
Tick one only
Yes 1
No 2
5
2082
2078
2079
2080
2081
2083
2084
2085
2086
Spare2087-90
2091
Herefordshire H S Questionnaire-Oct 2010-9th proof_Adult-English 7/11 19/10/2010 13:25 Page 5

By medicines we mean anything you take or that you put on your skin, such as tablets,powders, creams, sprays and drops, to treat a medical condition. Include conventional andother medicines.
9a During the past 4 weeks have you bought any medicine?(Don't count anything that you got with a prescription)
Tick one only
Yes ➔ Go to 9b
No ➔ Go to 9c
9b If you have bought medicines in the past 4 weeks, which of these kinds did you buy?
Tick all that apply
Conventional medicines, eg aspirin, eye-drops, antacids, cough medicine
Herbal
Homeopathic
Mineral or vitamin supplements
9c Are you on any regular medication prescribed by a doctor?(Regular means for a year or more)
Tick one only
Yes
No
10a Have you ever been treated for any of these?
Tick one box on each row
Yes No
Heart attack
Stroke
Cancer
6
ILLNESSES AND OTHER HEALTH PROBLEMS
MEDICINES
20981 2
20991 2
21001 2
20921
2
2093-096
1
2
20971
2
3
4
Herefordshire H S Questionnaire-Oct 2010-9th proof_Adult-English 7/11 19/10/2010 13:25 Page 6

7
10b Are you currently being treated for any of these?
Tick one box on each row
Yes No
Angina
Heart failure
High blood pressure (or hypertension)
Another heart condition
Asthma
Emphysema
Pleurisy
Spells of bronchitis that have lasted over 3 years
Another respiratory illness
10c Are you currently being treated for any of these?
Tick one box on each row
Yes No
Depression
Anxiety
Another mental illness
Arthritis
Back pain
Epilepsy or fits
Varicose veins
10d Are you currently being treated for diabetes?
Tick one only
Yes ➔ Go to 10e
No ➔ Go to 11a
10e How is your diabetes controlled?
Tick all that apply
Injection
Tablets
Diet
2117
Spare2118-120
1
2
2121-123
1
2
3
21011 2
21021 2
21031 2
21041 2
21051 2
21061 2
21071 2
21081 2
21091 2
21101 2
21111 2
21121 2
21131 2
21141 2
21151 2
21161 2
Herefordshire H S Questionnaire-Oct 2010-9th proof_Adult-English 7/11 19/10/2010 13:25 Page 7
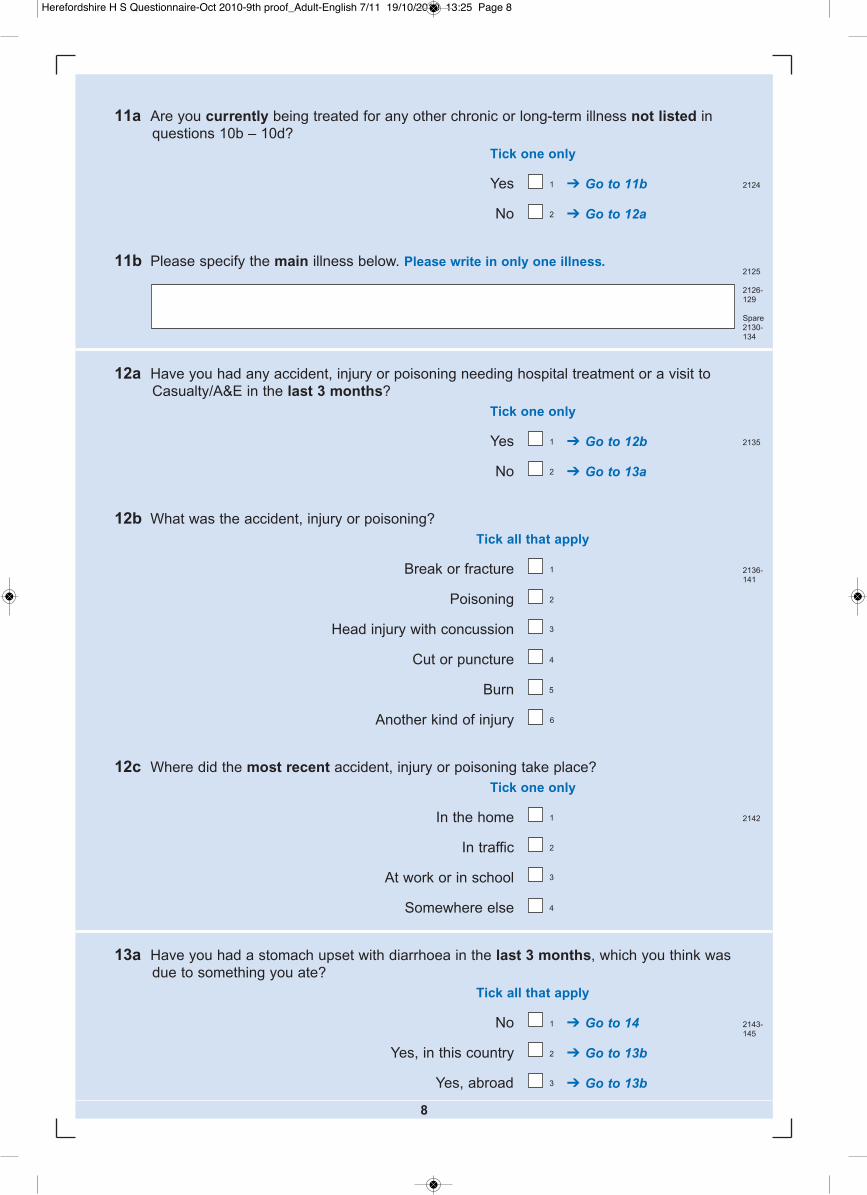
8
11a Are you currently being treated for any other chronic or long-term illness not listed inquestions 10b – 10d?
Tick one only
Yes ➔ Go to 11b
No ➔ Go to 12a
11b Please specify the main illness below. Please write in only one illness.
12a Have you had any accident, injury or poisoning needing hospital treatment or a visit toCasualty/A&E in the last 3 months?
Tick one only
Yes ➔ Go to 12b
No ➔ Go to 13a
12b What was the accident, injury or poisoning?
Tick all that apply
Break or fracture
Poisoning
Head injury with concussion
Cut or puncture
Burn
Another kind of injury
12c Where did the most recent accident, injury or poisoning take place?
Tick one only
In the home
In traffic
At work or in school
Somewhere else
13a Have you had a stomach upset with diarrhoea in the last 3 months, which you think wasdue to something you ate?
Tick all that apply
No ➔ Go to 14
Yes, in this country ➔ Go to 13b
Yes, abroad ➔ Go to 13b
2124
2125
2126-129
Spare2130-134
1
2
21351
2
2136-141
1
2
3
4
21421
2
3
2143-145
1
2
3
4
5
6
Herefordshire H S Questionnaire-Oct 2010-9th proof_Adult-English 7/11 19/10/2010 13:25 Page 8
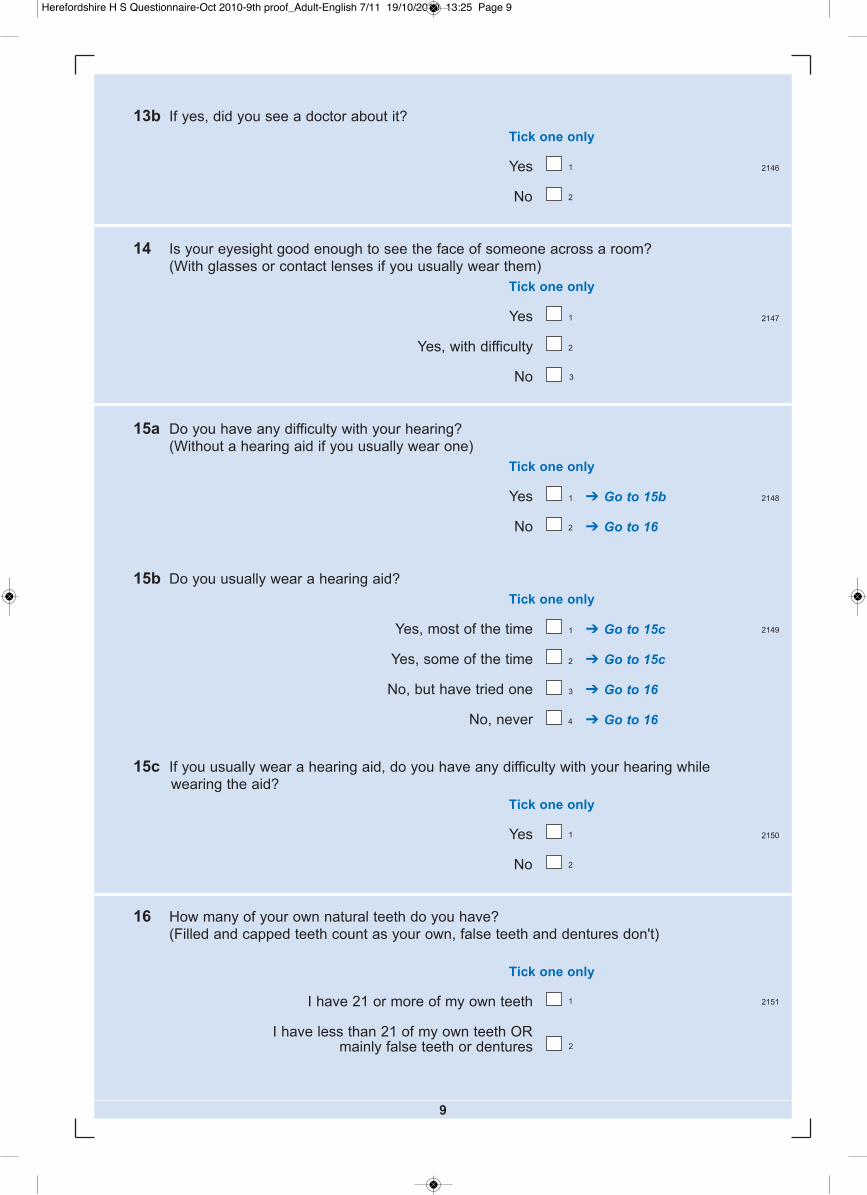
13b If yes, did you see a doctor about it?
Tick one only
Yes
No
14 Is your eyesight good enough to see the face of someone across a room?(With glasses or contact lenses if you usually wear them)
Tick one only
Yes
Yes, with difficulty
No
15a Do you have any difficulty with your hearing? (Without a hearing aid if you usually wear one)
Tick one only
Yes ➔ Go to 15b
No ➔ Go to 16
15b Do you usually wear a hearing aid?
Tick one only
Yes, most of the time ➔ Go to 15c
Yes, some of the time ➔ Go to 15c
No, but have tried one ➔ Go to 16
No, never ➔ Go to 16
15c If you usually wear a hearing aid, do you have any difficulty with your hearing whilewearing the aid?
Tick one only
Yes
No
16 How many of your own natural teeth do you have? (Filled and capped teeth count as your own, false teeth and dentures don't)
Tick one only
I have 21 or more of my own teeth
I have less than 21 of my own teeth OR mainly false teeth or dentures
9
21461
2
21481
2
21491
2
3
4
21501
2
21511
2
21471
2
3
Herefordshire H S Questionnaire-Oct 2010-9th proof_Adult-English 7/11 19/10/2010 13:25 Page 9

YOUR HEALTH AND WELL-BEING
10
Questions 17 – 27 are from SF-36v2® Health Survey © 1996, 2000 by QualityMetric Incorporated – All rights reserved
SF-36v2® is a trademark of QualityMetric Incorporated
These questions ask for your views about your health. This information will help keep track ofhow you feel and how well you are able to do your usual activities. For each of the followingquestions, please tick the one box that best describes your answer.
17 In general, would you say your health is ... ?
Tick one onlyExcellent Very Good Good Fair Poor
18 Compared to one year ago, how would you rate your health in general now?
Tick one only
Much better now than one year ago
Somewhat better now than one year ago
About the same as one year ago
Somewhat worse now than one year ago
Much worse now than one year ago
19 The following questions are about activities you might do during a typical day. Does your health now limit you in these activities? If so, how much?
Tick one box on each rowYes, Yes, No,limited limited not limiteda lot a little at all
a Vigorous activities, such as running, lifting heavy objects, participating in strenuous sports
b Moderate activities, such as moving a table, pushing a vacuum cleaner, bowling, or playing golf
c Lifting or carrying groceries
d Climbing several flights of stairs
e Climbing one flight of stairs
f Bending, kneeling, or stooping
g Walking more than a mile
h Walking several hundred yards
i Walking one hundred yards
j Bathing or dressing yourself
3 4 5 21521 2
21541 2 3
21551 2 3
21561 2 3
21571 2 3
21581 2 3
21591 2 3
21601 2 3
21611 2 3
21621 2 3
21631 2 3
21531
2
3
4
5
Herefordshire H S Questionnaire-Oct 2010-9th proof_Adult-English 7/11 19/10/2010 13:25 Page 10

11
20 During the past 4 weeks, how much of the time have you had any of the followingproblems with your work or other regular daily activities as a result of your physicalhealth?
Tick one box on each rowAll of Most of Some of A little None of
the time the time the time of the time the time
a Cut down on the amount of time you spent on work or other activities
b Accomplished less than you would like
c Were limited in the kind of work or other activities
d Had difficulty performing the work or other activities (for example, it took extra effort)
21 During the past 4 weeks, how much of the time have you had any of the followingproblems with your work or other regular daily activities as a result of any emotionalproblems (such as feeling depressed or anxious)?
Tick one box on each rowAll of Most of Some of A little None of
the time the time the time of the time the time
a Cut down on the amount of time you spent on work or other activities
b Accomplished less than you would like
c Did work or other activities less carefully than usual
22 During the past 4 weeks, to what extent has your physical health or emotional problemsinterfered with your normal social activities with family, friends, neighbours, or groups?
Tick one onlyNot at all Slightly Moderately Quite a bit Extremely
23 How much bodily pain have you had during the past 4 weeks?
Tick one onlyNone Very Mild Mild Moderate Severe Very Severe
21641 2 3 4 5
21651 2 3 4 5
21661 2 3 4 5
21671 2 3 4 5
21681 2 3 4 5
21691 2 3 4 5
21701 2 3 4 5
21711 2 3 4 5
21721 2 3 4 5 6
Herefordshire H S Questionnaire-Oct 2010-9th proof_Adult-English 7/11 19/10/2010 13:25 Page 11

24 During the past 4 weeks, how much did pain interfere with your normal work (including both work outside the home and housework)?
Tick one onlyNot at all A little bit Moderately Quite a bit Extremely
25 These questions are about how you feel and how things have been with you during thepast 4 weeks. For each question, please give the one answer that comes closest to theway you have been feeling. How much of the time during the past 4 weeks ...
Tick one box on each row
a Did you feel full of life?
b Have you been very nervous?
c Have you felt so down in the dumps that nothing could cheer you up?
d Have you felt calm and peaceful?
e Did you have a lot of energy?
f Have you felt downhearted and low?
g Did you feel worn out?
h Have you been happy?
i Did you feel tired?
26 During the past 4 weeks, how much of the time has your physical health or emotionalproblems interfered with your social activities (like visiting friends, relatives, etc)?
Tick one only
27 How TRUE or FALSE is each of the following statements for you?
Tick one box on each row
a I seem to get ill more easily than other people
b I am as healthy as anybody I know
c I expect my health to get worse
d My health is excellent
12
Definitely Mostly Don’t Mostly Definitely
true true know false false
All of Most of Some of A little None of
the time the time the time of the time the time
All of Most of Some of A little None of
the time the time the time of the time the time
21731 2 3 4 5
21831 2 3 4 5
21741 2 3 4 5
2175
1 2 3 4 5
2176
1 2 3 4 5
2177
1 2 3 4 5
2178
1 2 3 4 5
2179
1 2 3 4 5
2180
1 2 3 4 5
2181
1 2 3 4 5
2182
1 2 3 4 5
2184
1 2 3 4 5
2185
1 2 3 4 5
2186
1 2 3 4 5
2187
1 2 3 4 5
Herefordshire H S Questionnaire-Oct 2010-9th proof_Adult-English 7/11 19/10/2010 13:25 Page 12

13
SMOKING
28a Do you have any long-term illness, health problem or disability which limits your dailyactivities or the work you can do? (Include problems which are due to old age)
Tick one only
Yes ➔ Go to 28b
No ➔ Go to 29
28b If you have limitations in any of your daily activities or work, which long-term illness,health problem or disability is the main cause? Please write in only one illness.
29 Which one of these best describes you?
Tick one only
I smoke daily ➔ Go to 30
I smoke occasionally but not every day ➔ Go to 30
I used to smoke daily but do not smoke at all now ➔ Go to 35
I used to smoke occasionally butdo not smoke at all now ➔ Go to 35
I have never smoked ➔ Go to 35
30 During the 7 days ending yesterday, did you smoke in any of these places?
Tick one box on each row
Yes No/Does not apply
Outdoors Outside at home
Other places outdoors
Indoors In own home
In other people's homes
Whilst travelling by car
Other places indoors
2188
2189
2190-193
Spare2194-199
1
2
22001
2
3
4
5
22011 2
22021 2
22031 2
22041 2
22051 2
2206
Spare2207-09
1 2
Herefordshire H S Questionnaire-Oct 2010-9th proof_Adult-English 7/11 19/10/2010 13:25 Page 13

14
31 Have you tried to give up smoking in the last 12 months?Tick one only
Yes 1 2210
No 2
32 Compared with this time last year, do you…?
Tick one only
Smoke more now 1 2211
Smoke about the same now 2
Smoke less now 3
34 What are your main reasons for wanting to give up?
Tick all that apply
Because of a health problem I have at present 01 2213-
Better for my health in general 02
28
Less risk of getting smoking related illnesses 03
Family/friends want me to stop 04
Financial reasons 05
Worried about the effect on my children 06
Because of the smoking ban 07
Other reasons 08
33 Would you like to give up smoking altogether?
Tick one only
Yes 1 ➔ Go to 34 2212
No 2 ➔ Go to 35
35 Are you regularly exposed to other people's tobacco smoke in any of these places?
Tick one box on each row
Yes No/Does not apply
Outdoors Outside at home 1 2 2229
Other places outdoors 1 2 2230
Indoors In own home 1 2 2231
In other people's homes 1 2 2232
Whilst travelling by car 1 2 2233
Other places indoors 1 2 2234
Spare2235-49
Herefordshire H S Questionnaire-Oct 2010-9th proof_Adult-English 7/11 19/10/2010 13:25 Page 14
15
ALCOHOL
36 How often have you had an alcoholic drink of any kind during the last 12 months?Tick one only
Almost every day 01 ➔ Go to 38 2250-
Five or six days a week 02 ➔ Go to 38
51
Three or four days a week 03 ➔ Go to 38
Once or twice a week 04 ➔ Go to 38
Once or twice a month 05 ➔ Go to 38
Once every couple of months 06 ➔ Go to 38
Once or twice a year 07 ➔ Go to 38
Not at all in the last twelve months 08 ➔ Go to 37
37 Have you always been a non-drinker, or did you stop drinking for some reason?
Tick one only
Always a non-drinker 1 ➔ Go to 40a 2252
Used to drink but stopped 2 ➔ Go to 40a
38 Did you have an alcoholic drink of any kind in the last 7 days?
Tick one only
Yes 1 ➔ Go to 39a 2253
No 2 ➔ Go to 40a
Herefordshire H S Questionnaire-Oct 2010-9th proof_Adult-English 7/11 19/10/2010 13:25 Page 15
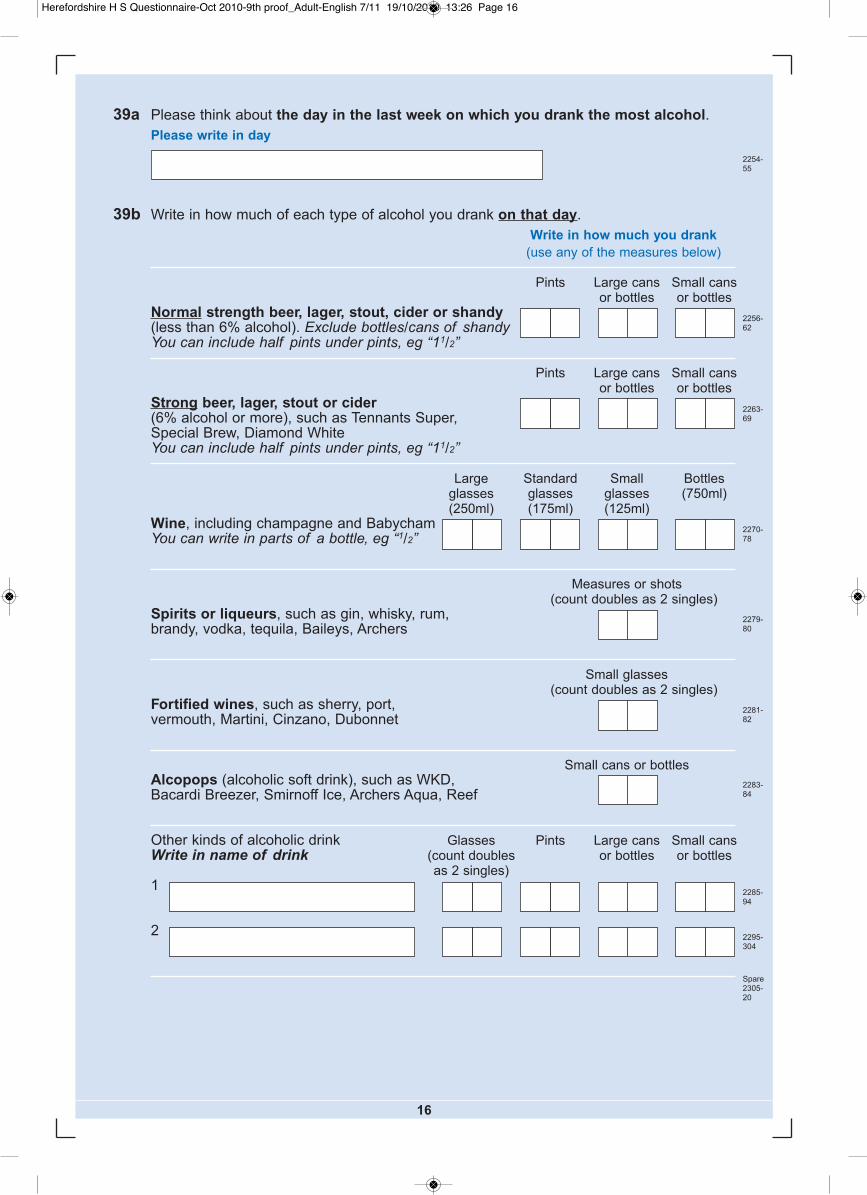
16
39a Please think about the day in the last week on which you drank the most alcohol. Please write in day
39b Write in how much of each type of alcohol you drank on that day.
Write in how much you drank(use any of the measures below)
Pints Large cans Small cansor bottles or bottles
Normal strength beer, lager, stout, cider or shandy(less than 6% alcohol). Exclude bottles/cans of shandy You can include half pints under pints, eg “11/2”
Pints Large cans Small cansor bottles or bottles
Strong beer, lager, stout or cider (6% alcohol or more), such as Tennants Super, Special Brew, Diamond WhiteYou can include half pints under pints, eg “11/2”
Large Standard Small Bottlesglasses glasses glasses (750ml)(250ml) (175ml) (125ml)
Wine, including champagne and BabychamYou can write in parts of a bottle, eg “1/2”
Measures or shots(count doubles as 2 singles)
Spirits or liqueurs, such as gin, whisky, rum, brandy, vodka, tequila, Baileys, Archers
Small glasses (count doubles as 2 singles)
Fortified wines, such as sherry, port, vermouth, Martini, Cinzano, Dubonnet
Small cans or bottlesAlcopops (alcoholic soft drink), such as WKD, Bacardi Breezer, Smirnoff Ice, Archers Aqua, Reef
Other kinds of alcoholic drink Glasses Pints Large cans Small cansWrite in name of drink (count doubles or bottles or bottles
as 2 singles)1
2
2254-55
2256-62
2263-69
2270-78
2279-80
2281-82
2283-84
2285-94
2295-304
Spare2305-20
Herefordshire H S Questionnaire-Oct 2010-9th proof_Adult-English 7/11 19/10/2010 13:26 Page 16

40b Using the measures below, how much of the following did you eat yesterday?Please read through the whole list before answering
Write in number(or “0” if none eaten)
Average handfuls of very small fresh fruit,such as grapes, berries
handfuls
Small fruit, such as plums, satsumas whole fruit
Medium fruit, such as apples, bananas, oranges whole fruit
Half (1/2) large fruit, such as grapefruit half fruit
Average slices of a very large fruit, such as melon slices
Tablespoons of frozen or tinned fruit tablespoons
Average handfuls of dried fruit, such as raisins, apricots handfuls
Tablespoons of fruit in other dishes made mainly from fruit such as fruit salad or fruit pies
tablespoons
Small glasses of fruit juice small glasses
If no fruit eaten yesterday, please tick
40a Using the measures below, how much of the following did you eat yesterday?Please read through the whole list before answering
Write in number(or “0” if none eaten)
Small bowlfuls of salad small bowlfuls
Tablespoons of potatoesInclude potatoes in other dishes tablespoons
Tablespoons of other vegetables(raw, cooked, frozen or tinned)
tablespoons
Tablespoons of pulses such as baked beans, red kidney beans, lentils, chickpeas, daal
tablespoons
Tablespoons of vegetables or pulses in other dishesmade mainly from vegetables or pulses
tablespoons
Do not include potatoes
If no vegetables eaten yesterday, please tick
Note: A tablespoon is a size bigger than a spoon you would use to eat soup orbreakfast cereal
2321-22
2323-24
2325-26
2327-28
2329-30
2331
2332-33
2334-35
2336-37
2338-39
2340-41
2342-43
2344-45
2346-47
2348-49
2350
FRUIT AND VEGETABLES
17
Herefordshire H S Questionnaire-Oct 2010-9th proof_Adult-English 7/11 19/10/2010 13:26 Page 17

18
41b During the 7 days ending yesterday, on which days did you do MODERATE exercise orphysical activity for at least 30 minutes?Blocks of activity lasting at least 10 minutes, which were done on the same day, can becounted towards the full 30 minutes.Include physical activity which is part of your job
Tick all days that apply
Moderate exercise / activity
For example Heavy housework (eg spring cleaning, walking with heavy shopping), fast walking, dancing, gentle swimming, heavy gardening (eg digging)
If no moderate exercise in the last 7 days, please tick
41c During the 7 days ending yesterday, on which days did you do VIGOROUS exercise orphysical activity for at least 30 minutes?Blocks of activity lasting at least 10 minutes, which were done on the same day, can becounted towards the full 30 minutes.Include physical activity which is part of your job
Tick all days that apply
Vigorous exercise / activity
For example Running, jogging, squash, swimming lengths, aerobics, fast cycling, football
If no vigorous exercise in the last 7 days, please tick
2365-78
01 02 03 04 05 06 07
08
2379-92
01 02 03 04 05 06 07
08
Mon Tue Wed Thu Fri Sat Sun
Mon Tue Wed Thu Fri Sat Sun
41a During the 7 days ending yesterday, on which days did you do LIGHT exercise orphysical activity for at least 30 minutes?Blocks of activity lasting at least 10 minutes, which were done on the same day, can becounted towards the full 30 minutes.Include physical activity which is part of your job
Tick all days that apply
Light exercise / activity
For example Housework (eg hoovering, dusting), walking at an average pace, golf, light gardening (eg weeding)
If no light exercise in the last 7 days, please tick
EXERCISE
2351-64
01 02 03 04 05 06 07
08
Mon Tue Wed Thu Fri Sat Sun
Herefordshire H S Questionnaire-Oct 2010-9th proof_Adult-English 7/11 19/10/2010 13:26 Page 18

ABOUT YOU
43 Are you….? Male Female
44 How old were you on your last birthday?
Please write in whole years
Age years
45 Women only: Are you currently pregnant?
Tick one only
Yes
No
46 How tall are you?
feet inches OR centimetres
47 How much do you weigh?
stone pounds OR kilograms
2394
2395-97
2399
2400-01
2402-04
2405-06
2407-08
2409-11
1 2
23981
2
42 Do you look after, or give any help or support to family members, friends, neighbours orothers because of long-term physical or mental ill-health or disability, or problems relatedto old age? Do not count anything you do as part of your paid employment
Tick time spent in a typical week
No
Yes, 1-19 hours a week
Yes, 20-49 hours a week
Yes, 50+ hours a week
CARERS
23931
2
3
4
19
Herefordshire H S Questionnaire-Oct 2010-9th proof_Adult-English 7/11 19/10/2010 13:26 Page 19

2020
48 What is your ethnic group?
Choose one section from A to E, then tick one box to best describe your ethnic group orbackground.
A. White English/Welsh/Scottish/ Northern Irish/British
Irish
Gypsy or Irish Traveller
Any other White background, write in
2412-13
01
02
03
04
B. Mixed/multiple ethnic groups White and Black Caribbean
White and Black African
White and Asian
Any other Mixed/multiple ethnic background, write in
2412-13
05
06
07
08
D. Black or Black British African
Caribbean
Any other Black/African/Caribbean background, write in
2412-13
14
15
16
E. Other ethnic group Arab
Any other ethnic group, write in
2412-13
17
18
C. Asian or Asian British Indian
Pakistani
Bangladeshi
Chinese
Any other Asian background, write in
2412-13
09
10
11
12
13
Herefordshire H S Questionnaire-Oct 2010-9th proof_Adult-English 7/11 19/10/2010 13:26 Page 20

2121
49 Which of these descriptions applies to what you were doing last week?
Tick first to apply
Going to school or college full-time (including on vacation)
In paid employment or self-employment (or away temporarily)
On a Government scheme for employment training
Doing unpaid work for a business that you own, or that a relative owns
Waiting to take up paid work already obtained
Looking for paid work or a Government training scheme
Intending to look for work but prevented by temporary sickness or injury (sick or injured for 28 days or less)
Permanently unable to work because of long-term sickness or disability
Retired from paid work
Looking after the home or family
Doing something else
2414-1501
02
03
04
05
06
07
08
09
10
11Spare2416-19
50 Which of these qualifications do you have?
Tick all the qualifications that apply or, if not specified, their nearest equivalent
1+ O levels/CSEs/GCSEs (any grades)
5+ O levels, 5+ CSEs (grade 1), 5+ GCSEs (grade A-C), School Certificate
1+ A levels/AS levels
2+ A levels, 4+ AS levels, Higher School Certificate
First Degree (eg BA, BSc)
Higher Degree (eg MA, PhD, PGCE, post-graduate certificate / diplomas)
NVQ Level 1, Foundation GNVQ
NVQ Level 2, Intermediate GNVQ
NVQ Level 3, Advanced GNVQ
NVQ Levels 4-5, HNC, HND
Other Qualifications (eg City and Guilds, RSA/OCR, BTEC/Edexcel)
No Qualifications
2420-43
01
02
03
04
05
06
07
08
09
10
11
12
Herefordshire H S Questionnaire-Oct 2010-9th proof_Adult-English 7/11 19/10/2010 13:26 Page 21

22
THANK YOU FOR COMPLETING THIS QUESTIONNAIREPlease return the questionnaire to the interviewer(or in the envelope provided if sent in the post)
52 If at some future date we wanted to ask you to take part in a further health-related study, may we contact you to see if you are willing to help again?
Tick one only
Yes 1 2456
No 2
51 Do you have any of the following professional qualifications?
Tick all the boxes that apply
No Professional Qualifications Qualified Dentist
Qualified Teacher Status (for schools) Qualified Nurse, Midwife, Health Visitor
Qualified Medical Doctor Other Professional Qualifications
2444-55
01
02
03
04
05
06
Herefordshire H S Questionnaire-Oct 2010-9th proof_Adult-English 7/11 19/10/2010 13:26 Page 22

Herefordshire H S Questionnaire-Oct 2010-9th proof_Adult-English 7/11 19/10/2010 13:26 Page 23

Herefordshire H S Questionnaire-Oct 2010-9th proof_Adult-English 7/11 19/10/2010 13:26 Page 24