here are collected … the croakings of a cassandra who … here are collected … the croakings of...
TRANSCRIPT


2
Here are collected … the croakings of a Cassandra who could never influence the course of events in time. They were regarded at the time … as extreme and reckless utterances. But the reader … will admit that this was because they often ran directly counter to the overwhelming weight of contemporary sentiment and opinion, and not because of their character in themselves.”
John Maynard Keynes, “Essays in Persuasion,” 1932.
Acknowledgements
The IMF’s work on the Early Warning Exercise (EWE) has been a joint effort by four departments under the direction of Tamim Bayoumi (Strategy, Policy, and Review Department, SPR), Jan Brockmeijer (Monetary and Capital Markets Department, MCM), Philip Gerson (Fiscal Affairs Department, FAD), and Jonathan D. Ostry (Research Department, RES). Departmental leadership was provided by Manmohan S. Kumar and Jiri Jonas (FAD); Elie Canetti and Nicolas Blancher (MCM); Atish Ghosh and Natalia Tamirisa (RES); and Martin Mühleisen, Athanasios Vamvakidis, and Donal McGettigan (SPR). SPR acts as coordinator of the EWE. Credits for analytical work and contributions to this paper belong to:
Apinait Amranand Sumit Aneja Sergei Antoshin Ivailo Arsov Emanuele Baldacci Reza Baqir Roberto Benelli Carlos Caceres Giovanni Callegari Marcos Chamon Kevin Cheng Varapat Chensavasdijai R. Sean Craig Christopher Crowe Reginald Darius Irineu de Carvalho Filho Gianni De Nicolo Gabriele Dobrescu Christoph Duenwald Martin Edmonds Julio Escolano Jaume Puig Forne Marc Gerard Brenton Goldsworthy Brenda Gonzalez-Hermosillo Manuella Goretti Gavin Gray Julia M. Guerreiro
Ioannis Halikias Kristian Hartelius Fuad Hasanov Thomas Helbling Heiko Hesse Niko Hobdari Mark Horton Deniz Igan Anna Ilyina Sheila Tomilloso Igcasenza Anna Ilyina Andy Jobst Matthew Jones Philippe Karam Padamja Khandelwal Heejin Kim Vladimir Klyuev Michael Kumhof Doug Laxton Prakash Loungani Claudia Maria Isern Edouard Martin Ola Melander Ken Miyajima Luzmaria Monasi Anne Moses Dirk Muir Mwanza Nkusu
Mohamed Norat Maria Oliva Armengol Tola Oni Hiroko Oura Malika Pant Iva Krasteva Petrova Jiri Podpiera Federico Gabriel Presciuttini Pau Rabanal Jair Rodriguez Ferhan Salman Andre Oliveira Santos Hitoshi Sasaki Liliana Schumacher Miguel Segoviano Cesar Manuel Serra Silvia Sgherri Serhat Solmaz Alison Stuart Yan Sun Stephen Tokarick Ioannis Tokatlidis Hui Tong Thierry Tressel Kenichi Ueda Francis Vitek Karim Youssef
This paper was edited by Martin Mühleisen, Athanasios Vamvakidis, and Padamja Khandelwal.

3
Contents Page
I. Introduction .......................................................................................................................... 4
Part I: The Design of the Early Warning Exercise
II. Compiling Early Warnings ................................................................................................... 8 A. Lessons from the Past ............................................................................................ 8 B. The EWE Process ................................................................................................. 11 C. Collaboration with the FSB ................................................................................... 14
III. The IMF’s Contributions to the EWE ................................................................................ 15
IV. Disseminating Early Warnings ......................................................................................... 17
Part II: The IMF's Analytical Toolkit
V. Sectoral and Market Vulnerabilities .................................................................................. 21 A. External Sector Risks and Vulnerabilities ............................................................. 21 B. Fiscal Risks and Vulnerabilities ............................................................................ 22 C. Corporate Sector Risks and Vulnerabilities .......................................................... 23 D. Asset Prices, Market Valuations and Bubble Spotting .......................................... 24 E. Financial Market Risk Attitudes ............................................................................. 26
VI. Country Risk Models ........................................................................................................ 29
VII. Drawing Systemic Implications ....................................................................................... 33 A. Spillovers and Contagion Analysis ........................................................................ 33 B. Analysis of Large Complex Financial Institutions (LCFI) ...................................... 36 C. Global Scenarios .................................................................................................. 38
VIII. Aggregation and Country Ratings .................................................................................. 39
IX. Conclusion: A Timely Warning ......................................................................................... 41

4
I. INTRODUCTION
The severe global impact of the financial crisis in the United States during 2007–08 took almost everyone by surprise. Despite occasional concerns aired during the pre-crisis period, the U.S. financial system was widely perceived to be fundamentally sound and well-regulated. However, starting with the collapse of the U.S. subprime mortgage market in late 2007, and particularly in the aftermath of Lehman’s demise in late 2008, the crisis spread globally. Liquidity dried up, cross-border capital flows reversed abruptly, and world trade dropped sharply. In a truly systemic manner, the effects of a shock in one corner of the U.S. financial sector impaired global economic and financial activity in a lasting way.
One of the G-20’s first reactions to the crisis was to task the IMF and FSB with establishing a joint Early Warning Exercise (EWE). Notwithstanding the fact that the crisis was still at an acute stage, policy makers felt urgently the need to improve their ability to spot risks and vulnerabilities that could lead to further systemic shocks, thus helping them coordinate an early policy response:
“The IMF, in collaboration with the expanded FSB and other bodies, should work to better identify vulnerabilities, anticipate potential stresses, and act swiftly to play a key role in crisis response.” (G20 Communiqué, November 15, 2008).1
Within a very short period, the EWE gained shape as a joint IMF and FSB exercise, as staff of the two institutions presented blueprints to their respective governing bodies. On the Fund’s part, the EWE framework and operational modalities were discussed by the Executive Board in early 2009, and tested in a dry run prior to the Spring Meetings in the same year. As the EWE has evolved through multiple iterations, several guiding principles and modalities have evolved:
The key output of the EWE is a confidential presentation of risks and vulnerabilities to the International Monetary and Financial Committee (IMFC).2 This presentation is prepared in close cooperation between IMF and FSB staff, based on a common understanding of stresses for the global economy and financial system that are likely to emerge.
To facilitate cooperation, the IMF and the FSB take nonexclusive leading roles in their areas of comparative strength. The IMF has led the work on macroeconomic and macro-financial vulnerabilities, while the FSB has taken the lead on vulnerabilities and regulatory challenges in the financial sector. Strong interaction
1See also Final Report of the G20 Working Group 3 “The Reform of the IMF,” March 2009, and IMFC Communiqué, April 2009.
2The IMFC is the main advisory body to the IMF’s Board of Governors. It has 24 members who are central bank governors, ministers, or others of comparable rank and who are drawn from the governors of the Fund’s 187 member countries. The committee usually meets twice a year to discuss matters of concern affecting the global economy and advise the IMF on the direction of its work. The membership of the committee reflects the composition of the IMF Executive Board.

5
prior and during each round ensures that the outcome of the EWE fully reflects the contributions of both bodies.
The EWE combines rigorous empirical analysis with surveys of experts and market intelligence. The findings of the exercise are steeped in extensive empirical research, aiming for a thorough quantitative analysis of vulnerabilities by drawing on a large number of empirical tools. This research is conducted partly for exclusive use by the EWE, and partly as a by-product of other work conducted by the Fund and FSB members. Equally important are views emerging from qualitative discussions of risk scenarios with individuals in different economic and financial professions, ranging from market analysts to respected academics and senior policymakers.
The exercise does not aim to predict the timing of crises. Experience with previous attempts at crisis detection, for example, in the wake of the Asia crisis, has taught that the success of analytical tools has usually been limited to gauging the potential for a crisis to manifest itself. Identifying events that may trigger a crisis has been a very different, and more difficult, story altogether. Hence, the primary purpose of the EWE is to identify underlying vulnerabilities and imminent tail risks that predispose a system to a crisis, so that corrective policies can be implemented and contingency plans put in place ahead of time.
Indeed, as the global crisis unfolded, the EWE has increasingly focused on the repercussions of risks that may have already materialized. Being in the midst of highly uncertain economic conditions and mounting costs of the financial crisis, the initial EWE rounds have dealt primarily with potential mutations of the crisis, asking what other shocks could materialize and assessing the consequences of policy inaction. These rounds have been instrumental in identifying vulnerabilities and transmission channels that could influence the future direction of the crisis, helping to sharpen policy advice and highlighting areas in need of global policy coordination to improve crisis response.
Once the global economy returns to more stable conditions, the EWE is likely to become the more forward-looking exercise it was initially meant to be. As the potential for short-term disruptions diminishes, the exercise is again set to focus more on low-probability, high-impact events (tail risks). Over time, as new sources of systemic risks emerge and new analytical tools become available, the EWE framework will also adapt.
* * * * *
This paper presents an overview of the IMF’s contributions to the IMF-FSB Early Warning Exercise. Part I sets out the process, analytical framework, outputs, and dissemination of the EWE, as well as the collaboration with the FSB. Part II describes the main analytical tools deployed in the exercise as of September 2010. As new tools are being developed by or become available to Fund staff, they are being added to the exercise, or substituted for other models that may have failed to establish a successful track record.


8
II. COMPILING EARLY WARNINGS
For those involved in the Early Warning Exercise, any new round involves a familiar kind of introspection. Which of the myriads things that could go wrong in the world economy require the most attention by policy makers? How can one harness the wisdom of concerned economists, bankers, and administrators who have thought deeply about the same question? And how best can one leverage the knowledge and information of two large but different international organizations: on the one side, a highly specialized international financial institution; on the other side, a body of ministries, regulatory agencies, central bankers and international committees? At the outset, it has always been helpful to first reflect about the nature of past crises and lessons learned.
A. Lessons from the Past
From the perspective of the EWE, crises result from the collision of vulnerabilities of an economic or financial nature and specific trigger events.3 An underlying vulnerability is thus a necessary, but not a sufficient, condition for a crisis. A vulnerability could be a credit or asset price bubble, or a balance sheet mismatch (excessive borrowing in foreign currency, at too-short maturities, or with inadequate capitalization). A crisis trigger, however, could be almost any event—political turmoil, terms of trade shocks, contagion from other countries, or, to take the example of the recent global crisis, the collapse of the U.S. subprime market (Table 1).
Past attempts at providing early warning generally found crisis triggers to be unpredictable, but have proven useful in identifying underlying vulnerabilities. Predicting the timing of a crisis has widely been considered a fool’s errand, and crisis models have a dubious record in this regard.4 However, there is value to be gained in identifying the key vulnerabilities that are likely to come into play in the event of crisis.
The narrow focus on sudden stops in emerging markets and the reliance on a single early warning model were major shortcomings of past risk analysis. Subsequent to the Latin American debt crisis, early warning analyses tended to focus heavily on sudden stops of capital inflows into emerging markets in the context of an empirical model-based approach. There was no similar analysis for advanced economies, which were not considered to be as vulnerable, given better fundamentals and policy-making capacity.5
3For more details, see Ghosh, A., J.D. Ostry, and N. Tamirisa, 2009, “Anticipating the Next Crisis,” Finance and Development, vol. 46, no. 3, pp. 35–7.
4For a discussion of the early warning literature, see Berg, A., E. Borensztein, G.M. Milesi-Ferretti, and C. Pattillo, 2000, “Anticipating Balance of Payments Crises—The Role of Early Warning Systems,” IMF Occasional Paper No. 186; and Frankel, J., and G. Saravelos, 2010, “Are Leading Indicators of Financial Crises Useful for Assessing Country Vulnerability?”, NBER Working Paper 16047.
5For a discussion on the difficulties of empirically identifying a set of indicators to explain both the current and past crises in advanced and emerging economies, see Rose, A., and M. Spiegel, 2010, “Cross-Country Causes and Consequences of the 2008 Crisis: Early Warning”, Global Journal of Economics, forthcoming.

9
Table 1. Underlying Vulnerabilities and Triggers in Selected Crises Prior to 2008
Crisis Vulnerability Trigger
Finland (1991) Norway (1988) Sweden (1991)
Credit and house price booms, overheating, thin capitalization of banks, concentrated loan exposures, domestic lending in foreign currency, financial deregulation without strengthening of prudential regulation and supervision; weaknesses in risk management at the individual bank level.
Tax reforms, tightening of monetary policy, collapse of trade with the Council for Mutual Economic Assistance, exchange rate depreciation
Mexico (1994) Government's short-term external (and foreign-exchange-denominated) liabilities.
Tightening of U.S. monetary policy, political shocks
Argentina (1995) Banking system short-term external and peso and FX-denominated liabilities.
Contagion from Mexico crisis
Japan (1995) Credit and real estate boom, financial deregulation without strengthening of prudential regulation and supervision, weak corporate governance and regulatory forbearance.
Real estate collapse
Thailand (1997) Financial and nonfinancial corporate sector external liabilities, concentrated exposure of finance companies to property sector.
Terms of trade deterioration, asset price deflation
Korea (1997) Financial sector external liabilities (with substantial maturity mismatch) and concentrated exposure to chaebols, high corporate debt/equity ratio
Terms of trade deterioration, profitability of chaebols, contagion from Thailand crisis
Indonesia (1997)
Corporate sector external liabilities, concentration of banking system assets in real estate/property-related lending, high corporate debt/equity ratio.
Contagion from Thailand crisis, banking crisis
Russia (1998) Government's short-term external financing needs.
Failure to implement budget deficit targets; terms of trade deterioration.
Brazil (1999) Government's short-term external liabilities. Doubts about ability to implement budget cuts; current account deficit; contagion from Russian default.
Turkey (2000) Government short-term liabilities; banking system foreign exchange and maturity mismatches.
Widening current account deficit, real exchange rate appreciation, terms of trade shock; uncertainty about political will of the government to undertake reforms in the financial sector.
Argentina (2002) Public and private sector external and FX-denominated liabilities.
Inconsistency between currency board arrangement and fiscal policy; Russian default.
Uruguay (2002) Banking system short-term external liabilities. Argentine deposit freeze leading to mass withdrawals from Uruguyan banks
United States (2007)
Credit and house price boom, weaknesses in financial regulation resulting in a build-up of leverage and mispricing of risk.
Collapse of the subprime mortgage market
Source: Ghosh and others, "Anticipating the Next Crisis," Finance and Development, September 2009; Ghosh and others, 2008, "IMF Support and Crisis Prevention", IMF Occasional Paper No. 262.

10
Moreover, there were few attempts to identify and analyze new and evolving sources of systemic risk and sectoral vulnerabilities that could precipitate a financial crisis in either advanced or emerging economies, or on channels of internal and cross-border contagion.
Even as more risk models become available, however, the key challenge still lies in “connecting the dots.” Fragmented analyses are likely to underestimate risks, and tend to miss how shocks can spread across markets, sectors, countries, or regions. For instance, many analysts cautioned against “risk concentrations” in U.S. housing, but there were few suggestions prior to the crisis that this could lead to dire macroeconomic consequences, particularly at a global level. IMF surveillance also underestimated the combined risks across sectors, and the importance of macro-financial feedback loops. As a result, policy messages proved to be too optimistic even as vulnerabilities were building up.
The final lesson from earlier exercises is that scattered and unfocused warnings are unlikely to spur concrete policy action.6 Policy makers do not tend to act on vague warnings when the going is good: bitter policy medicine is hard to dispense when signs of crisis are not evident. Furthermore, addressing vulnerabilities may require policy coordination, which can be hard to achieve unless warnings include a full discussion of potential spillovers. Indeed, global policy coordination clearly proved inadequate prior to the most recent crisis.
Heeding these lessons, the Early Warning Exercise seeks to detect vulnerabilities, warn about tail risks, and gain traction with policy makers:
The EWE is a “flag-raising” exercise, signaling trends that could make markets or countries vulnerable to unanticipated events, rather than calling the next crisis.
The exercise uses a number of analytical tools and indicators, as well as internal and outside perspectives, to look at a broad array of systemic risks and vulnerabilities as they evolve across advanced and emerging economies, and across sectors and financial institutions.
The EWE aims to “connect the dots” between different risks, uncovering the scope for potential spillovers, and to understand their systemic impact. The exercise analyzes vulnerabilities in depth, focusing on channels of transmission and contagion.
The EWE also quantifies “how bad things could get” under adverse scenarios in which policies fail to address the identified vulnerabilities. Such warnings seek to inspire policy responses even during good times.
Finally, the EWE presentation to the IMFC is geared towards providing leaders with actionable warnings on tail risks. These warnings are detailed and accompanied by specific policy advice, with explanations of potential spillover risks.
6IMF, 2009, “Initial Lessons of the Crisis,” PIN No. 09/30, available at http://www.imf.org/external/np/sec/pn/2009/pn0930.htm.

11
B. The EWE Process
The EWE is timed to provide a regular input for the deliberations of the International Monetary and Financial Committee during the IMF’s Annual and Spring Meetings. The exercise follows a series of carefully planned steps, with work beginning about 3 months before the meetings (Figure 1). The early weeks of the exercise are used to review and follow-up on the analysis of the previous round, update the results of empirical models in the IMF’s analytical toolkit, and engage with outside experts and policy makers to obtain views on how risks and vulnerabilities have evolved since the previous round. At this point in the round, IMF and FSB staff still work on largely separate tracks, identifying issues in their respective areas of expertise; cooperation intensifies once the results of the initial phase are available.
Figure 1. The EWE Process
The IMF-FSB Early Warning Exercise
IMF Leads the work on macroeconomic and macro-financial vulnerabilities
IMF Early Warning Group
Qualitative Analysis/Consultations Quantitative Analyses
FSB Leads the work on vulnerabilities and regulatory challenges in the financial sector
Standing Committee on Assessment of Vulnerabilities
Analytical Group on Vulnerabilities
Early Warning List
An intermediate product documenting the common understanding of risks and vulnerabilities between IMF and FSB staff.
Presentation to the IMFC
(Preceded by discussions among the governing bodies of both institutions.)

12
Work at the IMF is coordinated by an Early Warning Group (EWG). It consists of staff from several departments that jointly guide the analytical work and prepare EWE documents in consultation with management. A key objective for this group is to compile an inventory of the major risks, vulnerabilities, and underlying trends identified in the first phase of the exercise and, using professional judgment, rank them according to systemic importance (as characterized by their expected likelihood and potential impact). The EWG also oversees work on the IMF’s Vulnerability Exercises for Advanced and Emerging Economies, which bundle the EWE’s empirical work and classify countries into three vulnerability states (see below).
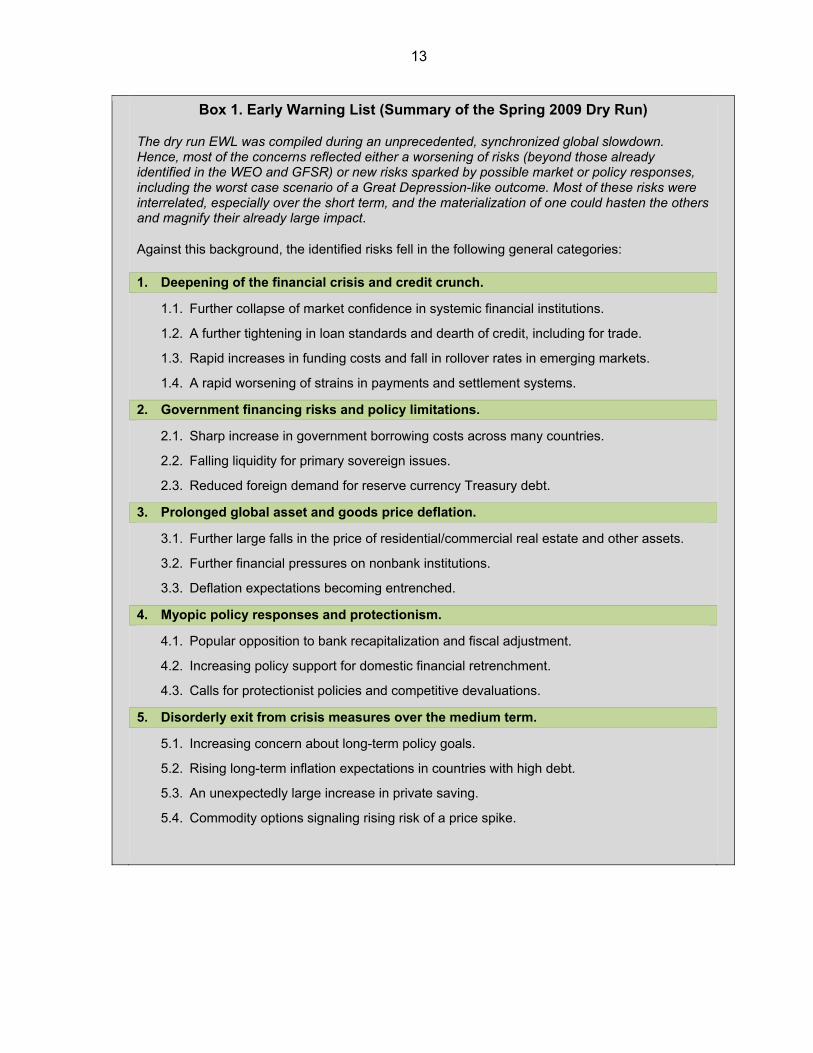
The EWG distills the key risks, vulnerabilities, and observed trends into a first draft of the Early Warning List (EWL). Intended to document the IMF and FSB staff’s consensus view on issues most pertinent to the present exercise, the 5–6 page document is a stepping stone in the way to the final presentation of the EWE’s results. The EWL is not a report—it merely lists and motivates the major systemic risks and vulnerabilities, and provides broad policy recommendations to address them. Box 1 provides a summary of the topics identified during the Spring 2009 dry run.
About one month prior to the IMF Annual and Spring Meetings, the EWL is finalized jointly by IMF and FSB staff. For each risk scenario flagged by the EWL, staff of the IMF and FSB secretariat identify: (a) policy actions to mitigate risks and reduce vulnerabilities; and (b) suggestions for further analysis (“drill down”) in subsequent EWE rounds. In the process, the EWL is shared with the IMF’s Executive Board and members of the FSB.
At the same time, IMF and FSB staff also begin work on their presentation to the International Monetary and Financial Committee. Based on the List, the presentation is a self-contained and focused narrative, aimed at directing policy makers’ attention on the most pressing issues and areas where policy coordination could be the most beneficial. As many of the identified risks tend to be related to each other, the analysis focuses in particular on risk clusters and channels of contagion, examining overlapping vulnerabilities across sectors and countries that could interact to exacerbate a negative shock. Prior to the IMFC meeting, the IMF’s Board discusses the outcome of the EWE, following a restricted presentation.
Confidentiality is a critical aspect of the EWE. While the IMF and the FSB cooperate closely on all aspects of the exercise, utmost care is taken to maintain the confidentiality of information provided to either body in the course of their interaction with member countries. Moreover, since many aspects of the EWE’s analysis could be market sensitive, external communication is carefully calibrated, with key messages transmitted only to IMFC members. The deliberations following the presentation remain also confidential, and there is no separate public report on the outcome of the EWE (although dissemination takes place through other channels, see below).
13
Box 1. Early Warning List (Summary of the Spring 2009 Dry Run)
The dry run EWL was compiled during an unprecedented, synchronized global slowdown. Hence, most of the concerns reflected either a worsening of risks (beyond those already identified in the WEO and GFSR) or new risks sparked by possible market or policy responses, including the worst case scenario of a Great Depression-like outcome. Most of these risks were interrelated, especially over the short term, and the materialization of one could hasten the others and magnify their already large impact.
Against this background, the identified risks fell in the following general categories:
1. Deepening of the financial crisis and credit crunch.
1.1. Further collapse of market confidence in systemic financial institutions.
1.2. A further tightening in loan standards and dearth of credit, including for trade.
1.3. Rapid increases in funding costs and fall in rollover rates in emerging markets.
1.4. A rapid worsening of strains in payments and settlement systems.
2. Government financing risks and policy limitations.
2.1. Sharp increase in government borrowing costs across many countries.
2.2. Falling liquidity for primary sovereign issues.
2.3. Reduced foreign demand for reserve currency Treasury debt.
3. Prolonged global asset and goods price deflation.
3.1. Further large falls in the price of residential/commercial real estate and other assets.
3.2. Further financial pressures on nonbank institutions.
3.3. Deflation expectations becoming entrenched.
4. Myopic policy responses and protectionism.
4.1. Popular opposition to bank recapitalization and fiscal adjustment.
4.2. Increasing policy support for domestic financial retrenchment.
4.3. Calls for protectionist policies and competitive devaluations.
5. Disorderly exit from crisis measures over the medium term.
5.1. Increasing concern about long-term policy goals.
5.2. Rising long-term inflation expectations in countries with high debt.
5.3. An unexpectedly large increase in private saving.
5.4. Commodity options signaling rising risk of a price spike.

14
C. Collaboration with the FSB
The collaboration between the IMF and the FSB has been strengthened substantially through the EWE. The two bodies exchange information on an ongoing basis, and the close working relationship at the staff level is reflected in frequent interactions on technical and policy work. Discussions also take place at a senior level, helping define the broad modalities of the collaboration and the allocation of work on key themes during each round.
The FSB’s internal vulnerabilities assessment process draws on analyses by its membership and Secretariat, focusing on financial sector issues. The FSB assesses vulnerabilities in the financial system, the steps being taken to address them and policy options going forward. Many of the FSB’s members undertake quantitative and qualitative vulnerability assessments in their own institutions and through international bodies. Pooling this work contributes to a broader understanding of risks.
Key FSB structures for the EWE have been developed and are operational, involving active IMF participation. They include:
The Standing Committee on Assessment of Vulnerabilities (SCAV), chaired by the General Manager of the BIS, has a core mandate to assess, prioritize, and monitor vulnerabilities in the financial system, and propose remedial policy actions to the FSB. Almost thirty national authorities and international bodies are represented in the SCAV, including the OECD, the Committee on the Global Financial System (CGFS), as well as the IMF.
The Analytical Group on Vulnerabilities (AGV), chaired by the FSB Secretariat, is a sub-group of the SCAV in charge of overseeing and coordinating the analytical work that informs the latter’s discussions. The IMF is also represented in the AGV.
These FSB structures have been instrumental in mobilizing an increasing amount of policy and analytical knowledge to the benefit of the EWE. The pooling of expertise and perspectives represented in the wide FSB membership have provided important analytical inputs and supported the identification of appropriate policy action for the EWE in the regulatory and supervisory sphere. To illustrate, recent FSB contributions have focused on:
Risks of a late cycle credit squeeze that could undermine the nascent recovery, as a result of the combination of adverse factors, including mounting sovereign risks and refinancing pressures;
Vulnerabilities relating to interest rate risks in the financial systems, reflecting in part the strong incentives for carry-seeking flows;
Challenges in restarting securitization markets;
Policy recommendations focusing on addressing weak banks, gradually removing system-wide public support, as well as considerations related to the phasing in of various ongoing regulatory initiatives and reforms.

15
III. THE IMF’S CONTRIBUTIONS TO THE EWE
Fund staff contributes substantial qualitative and quantitative content to the EWE. The unique nature of crises inherently limits the ability of formal statistical tools to extract information that may be useful for identifying the next crisis. “Preparing to fight the last war” is an obvious pitfall. The EWE thus complements empirical analysis with more heuristic methods, including wide-ranging consultations, as well as judgment informed by economic expertise. Both approaches are complementary: quantitative methods provide a systematic basis for the identification and analysis of vulnerabilities and a useful cross-check on judgment; qualitative analysis helps identify new sources of vulnerabilities and assess consonance among the conclusions stemming from empirical work.7
Qualitative inputs are derived from a wide range of internal and external sources. Consultations with market participants, academics, think tanks, and country authorities help take stock of risk perceptions in a timely way:
Frequent market contacts and missions to large financial centers (New York, London, Hong Kong SAR, Singapore, etc.) help alert the EWE to fast-evolving risks and market concerns.
Conference calls with leading academics and ongoing discussions with think tanks benefit the EWE by drawing on a broad set of analytical experience.
Views from IMF country teams, IMF Executive Directors, and country authorities are incorporated to include insiders’ perspectives on vulnerabilities at an individual country and regional level.
On the quantitative side, the EWE is deeply embedded in the Fund’s multilateral surveillance. The discussion of the global outlook and risks in the IMF’s World Economic Outlook, the Global Financial Stability Report’s financial stability assessments, and the analysis of fiscal issues in the IMF Fiscal Monitor are complemented by analyses of global saving and investment trends, public and private sector balance sheet dynamics, and the direction, size and composition of capital flows among major economies.
More specifically, the IMF’s toolkit includes a large number of models used for detecting crisis risks and vulnerabilities (see Part II.)8 These are grouped into three major areas:
Sectoral and market vulnerabilities. A set of robust empirical risk indicators includes estimates of external financing gaps, indicators of external imbalances, estimates of asset price misalignments, and fiscal sustainability and financing
7The combination of quantitative and qualitative analyses in the EWE makes it difficult to assess its performance with respect to past crises. This is an area where further work is needed.
8Many of the empirical models have been or are expected to be published, allowing for professional peer review of the underlying analytics. References to papers are provided, where available.

16
analysis. Synthesizing forward-looking information implied by market prices helps anticipate changes in financial conditions.
Country Risk Models draw on analysis of sectoral and market vulnerabilities to empirically quantify probabilities for sharp changes in macroeconomic variables that are typically associated with a crisis. One set of models estimates the likelihood that a crisis could occur and forecasts the worst possible outcomes. Another model assesses potential crisis costs by estimating the likelihood of exiting a crisis after it has taken place.
Spillover and contagion across countries, markets, sectors, and large complex financial institutions (LCFIs). In addition to contagion through trade channels, measures of common distress across global financial institutions and nonfinancial firms, as well as across sovereigns and asset markets (e.g., equity and credit markets), and data on cross-border bank exposures help analyze the potential for country-to-country and LCFI contagion through bank lending channels.
The results obtained from the toolkit feed into the IMF’s Vulnerability Exercises for Advanced and Emerging Economies—the VEA and VEE (an exercise for low-income countries is being planned).9 Tools initially developed for advanced economies are increasingly used for emerging economies as well, although data availability is still a limiting factor for the VEE.10 Moreover, external risks feature larger for emerging markets, while financial sector risks receive, relatively speaking, and somewhat more attention in advanced economies. There is some overlap in country coverage between the two exercises, depending on countries’ risk characteristics.
The VEA and VEE summarize the EWE’s quantitative results. For each country, the model outcomes are aggregated first by sector (e.g., external, fiscal, etc.), and then across sectors to arrive at overall country risk ratings (see Section VIII.) This information is used as an input to assess regional and global vulnerabilities to different types of shocks. In addition to the EWE’s “permanent” tools, the two exercises also include ad-hoc analyses of special topics identified at the start of each round, either to follow up (“drill down”) on previously detected vulnerabilities, or to explore current issues and map their implications for global financial stability. Given the country-specific nature of the results, the results inform the EWE but are not circulated to the IMF’s Board or FSB members.
9The VEA covers 32 countries: Australia, Austria, Belgium, Canada, Cyprus, Czech Republic, Denmark, Finland, France, Germany, Greece, Hong Kong SAR, Iceland, Italy, Ireland, Israel, Korea, Japan, Luxembourg, Malta, New Zealand, Netherlands, Norway, Portugal, Singapore, Slovak Republic, Slovenia, Spain, Sweden, Switzerland, U.K., and the U.S. The VEE covers 56 countries: Algeria, Argentina, Bosnia and Herzegovina, Brazil, Bulgaria, Chile, China P.R., Colombia, Costa Rica, Croatia, Dominican Republic, Ecuador, Egypt, El Salvador, Estonia, Georgia, Guatemala, Hungary, Iceland, India, Indonesia, Israel, Jamaica, Jordan, Kazakhstan, Korea, Latvia, Lebanon, Lithuania, Macedonia, Malaysia, Mexico, Morocco, Pakistan, Panama, Peru, Philippines, Poland, Romania, Russia, Serbia, South Africa, Sri Lanka, Thailand, Tunisia, Turkey, Ukraine, Uruguay, Venezuela, and Vietnam.
10Over the medium term, the recommendations of the joint IMF/FSB G20 data initiative are expected to strengthen data availability across the external, fiscal, corporate, and financial sectors to support the EWE.

17
This methodological framework continues to evolve. Priority is given to widening the consultations and the development of additional quantitative tools to enable better assessment of signals from different models and indicators. The analysis of cross-sectoral and cross-border spillovers is also being improved to cover additional transmission channels, including between advanced and emerging economies. Subsequent additions or revisions to the EWE methodology will be reported in future editions of this paper.
IV. DISSEMINATING EARLY WARNINGS
The primary dissemination of the EWE results is through the presentation to the IMFC. It is generally followed by a detailed discussion, led by one or two IMFC members. Conclusions from this discussion inform policy formulation at the country level and international policy coordination going forward.
The EWE also informs the IMF’s flagship publications, including the World Economic Outlook, Global Financial Stability Report, and Fiscal Monitor. The baseline and downside risk scenarios analyzed by these publications provide a starting point and reference for the EWE. The EWE toolkit also includes various methodologies that are already part of the IMF’s multilateral work. In turn, the EWE’s analysis of tail risks and scenarios, as well as its policy recommendations inform the regional and global analysis of the WEO, the Regional Economic Outlooks, the GFSR and the Monitor. Although there is a clear conceptual delineation in the nature of risk assessments contained in these reports and the EWE, there is scope for overlap, as the EWE’s tail risks could be extreme versions of baseline risks. Being a confidential exercise, the dissemination of the EWE results through Fund publications is indirect and focuses on policy implications.
Importantly, the country-specific results of the EWE have become a key input for the IMF’s bilateral surveillance activities. In discussions with authorities, IMF staff often present the main results from the vulnerability exercises and policy implications relevant for the respective country, and the gist of such discussions is reflected in documents relating to the annual Article IV consultations. IMF teams have considerable discretion in how to use these results in country reports; in practice, the focus of such reports is naturally on risks closer to the baseline.
Outreach on the EWE has tried to balance the conflicting needs of ensuring confidentiality and transparency, while contributing to the debate on methodologies. This balance has been achieved by presenting the main EWE results only to high-level officials, while disseminating the EWE methodologies more broadly:
The EWE methodology was introduced to the public during a joint IMF-FSB workshop at the 2009 IMF Annual Meetings in Istanbul. While underscoring that much remains work-in-progress, the workshop provided an opportunity to engage with country authorities, financial analysts, and the press on issues related to the objectives, organization and analytical underpinnings of the EWE.
IMF staff has been presenting the EWE methodological framework and its analytical tools in conferences, policy and technical workshops, and high-level seminars

18
around the world. The targeted audience so far has included senior country officials, academics, think tanks, and market analysts.
An ongoing discussion and exchange of information and ideas on early warning methodologies help push out the EWE analytical frontier. IMF missions to systemic countries and capital markets around the world have also been vehicles to exchange views on EWE methodologies.
Preparations for hands-on-training seminars for country officials are in train, coordinated by the IMF Institute.


20
The following sections contain a description of the IMF’s empirical models and indicators used in the Early Warning Exercise (see Table 2.) As explained in Part I of this paper, the results obtained from these tools are updated at the start of each EWE round. They are used to complement the qualitative views obtained in internal discussions and with outside experts. The model outcomes also help IMF staff determine the country ratings in the Vulnerability Exercises for Advanced and Emerging Economies. The description reflects the shape of the toolkit as of September 2010; it will continue to evolve as instruments are being added, revised, or substituted out of the exercise.
Table 2. Overview of Empirical Models and Indicators in the EWE
Section V. Sectoral and Market Vulnerabilities
A. External Sector Risks and Vulnerabilities
Cross-border capital flows External financing gaps
External imbalances Probability of an external crisis
Exchange rate misalignments
B. Fiscal Risks and Vulnerabilities
Rollover and financing risks Sensitivity of public sector debt to adverse shocks
Markets’ perceptions of sovereign default risk Contagion risk from fiscal distress
The required scale of fiscal consolidation Probability of a fiscal crisis
C. Corporate Sector Risks and Vulnerabilities
Leverage, liquidity, and profitability Stock valuation and default probabilities
D. Asset Prices, Market Valuation and Bubble Spotting
Real Estate Bubbles Feedback loops between NPLs and macroeconomic performance Equity Market Bubbles
E. Financial Market Risk Attitudes
Global Financial Stability Map Asset and Market Volatility
Section VI. Country Risk Models
Crisis Risk Models Crisis Duration Models
GDP-at-risk
Section VII. Drawing Systemic Implications
A. Spillover and Contagion Analysis
Contagion and Spillover Tools using Financial Market Data
Contagion and Spillover Tools using Cross-Border Data
B. Analysis of Large Complex Financial Institutions (LCFI)
Vulnerabilities of Individual LCFIs Country-level Measures of Bank Vulnerabilities
Systemic Risk and Distress Spillovers
C. Global Scenarios
The Global Projection Model (GPM) Global Integrated Monetary and Fiscal Model (GIMF)
FISCMOD A Panel Unobserved Components Model

21
V. SECTORAL AND MARKET VULNERABILITIES
In addition to the discussion of global risks in the WEO and GFSR, the EWE regularly assesses vulnerabilities in different economic sectors and financial markets. The EWE is anchored on baseline projections and tail risks as analyzed by the IMF’s World Economic Outlook (WEO).11 While the tools in the Early Warning Exercise are used to assess tail risks, and thus look outside and beyond the baseline risks as contained in the WEO, any discussion of risks naturally starts with a view of fundamental developments in the global economy. For the EWE, these are organized—and discussed below—in the following groups:
External sector Fiscal developments Corporate sector Asset prices, market valuations and bubble spotting Financial Market Risk Attitudes
A. External Sector Risks and Vulnerabilities
External imbalances are implicated in many crises. Reliance on short-term funding, persistent current account deficits, and high levels of foreign currency debt have been frequent sources of vulnerabilities in emerging markets—and more recently also in advanced economies. They may reflect unsustainable consumption or asset price booms, or a loss of competitiveness. A collapse in investor confidence can lead to a sudden stop of capital inflows or, worse, a rush for the exit, triggering a crisis that could entail large output costs.
The indicators used to assess external risks and vulnerabilities include:
Cross-border capital flows. Capital flow levels and dynamics by sector and type, such as debt vs. non-debt.
11For details on the methodology of WEO fan charts, see Appendix 1.2 of the April 2009 WEO, as well as Elekdag, S., and P. Kannan, “Incorporating Market Information Into the Construction of the Fan Chart,” IMF Working Paper No. 09/178.
‐2000
-1500
-1000
-500
0
500
1000
1500
2000
2500
3000
2005Q1 2006Q1 2007Q1 2008Q1 2009Q1
Capital Inflows, Main Advanced Economies (in US$ billions)
Others Bank Portfolio FDI Total Inflows
Note: The analysis of external risks examines capital f lows by type and sector as a starting point for analyzing external risks and vulnerabilities.
Note: This chart from the IMF’s World Economic Outlook illustrates the IMF’s global growth forecast, as well as associated tail risks.
80
90
100
110
120
130
140
150
2007 2009 2011 2013 2015
WEO Baseline
WEO DownsideExtreme Downside
Real GDP Level

22
External imbalances. Trends in country’s current account balances and the resulting global imbalances; and sectoral imbalances of household, corporate, and public sectors.
Exchange rate misalignments. The extent of a country’s exchange rate misalignment as assessed by the IMF’s CGER methodology.12
External financing gaps. External financing gaps for emerging markets are calculated under various adverse scenarios, akin to an external stress test.
Probability of an external crisis. Indicators of external indebtedness and maturity mismatches are examined for different sectors of the economy with a view to evaluating the probability of an external crisis (see section VI.)
B. Fiscal Risks and Vulnerabilities
Concerns over fiscal solvency can precipitate a crisis. Persistent fiscal imbalances result in high levels of public sector debt that could raise concerns about sustainability, threaten macroeconomic stability, and weigh on economic growth. If fiscal weaknesses are not addressed, countries could lose access to market financing, and the eventual adjustment could entail sharp losses in employment and output.
The EWE methodology captures fiscal risks along multiple dimensions. A number of analytical tools and indicators are used to rank advanced economies and emerging markets. These rankings are then combined with equal weights into an overall fiscal risk rating (corresponding to a Fiscal Risk Heat Map). The analytical components of the fiscal rating include the following:
Rollover and financing risks. Large annual gross funding needs could indicate vulnerability to short-term financing pressures; the average amount of debt amortization in future years helps assess medium-term vulnerability.
Markets’ perceptions of sovereign default risk. High-frequency indicators based on sovereign CDS spreads (the direct cost of seeking insurance against sovereign
12See Lee, J., G. M. Milesi-Ferreti, J.D. Ostry, A. Prati, and L.A. Ricci, 2008, “Exchange Rate Assessments: CGER Methodologies,” IMF Occasional Paper No. 261.
Overall ranking
Rollover and financing
Market risk assessment
Medium-term adjustment need
Long-term adjustment need
Impact of a growth shock
Contagion risk
Fiscal crisis risk
Country 1 2 1 2 2 2 2 2 2
Country 2 2 0 2 2 1 1 1 2
Country 3 2 2 1 2 1 2 0 1
Country 4 2 1 2 1 0 2 2 1
Country 5 2 2 2 0 0 2 1 2
Country 6 0 1 1 2 1 2 1
Country 7 1 2 0 2 2 1 0 1
Country 8 1 2 1 0 1 2 0 2
Country 9 1 1 0 1 0 1 1 2
Country 10 1 0 1 2 0 2
Country 11 1 0 0 1 1 1 0 1
Country 12 1 0 0 2 0 0 1 1
Country 13 1 0 1 0 2 0 1
Country 14 0 1 1 0 0 0 1
Country 15 0 0 0 0 0 1 0 1
Country 16 0 0 0 0 1 0 1
Country 17 0 0 0 0 0 0 0 1
Country 18 0 0 0 0 0 0 1
Country 19 0 0 0 0 1 0 0
Country 20 0 0 0 1 0 0 0
Country 21 0 0 0 0 0 0 1
Country 22 0 0 0 0 0 0 0 00.0 0.0 0.0 0.0 0.0 0.0 0.0
Advanced Economies: Fiscal Risk Heat Map
Note: This chart provides an illustration of the Fiscal Risk Heat Map that is used to map fiscal risks for advanced economies. The overall ranking combines various aspects of fiscal risks, while each aspect of risk is measured using multiple indicators and/or models. Red, yellow and green indicate high, medium and low fiscal vulnerabilities respectively. Country names are withheld for confidentiality reasons.

23
default), and Relative Asset Swap (RAS) spreads (the spread between bond yields and corresponding fixed interest rates) capture the risk premium charged by investors on government bonds, as well as their expected losses in the event of sovereign defaults. Moreover, term risk premiums are compared with model- determined fundamentals.
The scale of fiscal consolidation required in the medium- and long-term to restore fiscal sustainability. This is determined by the required adjustment in the structural primary balance to achieve a targeted gross public debt ratio (e.g., 60 percent of GDP for advanced economies) over the medium term; and the required adjustment in the primary balance to satisfy the intertemporal budget constraint and stabilize the debt ratio in the long-term, taking into account demographic trends and aging costs.
Sensitivity of public sector debt to adverse shocks. This methodology assesses the impact of an adverse growth shock on the debt dynamics in both advanced and emerging economies. For the latter, currency crises and interest rate shocks are also considered.
Contagion risk from fiscal distress in other economies. A tool that measures distress dependence (see section VII) is used to extract information from sovereign CDS spreads to compute the probability of sovereign distress in one country, given distress in another country. This approach recognizes that sovereign CDS spreads tend to increase simultaneously during crises, reflecting market contagion.
Probability of a fiscal crisis. An empirical crisis model is used to relate the probability of a sharp fiscal adjustment to a range of past and present economic indicators (see section VI.)
C. Corporate Sector Risks and Vulnerabilities
Corporate sector vulnerabilities have played an important role in some of the past crises (e.g., the East Asian financial crisis in the late 1990s). Vulnerabilities in this sector have obvious implications for the real economy and financial developments in both advanced and emerging economies. The following indicators are relevant:
Leverage, liquidity, and profitability. A deterioration in financing conditions or a growth shock are more likely to have an adverse impact in countries where the corporate sector is more leveraged, has lower liquidity on hand, or is less profitable. Hence, the EWE monitors trends in corporate balance sheets for profitability, liquidity, and leverage.
Stock valuation and default probability. High levels of stock valuation may indicate overheating or an asset bubble, especially if accompanied by an increasing default probability. Default probabilities are computed using information embedded in option prices.

24
D. Asset Prices and Market Valuations
Asset price bubbles can inflict lasting damage to real economic activity when they burst. Asset price bubbles don’t always self-correct through market forces—indeed, they can be self-reinforcing, especially if fueled by financial leverage and easing of credit standards. Even market participants who have detected a bubble may not trade to eliminate it as, for some time, riding it may be more profitable than trading against it.13 When a bubble eventually does burst, wealth effects and credit deleveraging depresses business and household spending, weakening economic activity and increasing credit market risk.
Real Estate Markets
Real estate markets have come to the fore following their role in the 2007–08 global financial crisis. From a historical perspective, two out of five real estate market downturns have been associated with systemic banking crises in advanced economies. EWE tools assess vulnerabilities in both residential and commercial real estate market segments. The analysis is conducted separately, given different characteristics of demand and supply conditions determining property valuation and financing options in each market.
The vulnerability to a misalignment in residential real estate depends on the extent of linkages with the broader economy. Even when house prices are misaligned, a potential correction represents a threat only if residential real estate markets are closely linked with the financial sector and the rest of the economy. Hence, the EWE summarizes vulnerabilities in advanced economy residential real estate markets by an index that comprises estimates of price misalignment, potential impact on economic activity, household balance sheets, and mortgage market characteristics (Box 2).14 Although somewhat hampered by data availability, similar indicators are also used to assess vulnerabilities in emerging markets.
Commercial real estate markets may come under pressure because of weak economic activity or because of difficulties in rolling over financing obligations. Given high leverage of developers and reliance on rent income to cover debt payments, rents and vacancy rates are good indicators of capital values. This information is analyzed together with the ratio of planned construction to currently available floor space to evaluate demand-supply equilibrium. Hence, the Real Estate Vulnerability Index for Commercial Markets includes changes in rents and vacancy rates, as well as construction activity.
13See Abreu, D., and M. Brunnermeier, 2003, “Bubbles and Crashes,” Econometrica, Vol. 71, No. 1, pp. 173–204; and Kohn, D., 2009, “Monetary Policy and Asset Prices Revisited,” Cato Journal, Vol. 29, No. 1, pp. 31–44.
14A Vector Auto-Regression (VAR) model for advanced economies helps quantify the dynamic effects and spillovers of shocks from the housing market to the rest of the economy.

25
Box 2. Measuring Real Estate Vulnerabilities
Components in the IMF’s Residential Real Estate Vulnerability Index
Price misalignment1 Impact on economic activity
Price-to-income ratio Contribution of residential investment Price-to-rent ratio Correlation between house prices and consumption
over the past ten years Price gap estimate (Error correction model) Duration of house price cycle: Historical Estimated impact on GDP of a house price drop (VAR) Amplitude of house price cycle: Historical Duration of house price cycle: Current Amplitude of house price cycle: Current
Household balance sheets Mortgage market characteristics
Mortgage-debt-to-GDP ratio (MD) Loan-to-value ratio Deviation of MD from trend Portion of fixed rate mortgages Interest burden Term of typical loan Lending standards (Survey information) Home ownership rate Mortgage loan growth rate 1Measures of misalignment in house prices are based on deviations of valuation ratios from historical averages (price-to-rental and price-to-income ratios). For advanced economies, an error-correction regression model is used to estimate a long term equilibrium relationship between house prices and income, with short term changes in house prices due to demand factors. Supply factors, proxied by construction costs, are assumed to impact changes in house prices only in the long run.
0.0
0.1
0.2
0.3
0.4
0.5
0.6
0.0 0.1 0.2 0.3 0.4 0.5 0.6
Str
uc
tura
l V
uln
era
bil
ity
Fa
cto
rs 1
/
Price Misalignment
Increasing vulnerability
Bubble size shows the overall vulnerability.
1/ This is an illustration of the EWE tools that measure the interaction between household balance sheets, mortgage market characteristics, and potential impact of price misalignment on GDP. The bubbles represent countries, but names are withheld, for confidentiality reasons.
Residential Real Estate Vulnerability Index

26
Equity Markets
Sharp equity market corrections can be a source of risk for several sectors. A sharp and sustained drop in equity prices can adversely affect both the household sector, through negative wealth effects, and the corporate sector, through higher cost of capital. Equity markets could be subject to a sharp correction when equity prices are significantly above their estimated ‘fair value’. For advanced economies, measures of ‘fair value’ are determined using three approaches: valuation multiples, dividend discount models and arbitrage pricing models (Box 3).15 The final assessment combines the findings of these three approaches, as each of them emphasizes different and complementary aspects of equity market valuation. Because of data availability constraints, equity market overvaluation for emerging markets is assessed only by the valuation multiples method.
Feedback Loops between NPLs and Macroeconomic Performance
During severe economic shocks or a sharp slowdown, negative feedback loops between nonperforming loans (NPL) and macroeconomic performance could develop. Such links between NPLs and macroeconomic variables are assessed empirically using econometric models.16 Model estimates are used to forecast changes in NPLs based on WEO projections of main macroeconomic variables. In a second step, staff highlights possible increases in NPLs following a house price correction in countries with misaligned house prices, or a severe growth slowdown.
E. Financial Market Risk Attitudes
In today’s highly integrated global financial system, market sentiment and volatility in itself can be an important source of vulnerability and spillovers. During times of elevated market uncertainty, even a temporary shock can lead to market turmoil and significant aftershocks, and perpetuate adverse feedback loops though macro-financial
15Valuation multiples estimates the ‘fair value’ of equities by comparing current equity prices with various balance sheet measures of corporate performance such as earnings, dividends, and book values of assets. The dividend discount model estimates the ‘fair value’ of equities by discounting expected future dividends. The arbitrage pricing model is based on the premise that changes in equity prices are driven by market ‘surprises’ to underlying stock fundamentals.
16The estimates are derived from a fixed-effects panel regression and a panel VAR model.
-1.0
-0.6
-0.2
0.2
0.6
1.0
1.4
1.8
-1.8 -1.4 -1.0 -0.6 -0.2 0.2 0.6 1.0 1.4 1.8 2.2 2.6 3.0 3.4 3.8 4.2 4.6 5.0
Pro
jec
ted
an
nu
al c
ha
ng
e in
NP
L ra
tio
s in
20
10
(p
erc
en
tag
e p
oin
ts)
Deviation of NPL ratios from the 2009 sample median (percentage points)
NPL Positioning in 2009 and Short-term Risk
Note: This chart illustrates projections of deterioration in nonperforming loans by country owing to macroeconomic conditions.Bubbles represent countries, but names are withheld for confidentiality reasons.The countries with red bubbles have higher NPL levels in 2009.
Bubble colors and sizes relate to 2009 NPL levels

27
linkages. To gauge financial markets’ risk attitudes, the EWE not only deploys tools that extract market sentiments from asset prices, but also relies on market intelligence and staff judgment, as in its often quoted Global Financial Stability Map.
Box 3. Estimates of Equity Market Misalignment
DDM 2/ APM Local 3/ APM Global /4Forward Price-to-Earnings /5
Composite of Backward Looking
Valuation Ratios /6
Country 1
Country 2
Country 3
Country 4
Country 5
Country 6
Country 7
Country 8
Country 9
Country 10
Country 11
Country 12
Country 13
Country 14
Country 15
Legend: z = z-score
z ? -1 Signifies undervaluation
z = 0
z ? 1 Signifies overvaluation
3/ Arbitrage Pricing Theory model (APM).
4/ Version of the APM adding a 'global factor' to measure residual surprises on a global level.
5/ Ratio of price to analysts' consensus expectations for earnings over the next 12 months.
5/ Backward looking valuation ratios of price to measures of corporate performance over the previous 12 months. Composite is the simple average of the z-scores of four ratios: price-to-earnings, dividend yield (the inverse of price-to-dividends), price-to-cash flows and price-to-book value.
Equity Market Misalignments Illustration 1/Z-scores at June 2010
Deviation between Market and Model Prices Valuation Ratios
1/ Misalignments are measured by the z-score of the deviation between the market and model prices and the z-score of the valuation ratios. Averages and standard deviations between 1990 and June 2010.
2/ Dividend Discount Model (DDM).

28
Global Financial Stability Map The global financial stability map (GFSM) provides a graphical representation of the IMF’s assessment of financial stability. It captures a diverse range of potential sources of instability, contagion among different segments of financial markets, and nonlinearities in underlying factors:17
Macroeconomic risk captures the potential for macroeconomic shocks (lower growth, inflation or deflation, and sovereign risks) to trigger a sharp market correction, given existing conditions in capital markets.
Credit risk measures credit stress in household and corporate balance sheets. Credit derivatives, delinquency rates and expected defaults are used to capture risks in the bank and nonbank sectors.
Market and liquidity risks assess the potential for heightened pricing risks that could result in broader spillovers and/or mark-to-market losses, as well as stress in funding markets and liquidity conditions in secondary markets.
Emerging market risk represents risks to global financial stability stemming from emerging market asset classes, and focuses on underlying vulnerabilities in emerging markets.
Risk appetite measures the willingness of investors to take on additional risk by increasing exposure to riskier asset classes; and,
Monetary and financial conditions gauge the stance of monetary policy and the availability and cost of funding.
Estimating Volatility in Financial Assets and Markets One simple way of tracking risk perceptions in financial markets is to relate descriptive statistics across a range of markets. For example, staff measures the level and one-month volatility of spreads, prices, and total returns of major asset classes relative
17Details on the construction of the GFSM can be found in Annex 1.1 of the April 2010 GFSR, as well as in Dattels, P., R. McCaughrin, K. Miyajima, and J. Puig, “Can You Map Global Financial Stability?” IMF Working Paper No. 10/145.
Market and liquidity risks
Macroeconomic risks
Monetary and Financial Risk appetite
Risks
Emerging market risks Credit risks
Source: Fund staff estimates. Note: Closer to center signifies less risk, tighter monetary and financial conditions, or reduced risk appetite.
April 2009 GFSR October 2009 GFSR April 2010 GFSR
Conditions

29
to their medium-term average. These cover markets such as corporate credit, RMBS (prime and subprime), commercial MBS, money markets, financial institutions, and emerging market assets, and are being compiled in a heat map to visualize key developments.
A tool to measure the global price of risk uses information embedded in the co-movement of asset returns. A multivariate Bayesian framework is used to model asset returns as a function of the global price of risk and their inherent risk. As illustrated in the accompanying chart, the model captures changes in global risk appetite over time.
Finally, market conditions are analyzed to identify structural breaks in volatility. Regime-switching models are used to identify periods when, for example, tranquil market periods turn into medium or high volatility states, or the latter revert to more tranquil periods.18 In the example depicted here, the model is applied to several currencies on the foreign exchange market, but the analysis applies in a similar way to other asset markets, such as interbank and bond market interest rates, CDS spreads, and equity markets.
VI. COUNTRY RISK MODELS
This section describes country risk models that draw on analysis of sectoral and market vulnerabilities, to empirically quantify tail risks. Although the timing of a crisis is difficult to predict, the level of underlying vulnerabilities can be used to estimate the likelihood that one could occur and forecast the worst possible outcomes. Similarly, although 18See González-Hermosillo, B., and H. Hesse, 2009, “Global Market Conditions and Systemic Risk,” IMF Working Paper No. 09/230.
0
200
400
600
800
1000
1200
0
200
400
600
800
1000
1200
Jan
-07
Jul-0
7
Jan
-08
Jul-0
8
Jan
-09
Jul-0
9
Jan
-10
August 9, 2007–BNP Paribas' funds suspension
March 10, 2008–liquidity problems at Bear Stearns
September 15, 2008–Lehman Brothers filed for bankruptcy protection
March 18, 2009–FOMC's decision to purchase up to $300 billion of U.S. Treasury securities
May 7, 2009–Release of U.S. bank stress test results
Estimated Probability Distribution of the Global Price of Risk 1/(Basis points)
Note: This chart illustrates a tool that maps investor risk appetite. There is a 50 percent chance that the global price of risk will be inside the blue shaded range, and a 90 percent chance probability that the outturn will be inside the blue or purple shaded area.
Note: This chart illustrates a Markov-Switching model that is used to map shifts in foreign exchange markets volatility for key global currencies. Red, yellow and green indicate high, medium, and low volatility respectively.
Currency 1
Currency 2
Currency 3
Currency 4
Currency 5
Currency 6
Currency 7
Currency 8
Currency 9
Jan-07 Jun-07 Jun-08 Jan- 09 Jun- 09 Jan-10
Structural Breaks in Foreign Exchange Volatility

30
the timing of exiting a crisis is difficult to predict, the level of underlying vulnerabilities can be used to estimate the likelihood of exiting a crisis after it has taken place. The models discussed below quantify these tail risks by identifying vulnerabilities that played a significant role in past crises, and comparing their current level with past crisis levels.
Crisis Risk Models: Estimating the Likelihood of a Crisis
Crisis risk models quantify countries’ overall vulnerability to crises. The models estimate a probability of a country undergoing one of each of the following types of crisis:
For modeling purposes, a “sudden stop” is identified when a country experiences a sharp and sudden reversal in capital flows, augmented with judgment based on country characteristics.
A financial crisis is defined by either a banking crisis or a currency crisis. The first is identified when a country’s corporate and financial sectors experience a large number of defaults and financial institutions and corporations face great difficulties repaying contracts on time, with the result that NPLs rise sharply. The second is identified as a nominal depreciation of the currency of at least 30 percent that is also at least a 10 percent increase in the rate of depreciation compared to the year before.19
A growth crisis is identified when the difference between GDP growth in year t and the average between years t-5 and t-1 is in the bottom 5 percent of the sample.
A fiscal crisis is defined as an increase in the cyclically adjusted primary balance as a ratio to GDP of at least 2.5 percentage points, from a negative balance of at least 2.5 percentage points, during the course of the year.
External “sudden stops” and fiscal and financial crises are considered for emerging economies; and financial, fiscal, and growth crises for advanced economies.
These models take a cross-sectoral empirical approach. The models are based on an array of indicators capturing vulnerabilities that stem from, or are centered in, the external, public, financial, nonfinancial corporate or household sectors (Box 4). Recognizing that imbalances build up over time, some of these indicators are intended to signal the “boom” phase before a crisis (for example, a rapid increase in house price during recent years). Other indicators capture risks of a more imminent “bust” (for example, a spike in options-implied corporate default probabilities). Hence, developments in the years leading up to the crisis are considered along with more recent indicators.
19For more details on the financial crisis definitions, see Laeven, L., and F. Valencia, 2008, “Systemic Banking Crises: A New Database,” IMF Working Paper No. 08/224.

31
Box 4. Crisis Risk Models Methodology
The assessment of vulnerabilities in the crisis risk models is based on a non-parametric approach. Having identified the types of crises, the methodology establishes which potential indicators of crisis vulnerability are correlated with crisis events. For every vulnerability indicator, the methodology identifies a threshold that minimizes the misclassification errors between crisis and noncrisis events. Each vulnerability indicator is assigned a weight based on its predictive power. As the nature and origin of the crisis vary between advanced and emerging economies, so do the relevant indicators and their weights. A composite indicator is then constructed by taking a weighted average of the flags raised by each of the indicators, and feeds into a vulnerability assessment and calculations of crisis probability.
Calculating the thresholds. For each vulnerability indicator, Xi , an algorithm is run to identify the optimal threshold value Xi
*, so that Xi ≥Xi* predicts a crisis. The value
Xi* is chosen to minimize the sum of the fraction of noncrises called as crises and
the fraction of crises missed. As crises are rare events, the methodology puts a higher weight on not missing crises—motivated by the high costs associated with crises and the benefits associated with being able to call a crisis early and take mitigating steps. Determining weights. The weights of individual indicators are determined on the basis of the goodness of fit of the threshold. Defining:
zi = fraction of crises missed + fraction of noncrises misclassified, the methodology uses wi = (1 - zi) / zi as the indicator of the goodness of fit of the threshold rule. This information is used to weight indicators into an aggregate score. The weights are adjusted to offset the impact of correlation among the indicators by treating correlated indicators as a group, to reflect their collective predictive ability. A binary variable Di is assigned for each vulnerability indicator that takes a value of 1 if it lies in the crisis-prone side of the threshold rule and zero otherwise. Finally, the methodology can map an estimated crisis probability to each value of D, given by the percentage of observations within the sample with values of D above this value which are also crisis observations.
A description of indicators that turned out statistically significant for advanced and emerging economies is provided in the table below.

32
Box 4. Crisis Risk Models Methodology (concluded)
Empirical Crisis Models: Indicator Variables Advanced Economies
Emerging Markets
Medium Term Variables Real GDP Growth √ House Prices √
Stock Prices √ Private Credit √ Construction sector contribution to GDP growth √
Financial sector contribution to GDP growth √ “Near-term” variables
External Sector Reserve Coverage of Short Term Debt and Projected Current Account Deficit
√
Current Account/GDP √ √
External Debt/GDP √ √ External Debt/Exports of Goods and Services √ Real export growth √
Real Effective Exchange Rate Overvaluation √ CGER Current Account Norm Deviation √ Private sector external debt √
Public Sector
General Government Balance/GDP √ √
Primary Gap √ √ General Government Gross Debt/GDP √ √ Public Debt Exposed to Currency Risk √
Public Debt Exposed to Rollover Risk √ Government Revenue, percent change √
Financial Sector Inflation √ Capital Adequacy Ratio (Banks) √ √
Return on Assets (Banks) √ √ Nonperforming loans (in percent of total loans) √ √ Annual Change in Private Sector Credit to GDP ratio √ Dummy for Institutional/Structural weakness √
Bank cross-border inflows (percent change) √ Loan/deposits ratio √
Corporate Sector Black-Scholes-Merton Default Probability (Corporate) √ √ Return on Assets (Corporate) √ √
Price/Earnings Ratio (Corporate) √ √ Interest Coverage ratio √ Debt/Assets √
Household Sector
House Price Acceleration √
Stock Price Acceleration √ √ Household Liabilities/GDP √ Interaction (Household Liabilities)*(Medium-Term House Price
Increase) √
Interaction (Household Liabilities)*( House Price Acceleration) √
Note: These indicators are used to model external “sudden stops”, fiscal, and financial crises for emerging economies, and financial, fiscal, and growth crises for advanced economies.

33
Forecasting Worst Possible Outcomes for Financial and Real Activity
Systemic tail risks in the real and financial sectors are estimated using a set of forecasting models for advanced economies.20 Systemic real risk is measured by GDP-at-Risk (GDPaR), defined as the worst predicted realization of quarterly growth in real GDP at 5 percent probability. Systemic financial risk is measured by an indicator of Financial System-at-Risk (FSaR), defined as the worst predicted realization at 5 percent probability of the market-adjusted equity return of a large portfolio of financial firms. Multivariate dynamic factor models are used with a large set of quarterly time series of indicators of financial and real activity to produce forecasts of indicators of systemic real and financial risk as well as forecasts of their distributions—results are also incorporated in scenario analysis.
Crisis Duration Models: Estimating the Likelihood of Exiting a Crisis Assuming that a crisis has occurred, duration models can provide estimates of the probability of exiting the crisis and identify factors that could facilitate such exit. While there is abundant literature on the roles of macroeconomic factors played in the events of banking crises, the factors that determine when a country would exit a banking crisis have received scant attention. The EWE analysis suggests that initial conditions (e.g., precrisis external balances, external debt, fiscal indicators, and domestic demand), domestic economic developments (e.g., real GDP growth, and changes in domestic demand), and government policies in response to the crisis (i.e., fiscal stimulus) play a significant role.21 Clearly, many of these variables also determine an economy’s likelihood to have a crisis in the first place.
VII. DRAWING SYSTEMIC IMPLICATIONS
Subsequent to the identification of vulnerabilities and crisis risks, the EWE seeks to understand how transmission channels could magnify these risks. This involves “drilling down” in areas identified as having heightened vulnerabilities.
A. Spillovers and Contagion Analysis
The EWE uses complementary contagion and spillover tools to assess a country’s vulnerability to shocks from other economies. Models that can be used for this purpose broadly differ on whether they rely on high-frequency market data for financial transactions, or on data capturing the network of mutual financial and trade exposures. The former include measures of distress dependence and extreme tail dependence, as well as analysis of bond market spillovers. The latter include models of cross-border bank contagion, based on BIS data, and models of spillovers through trade channels.
20De Nicolò, G., and M. Lucchetta, 2010, “Systemic Risks and the Macroeconomy,” IMF Working Paper No. 10/29.
21The empirical model draws on Mecagni, M., R. Atoyan, D. Hofman, and D. Tzanninis, 2007, “The Duration of Capital Account Crises—An Empirical Analysis,” IMF Working Paper No. 07/258.

34
Contagion and Spillover Tools using Financial Market Data A Distress Dependence Framework analyzes the propagation of financial stress affecting a financial institution, corporate, or sovereign. This framework examines dependence (i.e., spillover effects) among major financial institutions, corporations, or sovereigns—essentially any entity underlying a CDS contract.22 Outputs include estimates of conditional probabilities of distress among any two entities in a given sample, assuming either a specific member or a subgroup of the sample gets distressed (for computational reasons, the sample is limited to up to 17 entities at the same time). This approach is superior to traditional risk models, as the latter usually account only for linear dependence (correlations), which tends to remain constant across various market conditions.23
A similar tool to analyze tail risks is based on Multivariate Extreme Value Theory (EVT). As in the distress dependence model, this methodology constructs a non-parametric measure of tail dependence.24 While both frameworks produce time-varying and state-varying dependence functions, the EVT utilizes primarily data sets in the form of time-series, while distress dependence requires cross-sectional observations. The EVT model is applicable to various types of asset returns data, including credit, equity, exchange rates, and interest rates—while the distress dependence model is best suited for credit-related instruments that capture probabilities of distress.
22Segoviano, M., 2006, “The Consistent Information Multivariate Density Optimizing Methodology,” Financial Markets Group, London School of Economics, Discussion Paper No. 557; Segoviano, M., and C. Goodhart, 2009, “Banking Stability Measures”, IMF Working Paper No. 09/04.
23Conventional correlation coefficients are misleading in the presence of skewed distributions and high volatility, mainly because they detect only linear dependence between two variables whose marginal distributions are assumed to be distributed normally—an ideal assumption that is rarely encountered in practice.
24For further information on this methodology, see Jobst, A. A., and H. Kamil, 2008, “Stock Market Linkages between Latin America and the United States During ‘Tail Events’” in Latin American Linkages to Global Financial Market Turbulence, Western Hemisphere Department: Regional Economic Outlook, IMF; Gray, D. F., and A. A. Jobst, 2010, “Using the CCA Framework to Estimate Potential Losses and Implicit Government Guarantees to the U.S. Financial Sector,” U.S. FSAP Technical Note, and “New Directions in Financial Sector and Sovereign Risk Management,” Journal of Investment Management, Vol. 8, No.1, pp. 23–38; Gray, D. F., A. A. Jobst, and S. Malone, “Quantifying Systemic Risk and Reconceptualizing the Role of Finance for Economic Growth,” Journal of Investment Management, Vol. 8, No. 2 (forthcoming).
0.0
0.1
0.2
0.3
0.4
0.5
0.6
0.7Ja
n-0
1
Jul-
01
Jan
-02
Jul-
02
Jan
-03
Jul-
03
Jan
-04
Jul-
04
Jan
-05
Jul-
05
Jan
-06
Jul-
06
Jan
-07
Jul-
07
Jan
-08
Jul-
08
Jan
-09
Jul-
09
Jan
-10
Country 1 Country 5 Country 4 Country 2 Country 3 Country 6 Country 7
Note: This chart illustrates the use of multivariate Extreme Value Theory to estimate the source and magnitude of vulnerabilities to interest rate shocks.
De
pe
nd
en
ce
Me
as
ure
Individual Country Contribution to Joint Probability of Interest Rate Shocks
(Multivariate Dependence Structure)beginning of credit crisis
Lehman collapse

35
A separate model identifies the determinants of U.S. corporate bond spreads from cash flows available to issuers and buyers. Given the size of the U.S. corporate sector, increases in U.S. corporate spreads can cause funding pressures for financial and corporate sectors worldwide. Against this background, the EWE methodology incorporates variables representing the business cycle, equity prices, and financial constraints to capture the effects of stress in various economic sectors on corporate spreads.25
Finally, a tool traces the transmission of advanced economy yield shocks to emerging markets. A panel regression approach is used to model the impact of an increase in advanced economy bond yields on emerging markets bond yields.
Contagion and Spillover Tools using Cross-Border Data26
The cross-border bank contagion tool analyzes potential spillover effects arising from bilateral connections of international banks’ activities:27
It provides measures of vulnerabilities caused by creditor countries’ exposures to main borrowers (downstream risk measure) and borrowers countries’ exposures to main creditors (upstream risk measure).
It relies on scenario analysis to assess the propagation of financial sector shocks across borders. The simulations illustrate the impact of shocks originating in advanced and emerging economies that have been identified as vulnerable on international banks’ balance sheets (Figure 2). Responding to the resulting losses, the banks deleverage and contract their international balance sheets. If the shocks are large enough to make some banks insolvent, or cause interbank funding difficulties, the deleveraging could be amplified. The possibility of recapitalization allows a simulation of how policy reactions could mitigate this deleveraging process.
Trade spillover risk indicators help identify advanced economies that are vulnerable to a crisis originating in an export destination or an import source. Data on export shares are combined with crisis probabilities to compute the weighted probability of a crisis in export destinations. An analogous measure is computed to derive a weighted probability of a crisis in an import source country.
Finally, scenario analysis quantifies the impact of changes in trade policy. A dynamic general equilibrium model of the world with five regions (the U.S., China, Euro area and Japan, Emerging Asia excluding China, and rest of the world) is used to simulate the impact of changes in tariffs on trade and output.
25Box 1.5 of the April 2009 GFSR discusses this model in more detail. 26For more details, see Tressel, T., “Financial Contagion through Bank Deleveraging,” IMF Working Paper (forthcoming). Work is underway to extend this analysis to the nonbank financial sector.
27BIS consolidated banking statistics are used to construct a multilateral, Leontief type input-output matrix of cross-border lender-borrower exposures.

36
B. Analysis of Large Complex Financial Institutions (LCFI)
The recent global financial crisis proved the need to pay close attention to systemic financial institutions. The sheer size, organizational complexity, and cross-border exposures of LCFIs suggest systemic risks for a region or the global economy.28
The EWE uses a range of tools to assess vulnerabilities related to LCFIs, especially those in Europe and the U.S. The tools utilize various complementary analyses: (1) vulnerability indicators for individual LCFIs derived from balance-sheet and market data; (2) assessment of systemic risks and distress spillovers across LCFIs; and (3) country-level measures of LCFI-related vulnerabilities.
Vulnerabilities of Individual LCFIs Combining indicators derived from balance-sheet data with market data yields a broad perspective on vulnerabilities of individual LCFIs. The analysis combines the forward-looking market perspectives with backward-looking fundamentals-based indicators to determine the most vulnerable institutions.
28In the context of the joint IMF/FSB G20 data initiative, work is ongoing to monitor LCFIs’ exposures to financial sectors and national markets.
Figure 2. Coverage of Bank Spillover Analysis
Note: A global mapping tool helps visualize international spillovers from various shocks (including between advanced and emerging economies) in a succinct way. Different colors help indicate the severity of the shock.
Advanced EconomiesEmerging Economies

37
Fundamentals-based analysis includes: selected financial soundness indicators to evaluate credit default risk; models linking market CDS spreads to measures of risk on loan and trading books, profitability, and cost efficiency of LCFIs to calculate fundamentals-implied CDS spreads; and debt maturity analysis to assess funding risks.
Market-based indicators include: market CDS spreads, which provide the credit market investors’ perspectives on distress risks; equity-implied CDS spreads, which provide the equity investors’ perspectives on distress risks; and risk-reversals measures, which provide the market’s assessment of future equity price changes (buying or selling pressures).
Systemic Risk and Distress Spillovers across LCFIs Indicators of the likelihood of joint distress or distress spillovers across LCFIs are constructed from CDS data using the distress dependence methodology discussed above (Figure 3). These distress spillover measures are used as a first step in screening for potential channels of distress transmission between LCFIs, and are complemented with a qualitative analysis of linkages between these institutions. In a significant additional step, the distress dependence methodology is also used to examine spillovers between LCFIs and sovereigns.29
29Norat, M., 2010, “Probability-Based Distress Linkages between Sovereigns and LCFIs.”
Figure 3. Systemic Risk and Distress Spillovers across LCFIs
Note: These charts illustrate an application of the distress dependence methodology for Large Complex Financial Institutions. Groups 1–4 are regional groups of LCFIs. The Banking Stability Index is the expected number of LCFIs falling in distress, conditional on at least one LCFI experiencing distress. The Joint Probability of Distress is the probability that all LCFIs in the group could experience distress simultaneously.
1
1.5
2
2.5
3
3.5
1
1.5
2
2.5
3
3.5
Jan 07 Jul 07 Jan 08 Jul 08 Jan 09 Jul 09
Banking Stability Index ( by group)
Group2
Group3
Group4
Group1
0
0.0001
0.0002
0.0003
0.0004
0.0005
0.0006
0
0.0001
0.0002
0.0003
0.0004
0.0005
0.0006
Jan 07 Jul 07 Jan 08 Jul 08 Jan 09 Jul 09
Joint Probability of Distress ( by group)
Group1Group3Group4Group2

38
Country-level Measures of Bank Vulnerabilities
A country-level bank vulnerability measure is computed as a weighted average of the fundamentals-implied CDS spreads for the largest banks domiciled in a given country. This measure is most informative if it includes institutions that account for most of banking assets in a given country. So, whenever warranted, the sample is expanded to include second-tier, though not necessarily publicly traded, financial institutions.
C. Global Scenarios
A number of large IMF macroeconomic models are used in simulations of global risk scenarios. Typically, such models are global and multi-regional, and capture the interaction of different parts of the world economy. In addition, the EWE’s analytical toolkit includes small-open-economy models that take events in the rest of the world as given.30 The simulations trace the dynamic short-run and longer-run effects of shocks to one or more regions of the world economy, including the effects of alternative policy responses.
The EWE’s internal and external consultations help inform the risk scenarios that are simulated. As discussed above, exchange of views within the IMF, ongoing discussions with the FSB, and consultations with country authorities, academics and financial analysts, as well as the risks flagged by the EWL and the IMF Vulnerability Exercises are the main inputs to determine what risk scenarios and assumptions to consider at a regional and global level. The IMF macroeconomic models are then used as tools to study these risk scenarios and draw policy implications.
The macroeconomic models of the EWE include: The Global Projection Model (GPM). This is a monetary business cycle model that
captures the dynamics of GDP, inflation, short-term interest rates, exchange rates, unemployment, and bank lending. This model is a valuable tool for assessing the quantitative implications of demand shocks, the extent of inflation or deflation risks, and the likelihood of upside and downside scenarios for the global economy using confidence bands. It possesses good short- and medium-term forecasting ability due to its flexibility in matching the data.
FISCMOD. This is a monetary and fiscal business cycle model of the U.S. economy. It is used to assess risks from interactions between fiscal variables and the real economy and includes equations for the evolution of GDP, unemployment, inflation, and government bond yields of different maturities, the primary deficit, and the overall deficit.
The Global Integrated Monetary and Fiscal Model (GIMF). This is a rich, multi-sectoral, multiregional model (with up to six regions), with nominal and real rigidities,
30The number of equations per region ranges from less than ten, for small-scale quarterly projection models, to several hundred, for large-scale medium-term scenario analysis models.

39
that incorporates policy rules used by monetary and fiscal authorities.31 GIMF allows for simulations of a large assortment of shocks across various sectors and regions and helps analyze the domestic impact of policies as well as spillovers.32 For instance, the rich representation of the fiscal sector helps design fiscal packages to reduce overall tax distortions and increase output over the medium term during fiscal consolidations. GIMF performs well for medium-term risk scenarios and policy analyses.
A Panel Unobserved Components model. This model helps trace the propagation of nominal and real shocks originating in systemic advanced and emerging economies and is used to provide insights on monetary policy and its transmission mechanism.33 Within each economy, business cycle fluctuations may be generated by supply or demand shocks originating in the output market, or risk premium shocks originating in the bond, stock, or foreign exchange market. These business cycle fluctuations are then transmitted across economies via international trade and financial linkages, inducing monetary policy responses.
VIII. AGGREGATION AND COUNTRY RATINGS
The IMF vulnerability exercises, as key inputs to the EWE, compute summary measures of country and regional vulnerability ratings (Figure 4). Countries covered under the exercises are rated as having either high, medium, or low vulnerabilities. These overall vulnerability ratings, in turn, reflect sectoral vulnerabilities (external, fiscal, financial, and nonfinancial corporate) and assessment of risks (macro-risks from growth and inflation, risks from asset prices, systemic risks, and contagion).
The country ratings for advanced economies are based on the results from the full set of models and indicators. Thresholds are first derived for each model and indicator to determine the level of vulnerability for a given country. The identified vulnerabilities for the indicators and models are then aggregated by sector (external, fiscal, financial, asset prices, macro, and cross-border exposures) to derive sectoral vulnerability ratings. Finally, the sectoral vulnerability ratings are aggregated using equal weights into an overall country vulnerability rating.34 This approach is feasible on account of the relative homogeneity of
31See Botman, D., P. Karam, D. Laxton, and D. Rose, 2007, “DSGE Modeling at the Fund: Applications and Further Developments,” IMF Working Paper No. 07/200.
32For a presentation of the current structure of GIMF see Kumhof, M., D. Laxton, D. Muir, and S. Mursula, 2010, “The Global Integrated Monetary and Fiscal Model (GIMF)—Theoretical Structure,” IMF Working No. 10/34. For a discussion of properties and some policy applications see Kumhof, M., and D. Laxton, 2009, “Fiscal Deficits and Current Account Deficits,” IMF Working Paper No. 09/237. 33See Vitek, F., 2009, “Monetary Policy Analysis and Forecasting in the World Economy: A Panel Unobserved Components Approach,” IMF Working Paper No. 09/238.
34An economy is assessed to have high or medium vulnerabilities if the number of sector flags is more than one standard deviation, or within one standard deviation above the mean, respectively. For the empirical crisis models, an economy is assessed to have high or medium vulnerabilities if the estimated probability of a crisis is higher than 20 or 10 percent respectively, based on the maximum across all models.

40
advanced markets, as well as the availability of a large amount of cross-sectional data that are used in the empirical models.
The country ratings for emerging economies summarize information from the indicators discussed above, capturing vulnerabilities across sectors. For each indicator, vulnerability thresholds are derived from empirical analysis that takes into account the experience during past crises, as in the crisis risks models discussed above. However, due to lack of data and the relative heterogeneity of emerging markets, the results of empirical models are only one of the inputs in determining the country ratings. In addition, judgment based on bilateral surveillance (reflecting specific information about country and regional circumstances), as well as analysis that
Figure 4. A Schematic Display of Country Vulnerability Ratings by Sector
Region 1 Region 2 Region 3 Region 4 Region 5 Region 6 Region 7
Country Flags Raised by the VEA1
Count
ry 1
Count
ry 2
Count
ry 3
Count
ry 4
Count
ry 5
Count
ry 6
Count
ry 7
Count
ry 8
Count
ry 9
Count
ry 10
Count
ry 11
Count
ry 12
Count
ry 13
Count
ry 14
Count
ry 15
Count
ry 16
Count
ry 17
Count
ry 18
Count
ry 19
Count
ry 20
Count
ry 21
Count
ry 22
Count
ry 23
Count
ry 24
Count
ry 25
Count
ry 26
Count
ry 27
Count
ry 28
Count
ry 29
Count
ry 30
Count
ry 31
Count
ry 32
Overall VEA rating 5 4 2 2 3 6 6 2 6 11 7 4 8 8 4 3 4 3 6 7 6 7 9 8 8 6 4 5 6 5 5 3
External 0 1 0 0 1 1 1 0 1 2 2 0 1 0 0 0 0 0 0 1 1 1 2 1 2 1 0 0 0 0 0 0
External imbalances (empirical crisis model, thresholds for 3 external sector indicators) 0 2 0 0 0 2 2 0 2 2 2 1 2 0 0 0 0 0 0 2 2 2 2 2 2 n.a. n.a. 0 0 0 0 0
Overvalued exchange rate (CGER) 0 0 0 0 2 1 1 0 0 0 0 0 0 0 0 0 0 0 0 1 0 0 0 0 2 1 0 0 0 0 0 0
International Balance sheet analysis 0 0 n.a. n.a. 0 0 0 0 0 2 2 0 n.a. 0 n.a. 0 0 1 n.a. n.a. n.a. 0 2 1 0 n.a. n.a. n.a. 1 1 0 1
Macro 2 1 1 1 1 2 1 1 1 2 1 1 1 2 2 1 1 1 1 2 1 1 1 2 1 2 2 2 2 2 2 1
Growth risks 2 1 1 1 1 2 0 1 1 2 1 1 1 2 2 1 1 1 1 2 1 1 1 1 1 2 2 2 2 2 2 1
Growth risks (empirical crisis model) 1 1 1 1 1 1 0 1 1 2 1 1 1 2 2 1 1 1 1 2 1 1 1 1 1 2 2 2 2 0 1 1
GDP at risk 2 0 n.a. n.a. 0 2 0 0 1 1 n.a. 0 0 0 n.a. 1 0 0 n.a. n.a. n.a. 1 0 1 1 n.a. n.a. n.a. 2 2 2 0
Growth above potential (general equilibrium macro model) 0 n.a. n.a. n.a. 0 n.a. 0 0 0 n.a. n.a. 0 n.a. n.a. n.a. 0 n.a. n.a. n.a. n.a. n.a. 0 0 n.a. n.a. n.a. n.a. n.a. n.a. n.a. n.a. n.a.
Inflation risks 0 0 0 0 0 0 0 0 1 0 0 0 0 0 0 0 0 0 0 0 0 0 0 0 0 0 0 2 0 0 0 1
Loose monetary policy (Taylor rule) 0 0 0 0 0 0 0 0 0 0 0 0 0 0 0 0 0 0 0 0 0 0 0 0 0 0 0 2 0 0 0 1
Loose monetary conditions (general equilibrium macro model) 0 n.a. n.a. n.a. 0 n.a. 0 0 2 n.a. n.a. 0 n.a. n.a. n.a. 0 n.a. n.a. n.a. n.a. n.a. 0 0 n.a. n.a. n.a. n.a. n.a. n.a. n.a. n.a. n.a.
Denflation risks 2 0 0 0 1 0 1 0 0 2 0 0 1 0 0 0 0 0 0 0 0 1 1 2 0 1 0 0 0 1 0 0
Tight monetary policy (Taylor rule) 2 0 0 0 1 0 1 0 0 2 0 0 1 0 0 0 0 0 0 0 0 0 1 2 0 1 0 0 0 1 0 0
Tight monetary conditions (general equilibrium macro model) 2 n.a. n.a. n.a. 0 n.a. 0 0 0 n.a. n.a. 0 n.a. n.a. n.a. 0 n.a. n.a. n.a. n.a. n.a. 1 0 n.a. n.a. n.a. n.a. n.a. n.a. n.a. n.a. n.a.
Fiscal 2 0 0 0 0 0 1 0 1 2 2 1 1 1 1 0 0 0 1 0 1 2 2 2 2 1 0 2 0 0 0 0
Fiscal risks, overall indicator 2 0 n.a. n.a. 0 0 1 0 1 2 n.a. 1 1 1 n.a. 0 0 0 1 0 1 2 2 2 2 n.a. n.a. n.a. 0 0 0 0
Gross funding risk (sovereign financing risks analysis) 2 0 n.a. n.a. 0 0 2 1 0 0 2 1 2 0 n.a. 0 0 0 0 n.a. 0 2 0 1 1 n.a. n.a. n.a. 0 0 0 0
Market perception of sovereign default risk (CDS and RAS spreads, models for government bond yields and term risk premium)
1 0 n.a. n.a. 0 0 0 0 0 2 n.a. 0 1 1 n.a. 0 1 0 1 n.a. n.a. 2 1 2 2 n.a. n.a. n.a. 0 0 0 0
Medium-term fiscal adjustment need 2 0 n.a. n.a. 1 0 2 0 2 2 n.a. 1 0 1 n.a. 0 0 n.a. 0 n.a. 1 0 1 1 2 n.a. n.a. n.a. 0 0 0 0
Long-term fiscal adjustment need 1 0 n.a. n.a. 0 1 2 0 0 1 n.a. 0 1 1 n.a. 0 0 n.a. 2 0 2 0 2 0 2 2 n.a. n.a. 0 0 1 0
Fiscal vulnerability to an adverse growth shock 2 0 n.a. n.a. 0 0 1 0 0 1 n.a. 1 2 1 0 1 0 n.a. 0 0 0 2 1 2 2 0 0 n.a. 0 0 0 0
Contagion risk (distress dependence from other sovereigns) 0 n.a. n.a. n.a. n.a. n.a. 0 n.a. 1 1 n.a. 1 0 0 n.a. 0 0 n.a. n.a. n.a. n.a. 1 2 2 2 n.a. n.a. n.a. n.a. n.a. n.a. 0
Fiscal crisis risks (empirical crisis model) 1 0 0 0 0 1 1 1 1 2 2 2 2 1 1 1 1 0 1 1 2 2 1 1 2 2 0 2 1 1 0 0
Asset prices 0 1 n.a. n.a. 1 2 2 1 1 2 n.a. 0 2 2 n.a. 1 1 1 n.a. n.a. n.a. 1 2 n.a. n.a. n.a. n.a. n.a. 2 1 1 0
Real estate overall vulnerability 0 1 n.a. n.a. 1 2 2 0 1 2 n.a. 0 n.a. 2 n.a. 0 n.a. 1 n.a. n.a. n.a. 0 2 n.a. n.a. n.a. n.a. n.a. 1 1 1 0
Residential real estate 0 0 n.a. n.a. 1 2 0 0 1 2 n.a. 0 n.a. 2 n.a. 0 n.a. 0 n.a. n.a. n.a. 0 2 n.a. n.a. n.a. n.a. n.a. 1 1 0 0
House price misalignment 0 0 n.a. n.a. 2 2 0 1 2 0 n.a. 2 2 1 n.a. 0 0 0 n.a. n.a. n.a. 0 2 0 0 n.a. n.a. n.a. 1 0 2 2
Household debt burden 0 0 n.a. n.a. 1 1 1 1 1 1 n.a. 0 n.a. 2 n.a. 0 n.a. 1 n.a. n.a. n.a. 0 0 n.a. n.a. n.a. n.a. n.a. 2 0 0 0
Potential impact on GDP 0 0 n.a. n.a. 1 2 0 0 1 2 n.a. 0 n.a. 0 n.a. 0 n.a. 0 n.a. n.a. n.a. 0 0 n.a. n.a. n.a. n.a. n.a. 1 1 0 0
Mortgage market characteristics 0 0 n.a. n.a. 1 0 1 0 1 2 n.a. 0 n.a. 1 n.a. 0 n.a. 0 n.a. n.a. n.a. 2 2 n.a. n.a. n.a. n.a. n.a. 0 2 1 0
Commercial real estate 0 1 n.a. n.a. 1 0 2 0 1 1 n.a. 0 n.a. 0 n.a. 0 n.a. 1 n.a. n.a. n.a. 0 2 n.a. n.a. n.a. n.a. n.a. 1 1 1 0
Equity prices 0 n.a. n.a. n.a. 1 n.a. 0 1 0 1 n.a. 0 2 0 n.a. 1 1 0 n.a. n.a. n.a. 0 1 n.a. n.a. n.a. n.a. n.a. n.a. n.a. n.a. 0
Model based misalignments 0 n.a. n.a. n.a. 1 n.a. 0 2 0 0 n.a. 0 1 0 n.a. 0 2 0 n.a. n.a. n.a. 0 2 n.a. n.a. n.a. n.a. n.a. n.a. n.a. n.a. 0
Valuation multiples misalignments 0 n.a. n.a. n.a. 1 n.a. 0 0 0 1 n.a. 0 2 0 n.a. 1 0 0 n.a. n.a. n.a. 0 0 n.a. n.a. n.a. n.a. n.a. n.a. n.a. n.a. 0
Corporate sector vulnerability 0 0 0 1 0 2 n.a. 0 0 0 0 1 1 0 n.a. n.a. n.a. 1 0 1 0 n.a. n.a. n.a. 2 1 1 0
Financial sector and systemic models 1 1 0 0 0 0 1 0 1 1 0 1 1 1 0 0 1 0 1 1 1 1 1 1 1 0 0 0 1 1 1 1
Financial crisis (empirical crisis model) 0 0 0 0 0 0 0 0 0 1 0 0 1 1 0 0 0 0 0 0 0 1 0 1 1 0 0 0 0 0 0 0
Financial stability at risk 1 2 n.a. n.a. 0 0 0 0 2 0 n.a. 1 0 2 n.a. 0 1 0 n.a. n.a. n.a. 1 0 0 0 n.a. n.a. n.a. 2 2 2 1
Expected deterioration of asset quality (NPL model) 2 0 n.a. 0 0 0 2 0 1 n.a. n.a. 1 0 0 n.a. 2 2 0 2 n.a. n.a. 2 2 0 2 n.a. n.a. 0 0 0 0 0
Interbank spreads 0 1 0 0 1 0 0 0 0 1 n.a. 1 1 1 1 1 1 0 n.a. 1 1 1 1 1 1 1 1 n.a. 0 1 1 1
Distress from Large Complex Financial Institutions 0 1 0 0 0 n.a. 2 1 2 2 n.a. 1 1 n.a. n.a. 0 2 1 n.a. n.a. n.a. 1 1 2 2 n.a. n.a. n.a. 1 n.a. 0 2
Duration of crisis (duration model) 2 2 0 0 1 2 2 1 0 0 0 0 0 0 0 0 0 0 n.a. 2 2 1 1 0 1 0 0 n.a. 0 1 0 0
Contagion 0 0 0 0 0 1 0 0 1 2 1 1 2 2 0 1 1 1 2 2 1 1 1 1 1 1 1 0 1 1 1 1
Cross-border financial sector exposure (contagion through bank channels) 0 0 1 0 0 2 0 0 0 2 0 1 2 1 0 0 0 2 0 2 0 0 0 0 0 0 0 0 0 0 0 0
Financial sector exposure to vulnerable advanced economies 0 0 0 0 1 0 1 0 2 2 2 2 2 2 1 2 2 2 2 1 2 2 2 2 2 2 2 0 2 1 1 1
Financial sector exposure to vulnerable emerging economies 0 0 0 0 0 0 0 0 1 1 0 0 1 1 0 0 2 1 2 2 2 0 0 1 2 0 0 n.a. 1 0 0 2
Contagion through trade channels 0 1 0 0 0 1 0 1 0 1 1 0 2 2 0 1 1 0 2 2 0 1 0 0 0 0 0 1 1 1 1 1
1The table summarizes the main results of the VEA exercise. The colors indicate countries that were flagged as relatively vulnerable in each sector, with red, orange and green for high, medium and low vulnerabilities respectively. When "n.a.", the number of red and orange flags needed to rank a country with H or M drops accordingly.

41
varies in each round depending on the regional and global outlook are used to inform the final country ratings.
IX. CONCLUSION: A TIMELY WARNING
Notwithstanding the sophistication of the tools described above, any early warning exercise is certain to face challenges in generating “hits” rather than “misses.” Indeed, in a complex global economy, there is almost no limit to the range of conceivable risks, and IMF staff are under no illusions that the EWE could capture all those to which policy-makers should remain alert. There is clearly a possibility that global developments could yet again take an unexpected turn, despite best intentions and efforts behind the exercise.
This does not mean, however, that the effort expended on the EWE is fruitless. First, and most obviously, it is better to be prepared for risks that do not materialize than to count on luck to see one through. Beyond this, however, the EWE has made important contributions to the Fund’s core analytic work. Specifically, the Early Warning Exercise has already brought renewed focus and innovation to the consideration of risks and spillovers in the Fund’s bilateral and multilateral surveillance activities. It is hoped that this achievement will last well beyond the next crisis.