hemorrhage and shock associated with invasive pneumococcal ... · associated with invasive...
TRANSCRIPT

Emerging Infectious Diseases
Hemorrhage and ShockAssociated with Invasive Pneumococcal Infection
in Healthy Infants and Children — New Mexico, 1993–1994
Invasive Pneumococcal Infection — ContinuedFrom December 1993 through May 1994, four previously healthy children (includ-
ing two infants) in New Mexico developed a severe illness characterized by septic
shock and hemorrhage into the skin or internal organs. An investigation subsequently
implicated Streptococcus pneumoniae as the cause of illness. The two infants at-
tended the same child care center (CCC) and died 6 weeks apart. This report describes
the syndrome, an investigation of potential transmission in the CCC, and prevention
measures.
Case Investigations
On December 10, 1993, the New Mexico Department of Health (NMDH) received a
report of a previously healthy 4-month-old girl (patient 1) who died from septic shock
with petechiae and hemorrhage into the adrenal glands, heart, and diaphragm. Blood
and tissue cultures were negative. However, because her clinical presentation sug-
gested meningococcemia, a prophylactic regimen of rifampin was prescribed for
infants, toddlers, and staff at the CCC she attended. On February 9, 1994, a 7-month-
old infant (patient 2) who attended the same CCC died from septic shock, purpura, and
Waterhouse-Friderichsen syndrome. Gram-positive cocci were detected on a smear of
the patient’s blood buffy coat, and a latex agglutination test on cerebrospinal fluid
(CSF) indicated infection with S. pneumoniae as the cause of death; pneumococcal
infection was confirmed by polymerase chain reaction (PCR), using primers for the
pneumococcal autolysin gene on autopsy tissue, and by counterimmunoelectro-
phoresis (CIE) of CSF (serogroup 19). Analysis of autopsy tissue from patient 1, using
the same PCR assay, suggested that she also had died from pneumococcal infection.
On February 17 and May 13, 1994, NMDH received reports of two other previously
healthy children in whom septic shock and purpura fulminans had been diagnosed
but who resided in different communities and who did not attend the CCC. Both chil-
dren (aged 22 months and 4 years) were critically ill but fully recovered. Routine
cultures were negative for both patients, but S. pneumoniae (serogroups 14 and 12,
respectively) was detected by CIE of CSF from each child.
MORBIDITY AND MORTALITY WEEKLY REPORT
January 6, 1995 / Vol. 43 / Nos. 51 & 52
U.S. DEPARTMENT OF HEALTH AND HUMAN SERVICES / Public Health Service
949 Hemorrhage and Shock Associatedwith Invasive Pneumococcal Infectionin Healthy Infants and Children
952 Asthma — United States, 1982–1992955 Changes in Notifiable Diseases Data
Presentation957 Lack of Evidence for Wild Poliovirus
Circulation — United States, 1993959 Recommended Childhood
Immunization Schedule — UnitedStates, January 1995
961 Monthly Immunization Table
CCC Investigation
After determining the specific cause of death for the two infants, NMDH evaluated
potential transmission of pneumococcal disease in the CCC. At the time of the investi-
gation (February 9–March 25), 75 children aged 6 weeks–10 years were enrolled in the
CCC, and 17 persons were employees there. CCC attendees were divided into class-
rooms by age: the infant group (age <1 year) had infrequent contact with the toddler
group (age 1–2 years) and no contact with the older children. Staff rotated between
the classrooms. The CCC staff routinely adhered to infection-control procedures that
were consistent with state and federal guidelines, including handwashing after diaper
changes and exclusion of infants and children with potentially infectious illnesses (1 ).
To characterize the number and type of illnesses occurring among attendees aged
≤2 years during the 2-week periods preceding the two infants’ deaths, NMDH con-
ducted a self-administered survey of CCC staff and parents of CCC attendees. Parents
were asked if their children had symptoms including cough, fever, and conjunctivitis
or if a physician had told them their child had otitis media, pneumonia, or sinusitis—
illnesses suggestive of pneumococcal infection. Six of the nine members of the infant
group (excluding patients 1 and 2) and four of eight in the toddler group had had
illnesses suggestive of pneumococcal infection during November 26–December 10,
1993. Otitis media was diagnosed by a physician for the six ill infants and three of the
four ill toddlers; one of the ill toddlers had had purulent conjunctivitis. During January
25–February 8, 1994, illnesses suggestive of pneumococcal infection were diagnosed
in five of the nine infants (four with otitis media and one with otitis media and pneu-
monia) and two of the eight toddlers (one with otitis media and one with otitis media
and purulent conjunctivitis).
To assess the prevalence of pneumococcal carriage, on February 11, naso-
pharyngeal samples were obtained from CCC staff and from children in the infant and
toddler groups. Of the 38 persons from whom swabs were obtained, pneumococci
were isolated from six children and two staff (serogroup 19 in two infants and one
toddler).
To prevent additional cases among children and staff at the CCC, NMDH and CDC,
in consultation with University of New Mexico clinicians, recommended pneumococ-
cal polysaccharide vaccine for all children aged ≥2 years and for all staff. Because the
vaccine is poorly immunogenic in children aged <2 years, health officials recom-
mended those children receive one dose of benzathene penicillin administered
intramuscularly with a repeat dose 1 month later.
Reported by: L Nims, MS, K Hatch, M Gallaher, MD, R Voorhees, MD, M Tanuz, I Vold, MPH,M Goldstein, MD, C Powers, J Knott, N Kalishman, MD, G Simpson, MD, CM Sewell, DrPH,State Epidemiologist, New Mexico Dept of Health; A Paul, MD, L Shandler, MD, Santa Fe, NewMexico; KB Nolte, MD, New Mexico Office of the Medical Investigator; G Overturf, MD, Univ ofNew Mexico Hospital, Albuquerque. J Groover, D Musher, MD, Veteran’s Administration MedicalCenter, Houston. Childhood and Respiratory Diseases Br, Div of Bacterial and Mycotic Diseases,National Center for Infectious Diseases, CDC.
Editorial Note: S. pneumoniae is the most common cause of invasive bacterial dis-
ease in the United States (2 ). The findings in New Mexico indicate that systemic
pneumococcal infection in previously healthy children may be complicated by the
rapid onset of septic shock accompanied by hemorrhage into the skin or other organs.
Overwhelming sepsis with hemorrhagic complications has been well documented in
persons who are asplenic and in adults with underlying medical conditions (3,4 ).
950 MMWR January 6, 1995
Invasive Pneumococcal Infection — Continued
However, reports of hemorrhage and shock associated with pneumococcal septicemia
in previously healthy children have been limited and have included cases in a pre-
viously healthy 13-month-old who developed fatal Waterhouse-Friderichsen syn-
drome (5 ); two children with purpura fulminans (6 ); and two children with pneumo-
coccal septicemia, shock, and hemorrhagic complications (7 ).
Because CSF, blood, and tissue cultures were negative, determining the etiology of
the four cases in New Mexico required use of alternative diagnostic methods. Latex
agglutination testing is performed on CSF specimens of some patients with suspected
bacterial meningitis. CIE, a technique not commonly used, is highly specific for most
pneumococcal serogroups when used on CSF specimens, but its sensitivity may be
lower than that of other methods (8 ). The validity of PCR using primers for the
pneumococcal autolysin gene on autopsy tissue has not been evaluated (9 ).
Although the most common pneumococcal diseases in persons in CCCs include
otitis media and sinusitis, transmission of invasive pneumococcal disease in this set-
ting has been reported previously (10 ). The report of the two deaths among children
who attended the New Mexico CCC underscores the need to improve prevention
of pneumococcal disease transmission in CCCs. However, until a vaccine effective in
children aged <2 years is developed and licensed, substantial morbidity from pneu-
mococcal infections among children in CCCs will probably continue to occur.
The incidence of hemorrhage and shock as a complication of pneumococcal infec-
tion in healthy children is unknown. Identification of S. pneumoniae as the etiology of
infection in a child with this presentation is difficult when cultures are negative and
other diagnostic tests are not performed. CDC recommends the following case defini-
tion to facilitate further study and reporting of this illness: septic shock, hemorrhage
into the skin (petechiae or purpura) or Waterhouse-Friderichsen syndrome, and evi-
dence of pneumococcal infection in an otherwise healthy person. Evidence of
pneumococcal infection may include isolation of pneumococci from sterile body fluids
or detection of pneumococci by nonculture methods. If CSF or autopsy tissues are
available and routine diagnostic tests are negative, CDC can assist with detection or
characterization of pneumococci. Physicians and other health-care providers are en-
couraged to report patients with this clinical presentation to CDC through their state
health departments.
References1. American Public Health Association/American Academy of Pediatrics. Caring for our chil-
dren—national health and safety performance standards: guidelines for out-of-home childcare programs. Washington, DC: American Public Health Association/American Academy ofPediatrics, 1992.
2. Wenger JD, Hightower AW, Facklam RR, Gaventa S, Broome CV, and the Bacterial MeningitisStudy Group. Bacterial meningitis in the United States, 1986: report of a multistate surveillancestudy. J Infect Dis 1990;162:1316–23.
3. Hautekeete ML, Berneman ZN, Bieger R, et al. Purpura fulminans in pneumococcal sepsis.Arch Intern Med 1986;146:497–9.
4. Johansen K, Hansen ST. Symmetrical peripheral gangrene (purpura fulminans) complicatingpneumococcal sepsis. Am J Surg 1993;165:642–5.
5. Ryan CA, Wenman W, Henningsen C, Tse S. Fatal childhood pneumococcal Waterhouse-Friderichsen syndrome. Pediatr Infect Dis J 1993;12:250–1.
6. Cohen JR, Lackner R, Keller A, Douglas B. The surgical implications of purpura fulminans.Ann Vasc Surg 1990;4:276–9.
7. Floret D, Andre S. Fulminating pneumococcal septicemia in children. Pediatrie 1985;40:475–80.
Vol. 43 / Nos. 51 & 52 MMWR 951
Invasive Pneumococcal Infection — Continued
8. Ballard TL, Roe MH, Wheeler RC, Todd JK, Glode MP. Comparison of three latex agglutinationkits and counterimmunoelectrophoresis for the detection of bacterial antigens in a pediatricpopulation. Pediatr Infect Dis J 1987;6:630–4.
9. Rudolph KM, Parkinson AJ, Black CM, Mayer LW. Evaluation of polymerase chain reactionfor diagnosis of pneumococcal pneumonia. J Clin Microbiol 1993;31:2661–6.
10. Cherian T, Steinhoff MC, Harrison LH, Rohn D, McDougal LK, Dick J. A cluster of invasivepneumococcal disease in young children in child care. JAMA 1994;271:695–7.
Invasive Pneumococcal Infection — Continued
Current Trends
Asthma — United States, 1982–1992
Asthma — ContinuedAsthma is characterized by variable airflow obstruction with airway hyperrespon-
siveness; prominent clinical manifestations include wheezing and shortness of breath.
During the 1980s, the prevalence of and mortality associated with asthma increased in
the United States and other countries (1,2 ). To describe national trends in disease
burden for asthma in the United States, CDC analyzed data for 1982–1992 (the most
recent year for which data are available) for deaths, hospital discharges, and self-re-
ported morbidity. This report summarizes the findings of the analysis.
This analysis used data maintained by CDC, including the multiple-cause-of-death
file, the National Hospital Discharge Survey, and the National Health Interview Survey.
For asthma deaths, the underlying cause was listed as International Classification of
Diseases, Ninth Revision, Clinical Modification, code 493. Because of the limited accu-
racy of diagnosing asthma in persons aged >35 years (3 ), this analysis presents
overall age-adjusted rates and rates for persons aged 5–34 years. Race-specific analy-
ses were restricted to blacks and whites because numbers for other races were too
small to enable calculation of stable estimates.
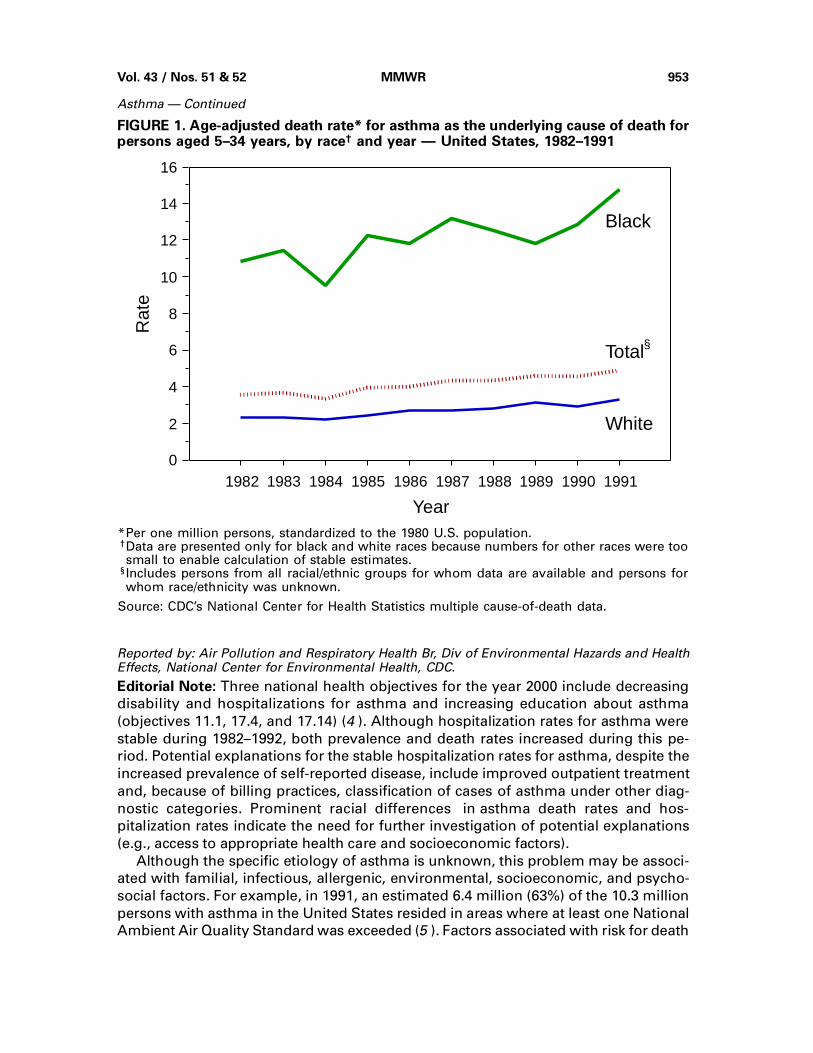
From 1982 through 1991*, the overall annual age-adjusted death rate† for asthma
increased 40% and steadily, from 13.4 per 1 million population (3154 deaths) to 18.8
per 1 million (5106 deaths). During this period, the rate increased 59% for females
(from 15.4 to 24.6) and 34% for males (from 11.7 to 15.7). For persons aged 5–34 years,
the rate increased 42%, from 3.4 (401 deaths) to 4.9 (569 deaths) (Figure 1). The annual
death rate was consistently higher for blacks than for whites. During this period, the
rate increased 41% for females (from 3.6 to 4.6) and 43% for males (from 3.7 to 5.3).
The overall annual age-adjusted hospital discharge rate for asthma as the primary
diagnosis decreased slightly from 18.4 per 10,000 in 1982 to 17.9 per 10,000 in 1992.
For persons aged 5–34 years, the rate was constant in both years (12.8 per 10,000);
rates for females were consistently higher than for males, and rates for blacks were
consistently higher than for whites.
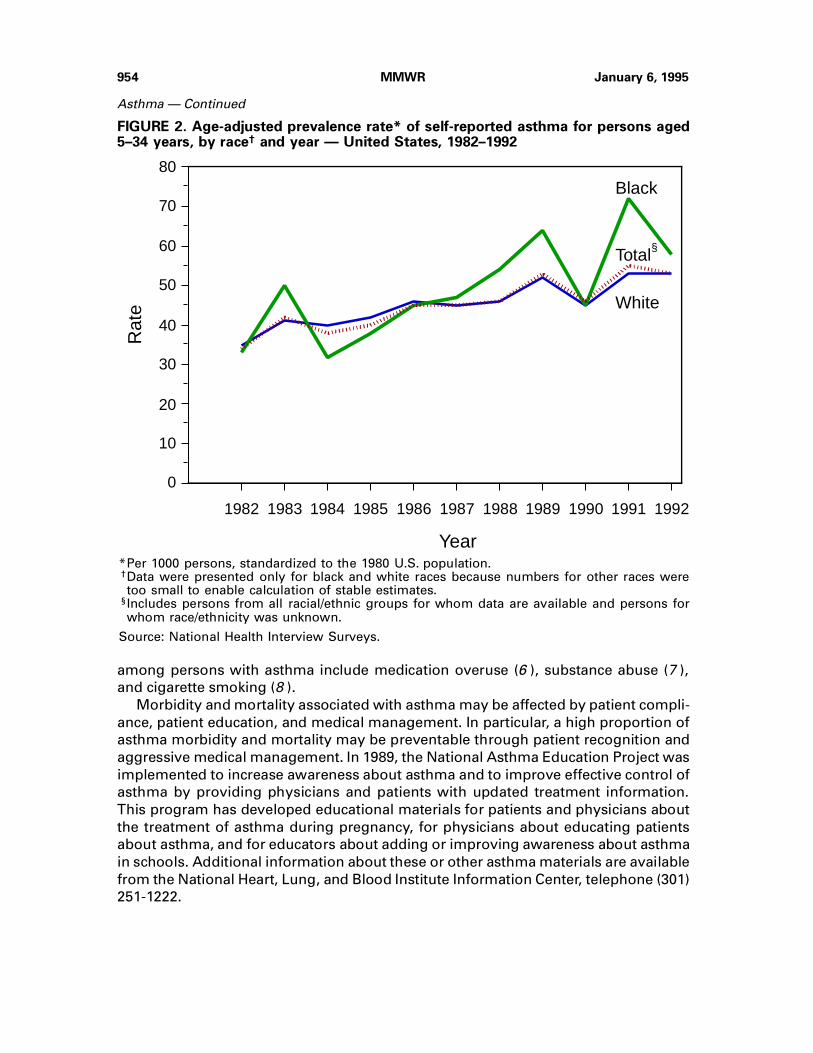
From 1982 through 1992, the overall annual age-adjusted prevalence rate of self-
reported asthma increased 42%, from 34.7 per 1000 to 49.4 per 1000. For persons aged
5–34 years, the rate increased 52%, from 34.6 to 52.6 (Figure 2). The rate for males
increased by 29% (from 39.7 to 51.4) and for females increased 82% (from 29.4 to
53.6).
*Mortality data were not available for 1992.†Intercensal population estimates were used to calculate age-adjusted rates standardized to the1980 U.S. population.
952 MMWR January 6, 1995
Invasive Pneumococcal Infection — Continued
Reported by: Air Pollution and Respiratory Health Br, Div of Environmental Hazards and HealthEffects, National Center for Environmental Health, CDC.
Editorial Note: Three national health objectives for the year 2000 include decreasing
disability and hospitalizations for asthma and increasing education about asthma
(objectives 11.1, 17.4, and 17.14) (4 ). Although hospitalization rates for asthma were
stable during 1982–1992, both prevalence and death rates increased during this pe-
riod. Potential explanations for the stable hospitalization rates for asthma, despite the
increased prevalence of self-reported disease, include improved outpatient treatment
and, because of billing practices, classification of cases of asthma under other diag-
nostic categories. Prominent racial differences in asthma death rates and hos-
pitalization rates indicate the need for further investigation of potential explanations
(e.g., access to appropriate health care and socioeconomic factors).
Although the specific etiology of asthma is unknown, this problem may be associ-
ated with familial, infectious, allergenic, environmental, socioeconomic, and psycho-
social factors. For example, in 1991, an estimated 6.4 million (63%) of the 10.3 million
persons with asthma in the United States resided in areas where at least one National
Ambient Air Quality Standard was exceeded (5 ). Factors associated with risk for death
1982 1983 1984 1985 1986 1987 1988 1989 1990 19910
2
4
6
8
10
12
14
16
Black
White
Rat
e
Year
Total§
*Per one million persons, standardized to the 1980 U.S. population.†Data are presented only for black and white races because numbers for other races were toosmall to enable calculation of stable estimates.
§Includes persons from all racial/ethnic groups for whom data are available and persons forwhom race/ethnicity was unknown.
Source: CDC’s National Center for Health Statistics multiple cause-of-death data.
FIGURE 1. Age-adjusted death rate* for asthma as the underlying cause of death forpersons aged 5–34 years, by race† and year — United States, 1982–1991
Vol. 43 / Nos. 51 & 52 MMWR 953
Asthma — Continued
among persons with asthma include medication overuse (6 ), substance abuse (7 ),
and cigarette smoking (8 ).
Morbidity and mortality associated with asthma may be affected by patient compli-
ance, patient education, and medical management. In particular, a high proportion of
asthma morbidity and mortality may be preventable through patient recognition and
aggressive medical management. In 1989, the National Asthma Education Project was
implemented to increase awareness about asthma and to improve effective control of
asthma by providing physicians and patients with updated treatment information.
This program has developed educational materials for patients and physicians about
the treatment of asthma during pregnancy, for physicians about educating patients
about asthma, and for educators about adding or improving awareness about asthma
in schools. Additional information about these or other asthma materials are available
from the National Heart, Lung, and Blood Institute Information Center, telephone (301)
251-1222.
1982 1983 1984 1985 1986 1987 1988 1989 1990 1991 1992
0
20
40
60
80Black
White
Rat
e
Year
Total
10
30
50
70
§
*Per 1000 persons, standardized to the 1980 U.S. population.†Data were presented only for black and white races because numbers for other races weretoo small to enable calculation of stable estimates.
§Includes persons from all racial/ethnic groups for whom data are available and persons forwhom race/ethnicity was unknown.
Source: National Health Interview Surveys.
FIGURE 2. Age-adjusted prevalence rate* of self-reported asthma for persons aged5–34 years, by race† and year — United States, 1982–1992
954 MMWR January 6, 1995
Asthma — Continued

References1. Weiss KB, Wagener DK. Changing patterns of asthma mortality: identifying target populations
at high risk. JAMA 1990;264:1683–7.
2. Woolcock AJ. Worldwide differences in asthma prevalence and mortality: why is asthma mor-
tality so low in the USA? Chest 1986;90(suppl):40S–45S.
3. Sears MR, Rea HH, de Boer G, et al. Accuracy of certification of deaths due to asthma: a national
study. Am J Epidemiol 1986;124:1004–11.
4. Public Health Service. Healthy people 2000: national health promotion and disease prevention
objectives—full report, with commentary. Washington, DC: US Department of Health and Hu-
man Services, Public Health Service, 1991; DHHS publication no. (PHS)91-50212.
5. CDC. Populations at risk from air pollution—United States, 1991. MMWR 1993;42:301–4.
6. Ernst P, Habbick B, Suissa S, et al. Is the association between inhaled beta-agonist use and
life-threatening asthma because of confounding by severity? Am Rev Respir Dis 1993;148:75–9.
7. Greenberger PA, Miller TP, Lifschultz B. Circumstances surrounding deaths from asthma in
Cook County (Chicago) Illinois. Allergy Proc 1993;14:321–6.
8. Marquette CH, Saulnier F, Leroy O, et al. Long-term prognosis of near-fatal asthma: a 6-year
follow-up study of 145 asthmatic patients who underwent mechanical ventilation for a near-
fatal attack of asthma. Am Rev Respir Dis 1992;146:76–81.
Asthma — Continued
Current Trends
Changes in Notifiable Diseases Data Presentation
Notifiable Diseases Data — ContinuedThe next issue of MMWR (dated January 13, 1995 [volume 44, number 1]), will
incorporate modifications to Tables I and II, Cases of Notifiable Diseases, United
States. The purposes of these modifications are to improve the usefulness of notifi-
able diseases data (1,2 ) and to respond to changing priorities in notifiable disease
surveillance. This report describes the rationale for data dissemination in Table I and
Table II.
Table I
Table I will present the cumulative number of cases of low-frequency diseases (in
general, ≤500 cases per year) reported for the current year. In addition, Table I will
present the reported number of cases of congenital syphilis, which currently is up-
dated quarterly, and Haemophilus influenzae, for which serotype-specific information
about the vaccine-preventable subgroup (serotype b) often is not reported. Data that
will be deleted from Table I, but that will continue to be published in Table II, include
the number of reported cases of acquired immunodeficiency syndrome (AIDS), gonor-
rhea, Lyme disease, measles, syphilis (primary and secondary), and tuberculosis.
Publication of reports of cases of botulism will be discontinued in MMWR (weekly)
but will be included in the Annual Summary of Notifiable Diseases.
Diseases proposed for deletion from the national notifiable diseases list by the
Council of State and Territorial Epidemiologists (CSTE) at its National Surveillance
Conference (November 30–December 2, 1994) include aseptic meningitis, primary en-
cephalitis (except for arboviral encephalitis), postinfectious encephalitis, unspecified
hepatitis, leptospirosis, and tularemia. These diseases had been published weekly;
they will continue to be published in Table I until deletion is formally approved by
CSTE.
Vol. 43 / Nos. 51 & 52 MMWR 955
Asthma — Continued

Table II
Table II will present high-frequency diseases (in general, >500 cases per year) or
selected diseases targeted by the national Childhood Immunization Initiative for elimi-
nation of indigenous transmission in the United States (3 ). Cumulative totals for both
the current and immediately preceding years will be presented by state or territory.
Table II also will present the number of cases of measles, pertussis, and rubella re-
ported during the previous week. Reports of cases of imported measles previously
included out-of-state cases but now will include only the number of cases believed to
have resulted from importation from other countries. The category indigenous mea-
sles cases will include all other measles cases reported by the state or territory.
Publication of reports of cases of three diseases—tickborne typhus fever (Rocky
Mountain spotted fever), toxic shock syndrome, and typhoid fever—will be discontin-
ued in Table II but will be included in Table I.
Reported by: Council of State and Territorial Epidemiologists. Div of Surveillance and Epidemiol-ogy, Epidemiology Program Office, CDC.
Editorial Note: National notifiable diseases data presented weekly in MMWR gener-
ally are transmitted through the National Electronic Telecommunications System for
Surveillance (NETSS) (4 ); the exception is data on AIDS cases, which are transmitted
through the human immunodeficiency virus/AIDS reporting system.
A key determinant for the changes in the table formats was the importance of list-
ing the distribution of cases by state or region for high-frequency diseases and
diseases targeted for national elimination. As a basis for comparison, cumulative to-
tals for both current and past year (when available) will be presented for the diseases
listed in Table II. The decision to change the classification of imported measles cases
will facilitate tracking of cases imported from other countries. Weekly publication of
NETSS data on botulism cases was not believed to be either timely or useful because
an emergency botulism antitoxin surveillance system is already in place.
Although deletions and additions to the national notifiable diseases list generally
are made during CSTE’s annual meeting in the spring, the recent national surveillance
conference focused on changes to the list. During that meeting, proposals also were
tentatively approved for adding diseases to national public health surveillance, includ-
ing genital chlamydia infections, coccidioidomycosis (recommended for regional
surveillance), cryptosporidiosis, hantavirus infection, hemolytic uremic syndrome, in-
vasive group A streptococcal infections, and drug-resistant Streptococcus pneu-
moniae. These additions have not yet been formally approved by CSTE.
References1. CDC. Update: changes in notifiable disease surveillance data—United States, 1992–1993.
MMWR 1993;42:824–6
2. CDC. National notifiable diseases reporting—United States, 1994. MMWR 1994;43:800–1.
3. CDC. Reported vaccine-preventable diseases—United States, 1993, and the Childhood Immu-
nization Initiative. MMWR 1994;43:57–60.
4. CDC. National Electronic Telecommunications System for Surveillance—United States, 1990–
1991. MMWR 1991;40;502–3.
Notifiable Diseases Data — Continued
956 MMWR January 6, 1995
Notifiable Diseases Data — Continued
Current Trends
Lack of Evidence for Wild Poliovirus Circulation —United States, 1993
Wild Poliovirus Circulation — ContinuedFollowing the isolation of wild poliovirus type 3 during January–February 1993
among members of a religious community objecting to vaccination in Alberta, Can-
ada, surveillance for poliomyelitis was enhanced among related communities in the
United States (1 ). In addition, during May–July 1993, a series of surveys was con-
ducted in seven states (Iowa, Missouri, New York, Ohio, Pennsylvania, Washington,
and Wisconsin) to determine whether wild poliovirus was circulating or had circulated
recently among members of these religious communities residing in the states. This
report summarizes the results of these surveys.
The isolation of wild poliovirus in Canada and the efforts to enhance surveillance in
the United States followed a polio outbreak in the Netherlands during September
1992–February 1993 (2–4 ). The outbreak was attributed to wild poliovirus type 3 and
resulted in 71 cases of polio among members of a religious community objecting to
vaccination. A virtually identical genotype of wild poliovirus type 3 was subsequently
isolated from stool samples collected from members of related religious groups in
Alberta during January–February 1993 (3 ) and again from samples collected in April
1993; however, this genotype was not isolated from samples collected in June 1993
(P. Duclos, Laboratory Center for Disease Control, Ottawa, Canada, personal commu-
nication, November 1994). Based on nucleotide sequence studies, the poliovirus
detected in the Netherlands and Canada most likely originated in India (4 ).
In response to the importation of poliovirus type 3 into the Western Hemisphere,
measures taken by state health departments in the United States during April 1993
included 1) intensified efforts to vaccinate persons in religious communities that usu-
ally object to vaccination; 2) enhanced surveillance to identify medical conditions
possibly caused by poliovirus (i.e., aseptic meningitis and acute paralysis); and 3) the
initiation of a series of serologic, stool, and/or environmental surveys in Iowa, Mis-
souri, New York, Ohio, Pennsylvania, Washington, and Wisconsin. The purpose of
these surveys was to determine whether poliovirus type 3 was circulating currently or
had circulated at any time since 1980 among unvaccinated members of these religious
communities.
No cases of aseptic meningitis or acute paralysis have been detected among mem-
bers of the religious communities since April 1993. Members of these religious
communities were enrolled for the serologic, stool, and environmental surveys;
poliovirus was not isolated (or detected) in the 122 stool specimens collected from
members of 73 families in five states (Iowa, Missouri, Ohio, Pennsylvania, and Wash-
ington). A total of 123 serum specimens from persons in four states (Missouri, Ohio,
Pennsylvania, and Washington) were tested for neutralizing poliovirus antibody; anti-
body to poliovirus types 1, 2, or 3 were detected in 40%, 92%, and 26% of specimens,
respectively. However, poliovirus type 3 was not detected in any of the 40 children
from Ohio and Pennsylvania who were unvaccinated and born after 1979. Based on
the serologic surveys, poliovirus type 3 had not circulated in these communities since
1980.
Vol. 43 / Nos. 51 & 52 MMWR 957

A total of 12 sewage and latrine waste specimens was collected during June and
July 1993 from Iowa, Missouri, New York, Pennsylvania, and Wisconsin and was ex-
amined by polymerase chain reaction; wild poliovirus was not detected in these
samples.
Reported by: AM Shemo, MD, S Miller, R Longenecker, A Gray, F Zitnik, R Berman, PennsylvaniaDept of Health. J Bronowski, T Payton, R Genieve, TJ Halpin, MD, State Epidemiologist, OhioDept of Health. F James, MD, J Hensley, Whatcom County Health Dept, Bellingham; S LaCroix,State Public Health Laboratory, Washington State Dept of Health. C Friedman, DO, J Hinkle,H Marx, HD Donnell, Jr, MD, State Epidemiologist, Missouri Dept of Health. J Berg, Div ofHealth, Wisconsin Dept of Health and Social Svcs. J Warming, D Miller, Iowa Dept of PublicHealth. S Thompson, G Birkhead, MD, D Krohn, New York State Dept of Health. R Berke, MD,M Clark, Chautauqua County Health Dept, Jamestown, New York. M Sobsey, PhD, Environ-mental Virology Laboratory, Univ of North Carolina, Chapel Hill. Div of Viral and RickettsialDiseases, National Center for Infectious Diseases; National Immunization Program, CDC.
Editorial Note: Wild poliovirus infection has not been documented among persons in
the United States since 1986, when wild poliovirus type 1 was isolated from a person
with imported paralytic polio. The last indigenous cases of polio in the United States
occurred in 1979 (5 ), and the last imported case in which wild poliovirus was not
isolated was reported in 1993*.
Polio can be prevented by vaccination. All children and all previously unvaccinated
adults should receive a primary series of at least three doses of oral poliovirus vaccine
(OPV) or inactivated poliovirus vaccine. For children, the standard recommended 4-
dose series of OPV comprises doses at ages 2, 4, and 6 months and 4–6 years (6 ).
The findings in this report suggest that poliovirus type 3, which caused both the
outbreak in the Netherlands during 1992–93 (4 ) and the “silent” transmission in Can-
ada during 1993 (3 ), was not imported into the United States. Despite these findings,
members of religious groups that object to vaccination and suboptimally vaccinated
preschool-aged children who reside in urban areas may be susceptible to polio. If
poliovirus is introduced into these unvaccinated groups, the number of persons who
are susceptible may support virus circulation. Some members of groups usually op-
posed to vaccination will accept vaccination if offered.
On September 29, 1994, the International Commission for the Certification of Polio
Eradication concluded that wild poliovirus transmission had been interrupted in the
Western Hemisphere (7 ). However, the commission recognized that the region will
remain at risk for poliovirus importation until polio is eradicated globally (8 ). The im-
portations into the Netherlands and Canada underscore the efficiency by which
poliovirus can be transported across borders and continents (3,9,10 ). Unvaccinated
persons in groups objecting to vaccination is the primary group in the United States in
which transient circulation of imported poliovirus may occur. To ensure that poliovirus
transmission cannot be sustained in the United States, poliovirus vaccination cover-
age should be increased to 90% in all areas.
References1. CDC. Poliomyelitis—Netherlands, 1992. MMWR 1992;41:775–8.
2. CDC. Update: poliomyelitis outbreak—Netherlands, 1992. MMWR 1992;41:917–9.
*This imported case occurred in a 2-year-old child who had onset of paralysis on December15, 1993, in Nigeria and was brought for tertiary hospital care to New York 2 weeks later; nopoliovirus was isolated from this child.
958 MMWR January 6, 1995
Wild Poliovirus Circulation — Continued
3. CDC. Isolation of wild poliovirus type 3 among members of a religious community objectingto vaccination—Alberta, Canada, 1993. MMWR 1993;42:337–9.
4. Oostvogel PM, van Wijngaarden JK, van der Avoort HG, et al. Poliomyelitis outbreak in anunvaccinated community in The Netherlands, 1992–93. Lancet 1994;344:665–70.
5. Strebel PM, Sutter RW, Cochi SL, et al. Epidemiology of poliomyelitis in the United Statesone decade after the last reported case of indigenous wild virus-associated disease. Clin InfectDis 1992;14:568–79.
6. CDC. General recommendations on immunizations: recommendations of the Advisory Com-mittee on Immunization Practices (ACIP). MMWR 1994;43(no. RR-1).
7. CDC. Certification of poliomyelitis eradication—the Americas, 1994. MMWR 1994;43:720–2.
8. Pan American Health Organization. Americas certified polio free. EPI Newsletter 1994;16:2–3.
9. Rico-Hesse R, Pallansch MA, Nottay BK, Kew OM. Geographic distribution of wild poliovirustype 1 genotypes. Virology 1987;160:311–22.
10. Kew OM, Pallansch MA, Nottay BK, Rico-Hesse R, De L, Yang CF. Genotypic relationship amongwild polioviruses from different regions of the world. In: Brinton MA, Heinz FX, eds. Newaspects of positive-strand RNA viruses. Washington, DC: American Society for Microbiology1990;52:357–65.
Wild Poliovirus Circulation — Continued
Notice to Readers
Recommended Childhood Immunization Schedule —United States, January 1995
Notice to Readers — ContinuedVaccination Schedule — ContinuedSince the 1960s, the two groups that historically have developed vaccine guidelines
for the United States have been the Advisory Committee on Immunization Practices
(ACIP) and the Committee on Infectious Diseases of the American Academy of Pediat-
rics (AAP). During 1994, these organizations participated in a working group that
included representatives from the American Academy of Family Physicians to develop
one vaccination schedule that would accommodate the current ACIP and AAP recom-
mendations and ensure the earliest administration of vaccines. The recommended
childhood immunization schedule (Table 1) has been endorsed by these groups and
becomes effective January 1995.
In the first year of life, three doses each of diphtheria and tetanus toxoids and per-
tussis vaccine (DTP), Haemophilus influenzae type b (Hib) vaccine, and oral poliovirus
vaccine (OPV) are recommended to be administered at ages 2, 4, and 6 months; how-
ever, the third dose of OPV may be administered through age 18 months, and for
children who receive Haemophilus b conjugate vaccine (Meningococcal Protein Con-
jugate) (PRP-OMP) at ages 2 and 4 months, a dose at age 6 months is not required. For
hepatitis B vaccine, the first dose is recommended at birth (but can be given up to age
2 months), the second at age 2 months (age 1–4 months is acceptable, provided at
least 1 month has elapsed since receipt of the first dose), and the third at age 6–
18 months. Vaccines recommended at age 12–15 months can be administered simul-
taneously during one visit or during two separate visits. The second dose of measles,
mumps, and rubella vaccine (MMR) may be given at entry to kindergarten or middle
school. Diphtheria and tetanus toxoids (Td) is recommended at age 11–12 years but
may be given through age 14–16 years. When this vaccine is given at age 11–12 years,
health-care providers can ensure that the child has received a second dose of MMR.
Reported by: Advisory Committee on Immunization Practices. American Academy of Pediatrics.American Academy of Family Physicians. National Immunization Program, CDC.
Notice to Readers — Continued
Vol. 43 / Nos. 51 & 52 MMWR 959
Wild Poliovirus Circulation — Continued

Birth
HB-2
TdDTP DTPor DTaP at >15 months
Hib Hib Hib
MMR
OPV OPV
Hib
MMR MMR
DTP DTP
OPV
DTaPDTP or
or
HB-1
HB-2
TdDTP DTPor DTaP at >15 months
Hib Hib Hib
MMR
OPV OPV
Hib
MMR MMR
DTP DTP
OPV
†
Poliovirus
Vaccine4
Months6
Months18
Months4 - 6Years
11-12Years
14-16Years
2Months
DTaPDTP or
Hepatitis B
H. influenzae
15Months
Measles, Mumps, Rubella
Diphtheria, Tetanus,Pertussis
12Months
or
¶
††
§
type b**
HB-1
HB-3HB-3
OPVOPV
TABLE 1. Recommended childhood immunization schedule* — United States, January1995
*Recommended vaccines are listed under the routinely recommended ages. Shaded barsindicate range of acceptable ages for vaccination.
†Vaccines recommended in the second year of life (i.e., 12–15 months of age) may be givenat either one or two visits.
§Infants born to hepatitis B surface antigen (HBsAg)-negative mothers should receive thesecond dose of hepatitis B vaccine between 1 and 4 months of age, provided at least1 month has elapsed since receipt of the first dose. The third dose is recommended between6 and 18 months of age. Infants born to HBsAg-positive mothers should receiveimmunoprophylaxis for hepatitis B with 0.5 ml Hepatitis B Immune Globulin (HBIG) within12 hours of birth, and 0.5 ml of either Merck Sharpe & Dohme (West Point, Pennsylvania)vaccine (Recombivax HB®) or of SmithKline Beecham (Philadelphia) vaccine (Engerix-B®)at a separate site. In these infants, the second dose of vaccine is recommended at 1 monthof age and the third dose at 6 months of age. All pregnant women should be screened forHBsAg during an early prenatal visit.
¶The fourth dose of diphtheria and tetanus toxoids and pertussis vaccine (DTP) may beadministered as early as 12 months of age, provided at least 6 months have elapsed sincethe third dose of DTP. Combined DTP-Hib products may be used when these two vaccinesare administered simultaneously. Diphtheria and tetanus toxoids and acellular pertussisvaccine (DTaP) is licensed for use for the fourth and/or fifth dose of DTP in children aged≥15 months and may be preferred for these doses in children in this age group.
**Three H. influenzae type b conjugate vaccines are available for use in infants:1) oligosaccharide conjugate Hib vaccine (HbOC) (HibTITER®, manufactured by PraxisBiologics, Inc. [West Henrietta, New York], and distributed by Lederle-Praxis Biologicals,[Wayne, New Jersey]); 2) polyribosylribitol phosphate-tetanus toxoid conjugate (PRP-T)(ActHIBTM, manufactured by Pasteur Mérieux Sérums & Vaccins, S.A. (Lyon, France), anddistributed by Connaught Laboratories, Inc. [Swiftwater, Pennsylvania], and OmniHIBTM,manufactured by Pasteur Mérieux Sérums & Vaccins, S.A., and distributed by SmithKlineBeecham); and 3) Haemophilus b conjugate vaccine (Meningococcal Protein Conjugate)(PRP-OMP) (PedvaxHIB®, manufactured by Merck Sharp & Dohme). Children who havereceived PRP-OMP at 2 and 4 months of age do not require a dose at 6 months of age.After the primary infant Hib conjugate vaccine series is completed, any licensed Hibconjugate vaccine may be used as a booster dose at age 12–15 months.
††The second dose of measles-mumps-rubella vaccine should be administered EITHER at4–6 years of age OR at 11–12 years of age.
Source: Advisory Committee on Immunization Practices, American Academy of Pediatrics,and American Academy of Family Physicians.
960 MMWR January 6, 1995
Notice to Readers — Continued

Monthly Immunization Table
To track progress toward achieving the goals of the Childhood Immunization Initia-
tive (CII), CDC publishes monthly a tabular summary of the number of cases of all
diseases preventable by routine childhood vaccination reported during the previous
month and year-to-date (provisional data). In addition, the table compares provisional
data with final data for the previous year and highlights the number of reported cases
among children aged <5 years, who are the primary focus of CII. Data in the table are
derived from CDC’s National Notifiable Diseases Surveillance System.
Erratum: Vol. 43, No. 46
In the article “Update: Influenza Activity—United States, 1994–95 Season,” an error
appeared on page 848. In the first sentence of the second paragraph, Minnesota, not
Michigan, should have been listed among the states that reported sporadic isolates of
influenza type A(H3N2) during July–September 1994.
Number of reported cases of diseases preventable by routine childhood vaccination— United States, November 1994 and 1993–1994*
Disease
No. cases, November
1994
Total cases January–November
No. cases among children aged <5 years†
January–November
1993 1994 1993 1994
Congenital rubellasyndrome (CRS) 2 5 6 4 5
Diphtheria 0 0 1 0 1Haemophilus influenzae§ 69 1,222 1,031 379 266Hepatitis B¶ 817 11,469 10,399 120 106Measles 3 300 876 114 211Mumps 97 1,484 1,212 245 198Pertussis 258 5,689 3,198 3,398 1,708Poliomyelitis, paralytic** 0 3 1 1 1Rubella 2 175 211 31 21Tetanus 1 39 34 0 0
*Data for 1993 are final and for 1994, are provisional.†For 1993 and 1994, age data were available for 90% or more cases, except for 1993 agedata for CRS, which were available for 80% of cases.
§Invasive disease; H. influenzae serotype is not routinely reported to the National NotifiableDiseases Surveillance System.
¶Because most hepatitis B virus infections among infants and children aged <5 years areasymptomatic (although likely to become chronic), acute disease surveillance does notreflect the incidence of this problem in this age group or the effectiveness of hepatitis B vac-cination in infants.
**One case with onset in 1994 has been confirmed; this case is vaccine-associated. Anadditional six suspected cases are under investigation. In 1993, three of 10 suspected caseswere confirmed; two of the confirmed cases of 1993 were vaccine-associated, and one wasimported. The imported case occurred in a 2-year-old Nigerian child brought to the UnitedStates for care of his paralytic illness; no poliovirus was isolated from the child.
Vol. 43 / Nos. 51 & 52 MMWR 961
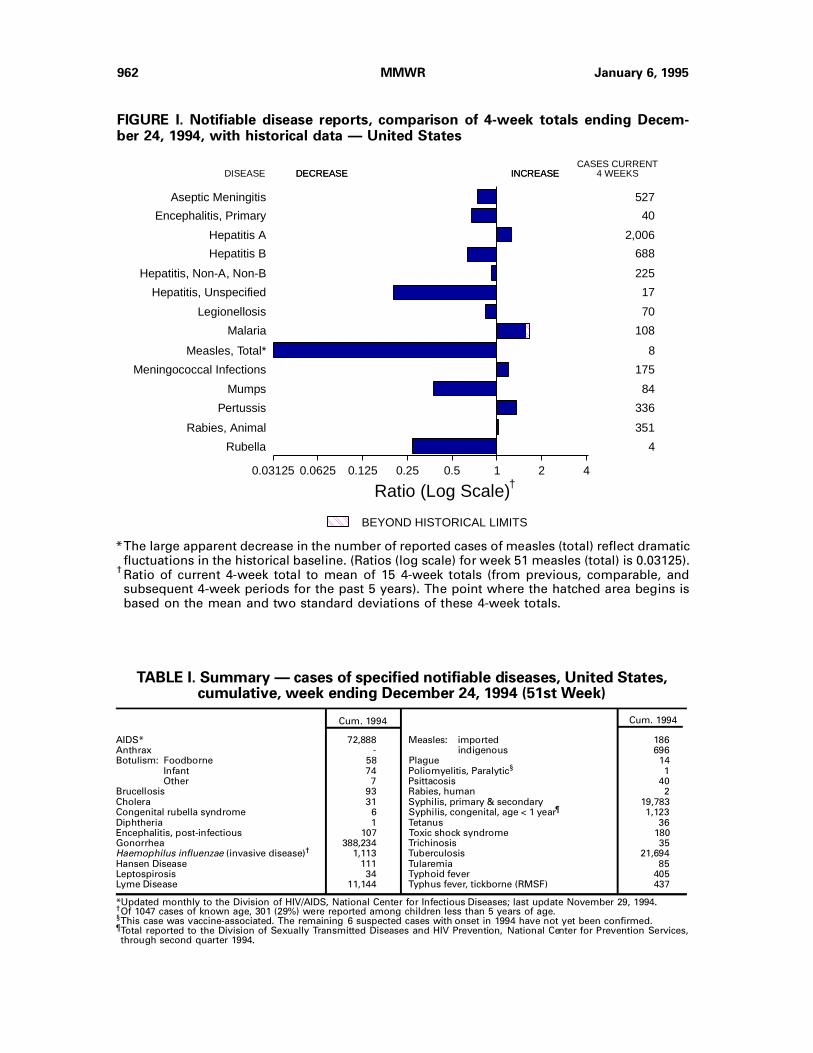
FIGURE I. Notifiable disease reports, comparison of 4-week totals ending Decem-ber 24, 1994, with historical data — United States
AIDS* 72,888 Measles: imported 186Anthrax - indigenous 696Botulism: Foodborne 58 Plague 14
Infant 74 Poliomyelitis, Paralytic§ 1Other 7 Psittacosis 40
Brucellosis 93 Rabies, human 2Cholera 31 Syphilis, primary & secondary 19,783Congenital rubella syndrome 6 Syphilis, congenital, age < 1 year¶ 1,123Diphtheria 1 Tetanus 36Encephalitis, post-infectious 107 Toxic shock syndrome 180Gonorrhea 388,234 Trichinosis 35Haemophilus influenzae (invasive disease)† 1,113 Tuberculosis 21,694Hansen Disease 111 Tularemia 85Leptospirosis 34 Typhoid fever 405Lyme Disease 11,144 Typhus fever, tickborne (RMSF) 437
Cum. 1994Cum. 1994
TABLE I. Summary — cases of specified notifiable diseases, United States,cumulative, week ending December 24, 1994 (51st Week)
*Updated monthly to the Division of HIV/AIDS, National Center for Infectious Diseases; last update November 29, 1994.†Of 1047 cases of known age, 301 (29%) were reported among children less than 5 years of age.§This case was vaccine-associated. The remaining 6 suspected cases with onset in 1994 have not yet been confirmed.¶Total reported to the Division of Sexually Transmitted Diseases and HIV Prevention, National Center for Prevention Services,through second quarter 1994.
DISEASE DECREASE INCREASECASES CURRENT
4 WEEKS
Aseptic Meningitis
Encephalitis, Primary
Hepatitis A
Hepatitis B
Hepatitis, Non-A, Non-B
Hepatitis, Unspecified
Legionellosis
Malaria
Measles, Total*
Meningococcal Infections
Mumps
Pertussis
Rabies, Animal
Rubella
527
40
2,006
688
225
17
70
108
8
175
84
336
351
4
0.03125 0.0625 0.125 0.25 0.5 1 2 4
Ratio (Log Scale)
BEYOND HISTORICAL LIMITS
†
DECREASE INCREASE
*The large apparent decrease in the number of reported cases of measles (total) reflect dramaticfluctuations in the historical baseline. (Ratios (log scale) for week 51 measles (total) is 0.03125).
†Ratio of current 4-week total to mean of 15 4-week totals (from previous, comparable, andsubsequent 4-week periods for the past 5 years). The point where the hatched area begins isbased on the mean and two standard deviations of these 4-week totals.
962 MMWR January 6, 1995

TABLE II. Cases of selected notifiable diseases, United States, weeks endingDecember 24, 1994, and December 25, 1993 (51st Week)
UNITED STATES 72,888 7,932 650 107 388,234 391,692 23,054 11,277 4,181 402 1,511 11,144
NEW ENGLAND 2,589 311 18 5 8,276 7,699 283 305 127 15 75 2,560Maine 79 32 5 - 89 78 24 11 - - 5 27N.H. 60 33 - 2 105 71 15 22 8 - - 31Vt. 34 36 3 - 35 24 14 - - - 1 13Mass. 1,309 90 8 1 3,182 3,132 104 175 99 13 57 256R.I. 241 120 2 2 463 423 29 8 20 2 12 471Conn. 866 - - - 4,402 3,971 97 89 - - - 1,762
MID. ATLANTIC 21,304 914 61 19 43,111 45,686 1,657 1,449 443 9 245 7,047Upstate N.Y. 2,006 443 36 3 10,649 10,049 520 379 217 5 60 4,375N.Y. City 12,177 146 7 5 14,236 12,294 683 374 4 - 10 42N.J. 4,655 - - - 5,089 5,558 278 356 187 - 41 1,303Pa. 2,466 325 18 11 13,137 17,785 176 340 35 4 134 1,327
E.N. CENTRAL 5,883 1,518 164 22 76,513 84,238 2,480 1,123 306 12 438 136Ohio 1,095 390 55 4 23,319 22,287 1,153 165 24 - 192 78Ind. 589 201 12 1 9,055 8,523 362 180 10 - 106 14Ill. 2,896 386 56 5 19,579 29,314 453 225 65 5 31 11Mich. 960 534 37 12 17,501 17,680 349 428 204 7 79 33Wis. 343 7 4 - 7,059 6,434 163 125 3 - 30 -
W.N. CENTRAL 1,502 431 38 8 21,950 21,068 1,126 648 108 12 94 285Minn. 375 27 9 - 3,493 2,381 231 64 23 1 2 165Iowa 96 120 1 1 1,576 1,508 64 26 13 11 33 17Mo. 671 157 8 4 11,880 12,728 570 495 42 - 38 87N. Dak. 22 13 4 - 34 52 6 1 - - 4 -S. Dak. 15 2 4 - 199 246 37 4 - - 1 -Nebr. 84 37 5 3 1,060 484 118 29 14 - 10 2Kans. 239 75 7 - 3,708 3,669 100 29 16 - 6 14
S. ATLANTIC 17,469 1,550 146 35 108,480 98,356 1,441 2,240 608 55 339 839Del. 247 38 1 - 1,941 1,532 17 5 1 - 26 78Md. 2,526 252 23 4 17,462 16,315 217 405 33 16 90 379D.C. 1,325 53 - 1 6,975 5,515 29 57 2 - 11 9Va. 1,089 321 32 6 13,443 12,143 185 131 25 10 12 129W. Va. 76 39 48 2 835 688 21 45 45 - 4 27N.C. 1,152 220 41 1 27,740 24,039 140 280 53 - 27 77S.C. 1,088 31 - - 12,807 10,612 40 33 10 - 16 7Ga. 2,071 50 1 - 4,299 4,660 33 532 185 - 99 106Fla. 7,895 546 - 21 22,978 22,852 759 752 254 29 54 27
E.S. CENTRAL 1,942 542 40 3 45,246 45,107 719 1,179 914 2 77 42Ky. 296 179 16 1 5,083 4,877 194 72 32 - 9 23Tenn. 693 144 12 - 14,965 14,285 322 1,018 861 1 44 13Ala. 554 170 9 1 14,133 15,792 131 89 21 1 13 6Miss. 399 49 3 1 11,065 10,153 72 - - - 11 -
W.S. CENTRAL 6,982 869 50 2 46,345 44,058 3,306 1,571 610 71 46 131Ark. 255 50 - - 6,439 7,530 209 37 8 3 10 8La. 1,146 34 8 - 11,753 11,746 154 174 185 1 14 2Okla. 244 - - - 3,259 4,580 376 320 348 3 11 76Tex. 5,337 785 42 2 24,894 20,202 2,567 1,040 69 64 11 45
MOUNTAIN 2,107 353 12 4 9,826 10,982 4,477 656 426 63 110 21Mont. 26 8 - - 87 84 24 22 15 - 16 -Idaho 56 6 - - 92 170 375 75 68 1 2 3Wyo. 18 4 3 1 86 75 30 23 166 - 6 5Colo. 763 137 3 - 3,544 3,743 589 99 73 18 21 1N. Mex. 198 20 - - 1,080 957 1,120 217 46 11 4 8Ariz. 559 77 - 2 3,084 3,689 1,480 76 18 15 29 -Utah 131 56 2 1 235 414 612 85 20 4 7 3Nev. 356 45 4 - 1,618 1,850 247 59 20 14 25 1
PACIFIC 13,110 1,444 121 9 28,487 34,498 7,565 2,106 639 163 87 83Wash. 856 - - - 2,834 3,600 342 76 72 2 8 -Oreg. 550 - - - 571 1,144 872 89 22 1 - -Calif. 11,481 1,295 118 8 23,609 28,502 6,090 1,902 540 157 75 83Alaska 40 18 3 - 875 648 203 11 - - - -Hawaii 183 131 - 1 598 604 58 28 5 3 4 -
Guam 1 22 - - 197 99 44 6 1 12 3 -P.R. 2,159 39 1 3 458 489 88 374 169 23 - -V.I. 49 - - - 41 93 - 1 - - - -Amer. Samoa - - - - 31 42 8 - - - - -C.N.M.I. - - - - 45 78 8 1 - - - -
Reporting Area
Cum.1994
Cum.1994
Cum.1993
Cum.1994
Cum.1994
Cum.1994
Cum.1994
Cum.1994
Cum.1994
Cum.1994
Cum.1994
Cum.1994
AsepticMenin-
gitisPost-in-fectious
AIDS*A
Encephalitis
Primary B NA,NBUnspeci-
fied
Hepatitis (Viral), by typeLyme
DiseaseGonorrhea
Legionel-losis
N: Not notifiable U: Unavailable C.N.M.I.: Commonwealth of Northern Mariana Islands
*Updated monthly to the Division of HIV/AIDS, National Center for Infectious Diseases; last update November 29, 1994.
Vol. 43 / Nos. 51 & 52 MMWR 963

TABLE II. (Cont’d.) Cases of selected notifiable diseases, United States, weeks endingDecember 24, 1994, and December 25, 1993 (51st Week)
UNITED STATES 1,055 3 696 2 186 304 2,584 16 1,561 55 3,576 6,206 - 219 177
NEW ENGLAND 78 - 14 - 14 63 138 - 26 13 471 745 - 131 2Maine 6 - 1 - 4 1 23 - 3 - 18 20 - - 1N.H. 3 - 1 - - 2 7 - 4 - 84 157 - - -Vt. 3 - 2 - 1 31 4 - - - 45 92 - - -Mass. 34 - 2 - 6 18 61 - 3 13 277 377 - 125 1R.I. 9 - 4 - 3 2 - - 4 - 7 14 - 3 -Conn. 23 - 4 - - 9 43 - 12 - 40 85 - 3 -
MID. ATLANTIC 216 - 172 - 33 38 253 - 110 2 594 946 - 10 59Upstate N.Y. 56 - 12 - 14 8 94 - 32 2 232 347 - 8 17N.Y. City 82 - 11 - 3 19 11 - 13 - 157 97 - 1 22N.J. 48 - 144 - 12 11 55 - 7 - 11 85 - 1 15Pa. 30 - 5 - 4 - 93 - 58 - 194 417 - - 5
E.N. CENTRAL 102 - 59 - 44 31 412 4 261 2 417 1,552 - 12 8Ohio 15 - 15 - 2 9 118 1 75 1 158 461 - - 1Ind. 15 - - - 1 1 82 - 7 1 66 176 - - 3Ill. 39 - 17 - 39 9 119 - 106 - 95 432 - 3 1Mich. 31 - 24 - 2 6 58 3 59 - 48 115 - 9 2Wis. 2 - 3 - - 6 35 - 14 - 50 368 - - 1
W.N. CENTRAL 45 - 126 - 44 3 176 1 67 - 223 549 - 2 1Minn. 14 - - - - - 18 - 5 - 100 319 - - -Iowa 5 - 6 - 1 - 20 - 16 - 23 37 - - -Mo. 13 - 118 - 42 1 87 1 40 - 45 142 - 2 1N. Dak. 1 - - - - - 1 - 5 - 5 5 - - -S. Dak. - - - - - - 9 - - - 26 8 - - -Nebr. 5 - 1 - 1 - 13 - 1 - 11 14 - - -Kans. 7 - 1 - - 2 28 - - - 13 24 - - -
S. ATLANTIC 226 - 59 - 8 29 440 2 203 4 363 664 - 11 7Del. 3 - - - - - 5 - - - 3 10 - - -Md. 100 - 2 - 2 4 44 - 68 3 80 131 - - 3D.C. 15 - - - - - 7 - - 1 11 14 - - -Va. 37 - 1 - 2 4 66 2 46 - 36 75 - - -W. Va. - - 36 - - - 14 - 3 - 5 8 - - -N.C. 11 - 2 - 1 1 54 - 36 - 140 199 - - -S.C. 5 - - - - - 35 - 8 - 14 73 - - -Ga. 26 - 3 - - - 69 - 9 - 27 56 - 2 -Fla. 29 - 15 - 3 20 146 - 33 - 47 98 - 9 4
E.S. CENTRAL 32 - 28 - - 1 158 - 27 1 123 293 - - 1Ky. 12 - - - - - 41 - - - 59 38 - - 1Tenn. 10 - 28 - - - 40 - 8 - 22 183 - - -Ala. 9 - - - - 1 77 - 12 1 35 61 - - -Miss. 1 - - - - - - - 7 - 7 11 - - -
W.S. CENTRAL 75 - 11 - 8 10 332 1 436 9 226 190 - 13 18Ark. 3 - - - 1 - 45 - 5 - 27 12 - - -La. 10 - - - 1 1 40 1 35 - 12 14 - - 1Okla. 7 - - - - - 35 - 23 - 32 81 - 4 1Tex. 55 - 11 - 6 9 212 - 373 9 155 83 - 9 16
MOUNTAIN 39 3 155 2 20 7 167 3 156 14 492 448 - 5 11Mont. - - - - - - 6 - - - 11 11 - - -Idaho 2 - 1 - - - 17 - 10 11 161 99 - - 2Wyo. 1 - - - - - 9 - 3 - - 1 - - -Colo. 18 - 17 - 3 3 39 - 3 - 125 185 - - 2N. Mex. 3 - - - - - 17 N N 2 36 41 - - -Ariz. 9 3 5 2 4 3 48 - 95 1 132 70 - - 2Utah 4 - 132 - 2 - 19 - 26 - 24 36 - 4 4Nev. 2 - - - 11 1 12 3 18 - 3 5 - 1 1
PACIFIC 242 - 72 - 15 122 508 5 275 10 667 819 - 35 70Wash. 16 - - - - - 33 1 9 2 35 86 - - -Oreg. 14 - - - 2 4 106 N N 2 43 105 - 3 -Calif. 195 - 56 - 9 96 355 4 244 6 567 609 - 27 41Alaska 2 - 16 - - 2 5 - 4 - 1 5 - 1 1Hawaii 15 - - - 4 20 9 - 18 - 21 14 - 4 28
Guam 4 U 211 U - 19 1 U 6 U 2 - U 1 -P.R. 3 - 13 - - 356 15 - 2 - 2 11 - - -V.I. - U - U - - - U 1 U - - U - -Amer. Samoa - - - - - - - - 1 - 2 2 - - -C.N.M.I. 1 U 26 U - 87 - U 2 U - 1 U - -
Reporting Area
Cum.1994
Cum.1994
Cum.1994
1994Cum.1994
Cum.1994
Cum.1993
1994Cum.1994
Cum.1994
1994Cum.1993
Indigenous Imported*Malaria
Measles (Rubeola)
RubellaMumps
Menin-gococcalInfections
1994
Total
Cum.1993
1994
Pertussis
*For measles only, imported cases include both out-of-state and international importations.
N: Not notifiable U: Unavailable † International § Out-of-state
964 MMWR January 6, 1995

TABLE II. (Cont’d.) Cases of selected notifiable diseases, United States, weeks endingDecember 24, 1994, and December 25, 1993 (51st Week)
UNITED STATES 19,783 25,710 180 21,694 22,632 85 405 437 7,171
NEW ENGLAND 215 348 4 515 534 1 22 15 1,846Maine 4 8 1 27 25 - - - -N.H. 4 25 - 16 17 - - - 212Vt. - 1 1 10 7 - - - 140Mass. 90 122 2 268 305 1 18 7 717R.I. 16 15 - 52 58 - 1 - 44Conn. 101 177 - 142 122 - 3 8 733
MID. ATLANTIC 1,352 2,353 28 4,311 4,916 2 110 18 1,825Upstate N.Y. 161 245 15 502 678 1 12 6 1,306N.Y. City 562 1,183 - 2,509 2,830 1 72 1 -N.J. 234 303 - 800 813 - 20 4 272Pa. 395 622 13 500 595 - 6 7 247
E.N. CENTRAL 2,756 4,160 40 2,118 2,309 8 73 44 66Ohio 1,106 1,170 11 334 303 1 7 27 4Ind. 255 360 2 191 219 2 7 5 13Ill. 812 1,604 12 1,081 1,234 3 46 10 19Mich. 278 543 15 447 459 1 6 2 14Wis. 305 483 - 65 94 1 7 - 16
W.N. CENTRAL 1,147 1,592 26 566 506 39 1 39 214Minn. 55 56 1 126 80 1 - - 17Iowa 71 64 8 62 59 - - 1 85Mo. 957 1,342 7 245 243 25 1 20 26N. Dak. - 4 1 8 7 1 - - 12S. Dak. 1 2 - 25 14 2 - 13 39Nebr. 11 10 4 19 23 3 - 1 -Kans. 52 114 5 81 80 7 - 4 35
S. ATLANTIC 5,295 6,394 8 3,956 4,511 2 48 207 1,947Del. 27 91 - 40 47 - 1 - 41Md. 323 356 - 333 392 1 14 24 508D.C. 213 325 - 108 160 - 1 - 3Va. 788 644 1 292 444 - 8 19 421W. Va. 9 12 - 79 75 - - 2 80N.C. 1,620 1,893 1 551 577 - - 82 172S.C. 798 909 - 376 394 - - 20 173Ga. 790 1,052 1 672 741 1 2 55 361Fla. 727 1,112 5 1,505 1,681 - 22 5 188
E.S. CENTRAL 3,849 4,058 6 1,379 1,610 2 4 47 220Ky. 214 331 2 327 375 2 1 9 26Tenn. 1,009 1,156 3 401 508 - 3 29 71Ala. 621 861 1 429 487 - - 2 123Miss. 2,005 1,710 - 222 240 - - 7 -
W.S. CENTRAL 4,235 5,382 2 2,964 2,651 17 16 53 644Ark. 465 549 - 277 185 16 - 11 25La. 1,635 2,517 - 193 357 - 3 - 69Okla. 111 277 2 239 166 1 3 35 42Tex. 2,024 2,039 - 2,255 1,943 - 10 7 508
MOUNTAIN 233 251 13 521 565 9 12 14 135Mont. 4 1 - 9 13 3 - 4 22Idaho 2 - 3 12 12 - - - 3Wyo. 2 13 - 9 6 - - 2 19Colo. 128 87 6 21 108 1 3 4 15N. Mex. 19 24 - 65 59 1 1 2 8Ariz. 39 95 2 229 236 - 3 1 45Utah 8 11 2 55 30 2 2 - 13Nev. 31 20 - 121 101 2 3 1 10
PACIFIC 701 1,172 53 5,364 5,030 5 119 - 274Wash. 32 55 3 253 260 - 4 - -Oreg. 21 40 - 90 - 2 5 - 12Calif. 641 1,061 46 4,709 4,467 2 105 - 232Alaska 4 8 - 63 56 1 - - 30Hawaii 3 8 4 249 247 - 5 - -
Guam 10 3 - 170 65 - 1 - -P.R. 298 486 - 159 213 - - - 61V.I. 28 42 - - 2 - - - -Amer. Samoa 1 - - 4 4 - 1 - -C.N.M.I. 2 7 - 35 41 - 1 - -
Reporting Area
Cum.1993
Cum.1994
Cum.1994
Cum.1994
Cum.1994
Cum.1994
Cum.1994
Cum.1994
Syphilis(Primary & Secondary)
Tula-remia
Rabies,AnimalTuberculosis
Typhus Fever(Tick-borne)
(RMSF)
Toxic-Shock
Syndrome
Cum.1993
TyphoidFever
U: Unavailable
Vol. 43 / Nos. 51 & 52 MMWR 965

NEW ENGLAND 627 425 109 66 13 13 42Boston, Mass. 148 83 26 23 8 7 9Bridgeport, Conn. 44 29 9 5 1 - 2Cambridge, Mass. 24 22 1 1 - - 3Fall River, Mass. 34 30 4 - - - 1Hartford, Conn. 56 36 14 4 2 - 1Lowell, Mass. 32 25 5 1 1 - 4Lynn, Mass. 12 8 2 2 - - -New Bedford, Mass. 35 21 7 6 - 1 1New Haven, Conn. 45 28 10 5 1 1 3Providence, R.I. 45 26 13 6 - - 4Somerville, Mass. 3 3 - - - - -Springfield, Mass. 59 44 10 4 - 1 9Waterbury, Conn. 35 29 2 4 - - 2Worcester, Mass. 55 41 6 5 - 3 3
MID. ATLANTIC 2,685 1,792 495 288 56 54 136Albany, N.Y. 53 34 11 5 1 2 4Allentown, Pa. 20 16 3 1 - - -Buffalo, N.Y. 107 90 12 4 - 1 14Camden, N.J. 27 18 6 2 - 1 1Elizabeth, N.J. 17 14 2 1 - - 1Erie, Pa.§ 51 37 8 4 1 1 2Jersey City, N.J. 57 41 3 9 1 3 -New York City, N.Y. 1,539 982 306 193 31 27 59Newark, N.J. 70 32 10 22 3 3 1Paterson, N.J. 34 23 8 2 - 1 1Philadelphia, Pa. 295 190 62 27 7 9 21Pittsburgh, Pa.§ 62 48 9 1 2 2 7Reading, Pa. 18 13 3 2 - - 4Rochester, N.Y. 137 102 21 6 7 1 10Schenectady, N.Y. 30 25 4 1 - - 1Scranton, Pa.§ 26 21 5 - - - 2Syracuse, N.Y. 90 69 14 2 3 2 5Trenton, N.J. 32 21 5 5 - 1 3Utica, N.Y. 20 16 3 1 - - -Yonkers, N.Y. U U U U U U U
E.N. CENTRAL 1,949 1,227 384 181 86 53 102Akron, Ohio 53 33 13 4 2 1 -Canton, Ohio 42 34 8 - - - 3Chicago, Ill. 361 154 73 72 43 19 8Cincinnati, Ohio 23 16 4 2 1 - 1Cleveland, Ohio 169 102 36 20 4 7 4Columbus, Ohio 182 128 33 14 7 - 16Dayton, Ohio 117 97 16 1 - 3 10Detroit, Mich. 175 96 48 20 5 6 5Evansville, Ind. 49 36 9 - - 4 -Fort Wayne, Ind. 68 49 12 4 2 1 5Gary, Ind. 18 7 8 1 1 1 -Grand Rapids, Mich. 70 53 13 1 2 1 8Indianapolis, Ind. 169 108 35 14 10 2 11Madison, Wis. 58 43 10 3 1 1 7Milwaukee, Wis. 81 61 12 8 - - 6Peoria, Ill. 40 28 9 2 1 - 4Rockford, Ill. 51 38 8 1 3 1 1South Bend, Ind. 53 42 7 2 1 1 4Toledo, Ohio 109 77 - 8 3 3 6Youngstown, Ohio 61 25 30 4 - 2 3
W.N. CENTRAL 804 582 112 59 21 19 41Des Moines, Iowa 120 88 18 9 - 5 12Duluth, Minn. 32 27 2 3 - - 5Kansas City, Kans. 2 2 - - - - -Kansas City, Mo. 119 73 18 7 5 5 3Lincoln, Nebr. 27 23 3 1 - - 3Minneapolis, Minn. 213 160 29 16 3 5 14Omaha, Nebr. 79 56 12 6 2 3 2St. Louis, Mo. 148 107 20 15 5 1 -St. Paul, Minn. 51 37 8 2 4 - 2Wichita, Kans. 13 9 2 - 2 - -
S. ATLANTIC 1,315 817 260 148 40 46 88Atlanta, Ga. 131 92 14 20 1 4 7Baltimore, Md. 308 171 75 40 14 8 32Charlotte, N.C. 113 66 28 12 5 2 13Jacksonville, Fla. 124 91 18 11 2 2 8Miami, Fla. 108 69 18 14 5 2 -Norfolk, Va. 44 25 9 7 2 1 2Richmond, Va. 57 30 20 5 2 - 3Savannah, Ga. 52 35 8 8 - 1 5St. Petersburg, Fla. 59 46 7 2 1 3 4Tampa, Fla. 172 116 41 10 2 3 11Washington, D.C. 133 66 22 19 6 20 3Wilmington, Del. 14 10 - - - - -
E.S. CENTRAL 829 554 155 62 24 34 68Birmingham, Ala. 131 81 29 10 6 5 4Chattanooga, Tenn. 78 58 13 4 3 - 7Knoxville, Tenn. 90 70 15 1 1 3 6Lexington, Ky. 75 51 15 2 3 4 8Memphis, Tenn. 242 153 44 20 7 18 29Mobile, Ala. 74 57 12 4 - 1 2Montgomery, Ala. 29 22 5 1 1 - 3Nashville, Tenn. 110 62 22 20 3 3 9
W.S. CENTRAL 1,224 817 228 108 40 31 58Austin, Tex. 49 35 9 3 2 - 1Baton Rouge, La. 79 54 10 9 3 3 -Corpus Christi, Tex. 45 33 9 1 1 1 -Dallas, Tex. 201 133 35 19 8 6 7El Paso, Tex. 98 60 18 10 7 3 11Ft. Worth, Tex. 127 76 28 15 5 3 6Houston, Tex. U U U U U U ULittle Rock, Ark. 62 37 17 4 2 2 6New Orleans, La. 169 114 28 20 5 2 -San Antonio, Tex. 230 157 41 22 4 6 14Shreveport, La. 83 51 24 4 2 2 8Tulsa, Okla. 81 67 9 1 1 3 5
MOUNTAIN 964 638 173 101 25 27 60Albuquerque, N.M. 92 66 15 8 2 1 1Colo. Springs, Colo. 53 32 17 3 - 1 1Denver, Colo. 135 86 21 19 7 2 7Las Vegas, Nev. 191 121 39 21 4 6 13Ogden, Utah 30 25 3 - - 2 1Phoenix, Ariz. 195 113 38 31 4 9 15Pueblo, Colo. 33 26 3 4 - - 2Salt Lake City, Utah 103 71 17 8 4 3 14Tucson, Ariz. 132 98 20 7 4 3 6
PACIFIC 1,832 1,243 311 180 34 40 131Berkeley, Calif. 24 17 4 2 - 1 -Fresno, Calif. 119 77 24 15 1 2 4Glendale, Calif. 25 21 3 1 - - 1Honolulu, Hawaii 80 55 13 7 2 3 4Long Beach, Calif. 73 47 14 9 1 2 10Los Angeles, Calif. 499 312 89 63 20 8 19Pasadena, Calif. 35 29 4 - 1 1 4Portland, Oreg. 94 67 15 6 - 6 7Sacramento, Calif. U U U U U U USan Diego, Calif. 187 126 33 16 1 11 21San Francisco, Calif. 151 91 22 20 1 - 20San Jose, Calif. 189 134 33 15 2 5 19Santa Cruz, Calif. 45 33 6 5 1 - 5Seattle, Wash. 141 102 25 11 3 - 6Spokane, Wash. 47 36 6 4 - 1 5Tacoma, Wash. 123 96 20 6 1 - 6
TOTAL 12,229¶
8,095 2,227 1,193 339 317 726
Reporting Area>65 45-64 25-44 1-24 <1
P&I†
TotalAllAges
All Causes, By Age (Years)
Reporting AreaP&I
†
TotalAllAges
All Causes, By Age (Years)
>65 45-64 25-44 1-24 <1
*Mortality data in this table are voluntarily reported from 121 cities in the United States, most of which have populations of 100,000 ormore. A death is reported by the place of its occurrence and by the week that the death certificate was filed. Fetal deaths are notincluded.
†Pneumonia and influenza.§Because of changes in reporting methods in these 3 Pennsylvania cities, these numbers are partial counts for the current week. Completecounts will be available in 4 to 6 weeks.
¶Total includes unknown ages.U: Unavailable.
TABLE III. Deaths in 121 U.S. cities,* week endingDecember 24, 1994 (51st Week)
966 MMWR January 6, 1995

FIGURE I. Notifiable disease reports, comparison of 4-week totals ending Decem-ber 31, 1994, with historical data — United States
AIDS* 78,126 Measles: imported 188Anthrax - indigenous 707Botulism: Foodborne 59 Plague 14
Infant 76 Poliomyelitis, Paralytic§ 1Other 7 Psittacosis 41
Brucellosis 95 Rabies, human 5Cholera 39 Syphilis, primary & secondary 20,183Congenital rubella syndrome 6 Syphilis, congenital, age < 1 year¶ 1,123Diphtheria 1 Tetanus 29Encephalitis, post-infectious 107 Toxic shock syndrome 183Gonorrhea 400,592 Trichinosis 35Haemophilus influenzae (invasive disease)† 1,126 Tuberculosis 22,152Hansen Disease 111 Tularemia 85Leptospirosis 35 Typhoid fever 410Lyme Disease 11,424 Typhus fever, tickborne (RMSF) 441
Cum. 1994Cum. 1994
TABLE I. Summary — cases of specified notifiable diseases, United States,cumulative, week ending December 31, 1994 (52nd Week)
*Updated monthly to the Division of HIV/AIDS, National Center for Infectious Diseases; last update December 31, 1994.†Of 1055 cases of known age, 301 (29%) were reported among children less than 5 years of age.§This case was vaccine-associated. The remaining 6 suspected cases with onset in 1994 have not yet been confirmed.¶Total reported to the Division of Sexually Transmitted Diseases and HIV Prevention, National Center for Prevention Services,through second quarter 1994.
DISEASE DECREASE INCREASECASES CURRENT
4 WEEKS
Aseptic Meningitis
Encephalitis, Primary
Hepatitis A
Hepatitis B
Hepatitis, Non-A, Non-B
Hepatitis, Unspecified
Legionellosis
Malaria
Measles, Total*
Meningococcal Infections
Mumps
Pertussis
Rabies, Animal
Rubella
480
44
1,916
717
218
24
66
104
18
187
70
381
421
3
0.03125 0.0625 0.125 0.25 0.5 1 2 4
Ratio (Log Scale)BEYOND HISTORICAL LIMITS
†
*The large apparent decrease in the number of reported cases of measles (total) reflect dramaticfluctuations in the historical baseline. (Ratios (log scale) for week 52 measles (total) is 0.06170).
†Ratio of current 4-week total to mean of 15 4-week totals (from previous, comparable, andsubsequent 4-week periods for the past 5 years). The point where the hatched area begins isbased on the mean and two standard deviations of these 4-week totals.
Vol. 43 / Nos. 51 & 52 MMWR 967
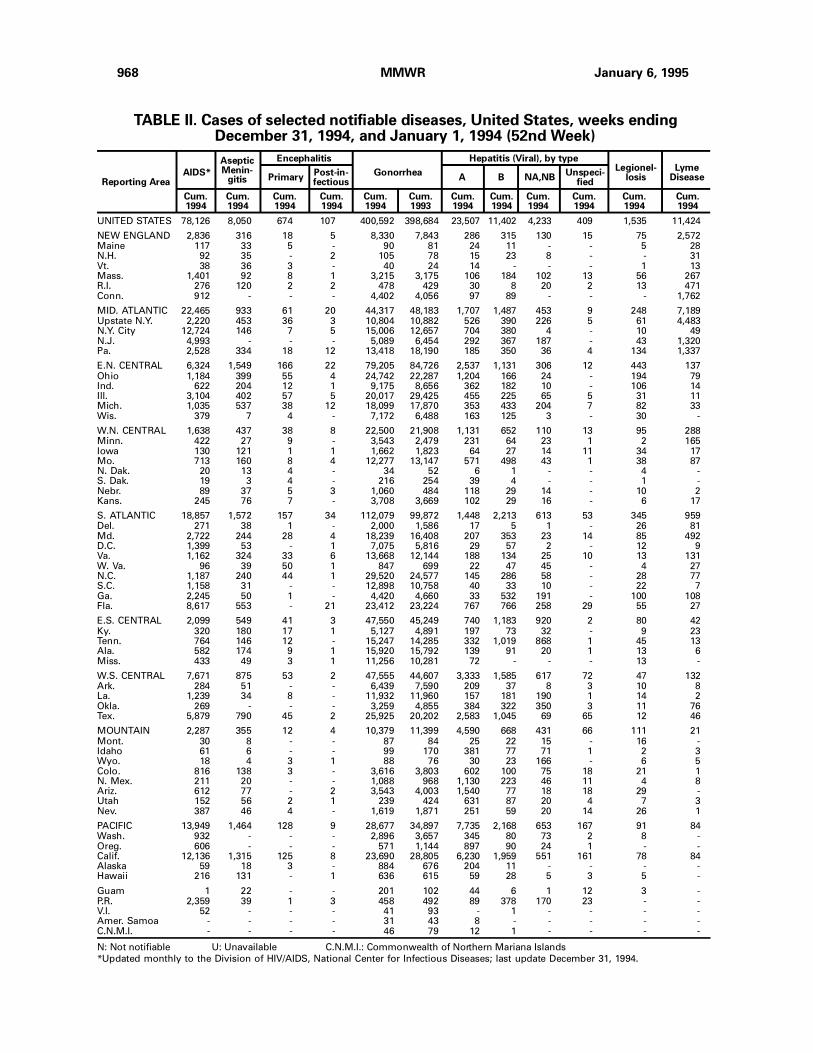
TABLE II. Cases of selected notifiable diseases, United States, weeks endingDecember 31, 1994, and January 1, 1994 (52nd Week)
UNITED STATES 78,126 8,050 674 107 400,592 398,684 23,507 11,402 4,233 409 1,535 11,424
NEW ENGLAND 2,836 316 18 5 8,330 7,843 286 315 130 15 75 2,572Maine 117 33 5 - 90 81 24 11 - - 5 28N.H. 92 35 - 2 105 78 15 23 8 - - 31Vt. 38 36 3 - 40 24 14 - - - 1 13Mass. 1,401 92 8 1 3,215 3,175 106 184 102 13 56 267R.I. 276 120 2 2 478 429 30 8 20 2 13 471Conn. 912 - - - 4,402 4,056 97 89 - - - 1,762
MID. ATLANTIC 22,465 933 61 20 44,317 48,183 1,707 1,487 453 9 248 7,189Upstate N.Y. 2,220 453 36 3 10,804 10,882 526 390 226 5 61 4,483N.Y. City 12,724 146 7 5 15,006 12,657 704 380 4 - 10 49N.J. 4,993 - - - 5,089 6,454 292 367 187 - 43 1,320Pa. 2,528 334 18 12 13,418 18,190 185 350 36 4 134 1,337
E.N. CENTRAL 6,324 1,549 166 22 79,205 84,726 2,537 1,131 306 12 443 137Ohio 1,184 399 55 4 24,742 22,287 1,204 166 24 - 194 79Ind. 622 204 12 1 9,175 8,656 362 182 10 - 106 14Ill. 3,104 402 57 5 20,017 29,425 455 225 65 5 31 11Mich. 1,035 537 38 12 18,099 17,870 353 433 204 7 82 33Wis. 379 7 4 - 7,172 6,488 163 125 3 - 30 -
W.N. CENTRAL 1,638 437 38 8 22,500 21,908 1,131 652 110 13 95 288Minn. 422 27 9 - 3,543 2,479 231 64 23 1 2 165Iowa 130 121 1 1 1,662 1,823 64 27 14 11 34 17Mo. 713 160 8 4 12,277 13,147 571 498 43 1 38 87N. Dak. 20 13 4 - 34 52 6 1 - - 4 -S. Dak. 19 3 4 - 216 254 39 4 - - 1 -Nebr. 89 37 5 3 1,060 484 118 29 14 - 10 2Kans. 245 76 7 - 3,708 3,669 102 29 16 - 6 17
S. ATLANTIC 18,857 1,572 157 34 112,079 99,872 1,448 2,213 613 53 345 959Del. 271 38 1 - 2,000 1,586 17 5 1 - 26 81Md. 2,722 244 28 4 18,239 16,408 207 353 23 14 85 492D.C. 1,399 53 - 1 7,075 5,816 29 57 2 - 12 9Va. 1,162 324 33 6 13,668 12,144 188 134 25 10 13 131W. Va. 96 39 50 1 847 699 22 47 45 - 4 27N.C. 1,187 240 44 1 29,520 24,577 145 286 58 - 28 77S.C. 1,158 31 - - 12,898 10,758 40 33 10 - 22 7Ga. 2,245 50 1 - 4,420 4,660 33 532 191 - 100 108Fla. 8,617 553 - 21 23,412 23,224 767 766 258 29 55 27
E.S. CENTRAL 2,099 549 41 3 47,550 45,249 740 1,183 920 2 80 42Ky. 320 180 17 1 5,127 4,891 197 73 32 - 9 23Tenn. 764 146 12 - 15,247 14,285 332 1,019 868 1 45 13Ala. 582 174 9 1 15,920 15,792 139 91 20 1 13 6Miss. 433 49 3 1 11,256 10,281 72 - - - 13 -
W.S. CENTRAL 7,671 875 53 2 47,555 44,607 3,333 1,585 617 72 47 132Ark. 284 51 - - 6,439 7,590 209 37 8 3 10 8La. 1,239 34 8 - 11,932 11,960 157 181 190 1 14 2Okla. 269 - - - 3,259 4,855 384 322 350 3 11 76Tex. 5,879 790 45 2 25,925 20,202 2,583 1,045 69 65 12 46
MOUNTAIN 2,287 355 12 4 10,379 11,399 4,590 668 431 66 111 21Mont. 30 8 - - 87 84 25 22 15 - 16 -Idaho 61 6 - - 99 170 381 77 71 1 2 3Wyo. 18 4 3 1 88 76 30 23 166 - 6 5Colo. 816 138 3 - 3,616 3,803 602 100 75 18 21 1N. Mex. 211 20 - - 1,088 968 1,130 223 46 11 4 8Ariz. 612 77 - 2 3,543 4,003 1,540 77 18 18 29 -Utah 152 56 2 1 239 424 631 87 20 4 7 3Nev. 387 46 4 - 1,619 1,871 251 59 20 14 26 1
PACIFIC 13,949 1,464 128 9 28,677 34,897 7,735 2,168 653 167 91 84Wash. 932 - - - 2,896 3,657 345 80 73 2 8 -Oreg. 606 - - - 571 1,144 897 90 24 1 - -Calif. 12,136 1,315 125 8 23,690 28,805 6,230 1,959 551 161 78 84Alaska 59 18 3 - 884 676 204 11 - - - -Hawaii 216 131 - 1 636 615 59 28 5 3 5 -
Guam 1 22 - - 201 102 44 6 1 12 3 -P.R. 2,359 39 1 3 458 492 89 378 170 23 - -V.I. 52 - - - 41 93 - 1 - - - -Amer. Samoa - - - - 31 43 8 - - - - -C.N.M.I. - - - - 46 79 12 1 - - - -
Reporting Area
Cum.1994
Cum.1994
Cum.1993
Cum.1994
Cum.1994
Cum.1994
Cum.1994
Cum.1994
Cum.1994
Cum.1994
Cum.1994
Cum.1994
AsepticMenin-
gitisPost-in-fectious
AIDS*A
Encephalitis
Primary B NA,NBUnspeci-
fied
Hepatitis (Viral), by typeLyme
DiseaseGonorrhea
Legionel-losis
N: Not notifiable U: Unavailable C.N.M.I.: Commonwealth of Northern Mariana Islands
*Updated monthly to the Division of HIV/AIDS, National Center for Infectious Diseases; last update December 31, 1994.
968 MMWR January 6, 1995
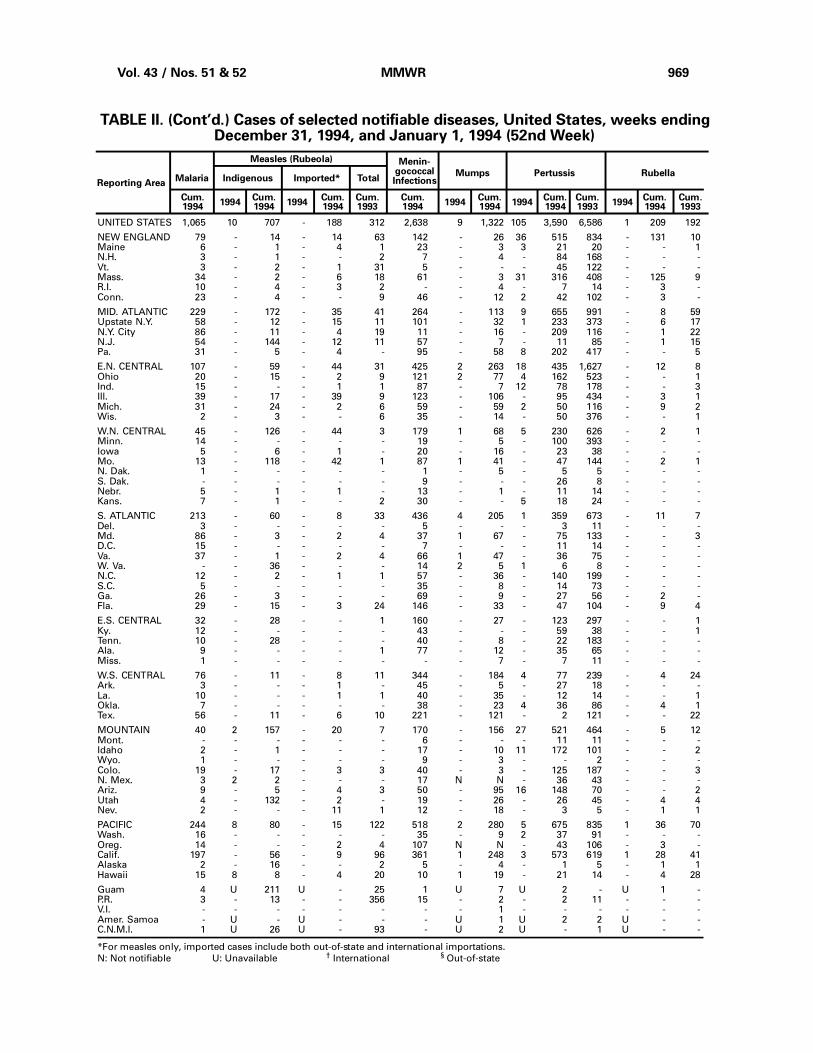
TABLE II. (Cont’d.) Cases of selected notifiable diseases, United States, weeks endingDecember 31, 1994, and January 1, 1994 (52nd Week)
UNITED STATES 1,065 10 707 - 188 312 2,638 9 1,322 105 3,590 6,586 1 209 192
NEW ENGLAND 79 - 14 - 14 63 142 - 26 36 515 834 - 131 10Maine 6 - 1 - 4 1 23 - 3 3 21 20 - - 1N.H. 3 - 1 - - 2 7 - 4 - 84 168 - - -Vt. 3 - 2 - 1 31 5 - - - 45 122 - - -Mass. 34 - 2 - 6 18 61 - 3 31 316 408 - 125 9R.I. 10 - 4 - 3 2 - - 4 - 7 14 - 3 -Conn. 23 - 4 - - 9 46 - 12 2 42 102 - 3 -
MID. ATLANTIC 229 - 172 - 35 41 264 - 113 9 655 991 - 8 59Upstate N.Y. 58 - 12 - 15 11 101 - 32 1 233 373 - 6 17N.Y. City 86 - 11 - 4 19 11 - 16 - 209 116 - 1 22N.J. 54 - 144 - 12 11 57 - 7 - 11 85 - 1 15Pa. 31 - 5 - 4 - 95 - 58 8 202 417 - - 5
E.N. CENTRAL 107 - 59 - 44 31 425 2 263 18 435 1,627 - 12 8Ohio 20 - 15 - 2 9 121 2 77 4 162 523 - - 1Ind. 15 - - - 1 1 87 - 7 12 78 178 - - 3Ill. 39 - 17 - 39 9 123 - 106 - 95 434 - 3 1Mich. 31 - 24 - 2 6 59 - 59 2 50 116 - 9 2Wis. 2 - 3 - - 6 35 - 14 - 50 376 - - 1
W.N. CENTRAL 45 - 126 - 44 3 179 1 68 5 230 626 - 2 1Minn. 14 - - - - - 19 - 5 - 100 393 - - -Iowa 5 - 6 - 1 - 20 - 16 - 23 38 - - -Mo. 13 - 118 - 42 1 87 1 41 - 47 144 - 2 1N. Dak. 1 - - - - - 1 - 5 - 5 5 - - -S. Dak. - - - - - - 9 - - - 26 8 - - -Nebr. 5 - 1 - 1 - 13 - 1 - 11 14 - - -Kans. 7 - 1 - - 2 30 - - 5 18 24 - - -
S. ATLANTIC 213 - 60 - 8 33 436 4 205 1 359 673 - 11 7Del. 3 - - - - - 5 - - - 3 11 - - -Md. 86 - 3 - 2 4 37 1 67 - 75 133 - - 3D.C. 15 - - - - - 7 - - - 11 14 - - -Va. 37 - 1 - 2 4 66 1 47 - 36 75 - - -W. Va. - - 36 - - - 14 2 5 1 6 8 - - -N.C. 12 - 2 - 1 1 57 - 36 - 140 199 - - -S.C. 5 - - - - - 35 - 8 - 14 73 - - -Ga. 26 - 3 - - - 69 - 9 - 27 56 - 2 -Fla. 29 - 15 - 3 24 146 - 33 - 47 104 - 9 4
E.S. CENTRAL 32 - 28 - - 1 160 - 27 - 123 297 - - 1Ky. 12 - - - - - 43 - - - 59 38 - - 1Tenn. 10 - 28 - - - 40 - 8 - 22 183 - - -Ala. 9 - - - - 1 77 - 12 - 35 65 - - -Miss. 1 - - - - - - - 7 - 7 11 - - -
W.S. CENTRAL 76 - 11 - 8 11 344 - 184 4 77 239 - 4 24Ark. 3 - - - 1 - 45 - 5 - 27 18 - - -La. 10 - - - 1 1 40 - 35 - 12 14 - - 1Okla. 7 - - - - - 38 - 23 4 36 86 - 4 1Tex. 56 - 11 - 6 10 221 - 121 - 2 121 - - 22
MOUNTAIN 40 2 157 - 20 7 170 - 156 27 521 464 - 5 12Mont. - - - - - - 6 - - - 11 11 - - -Idaho 2 - 1 - - - 17 - 10 11 172 101 - - 2Wyo. 1 - - - - - 9 - 3 - - 2 - - -Colo. 19 - 17 - 3 3 40 - 3 - 125 187 - - 3N. Mex. 3 2 2 - - - 17 N N - 36 43 - - -Ariz. 9 - 5 - 4 3 50 - 95 16 148 70 - - 2Utah 4 - 132 - 2 - 19 - 26 - 26 45 - 4 4Nev. 2 - - - 11 1 12 - 18 - 3 5 - 1 1
PACIFIC 244 8 80 - 15 122 518 2 280 5 675 835 1 36 70Wash. 16 - - - - - 35 - 9 2 37 91 - - -Oreg. 14 - - - 2 4 107 N N - 43 106 - 3 -Calif. 197 - 56 - 9 96 361 1 248 3 573 619 1 28 41Alaska 2 - 16 - - 2 5 - 4 - 1 5 - 1 1Hawaii 15 8 8 - 4 20 10 1 19 - 21 14 - 4 28
Guam 4 U 211 U - 25 1 U 7 U 2 - U 1 -P.R. 3 - 13 - - 356 15 - 2 - 2 11 - - -V.I. - - - - - - - - 1 - - - - - -Amer. Samoa - U - U - - - U 1 U 2 2 U - -C.N.M.I. 1 U 26 U - 93 - U 2 U - 1 U - -
Reporting Area
Cum.1994
Cum.1994
Cum.1994
1994Cum.1994
Cum.1994
Cum.1993
1994Cum.1994
Cum.1994
1994Cum.1993
Indigenous Imported*Malaria
Measles (Rubeola)
RubellaMumps
Menin-gococcalInfections
1994
Total
Cum.1993
1994
Pertussis
*For measles only, imported cases include both out-of-state and international importations.
N: Not notifiable U: Unavailable † International § Out-of-state
Vol. 43 / Nos. 51 & 52 MMWR 969

TABLE II. (Cont’d.) Cases of selected notifiable diseases, United States, weeks endingDecember 31, 1994, and January 1, 1994 (52nd Week)
UNITED STATES 20,183 26,470 183 22,152 24,324 85 410 441 7,347
NEW ENGLAND 215 351 4 528 619 1 22 15 1,958Maine 4 8 1 34 28 - - - -N.H. 4 25 - 16 26 - - - 212Vt. - 1 1 10 7 - - - 143Mass. 90 123 2 272 370 1 18 7 730R.I. 16 16 - 54 64 - 1 - 129Conn. 101 178 - 142 124 - 3 8 744
MID. ATLANTIC 1,390 2,823 29 4,469 5,248 2 113 19 1,839Upstate N.Y. 169 258 15 528 717 1 12 7 1,312N.Y. City 583 1,210 - 2,509 3,003 1 72 1 -N.J. 234 328 - 820 921 - 23 4 275Pa. 404 1,027 14 612 607 - 6 7 252
E.N. CENTRAL 2,858 4,210 40 2,163 2,404 8 73 39 66Ohio 1,157 1,209 11 345 309 1 7 22 4Ind. 259 362 2 193 248 2 7 5 13Ill. 845 1,604 12 1,108 1,281 3 46 10 19Mich. 291 551 15 447 463 1 6 2 14Wis. 306 484 - 70 103 1 7 - 16
W.N. CENTRAL 1,170 1,612 26 578 540 39 1 39 220Minn. 55 59 1 130 96 1 - - 17Iowa 71 64 8 66 59 - - 1 91Mo. 980 1,354 7 245 256 25 1 20 26N. Dak. - 4 1 8 7 1 - - 12S. Dak. 1 2 - 27 16 2 - 13 39Nebr. 11 10 4 19 23 3 - 1 -Kans. 52 119 5 83 83 7 - 4 35
S. ATLANTIC 5,397 6,495 8 3,992 5,191 2 50 215 1,982Del. 27 94 - 40 66 - 1 - 41Md. 334 365 - 348 401 1 14 25 520D.C. 214 326 - 112 160 - 1 - 3Va. 816 663 1 292 456 - 9 19 428W. Va. 9 12 - 79 75 - - 2 82N.C. 1,640 1,903 1 567 594 - 1 88 177S.C. 804 924 - 377 398 - - 20 177Ga. 808 1,081 1 672 753 1 2 56 366Fla. 745 1,127 5 1,505 2,288 - 22 5 188
E.S. CENTRAL 3,897 4,071 6 1,392 1,708 2 4 47 223Ky. 216 331 2 332 405 2 1 9 26Tenn. 1,018 1,156 3 401 555 - 3 29 71Ala. 631 861 1 433 487 - - 2 126Miss. 2,032 1,723 - 226 261 - - 7 -
W.S. CENTRAL 4,303 5,479 2 3,014 2,844 17 16 53 645Ark. 465 558 - 258 189 16 - 11 25La. 1,653 2,598 - 193 357 - 3 - 69Okla. 111 284 2 264 208 1 3 35 43Tex. 2,074 2,039 - 2,299 2,090 - 10 7 508
MOUNTAIN 249 256 13 600 605 9 12 14 135Mont. 4 1 - 24 22 3 - 4 22Idaho 2 - 3 13 12 - - - 3Wyo. 3 13 - 12 6 - - 2 19Colo. 129 90 6 21 108 1 3 4 15N. Mex. 21 26 - 78 74 1 1 2 8Ariz. 50 95 2 257 238 - 3 1 45Utah 9 11 2 55 44 2 2 - 13Nev. 31 20 - 140 101 2 3 1 10
PACIFIC 704 1,173 55 5,416 5,165 5 119 - 279Wash. 35 56 3 266 275 - 4 - -Oreg. 21 40 - 90 - 2 5 - 12Calif. 641 1,061 48 4,744 4,583 2 105 - 237Alaska 4 8 - 63 56 1 - - 30Hawaii 3 8 4 253 251 - 5 - -
Guam 11 4 - 170 84 - 1 - -P.R. 300 491 - 159 213 - - - 61V.I. 28 42 - - 2 - - - -Amer. Samoa 1 - - 4 4 - 1 - -C.N.M.I. 2 7 - 36 47 - 1 - -
Reporting Area
Cum.1993
Cum.1994
Cum.1994
Cum.1994
Cum.1994
Cum.1994
Cum.1994
Cum.1994
Syphilis(Primary & Secondary)
Tula-remia
Rabies,AnimalTuberculosis
Typhus Fever(Tick-borne)
(RMSF)
Toxic-Shock
Syndrome
Cum.1993
TyphoidFever
U: Unavailable
970 MMWR January 6, 1995

NEW ENGLAND 604 432 101 46 13 12 61Boston, Mass. 147 108 21 15 2 1 15Bridgeport, Conn. 41 33 5 2 - 1 2Cambridge, Mass. 21 17 2 2 - - 2Fall River, Mass. U U U U U U UHartford, Conn. 51 36 5 4 4 2 2Lowell, Mass. 28 19 5 1 1 2 1Lynn, Mass. 15 11 3 1 - - 1New Bedford, Mass. 20 12 7 1 - - 1New Haven, Conn. 45 26 11 6 2 - 1Providence, R.I. 38 21 10 5 - 2 4Somerville, Mass. 8 6 1 1 - - 1Springfield, Mass. 69 52 10 4 1 2 10Waterbury, Conn. 40 31 6 1 2 - 7Worcester, Mass. 81 60 15 3 1 2 14
MID. ATLANTIC 2,505 1,719 427 268 46 44 132Albany, N.Y. 29 20 4 4 - 1 -Allentown, Pa. 31 28 1 1 1 - -Buffalo, N.Y. 111 85 23 2 - 1 19Camden, N.J. 25 17 5 1 2 - 3Elizabeth, N.J. 29 22 5 2 - - -Erie, Pa.§ 40 29 6 4 1 - -Jersey City, N.J. 50 37 4 8 - 1 3New York City, N.Y. 1,562 1,045 290 180 24 22 61Newark, N.J. 48 18 14 12 2 2 3Paterson, N.J. 32 15 1 9 4 3 3Philadelphia, Pa. 196 130 35 22 4 5 14Pittsburgh, Pa.§ 44 31 8 3 2 - 3Reading, Pa. 20 15 2 3 - - 2Rochester, N.Y. 98 74 8 10 2 4 8Schenectady, N.Y. 29 24 2 3 - - -Scranton, Pa.§ 26 19 5 - 2 - 1Syracuse, N.Y. 74 57 10 3 1 3 5Trenton, N.J. 38 33 2 1 - 2 7Utica, N.Y. 23 20 2 - 1 - -Yonkers, N.Y. U U U U U U U
E.N. CENTRAL 2,096 1,334 406 217 90 49 106Akron, Ohio 63 46 11 2 - 4 -Canton, Ohio 42 35 5 1 - 1 1Chicago, Ill. 433 170 100 99 55 9 12Cincinnati, Ohio 192 140 32 10 5 5 24Cleveland, Ohio 124 83 21 13 5 2 2Columbus, Ohio 175 113 41 13 3 5 11Dayton, Ohio 103 80 16 4 - 3 7Detroit, Mich. 185 102 42 28 8 5 5Evansville, Ind. 23 16 6 1 - - -Fort Wayne, Ind. 62 49 9 2 2 - 2Gary, Ind. 15 5 8 2 - - -Grand Rapids, Mich. 67 57 5 4 - 1 5Indianapolis, Ind. 188 133 39 10 4 2 15Madison, Wis. U U U U U U UMilwaukee, Wis. 109 78 17 9 4 1 4Peoria, Ill. 49 27 13 4 - 5 1Rockford, Ill. 52 40 5 4 2 1 3South Bend, Ind. 47 40 6 1 - - 3Toledo, Ohio 118 84 19 10 1 4 11Youngstown, Ohio 49 36 11 - 1 1 -
W.N. CENTRAL 721 507 107 56 15 24 48Des Moines, Iowa 58 41 9 5 - 3 7Duluth, Minn. 21 14 4 2 1 - 1Kansas City, Kans. 34 26 5 3 - - 1Kansas City, Mo. 108 68 17 9 1 1 5Lincoln, Nebr. 24 19 3 1 - 1 1Minneapolis, Minn. 122 95 15 8 1 3 11Omaha, Nebr. 66 40 13 5 3 5 4St. Louis, Mo. 142 99 15 13 4 11 10St. Paul, Minn. 68 47 13 5 3 - 7Wichita, Kans. 78 58 13 5 2 - 1
S. ATLANTIC 1,189 744 235 156 29 22 83Atlanta, Ga. 160 103 29 25 2 1 8Baltimore, Md. 170 109 36 24 1 - 25Charlotte, N.C. 79 49 18 8 1 3 9Jacksonville, Fla. 115 78 21 15 - 1 11Miami, Fla. 107 64 21 17 3 2 -Norfolk, Va. 46 24 9 6 6 1 1Richmond, Va. 82 58 14 8 2 - 5Savannah, Ga. 51 37 10 4 - - 5St. Petersburg, Fla. 43 28 6 6 1 2 1Tampa, Fla. 158 107 33 12 3 3 16Washington, D.C. 164 80 34 31 10 9 2Wilmington, Del. 14 7 4 - - - -
E.S. CENTRAL 573 375 117 54 15 12 41Birmingham, Ala. 60 38 12 7 2 1 4Chattanooga, Tenn. 19 10 4 1 2 2 -Knoxville, Tenn. 62 40 9 9 4 - 4Lexington, Ky. 43 29 10 4 - - 4Memphis, Tenn. 166 110 31 16 4 5 19Mobile, Ala. 30 24 2 3 1 - -Montgomery, Ala. 48 32 13 2 - 1 2Nashville, Tenn. 145 92 36 12 2 3 8
W.S. CENTRAL 934 592 176 90 44 32 56Austin, Tex. 67 40 11 10 3 3 6Baton Rouge, La. 25 18 4 1 2 - -Corpus Christi, Tex. 37 22 5 7 1 2 1Dallas, Tex. 208 117 52 25 9 5 4El Paso, Tex. 66 47 8 5 3 3 6Ft. Worth, Tex. 98 62 18 13 4 1 6Houston, Tex. U U U U U U ULittle Rock, Ark. 76 40 18 5 7 6 6New Orleans, La. 56 33 12 6 4 1 -San Antonio, Tex. 159 115 24 10 4 6 11Shreveport, La. 53 38 6 5 4 - 8Tulsa, Okla. 89 60 18 3 3 5 8
MOUNTAIN 836 564 143 72 36 20 59Albuquerque, N.M. 95 57 15 13 7 3 3Colo. Springs, Colo. 57 42 9 4 2 - 5Denver, Colo. 89 62 10 11 2 4 11Las Vegas, Nev. 189 131 36 13 7 2 8Ogden, Utah 20 17 2 1 - - 3Phoenix, Ariz. 142 84 23 18 12 4 10Pueblo, Colo. 24 20 1 2 1 - -Salt Lake City, Utah 100 64 22 6 3 5 10Tucson, Ariz. 120 87 25 4 2 2 9
PACIFIC 1,343 896 223 133 37 29 96Berkeley, Calif. 20 13 1 3 - 3 2Fresno, Calif. U U U U U U UGlendale, Calif. 16 8 5 - 2 - 1Honolulu, Hawaii 71 48 12 5 2 3 3Long Beach, Calif. 79 57 13 6 1 2 9Los Angeles, Calif. 346 215 56 49 14 6 10Pasadena, Calif. 29 22 4 2 1 - 2Portland, Oreg. 145 95 27 18 3 2 13Sacramento, Calif. U U U U U U USan Diego, Calif. U U U U U U USan Francisco, Calif. 155 97 25 15 - 1 15San Jose, Calif. 175 122 31 14 3 5 16Santa Cruz, Calif. 30 22 5 2 1 - 6Seattle, Wash. 134 93 21 9 9 2 5Spokane, Wash. 50 42 6 1 - 1 4Tacoma, Wash. 93 62 17 9 1 4 10
TOTAL 10,801¶
7,163 1,935 1,092 325 244 682
Reporting Area>65 45-64 25-44 1-24 <1
P&I†
TotalAllAges
All Causes, By Age (Years)
Reporting AreaP&I
†
TotalAllAges
All Causes, By Age (Years)
>65 45-64 25-44 1-24 <1
*Mortality data in this table are voluntarily reported from 121 cities in the United States, most of which have populations of 100,000 ormore. A death is reported by the place of its occurrence and by the week that the death certificate was filed. Fetal deaths are notincluded.
†Pneumonia and influenza.§Because of changes in reporting methods in these 3 Pennsylvania cities, these numbers are partial counts for the current week. Completecounts will be available in 4 to 6 weeks.
¶Total includes unknown ages.U: Unavailable.
TABLE III. Deaths in 121 U.S. cities,* week endingDecember 31, 1994 (52nd Week)
Vol. 43 / Nos. 51 & 52 MMWR 971
The Morbidity and Mortality Weekly Report (MMWR) Series is prepared by the Centers for Disease Controland Prevention (CDC) and is available on a paid subscription basis from the Superintendent of Documents,U.S. Government Printing Office, Washington, DC 20402; telephone (202) 783-3238.
The data in the weekly MMWR are provisional, based on weekly reports to CDC by state healthdepartments. The reporting week concludes at close of business on Friday; compiled data on a national basisare officially released to the public on the succeeding Friday. Inquiries about the MMWR Series, includingmaterial to be considered for publication, should be directed to: Editor, MMWR Series, Mailstop C-08, Centersfor Disease Control and Prevention, Atlanta, GA 30333; telephone (404) 332-4555.
All material in the MMWR Series is in the public domain and may be used and reprinted without specialpermission; citation as to source, however, is appreciated.
Director, Centers for Disease Control and PreventionDavid Satcher, M.D., Ph.D.
Deputy Director, Centers for Disease Controland PreventionClaire V. Broome, M.D.
Director, Epidemiology Program OfficeStephen B. Thacker, M.D., M.Sc.
Editor, MMWR SeriesRichard A. Goodman, M.D., M.P.H.
Managing Editor, MMWR (weekly)Karen L. Foster, M.A.
Writers-Editors, MMWR (weekly)David C. JohnsonPatricia A. McGeeDarlene D. Rumph-PersonCaran R. Wilbanks
✩U.S. Government Printing Office: 1995-533-178/05047 Region IV
972 MMWR January 6, 1995