hematological parameters and metabolic syndrome: findings from an occupational cohort in ethiopia
TRANSCRIPT

Diabetes & Metabolic Syndrome: Clinical Research & Reviews 6 (2012) 22–27
Original article
Hematological parameters and metabolic syndrome: Findings from anoccupational cohort in Ethiopia
Kelsey Nebeck a, Bizu Gelaye a,d,*, Seblewengel Lemma b, Yemane Berhane b, Tamrat Bekele c,Atsede Khali c, Yoseph Haddis c, Michelle A. Williams a,d
a Department of Epidemiology, Multidisciplinary International Research Training Program, University of Washington School of Public Health, Seattle, WA, USAb Addis Continental Institute of Public Health, Addis Ababa, Ethiopiac International Clinical Laboratories, Addis Ababa, Ethiopiad Department of Epidemiology, Harvard School of Public Health, Boston, MA, USA
A R T I C L E I N F O
Keywords:
Hematological parameters
Metabolic syndrome
Hematological markers
Ethiopia
A B S T R A C T
Aims: To examine associations between hematological parameters (i.e., hemoglobin, hematocrit, platelet
counts, red blood cell (RBC), and white blood cell (WBC) counts) and components of metabolic syndrome
(MetS) among working adults in Addis Ababa, Ethiopia.
Materials and Methods: Participants were 1868 (1131 men and 737 women) working Ethiopian adults.
MetS was classified according to the International Diabetes Federation criterion. Odds ratios (ORs) and
95% confidence intervals (95% CIs) of MetS were calculated using logistic regression procedures.
Results: Hematologic parameters (hemoglobin, hematocrit, and RBC) were positively associated with
MetS components (Ptrend < 0.05). In both men and women, white blood cell (WBC) counts were positively
associated with BMI and waist circumference (P < 0.05). RBC counts were associated with diastolic blood
pressure in men (P < 0.05) and women (P < 0.001). Men in the third quartile of hemoglobin
concentrations had 2-fold increased odds (OR = 1.99; 95% CI) of MetS compared with the lowest
reference quartile (Ptrend = 0.031) while women in the fourth hemoglobin quartile had 2.37-fold
increased odds of having MetS compared with the reference group (Ptrend = 0.003). Both men and women
in the fourth quartiles of RBC counts had 2.26-fold and 3.44-fold increased odds of MetS (P = 0.002 in
men, P < 0.001 in women). Among women, those in the fourth quartiles of hematocrit and platelet counts
had 2.53-fold and 2.01-fold increased odds of MetS as compared with those in the reference group
(Ptrend = 0.004 and 0.065 respectively).
Conclusion: Our study findings provide evidence in support of using hematological markers for early
detection of individuals at risk for cardiovascular disease.
� 2012 Diabetes India. Published by Elsevier Ltd. All rights reserved.
Contents lists available at SciVerse ScienceDirect
Diabetes & Metabolic Syndrome: Clinical Research &Reviews
jo ur n al h o mep ag e: www .e lsev ier . c om / loc ate /d s x
1. Introduction
Cardiovascular disease (CVD) is the leading cause of non-communicable disease mortality worldwide. In 2008, CVDaccounted for roughly 30% of global deaths [1]. A constellation ofrisk factors collectively referred to as metabolic syndrome (MetS) isknown to precede the onset of CVD and type 2 diabetes (T2DM) [2].These risk factors include abdominal obesity, hypertension, reducedhigh density lipoprotein cholesterol, elevated triglycerides, and highfasting glucose concentrations [2,3].
A growing body of epidemiologic evidence shows thatincidence of MetS, CVD and T2DM are increasing in Sub-Saharan
* Corresponding author at: Department of Epidemiology, Harvard School of
Public Health, 677 Huntington Ave, Fifth Floor, Boston, MA 02115, USA.
Tel.: +1 617 432 6477; fax: +1 617 566 7805.
E-mail address: [email protected] (B. Gelaye).
1871-4021/$ – see front matter � 2012 Diabetes India. Published by Elsevier Ltd. All r
http://dx.doi.org/10.1016/j.dsx.2012.05.009
Africa where behavioral and lifestyle changes, commonly associ-ated with increasing urbanization, are having detrimental effectson health. Such changes include increased tobacco and alcohol use,poor diet (e.g., increased calorie dense foods and low dietary fiberintake), and physical inactivity [4–8]. A recent study conductedamong adults in Addis Ababa, Ethiopia revealed unexpectedly highprevalence estimates of hypertension: 31.5% among men and28.9% among women [6]. Furthermore, Tran et al. reported theprevalence of MetS to be 14.0% in men and 24.0% in women in theirstudy of adults in Addis Ababa, Ethiopia [7].
A complete blood count is an inexpensive, frequently obtainedtest of hematological status recorded during routine healthexaminations [9]. Increasingly investigators have noted thathematological parameters commonly available from routineclinical examinations may provide important information indica-tive of increased risk for MetS. Consequently, some investigatorshave argued that hematological parameters may be used in earlydetection and evaluation of cardiovascular disease prevention and
ights reserved.

K. Nebeck et al. / Diabetes & Metabolic Syndrome: Clinical Research & Reviews 6 (2012) 22–27 23
control programs. Of note, investigators have reported thatelevated hemoglobin, hematocrit, white blood cell (WBC), redblood cell (RBC), and blood platelet counts are correlated withMetS and its components [10–23]. For example, in ThailandLohsoonthorn et al. reported that men in the highest quartiles ofWBC counts (>8.03 � 103 cells/ml) had a 2.26-fold (95% CI: 1.27–4.02) increased odds of MetS as compared with those whose WBCcounts were in the lowest quartile (<5.72 � 103 cells/ml) [16]. Theodds of MetS were particularly elevated for women with high WBCcounts (OR for highest vs. lowest quartile = 5.41; 95% CI: 2.08–14.07) [16].
Currently, no published research has investigated relationshipsbetween hematological parameters and MetS in Sub-SaharanAfrican populations. We, therefore, sought to evaluate therelationship between hematological parameters and MetS amongworking adults in Ethiopia. Elucidation of the relationship betweenhematological parameters and MetS may provide evidence insupport of using low cost, readily available, routinely collectedclinical hematological parameters for the early detection ofindividuals at risk for MetS and CVD.
2. Methods
This study was conducted in Addis Ababa, the capital city ofEthiopia, during the months of December 2009 and January 2010.Study participants were current permanent employees of theCommercial Bank of Ethiopia and teachers in government andpublic schools of Addis Ababa. Details of the study setting,sampling strategy and data collection procedures have beendescribed in detail elsewhere [7,8]. For the present study, a total of1858 (1131 men and 737 women) participants were included.
We employed the World Health Organization’s (WHO) STEP-wise (STEPS) approach for non-communicable diseases surveil-lance approach to collect data [24]. This approach consists threelevels of risk factor assessment including collecting socio-demographic and behavioral information using questionnaires(step 1), physical measurements (step 2), and taking bloodsamples for biomedical assessment (step 3). Study subjects werecurrent permanent employees of the Commercial Bank ofEthiopia and teachers in public and government schools ofAddis Ababa. Blood specimens were collected from eachparticipant by research nurses and processed at the InternalClinical Laboratories. The collected blood samples were pro-cessed according to standard operating procedures to determineparticipants’ complete blood counts including white blood cells,red blood cells, platelets, hemoglobin, and hematocrit. Allsubjects gave informed consent and research protocols wereapproved by the Addis Continental Institute of Public Health inAddis Ababa, Ethiopia and the Human Subjects Division at theUniversity of Washington, USA.
3. Analytical variable specification
In this study, characterization of MetS was in accordance withthe International Diabetes Federation (IDF) definition [3]. MetSwas defined as a presence of central obesity (defined as waistcircumference of �94 cm for men and �80 cm for women) and atleast two of the following factors: (1) raised triglycerides(�150 mg/dL) or specific treatment for this lipid abnormality,(2) reduced HDL cholesterol (�40 mg/dL for men and �50 mg/dLfor women) or specific treatment for this lipid abnormality, (3)raised systolic (�130 mmHg) or diastolic (�85 mmHg) bloodpressure or treatment of previously diagnosed hypertension, and(4) raised fasting plasma glucose levels (�100 mg/dL) or previouslydiagnosed with type 2 diabetes.
3.1. Statistical analysis
Frequency distributions of socio-demographic characteristics ofthe study population were determined by performing cross-tabulations of covariates across gender and were expressed inpercentage (%). Continuous variables were expressed as mean� standard error of mean values. For skewed variables median[interquartile range] were provided. Chi-Square tests were used toevaluate the differences in the distribution of categorical variables forstudy groups. Student’s T-tests were used to evaluate differences inmean values for study groups. Pearson’s partial correlation coeffi-cients were calculated between hematologic parameters (i.e.,hematocrit, hemoglobin, platelet counts, RBC, WBC) and componentsof MetS (fasting blood glucose, triglyceride concentrations, HDL-Cconcentrations, systolic BP and diastolic BP). Participants weredivided into three groups according to the number of componentsof the MetS: no MetS, abdominal obesity, abdominal obesity and 1component of MetS, and abdominal obesity and �2 components ofMetS. Means of each hematological parameter were then calculatedfor each subgroup. Significance for monotonic trends was assessed bylinear regression analysis.
Logistic regression procedures were used to examine the relativeodds of having MetS. Univariate and multivariate logistic regressionprocedures were used to calculate unadjusted odds ratios (ORs) and95% confidence intervals (95% CIs) of MetS in relation to varyingcategories of each hematological parameter. Hematological param-eters were categorized into quartiles and the lowest quartile wasspecified as the reference group. Potential confounding variableswere considered a priori on the basis of their hypothesizedrelationship with MetS and each hematologic parameter. Con-founding was also assessed by entering potential covariates into alogistic regression model one at a time, and by comparing theadjusted and unadjusted OR. Final logistic regression modelsincluded covariates that altered unadjusted ORs by at least 10%[25]. In multivariate analysis, tests for linear trend across increasingcategories of hematological parameters were conducted by treatingthe four-level hematological quartiles as an ordinal variable.Separate analyses were performed for men and women. Statisticalanalyses were performed using SPSS (version 19.0, IBM, Chicago, IL,USA) software. Confidence intervals were calculated at 95% level andall reported P-values are two tailed.
4. Results
Socio-demographic, lifestyle and clinical characteristics ofstudy participants are summarized in Table 1. More than two-third of participants reported a ‘‘moderate’’ level of alcoholconsumption (70.7% of men and 68.5% of women) whilst only11.8% of men and 0.1% of women reported heavy alcohol use.Current khat use (an evergreen plant with amphetamine-likeeffects commonly used as a mild stimulant for social recreationand improve work performance in Ethiopia) [26,27] was 13.7%among men and 0.5% among women. In addition, 7.2% of men and0.1% of women reported being current cigarette smokers.
As shown in Table 2, there were substantial differences in meanvalues for cardiometabolic and hematological parameters betweenmen and women in this cohort. Mean RBC counts were higher inmen (mean � standard deviation: 5.5 � 0.7 vs. 4.8 � 0.6, P-values < 0.001) than women (mean=, SD: 0.6). Similarly meanpercentages of hematocrit and waist circumference were higheramong men compared to women. However, mean platelet countswere higher in women (mean � standard deviation: 229.3 � 62.7)compared with men (85.7 � 11.3) WBC count and fasting glucoselevels remained similar between men and women.
We next sought to evaluate the extent to which, if at all,hematological parameters were associated with successively
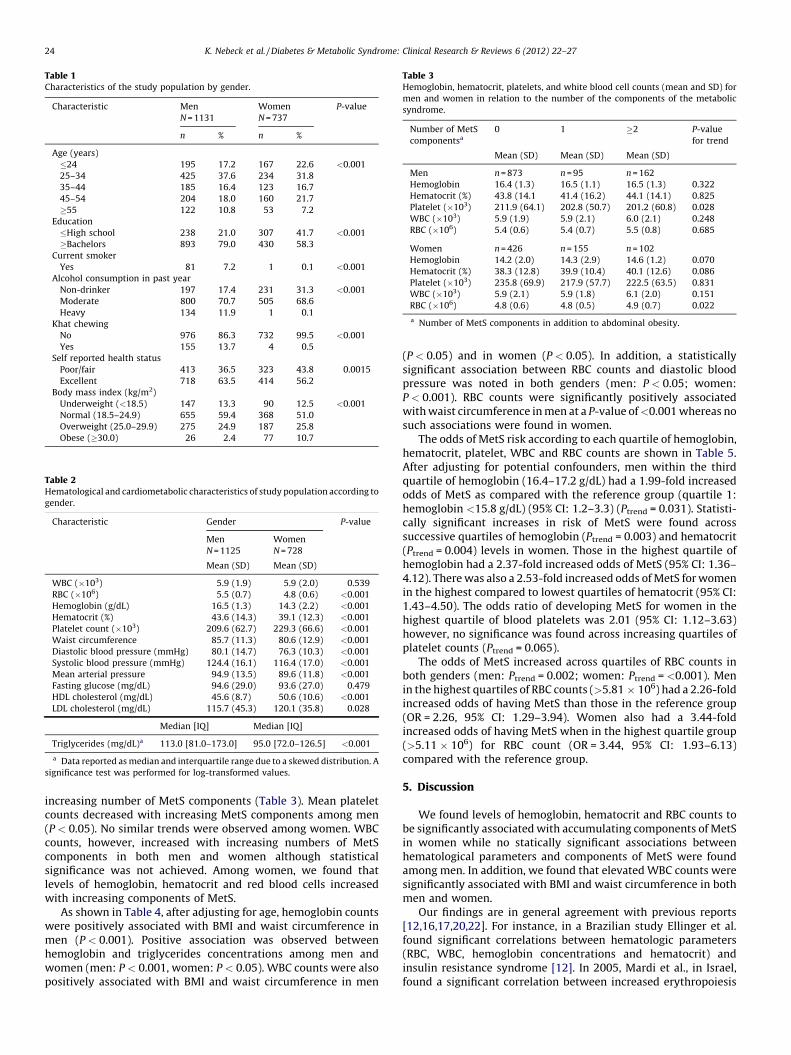
Table 2Hematological and cardiometabolic characteristics of study population according to
gender.
Characteristic Gender P-value
Men
N = 1125
Women
N = 728
Mean (SD) Mean (SD)
WBC (�103) 5.9 (1.9) 5.9 (2.0) 0.539
RBC (�106) 5.5 (0.7) 4.8 (0.6) <0.001
Hemoglobin (g/dL) 16.5 (1.3) 14.3 (2.2) <0.001
Hematocrit (%) 43.6 (14.3) 39.1 (12.3) <0.001
Platelet count (�103) 209.6 (62.7) 229.3 (66.6) <0.001
Waist circumference 85.7 (11.3) 80.6 (12.9) <0.001
Diastolic blood pressure (mmHg) 80.1 (14.7) 76.3 (10.3) <0.001
Systolic blood pressure (mmHg) 124.4 (16.1) 116.4 (17.0) <0.001
Mean arterial pressure 94.9 (13.5) 89.6 (11.8) <0.001
Fasting glucose (mg/dL) 94.6 (29.0) 93.6 (27.0) 0.479
HDL cholesterol (mg/dL) 45.6 (8.7) 50.6 (10.6) <0.001
LDL cholesterol (mg/dL) 115.7 (45.3) 120.1 (35.8) 0.028
Median [IQ] Median [IQ]
Triglycerides (mg/dL)a 113.0 [81.0–173.0] 95.0 [72.0–126.5] <0.001
a Data reported as median and interquartile range due to a skewed distribution. A
significance test was performed for log-transformed values.
Table 3Hemoglobin, hematocrit, platelets, and white blood cell counts (mean and SD) for
men and women in relation to the number of the components of the metabolic
syndrome.
Number of MetS
componentsa
0 1 �2 P-value
for trend
Mean (SD) Mean (SD) Mean (SD)
Men n = 873 n = 95 n = 162
Hemoglobin 16.4 (1.3) 16.5 (1.1) 16.5 (1.3) 0.322
Hematocrit (%) 43.8 (14.1 41.4 (16.2) 44.1 (14.1) 0.825
Platelet (�103) 211.9 (64.1) 202.8 (50.7) 201.2 (60.8) 0.028
WBC (�103) 5.9 (1.9) 5.9 (2.1) 6.0 (2.1) 0.248
RBC (�106) 5.4 (0.6) 5.4 (0.7) 5.5 (0.8) 0.685
Women n = 426 n = 155 n = 102
Hemoglobin 14.2 (2.0) 14.3 (2.9) 14.6 (1.2) 0.070
Hematocrit (%) 38.3 (12.8) 39.9 (10.4) 40.1 (12.6) 0.086
Platelet (�103) 235.8 (69.9) 217.9 (57.7) 222.5 (63.5) 0.831
WBC (�103) 5.9 (2.1) 5.9 (1.8) 6.1 (2.0) 0.151
RBC (�106) 4.8 (0.6) 4.8 (0.5) 4.9 (0.7) 0.022
a Number of MetS components in addition to abdominal obesity.
Table 1Characteristics of the study population by gender.
Characteristic Men
N = 1131
Women
N = 737
P-value
n % n %
Age (years)
�24 195 17.2 167 22.6 <0.001
25–34 425 37.6 234 31.8
35–44 185 16.4 123 16.7
45–54 204 18.0 160 21.7
�55 122 10.8 53 7.2
Education
�High school 238 21.0 307 41.7 <0.001
�Bachelors 893 79.0 430 58.3
Current smoker
Yes 81 7.2 1 0.1 <0.001
Alcohol consumption in past year
Non-drinker 197 17.4 231 31.3 <0.001
Moderate 800 70.7 505 68.6
Heavy 134 11.9 1 0.1
Khat chewing
No 976 86.3 732 99.5 <0.001
Yes 155 13.7 4 0.5
Self reported health status
Poor/fair 413 36.5 323 43.8 0.0015
Excellent 718 63.5 414 56.2
Body mass index (kg/m2)
Underweight (<18.5) 147 13.3 90 12.5 <0.001
Normal (18.5–24.9) 655 59.4 368 51.0
Overweight (25.0–29.9) 275 24.9 187 25.8
Obese (�30.0) 26 2.4 77 10.7
K. Nebeck et al. / Diabetes & Metabolic Syndrome: Clinical Research & Reviews 6 (2012) 22–2724
increasing number of MetS components (Table 3). Mean plateletcounts decreased with increasing MetS components among men(P < 0.05). No similar trends were observed among women. WBCcounts, however, increased with increasing numbers of MetScomponents in both men and women although statisticalsignificance was not achieved. Among women, we found thatlevels of hemoglobin, hematocrit and red blood cells increasedwith increasing components of MetS.
As shown in Table 4, after adjusting for age, hemoglobin countswere positively associated with BMI and waist circumference inmen (P < 0.001). Positive association was observed betweenhemoglobin and triglycerides concentrations among men andwomen (men: P < 0.001, women: P < 0.05). WBC counts were alsopositively associated with BMI and waist circumference in men
(P < 0.05) and in women (P < 0.05). In addition, a statisticallysignificant association between RBC counts and diastolic bloodpressure was noted in both genders (men: P < 0.05; women:P < 0.001). RBC counts were significantly positively associatedwith waist circumference in men at a P-value of <0.001 whereas nosuch associations were found in women.
The odds of MetS risk according to each quartile of hemoglobin,hematocrit, platelet, WBC and RBC counts are shown in Table 5.After adjusting for potential confounders, men within the thirdquartile of hemoglobin (16.4–17.2 g/dL) had a 1.99-fold increasedodds of MetS as compared with the reference group (quartile 1:hemoglobin <15.8 g/dL) (95% CI: 1.2–3.3) (Ptrend = 0.031). Statisti-cally significant increases in risk of MetS were found acrosssuccessive quartiles of hemoglobin (Ptrend = 0.003) and hematocrit(Ptrend = 0.004) levels in women. Those in the highest quartile ofhemoglobin had a 2.37-fold increased odds of MetS (95% CI: 1.36–4.12). There was also a 2.53-fold increased odds of MetS for womenin the highest compared to lowest quartiles of hematocrit (95% CI:1.43–4.50). The odds ratio of developing MetS for women in thehighest quartile of blood platelets was 2.01 (95% CI: 1.12–3.63)however, no significance was found across increasing quartiles ofplatelet counts (Ptrend = 0.065).
The odds of MetS increased across quartiles of RBC counts inboth genders (men: Ptrend = 0.002; women: Ptrend = <0.001). Menin the highest quartiles of RBC counts (>5.81 � 106) had a 2.26-foldincreased odds of having MetS than those in the reference group(OR = 2.26, 95% CI: 1.29–3.94). Women also had a 3.44-foldincreased odds of having MetS when in the highest quartile group(>5.11 � 106) for RBC count (OR = 3.44, 95% CI: 1.93–6.13)compared with the reference group.
5. Discussion
We found levels of hemoglobin, hematocrit and RBC counts tobe significantly associated with accumulating components of MetSin women while no statically significant associations betweenhematological parameters and components of MetS were foundamong men. In addition, we found that elevated WBC counts weresignificantly associated with BMI and waist circumference in bothmen and women.
Our findings are in general agreement with previous reports[12,16,17,20,22]. For instance, in a Brazilian study Ellinger et al.found significant correlations between hematologic parameters(RBC, WBC, hemoglobin concentrations and hematocrit) andinsulin resistance syndrome [12]. In 2005, Mardi et al., in Israel,found a significant correlation between increased erythropoiesis

Table 5Odds ratio (OR) and 95% confidence interval (CI) for hemoglobin, hematocrit, platelets and WBC counts among study participants.
Hematological parameters Men ORa Hematological parameters Women ORa
(95% CI) (95% CI)
Hemoglobin (g/dL)
<15.8 Reference <13.6 Reference
15.8–16.4 1.28 (0.77–2.14) 13.6–14.2 0.89 (0.49–1.59)
16.4–17.2 1.99 (1.21–3.27) 14.2–15 0.78 (0.42–1.44)
>17.2 1.55 (0.90–2.66) >15 2.37 (1.36–4.12)P-value for trend 0.031 0.003
Hematocrit (%)
<45.6 Reference <40.0 Reference
45.6–48.0 1.02 (0.62–1.69) 40.0–42.4 1.25 (0.68–2.28)
48.0–50.4 1.46 (0.86–2.46) 42.4–45.0 1.17 (0.66–2.05)
>50.4 1.48 (0.88–2.46) >45.0 2.53 (1.43–4.50)P-value for trend 0.068 0.004
Platelet count (all) (�103)
<171 Reference <187 Reference
171–206 0.79 (0.48–1.31) 187–224 1.69 (0.97–2.96)
206–243 0.88 (0.54–1.47) 224–263 1.22 (0.68–2.19)
>243 1.08 (0.66–1.76) >263 2.01 (1.12–3.63)P-value for trend 0.767 0.065
WBC (�103)
<4.6 Reference <4.5 Reference
4.6–5.8 0.87 (0.52–1.47) 4.5–5.9 0.96 (0.54–1.71)
5.8–7.1 1.20 (0.73–1.98) 5.9–7.4 1.31 (0.74–2.32)
>7.1 1.05 (0.63–1.74) >7.4 1.64 (0.91–2.94)
P-value for trend 0.579 0.058
RBC (�106)
<5.2 Reference <4.6 Reference
5.21–5.5 1.36 (0.82–2.24) 4.61–4.85 1.57 (0.83–2.97)
5.51–5.8 1.84 (1.10–3.09) 4.86–5.1 2.17 (1.22–3.87)>5.81 2.26 (1.29–3.94) >5.11 3.44 (1.93–6.13)
P-value for trend 0.002 <0.001
a Adjusted for age (continuous), alcohol (never, moderate, heavy) and smoking (none, past, current). Separate models were estimated for men and women.
Table 4Age adjusted Pearson partial correlation coefficients between selected hematological parameters with individual components of the metabolic syndrome for men and
women.
Hematological parameters BMI HDL TG FG SBP DBP WC
Men (N = 1120)
Hemoglobin 0.146b �0.021 0.160b 0.051 0.069a 0.085a 0.142b
Hematocrit 0.031 0.002 �0.020 0.023 0.067a 0.040 0.018
Platelet 0.059a 0.003 0.044 0.026 0.001 0.018 0.039
WBC 0.079a �0.019 0.057 0.036 0.035 0.041 0.065a
RBC 0.074a �0.026 0.073 0.041 0.053 0.061a 0.101b
Women (N = 730)
Hemoglobin 0.023 �0.086a 0.101a 0.074a �0.027 �0.006 0.041
Hematocrit 0.088a �0.007 <0.001 0.082a 0.045 0.060 0.055
Platelet 0.015 0.045 0.062 0.043 0.058 0.036 0.008
WBC 0.135b �0.080a 0.038 0.075a 0.062 0.027 0.089a
RBC 0.067 �0.059 0.073a �0.005 0.084a 0.124b 0.043
a P < 0.05.b P < 0.001.
K. Nebeck et al. / Diabetes & Metabolic Syndrome: Clinical Research & Reviews 6 (2012) 22–27 25
and the number of components of MetS in both men (P = 0.003)and women (P = 0.016). Number of erythrocytes and waistcircumference were also correlated in both men and women(P < 0.005) [17]. While significant associations between plateletand WBC counts and increasing features of MetS was not observedin our study, some investigators have noted such associations [11–13,15,16,18,22,23]. For example, Lohsoonthorn et al. in their studyamong Thai men and women found mean WBC and platelet countswere 14.1% and 9.5% greater for women with 3 or more features ofMetS compared with those lacking any features of MetS.Hemoglobin and hematocrit values were also significantlyassociated with MetS components in women but not in the menof their study (hemoglobin Ptrend = 0.004; hematocritPtrend = 0.001) [16]. Similar findings were reported by Wanget al. [22]. On the contrary, Taniguchi et al., in their study ofstudy of non-obese Japanese T2DM patients, found platelets to be
an independent predictor of insulin resistance (P < 0.0001) [20]. Astudy by Tamariz et al. found adults in the highest hematocritquartiles (>44.3%) were 60% more likely to develop diabetescompared with their counterparts in the lowest quartiles (<39%)[19]. In our study, women in the highest quartiles of hematocrit(>50.4%) had a 2.53-fold increased odds of having MetS comparedwith the reference quartile (<45.6%)
Differences in study design, operational definitions of cardio-vascular disease risk, as well as ethnic and racial differences acrossstudy populations may account for the absence of consistencyacross studies. Despite these variations, the concordance of ourresults with many other studies [10,12,16,17,19,21,22] suggeststhat observed associations of hematologic parameters with MetSmay provide some important opportunities for CVD risk predictionand for understanding the pathophysiology of cardiometabolicrisk. It is important to note, however, that biological pathways
K. Nebeck et al. / Diabetes & Metabolic Syndrome: Clinical Research & Reviews 6 (2012) 22–2726
linking cardiometabolic disorders and hematologic parameters arenot yet fully understood. Investigators have proposed a mechanismin which components of MetS, particularly raised LDL cholesterol,hypertension and insulin resistance trigger endothelial dysfunctionand an inflammatory response [28]. Prolonged inflammationincreases activation of WBC and endothelial cells which in turnleads to platelet and thrombus formation [28]. As mentionedpreviously, increased RBC and glycated hemoglobin concentrationscan result from elevated insulin and glucose levels in the blood[17,29–31]. High levels of RBC’s, glycated hemoglobin and hemato-crit can lead to reduced blood flow (via increased blood viscosity)and subsequent decreased circulation of oxygen, insulin and glucoseto essential tissues. Therefore, slowed blood viscosity due toaccumulation of hematological components can be a catalyst whenit comes to the progression of type 2 diabetes [19,32].
Some caveats should be considered when interpreting theresults of our study. Social desirability bias to survey questions is apotential problem in our study where participants are likely toreport low khat use and current smoking status especially amongthe women in our study population (0.5% and 0.1% respectively).The cross sectional nature of our study design does not allow us todetermine the causal relationship between hematological param-eters and MetS. Longitudinal studies, with serial measurements ofhematologic parameters and the onset of conditions that defineMetS, are needed.
MetS has been associated with an increased risk for CVD andT2DM [2]. A growing body of evidence shows that MetS is currentlyan important and prevalent risk factor in many Sub-SaharanAfrican countries including Ethiopia [4–8]. Elucidating the changesin hematological parameters indicative of MetS could lead to newstandards of early detection and potentially reduce CVD morbidityand mortality. Use of simple, inexpensive and widely availablehematological parameters as biological markers for MetS and CVDmay be useful in low income countries such as Ethiopia where aphysician’s limited resources often prevent proper diagnosis. Arecent study conducted by Gelaye et al. has established referencevalues of hematological parameters in healthy Ethiopian adults[33]. These values could provide a baseline standard by whichother Ethiopians may be compared when assessing for increasedrisk of MetS.
In summary, we found elevated levels of hemoglobin, hemato-crit and RBCl counts to be significantly associated with clusteredcomponents of metabolic syndrome in working adults in Ethiopia.Regardless of the mechanisms, available evidence suggests thathematological parameters are potentially important biologicalmarkers of cardiometabolic risk. Inferences can be enhanced byfuture studies that aim to identify the relationships betweenincident cardiometabolic cases and hematologic parameters.
Acknowledgements
This research was completed while Ms. Kelsey Nebeck was aresearch training fellow with the Multidisciplinary InternationalResearch Training (MIRT) Program of the University andWashington, School of Public Health. The MIRT Program issupported by an award from the National Institutes of Health,National Institute on Minority Health and Health Disparities (T37-MD001449). The authors thank Addis Continental Institute ofPublic Health for providing facilities and logistics supportthroughout the research process. The authors also thank theCommercial Bank of Ethiopia and Addis Ababa Education Office forgranting access to conduct the study and International ClinicalLaboratories for completing all laboratory analyses.
Conflict of interestNone declared.
References
[1] WHO – World Health Organization. Global status report on noncommunicablediseases 2010. Geneva, Switzerland: World Health Organization; 2010.
[2] Grundy SM. Metabolic syndrome: connecting and reconciling cardiovascularand diabetes worlds. Journal of the American College of Cardiology2006;47:1093–100.
[3] Alberti KG, Zimmet P, Shaw J. The metabolic syndrome – a new worldwidedefinition. Lancet 2005;366:1059–62.
[4] Njelekela MA, Mpembeni R, Muhihi A, Mligiliche NL, Spiegelman D, HertzmarkE, et al. Gender-related differences in the prevalence of cardiovascular diseaserisk factors and their correlates in urban Tanzania. BMC Cardiovascular Dis-orders 2009;9:30.
[5] Oladapo OO, Salako L, Sodiq O, Shoyinka K, Adedapo K, Falase AO. A prevalenceof cardiometabolic risk factors among a rural Yoruba south-western Nigerianpopulation: a population-based survey. Cardiovascular Journal of Africa2010;21:26–31.
[6] Tesfaye F, Byass P, Wall S. Population based prevalence of high blood pressureamong adults in Addis Ababa: uncovering a silent epidemic. BMC Cardiovas-cular Disorders 2009;9:39.
[7] Tran A, Gelaye B, Girma B, Lemma S, Berhane Y, Bekele T, et al. Prevalence ofmetabolic syndrome among working adults in Ethiopia. International Journalof Hypertension 2011;2011:193719.
[8] Wai WS, Dhami RS, Gelaye B, Girma B, Lemma S, Berhane Y, et al. Comparisonof measures of adiposity in identifying cardiovascular disease risk amongEthiopian adults. Obesity (Silver Spring) 2011.
[9] NCCLS. 3rd ed., Defining establishing and verifying reference intervals in theclinical laboratory; approved guideline, vol. 28 No. 30, 3rd ed. Wayne, PA:National Committee for Clinical Laboratory Standards; 2009. p. C28-A3.
[10] Barbieri M, Ragno E, Benvenuti E, Zito GA, Corsi A, Ferrucci L, et al. New aspectsof the insulin resistance syndrome: impact on haematological parameters.Diabetologia 2001;44:1232–7.
[11] Chen LK, Lin MH, Chen ZJ, Hwang SJ, Chiou ST. Association of insulin resistanceand hematologic parameters: study of a middle-aged and elderly Chinesepopulation in Taiwan. Journal of the Chinese Medical Association 2006;69:248–53.
[12] Ellinger VC, Carlini LT, Moreira RO, Meirelles RM. Relation between insulinresistance and hematological parameters in a Brazilian sample. ArquivosBrasileiros de Endocrinologia e Metabologia 2006;50:114–7.
[13] Gkrania-Klotsas E, Ye Z, Cooper AJ, Sharp SJ, Luben R, Biggs ML, et al.Differential white blood cell count and type 2 diabetes: systematic reviewand meta-analysis of cross-sectional and prospective studies. PLoS One2010;5:e13405.
[14] Jesri A, Okonofua EC, Egan BM. Platelet and white blood cell counts areelevated in patients with the metabolic syndrome. Journal of clinical hyper-tension (Greenwich) 2005;7:705–11 [quiz 12-3].
[15] Kim DJ, Noh JH, Lee BW, Choi YH, Chung JH, Min YK, et al. The associations oftotal and differential white blood cell counts with obesity, hypertension,dyslipidemia and glucose intolerance in a Korean population. Journal ofKorean Medical Science 2008;23:193–8.
[16] Lohsoonthorn V, Jiamjarasrungsi W, Williams MA. Association of hematologi-cal parameters with clustered components of metabolic syndrome amongprofessional and office workers in Bangkok, Thailand. Diabetes MetabolicSyndrome and Obesity 2007;1:143–9.
[17] Mardi T, Toker S, Melamed S, Shirom A, Zeltser D, Shapira I, et al. Increasederythropoiesis and subclinical inflammation as part of the metabolic syn-drome. Diabetes Research and Clinical Practice 2005;69:249–55.
[18] Nakanishi N, Sato M, Shirai K, Nakajima K, Murakami S, Takatorige T, et al.Associations between white blood cell count and features of the metabolicsyndrome in Japanese male office workers. Industrial Health 2002;40:273–7.
[19] Tamariz LJ, Young JH, Pankow JS, Yeh HC, Schmidt MI, Astor B, et al. Bloodviscosity and hematocrit as risk factors for type 2 diabetes mellitus: theatherosclerosis risk in communities (ARIC) study. American Journal of Epide-miology 2008;168:1153–60.
[20] Taniguchi A, Fukushima M, Seino Y, Sakai M, Yoshii S, Nagasaka S, et al. Plateletcount is independently associated with insulin resistance in non-obese Japa-nese type 2 diabetic patients. Metabolism Clinical and Experimental 2003;52:1246–9.
[21] Veeranna V, Ramesh K, Zalawadiya SK, Niraj A, Pradhan J, Jacob S, et al.Glycosylated hemoglobin and prevalent metabolic syndrome in nondiabeticmultiethnic U.S. adults. Metabolic Syndrome and Related Disorders 2011.
[22] Wang YY, Lin SY, Liu PH, Cheung BM, Lai WA. Association between hemato-logical parameters and metabolic syndrome components in a Chinese popu-lation. Journal of Diabetes and Its Complications 2004;18:322–7.
[23] Wu CZ, Lin JD, Li JC, Kuo SW, Hsieh CH, Lian WC, et al. Association betweenwhite blood cell count and components of metabolic syndrome. PediatricsInternational 2009;51:14–8.
[24] WHO. STEPs manual. Geneva: World Health Organization; 2008.[25] Rothman KJ, Greenland S. Modern epidemiology. Philadelphia: Lippincott-
Raven; 1998.[26] Belew M, Kebede D, Kassaye M, Enquoselassie F. The magnitude of khat use
and its association with health, nutrition and socio-economic status. EthiopianMedical Journal 2000;38:11–26.
[27] Kalix P. Khat: scientific knowledge and policy issues. British Journal ofAddiction 1987;82:47–53.

K. Nebeck et al. / Diabetes & Metabolic Syndrome: Clinical Research & Reviews 6 (2012) 22–27 27
[28] Ross R. Atherosclerosis – an inflammatory disease. New England Journal ofMedicine 1999;340:115–26.
[29] Aoki I, Taniyama M, Toyama K, Homori M, Ishikawa K. Stimulatory effect ofhuman insulin on erythroid progenitors (CFU-E and BFU-E) in human CD34+separated bone marrow cells and the relationship between insulin and eryth-ropoietin. Stem Cells 1994;12:329–38.
[30] Bersch N, Groopman JE, Golde DW. Natural and biosynthetic insulin stimulatesthe growth of human erythroid progenitors in vitro. Journal of ClinicalEndocrinology and Metabolism 1982;55:1209–11.
[31] Kurtz A, Jelkmann W, Bauer C. Insulin stimulates erythroid colony formationindependently of erythropoietin. British Journal of Haematology 1983;53:311–6.
[32] Lowe GD, Lee AJ, Rumley A, Price JF, Fowkes FG. Blood viscosity and risk ofcardiovascular events: the Edinburgh Artery Study. British Journal of Haema-tology 1997;96:168–73.
[33] Gelaye B, Bekele T, Khali A, Haddis Y, Lemma S, Berhane Y, et al. Laboratoryreference values of complete blood count for apparently healthy adults inEthiopia. Clinica y Laboratorio 2011;57:635–40.