helms research farm - texas a&m universitylubbock.tamu.edu/files/2011/11/2009finalhelms.pdf ·...
TRANSCRIPT
Improving Life Through Science and Technology Lubbock-Pecos-Halfway
Helms Research Farm Summary Report
2009
Texas AgriLife Research / Mark A. Hussey, Director The Texas A&M University System / College Station, Texas
Table of Contents Research Participants ....................................................................................................................3
Introduction ....................................................................................................................................4 Corn Breeding, 2009 ......................................................................................................................5 Wenwei Xu Irrigation Termination for Improved Fiber Maturity on the Texas High Plains, 2009 ..........6 Craig Bednarz, James P. Bordovsky, and Jason Sneed Evaluation of Soil Water Sensors for Irrigation Management, 2009 ........................................7 James P. Bordovsky, Joe Mustian, and Cora Lea Emerson Cotton Response to Irrigation Interval and Field Topography using Subsurface Drip Irrigation, 2009 ...............................................................................................................................8 Cora Lea Emerson, James P. Bordovsky, Joe Mustian and Doug Nesmith Bayer Cotton Agronomic Performance Trial at Helms Farm, Halfway, TX, 2009 .................9 Wayne Keeling, Jacob Reed, Michael Petty, and Daniel Olivier Incidence of Crown Gall under Various Cultural Practices, 2009 .........................................10 Jason Woodward, Lindsey Kahler, Terry Wheeler, and James Bordovsky Effect of Crop Rotation and Irrigation Treatments on Verticillium dahliae Density and Incidence of Wilt, 2009 ................................................................................................................11 Terry Wheeler, Victor Mendoza, Evan Arnold, Garret Clark, and Lindsi Clark Cotton Response to Irrigation Level and Crop Rotation, 2009 ...............................................12 James P. Bordovsky, Joe Mustian, Cora Lea Emerson, Doug Nesmith, and Casey Hardin Sorghum Hybrid Performance with Low-Energy Precision Application (LEPA) Irrigation at Helms Farm, Halfway, TX, 2009 ............................................................................................13 Wayne Keeling, James P. Bordovsky, Jacob Reed, and Michael Petty Sorghum Grain Response to Different Irrigation Levels, 2009 ...............................................14 James P. Bordovsky, Wayne Keeling, Jacob Reed, Michael Petty, Joe Mustian, and Cora Lea Emerson Weed Management and Economics in Strip-till, No-till, and Conventional-till Systems in Cotton, 2009 .............................................................................................................................15 Peter Dotray, AJ Bloodworth, Wayne Keeling, Jeff Johnson, Brent Bean, and Lyndell Gilbert
1
Cotton Variety Performance as Affected by Low-Energy Precision Application (LEPA) Irrigation Levels at Helms Farm, Halfway, TX, 2009 ..............................................................16 Wayne Keeling, James P. Bordovsky, Jacob Reed, and Michael Petty Effects of B2RF Variety, SDI Irrigation Levels, and Harvest Method on Cotton Lint Yields, Lint Values, and Gross Revenues at Helms Farm, Halfway, TX, 2009 ..................................17 Wayne Keeling, Randy Boman, James P. Bordovsky, John Wanjura, Jacob Reed, and Michael Petty Influence of Soil Nitrogen Level on Seasonal Activity of Cotton Arthropods and Lint Yield under Drip Irrigation, 2009 ........................................................................................................18 M. N. Parajulee, S. C. Carroll, R. B.Shrestha, R. J. Kesey, D. M. Nesmith, and J. P. Bordovsky Farm Scale Yield Comparisons of Subsurface Drip Irrigation to Center Pivot Irrigation, 2009................................................................................................................................................19 James P. Bordovsky and Doug Nesmith Appendix .......................................................................................................................................20 Halfway and Helms Rainfall and Irrigation Amounts ...................................................................21 Official Log of Operations .............................................................................................................27
2
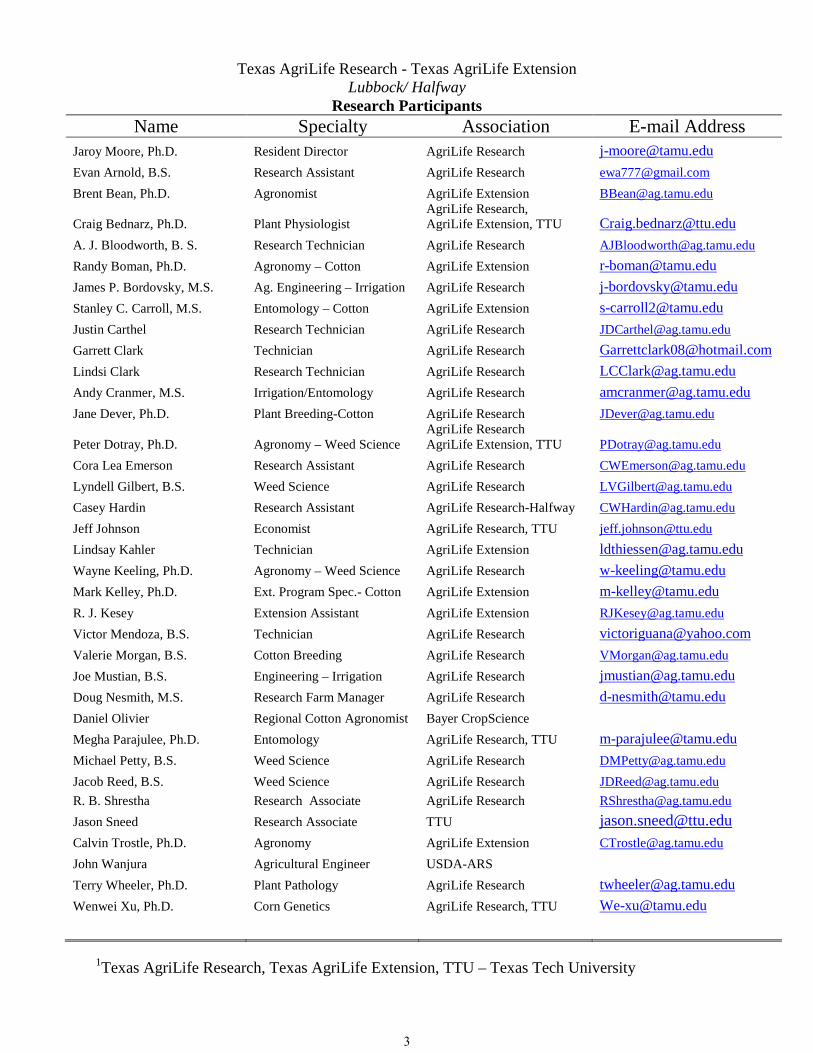
Texas AgriLife Research - Texas AgriLife Extension Lubbock/ Halfway
Research Participants Name Specialty Association E-mail Address
Jaroy Moore, Ph.D. Resident Director AgriLife Research [email protected] Evan Arnold, B.S. Research Assistant AgriLife Research [email protected] Brent Bean, Ph.D. Agronomist AgriLife Extension [email protected]
Craig Bednarz, Ph.D. Plant Physiologist AgriLife Research, AgriLife Extension, TTU [email protected]
A. J. Bloodworth, B. S. Research Technician AgriLife Research [email protected] Randy Boman, Ph.D. Agronomy – Cotton AgriLife Extension [email protected] James P. Bordovsky, M.S. Ag. Engineering – Irrigation AgriLife Research [email protected] Stanley C. Carroll, M.S. Entomology – Cotton AgriLife Extension [email protected] Justin Carthel Research Technician AgriLife Research [email protected] Garrett Clark Technician AgriLife Research [email protected] Lindsi Clark Research Technician AgriLife Research [email protected] Andy Cranmer, M.S. Irrigation/Entomology AgriLife Research [email protected] Jane Dever, Ph.D. Plant Breeding-Cotton AgriLife Research [email protected]
Peter Dotray, Ph.D. Agronomy – Weed Science AgriLife Research AgriLife Extension, TTU [email protected]
Cora Lea Emerson Research Assistant AgriLife Research [email protected] Lyndell Gilbert, B.S. Weed Science AgriLife Research [email protected] Casey Hardin Research Assistant AgriLife Research-Halfway [email protected] Jeff Johnson Economist AgriLife Research, TTU [email protected] Lindsay Kahler Technician AgriLife Extension [email protected] Wayne Keeling, Ph.D. Agronomy – Weed Science AgriLife Research [email protected] Mark Kelley, Ph.D. Ext. Program Spec.- Cotton AgriLife Extension [email protected] R. J. Kesey Extension Assistant AgriLife Extension [email protected] Victor Mendoza, B.S. Technician AgriLife Research [email protected] Valerie Morgan, B.S. Cotton Breeding AgriLife Research [email protected] Joe Mustian, B.S. Engineering – Irrigation AgriLife Research [email protected] Doug Nesmith, M.S. Research Farm Manager AgriLife Research [email protected] Daniel Olivier Regional Cotton Agronomist Bayer CropScience Megha Parajulee, Ph.D. Entomology AgriLife Research, TTU [email protected] Michael Petty, B.S. Weed Science AgriLife Research [email protected] Jacob Reed, B.S. Weed Science AgriLife Research [email protected] R. B. Shrestha Research Associate AgriLife Research [email protected] Jason Sneed Research Associate TTU [email protected] Calvin Trostle, Ph.D. Agronomy AgriLife Extension [email protected] John Wanjura Agricultural Engineer USDA-ARS Terry Wheeler, Ph.D. Plant Pathology AgriLife Research [email protected] Wenwei Xu, Ph.D. Corn Genetics AgriLife Research, TTU [email protected]
1Texas AgriLife Research, Texas AgriLife Extension, TTU – Texas Tech University
3
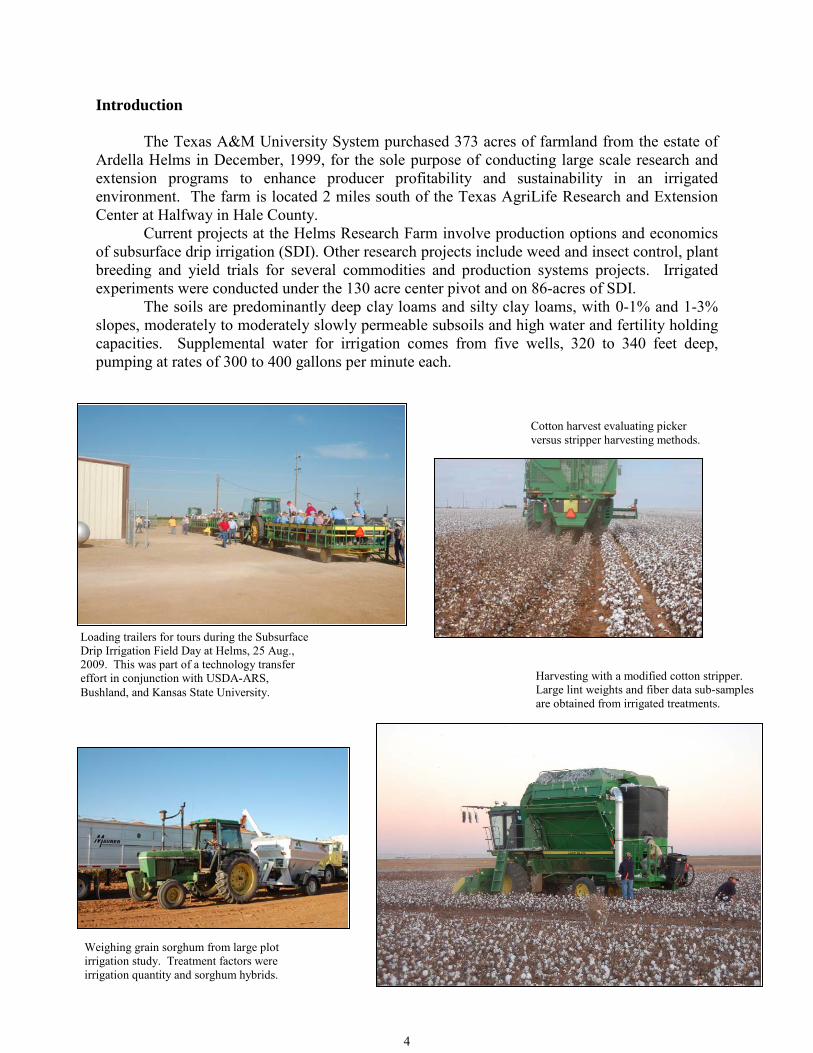
Introduction The Texas A&M University System purchased 373 acres of farmland from the estate of Ardella Helms in December, 1999, for the sole purpose of conducting large scale research and extension programs to enhance producer profitability and sustainability in an irrigated environment. The farm is located 2 miles south of the Texas AgriLife Research and Extension Center at Halfway in Hale County. Current projects at the Helms Research Farm involve production options and economics of subsurface drip irrigation (SDI). Other research projects include weed and insect control, plant breeding and yield trials for several commodities and production systems projects. Irrigated experiments were conducted under the 130 acre center pivot and on 86-acres of SDI. The soils are predominantly deep clay loams and silty clay loams, with 0-1% and 1-3% slopes, moderately to moderately slowly permeable subsoils and high water and fertility holding capacities. Supplemental water for irrigation comes from five wells, 320 to 340 feet deep, pumping at rates of 300 to 400 gallons per minute each.
Cotton harvest evaluating picker versus stripper harvesting methods.
Loading trailers for tours during the Subsurface Drip Irrigation Field Day at Helms, 25 Aug., 2009. This was part of a technology transfer effort in conjunction with USDA-ARS, Bushland, and Kansas State University.
Weighing grain sorghum from large plot irrigation study. Treatment factors were irrigation quantity and sorghum hybrids.
Harvesting with a modified cotton stripper. Large lint weights and fiber data sub-samples are obtained from irrigated treatments.
4
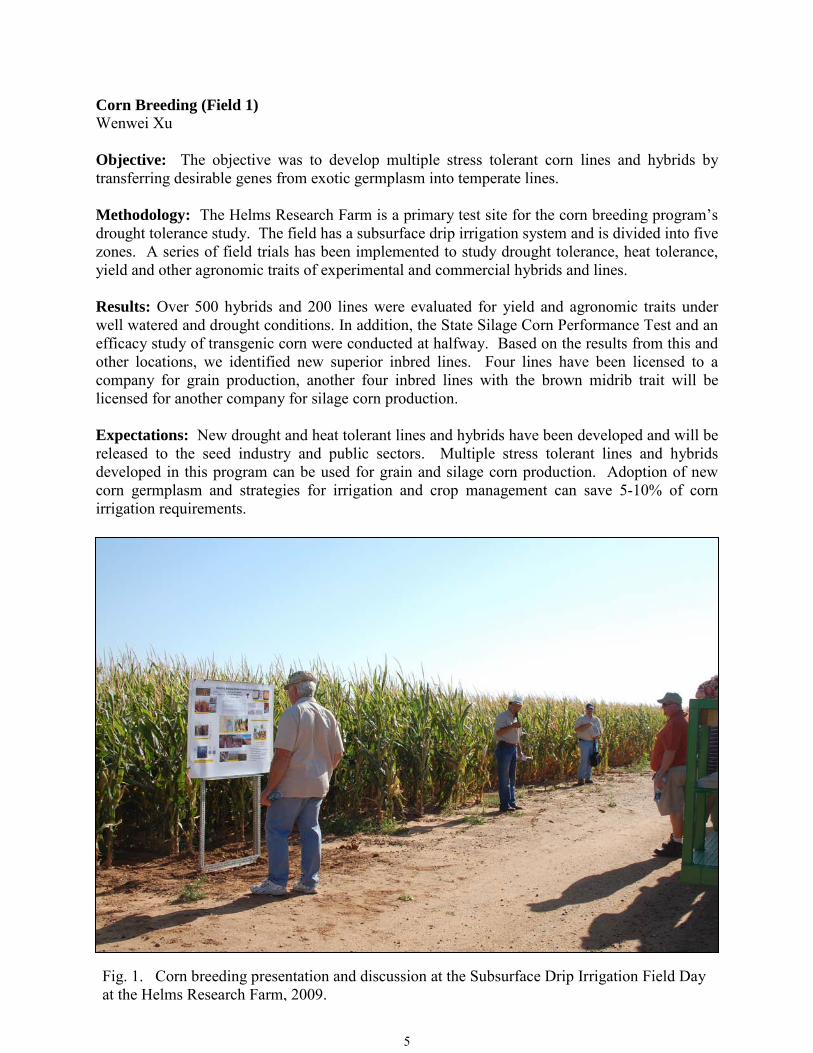
Corn Breeding (Field 1) Wenwei Xu Objective: The objective was to develop multiple stress tolerant corn lines and hybrids by transferring desirable genes from exotic germplasm into temperate lines. Methodology: The Helms Research Farm is a primary test site for the corn breeding program’s drought tolerance study. The field has a subsurface drip irrigation system and is divided into five zones. A series of field trials has been implemented to study drought tolerance, heat tolerance, yield and other agronomic traits of experimental and commercial hybrids and lines. Results: Over 500 hybrids and 200 lines were evaluated for yield and agronomic traits under well watered and drought conditions. In addition, the State Silage Corn Performance Test and an efficacy study of transgenic corn were conducted at halfway. Based on the results from this and other locations, we identified new superior inbred lines. Four lines have been licensed to a company for grain production, another four inbred lines with the brown midrib trait will be licensed for another company for silage corn production. Expectations: New drought and heat tolerant lines and hybrids have been developed and will be released to the seed industry and public sectors. Multiple stress tolerant lines and hybrids developed in this program can be used for grain and silage corn production. Adoption of new corn germplasm and strategies for irrigation and crop management can save 5-10% of corn irrigation requirements.
Fig. 1. Corn breeding presentation and discussion at the Subsurface Drip Irrigation Field Day at the Helms Research Farm, 2009.
5
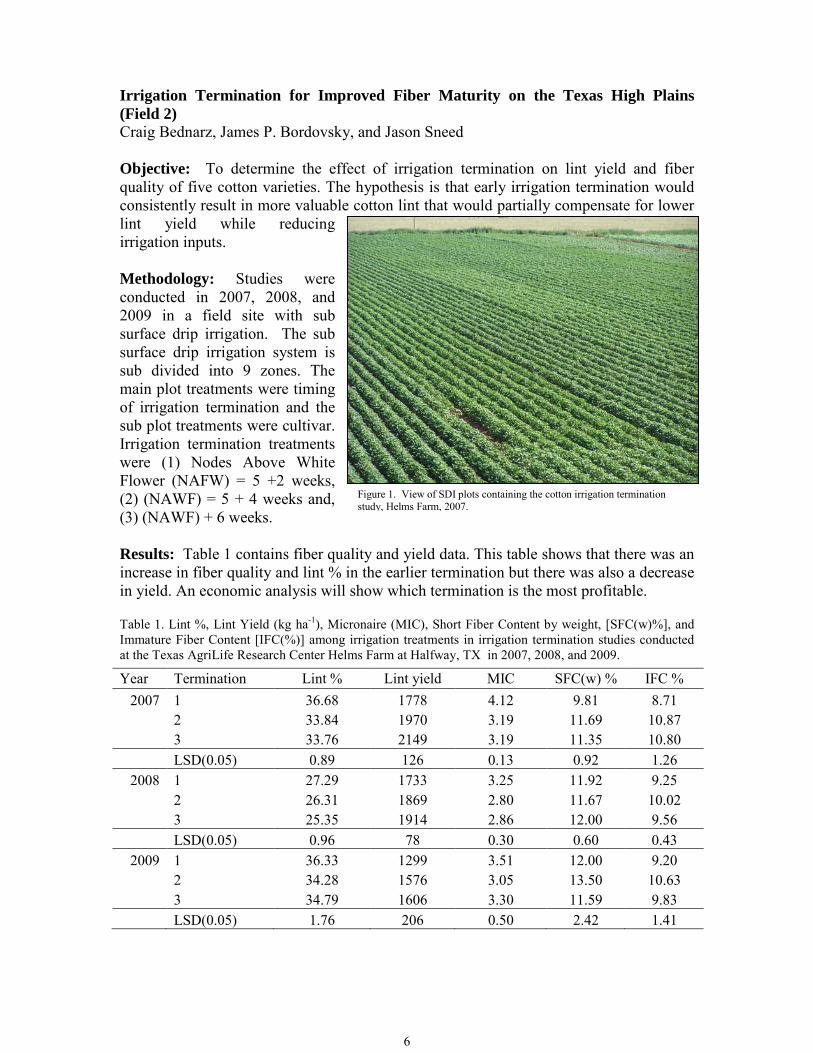
Irrigation Termination for Improved Fiber Maturity on the Texas High Plains (Field 2) Craig Bednarz, James P. Bordovsky, and Jason Sneed Objective: To determine the effect of irrigation termination on lint yield and fiber quality of five cotton varieties. The hypothesis is that early irrigation termination would consistently result in more valuable cotton lint that would partially compensate for lower lint yield while reducing irrigation inputs. Methodology: Studies were conducted in 2007, 2008, and 2009 in a field site with sub surface drip irrigation. The sub surface drip irrigation system is sub divided into 9 zones. The main plot treatments were timing of irrigation termination and the sub plot treatments were cultivar. Irrigation termination treatments were (1) Nodes Above White Flower (NAFW) = 5 +2 weeks, (2) (NAWF) = 5 + 4 weeks and, (3) (NAWF) + 6 weeks. Results: Table 1 contains fiber quality and yield data. This table shows that there was an increase in fiber quality and lint % in the earlier termination but there was also a decrease in yield. An economic analysis will show which termination is the most profitable. Table 1. Lint %, Lint Yield (kg ha-1), Micronaire (MIC), Short Fiber Content by weight, [SFC(w)%], and Immature Fiber Content [IFC(%)] among irrigation treatments in irrigation termination studies conducted at the Texas AgriLife Research Center Helms Farm at Halfway, TX in 2007, 2008, and 2009.
Year Termination Lint % Lint yield MIC SFC(w) % IFC % 2007 1 36.68 1778 4.12 9.81 8.71
2 33.84 1970 3.19 11.69 10.87
3 33.76 2149 3.19 11.35 10.80
LSD(0.05) 0.89 126 0.13 0.92 1.26
2008 1 27.29 1733 3.25 11.92 9.25
2 26.31 1869 2.80 11.67 10.02
3 25.35 1914 2.86 12.00 9.56
LSD(0.05) 0.96 78 0.30 0.60 0.43
2009 1 36.33 1299 3.51 12.00 9.20
2 34.28 1576 3.05 13.50 10.63
3 34.79 1606 3.30 11.59 9.83
LSD(0.05) 1.76 206 0.50 2.42 1.41
Figure 1. View of SDI plots containing the cotton irrigation termination study, Helms Farm, 2007.
6
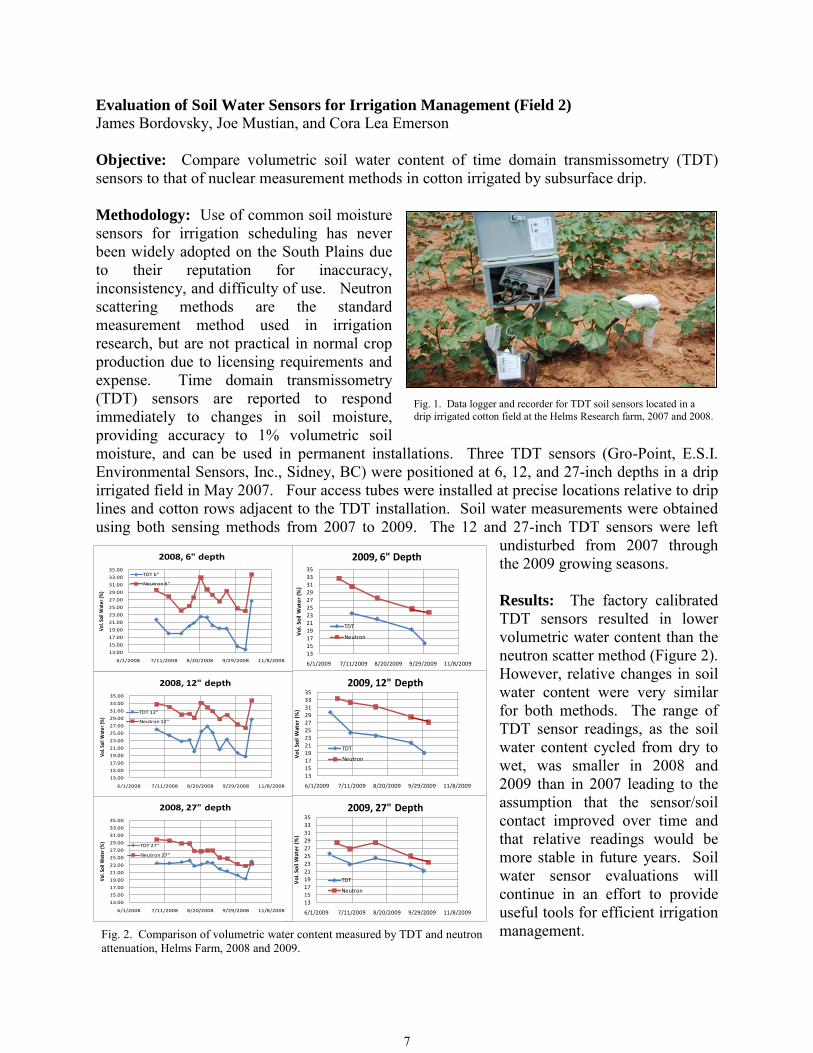
Evaluation of Soil Water Sensors for Irrigation Management (Field 2) James Bordovsky, Joe Mustian, and Cora Lea Emerson Objective: Compare volumetric soil water content of time domain transmissometry (TDT) sensors to that of nuclear measurement methods in cotton irrigated by subsurface drip. Methodology: Use of common soil moisture sensors for irrigation scheduling has never been widely adopted on the South Plains due to their reputation for inaccuracy, inconsistency, and difficulty of use. Neutron scattering methods are the standard measurement method used in irrigation research, but are not practical in normal crop production due to licensing requirements and expense. Time domain transmissometry (TDT) sensors are reported to respond immediately to changes in soil moisture, providing accuracy to 1% volumetric soil moisture, and can be used in permanent installations. Three TDT sensors (Gro-Point, E.S.I. Environmental Sensors, Inc., Sidney, BC) were positioned at 6, 12, and 27-inch depths in a drip irrigated field in May 2007. Four access tubes were installed at precise locations relative to drip lines and cotton rows adjacent to the TDT installation. Soil water measurements were obtained using both sensing methods from 2007 to 2009. The 12 and 27-inch TDT sensors were left
undisturbed from 2007 through the 2009 growing seasons. Results: The factory calibrated TDT sensors resulted in lower volumetric water content than the neutron scatter method (Figure 2). However, relative changes in soil water content were very similar for both methods. The range of TDT sensor readings, as the soil water content cycled from dry to wet, was smaller in 2008 and 2009 than in 2007 leading to the assumption that the sensor/soil contact improved over time and that relative readings would be more stable in future years. Soil water sensor evaluations will continue in an effort to provide useful tools for efficient irrigation management.
Fig. 1. Data logger and recorder for TDT soil sensors located in a drip irrigated cotton field at the Helms Research farm, 2007 and 2008.
Fig. 2. Comparison of volumetric water content measured by TDT and neutron attenuation, Helms Farm, 2008 and 2009.
131517192123252729313335
6/1/2009 7/11/2009 8/20/2009 9/29/2009 11/8/2009
Vol
. Soi
l Wat
er (%
)
2009, 6" Depth
TDT
Neutron
131517192123252729313335
6/1/2009 7/11/2009 8/20/2009 9/29/2009 11/8/2009
Vol
. Soi
l Wat
er (%
)
2009, 12" Depth
TDT
Neutron
131517192123252729313335
6/1/2009 7/11/2009 8/20/2009 9/29/2009 11/8/2009
Vol
. Soi
l Wat
er (%
)
2009, 27" Depth
TDT
Neutron
13.00
15.00
17.00
19.00
21.00
23.00
25.00
27.00
29.00
31.00
33.00
35.00
6/1/2008 7/11/2008 8/20/2008 9/29/2008 11/8/2008
Vol.
Soil
Wat
er (%
)
2008, 6" depth
TDT 6"
Neutron 6"
13.00
15.00
17.00
19.00
21.00
23.00
25.00
27.00
29.00
31.00
33.00
35.00
6/1/2008 7/11/2008 8/20/2008 9/29/2008 11/8/2008
Vol.
Soil
Wat
er (%
)
2008, 12" depth
TDT 12"
Neutron 12"
13.00
15.00
17.00
19.00
21.00
23.00
25.00
27.00
29.00
31.00
33.00
35.00
6/1/2008 7/11/2008 8/20/2008 9/29/2008 11/8/2008
Vol.
Soil
Wat
er (%
)
2008, 27" depth
TDT 27"
Neutron 27"
7
Cotton Response to Irrigation Interval and Field Topography using Subsurface Drip Irrigation (Field 3) Cora Lea Emerson, James P. Bordovsky, Joe Mustian and Doug Nesmith Objective: To determine cotton lint yield and water use efficiency resulting from three irrigation intervals and two irrigation levels using subsurface drip irrigation (SDI). Methodology: Two irrigation levels and three irrigation intervals were used to determine the effects of each level/interval combination on cotton production. The high irrigation level met approximately 100% of crop water needs using ET scheduling, while the low level was 50% of the High irrigation level. Irrigation applications were made at .5-day, 2-day and 7-day intervals. Each of four blocks contained six 8-row treatments. FiberMax 9063 B2RF was planted on 6 May at 54,129 ppa with 30” row spacing on 1300’ rows. Crop responses were evaluated by harvesting 4 rows by ~60 feet at three field positions (South, Mid, & North) along the length of each 8-row plot with a John Deere 7445 stripper, determining burr weight with on-board scales, and establishing lint yield from the turnout of 1-lb sub-samples of each replicate. Seasonal water use efficiency (SIWUE) was calculated by subtracting dryland yield (pre-plant irrigation + 0” in-season irrigation) from plot yield then dividing the product by the treatment in-season irrigation, beginning 10 July and terminating 2 September (YP - YDL/Iin-season). Results: Table 1 contains average lint yield (lbs/ac) and seasonal irrigation water use efficiency (SIWUE) by treatment and field position. The rows sloped from higher elevations (South) to lower elevations (North), and resulted in more SDI lateral drainage to the low field elevations in treatments with more frequent irrigations (0.5d versus 7d). Lowest average lint yields (1126 lbs/ac) were observed in the low irrigation level/7-day interval treatments (field position → Mid), and the highest yields (1554 lbs/ac) were observed in the high irrigation level/2-day interval treatments (field position → South). Average SIWUE was greater in low irrigation level treatments than respective high irrigation treatments, with the highest SIWUE obtained at the 2-day interval (field position → North) . The lowest SIWUE was observed in the 2-day
interval/high level treatment (field position → Mid). Although not significant, within low irrigation treatments, longer irrigation intervals consistently resulted in decreased lint yield and SIWUE regardless of field position; however, the opposite trend was observed in the high irrigation treatments, where lint yield and SIWUE increased with longer irrigation intervals. 2009 was the first year of this study and will be continued to determine if these trends persist.
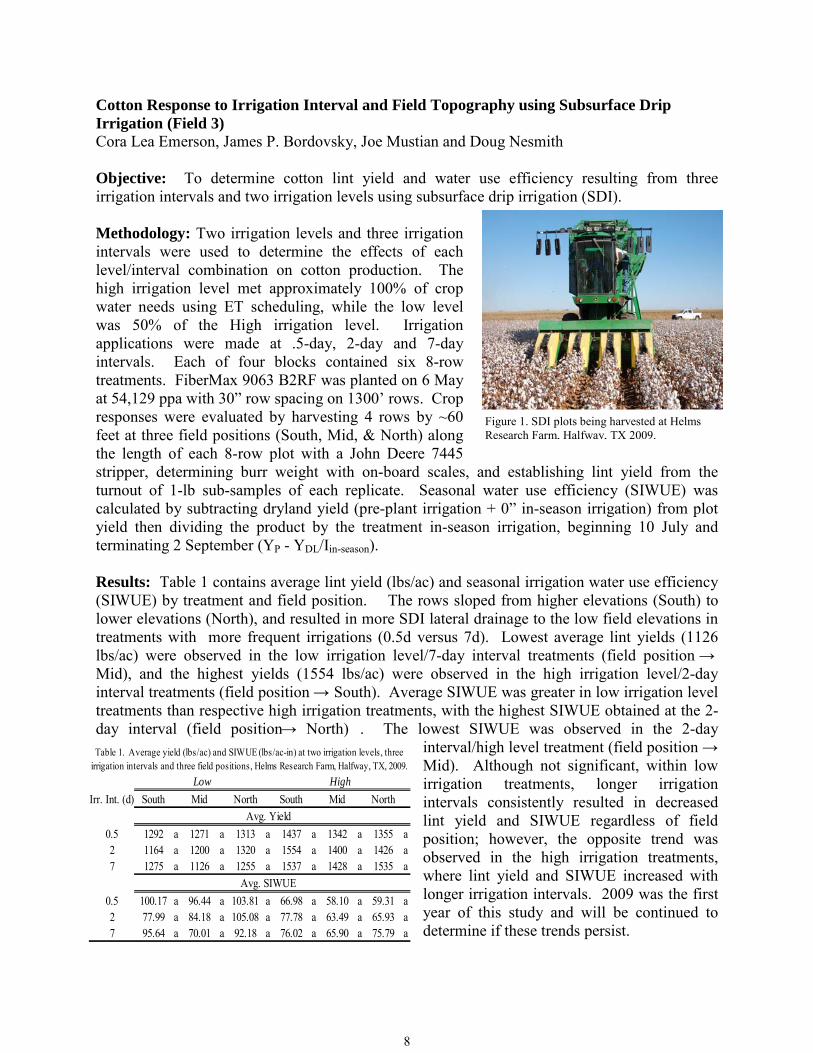
Figure 1. SDI plots being harvested at Helms Research Farm, Halfway, TX 2009.
Irr. Int. (d) South Mid North South Mid North
0.5 1292 a 1271 a 1313 a 1437 a 1342 a 1355 a2 1164 a 1200 a 1320 a 1554 a 1400 a 1426 a7 1275 a 1126 a 1255 a 1537 a 1428 a 1535 a
0.5 100.17 a 96.44 a 103.81 a 66.98 a 58.10 a 59.31 a2 77.99 a 84.18 a 105.08 a 77.78 a 63.49 a 65.93 a7 95.64 a 70.01 a 92.18 a 76.02 a 65.90 a 75.79 a
Avg. Yield
Avg. SIWUE
Table 1. Average yield (lbs/ac) and SIWUE (lbs/ac-in) at two irrigation levels, three irrigation intervals and three field positions, Helms Research Farm, Halfway, TX, 2009.
Low High
8
Bayer Cotton Agronomic Performance Trial at Helms Farm, Halfway, TX, 2009 (Field 5a, spans 5-8) Wayne Keeling, Jacob Reed, Michael Petty, and Daniel Olivier
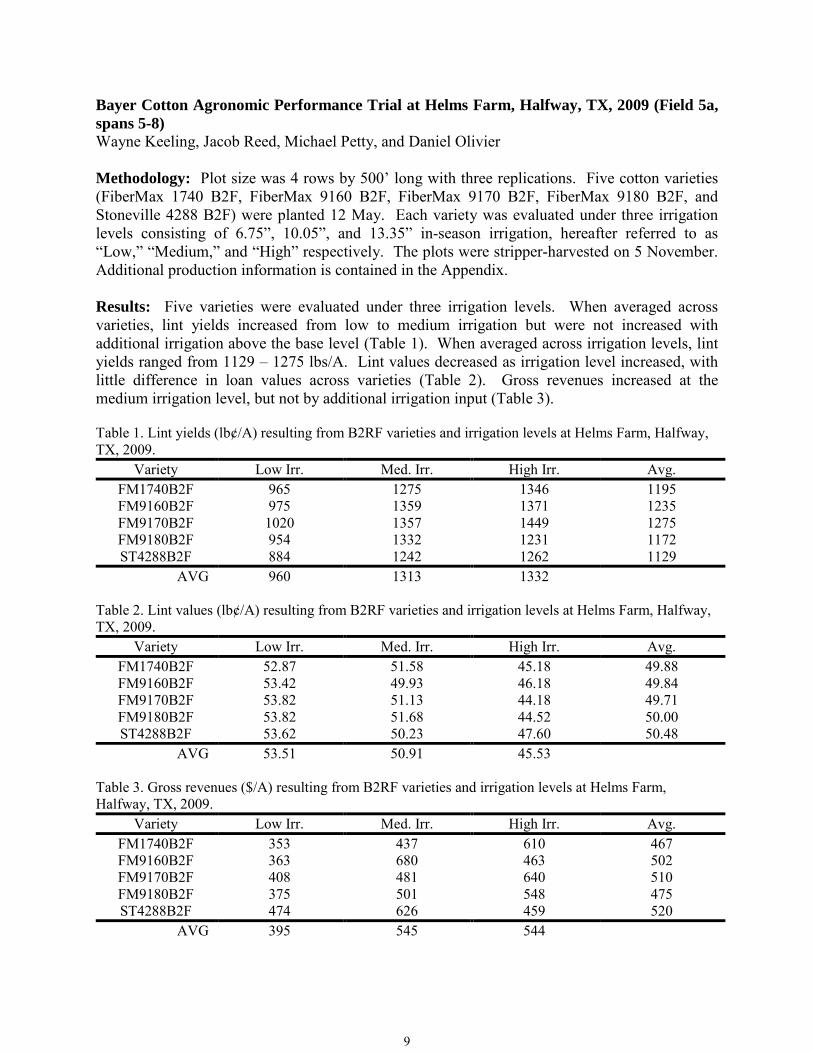
Methodology: Plot size was 4 rows by 500’ long with three replications. Five cotton varieties (FiberMax 1740 B2F, FiberMax 9160 B2F, FiberMax 9170 B2F, FiberMax 9180 B2F, and Stoneville 4288 B2F) were planted 12 May. Each variety was evaluated under three irrigation levels consisting of 6.75”, 10.05”, and 13.35” in-season irrigation, hereafter referred to as “Low,” “Medium,” and “High” respectively. The plots were stripper-harvested on 5 November. Additional production information is contained in the Appendix. Results: Five varieties were evaluated under three irrigation levels. When averaged across varieties, lint yields increased from low to medium irrigation but were not increased with additional irrigation above the base level (Table 1). When averaged across irrigation levels, lint yields ranged from 1129 – 1275 lbs/A. Lint values decreased as irrigation level increased, with little difference in loan values across varieties (Table 2). Gross revenues increased at the medium irrigation level, but not by additional irrigation input (Table 3).
Table 1. Lint yields (lb¢/A) resulting from B2RF varieties and irrigation levels at Helms Farm, Halfway, TX, 2009.
Variety Low Irr. Med. Irr. High Irr. Avg. FM1740B2F 965 1275 1346 1195 FM9160B2F 975 1359 1371 1235 FM9170B2F 1020 1357 1449 1275 FM9180B2F 954 1332 1231 1172 ST4288B2F 884 1242 1262 1129
AVG 960 1313 1332 Table 2. Lint values (lb¢/A) resulting from B2RF varieties and irrigation levels at Helms Farm, Halfway, TX, 2009.
Variety Low Irr. Med. Irr. High Irr. Avg. FM1740B2F 52.87 51.58 45.18 49.88 FM9160B2F 53.42 49.93 46.18 49.84 FM9170B2F 53.82 51.13 44.18 49.71 FM9180B2F 53.82 51.68 44.52 50.00 ST4288B2F 53.62 50.23 47.60 50.48
AVG 53.51 50.91 45.53 Table 3. Gross revenues ($/A) resulting from B2RF varieties and irrigation levels at Helms Farm, Halfway, TX, 2009.
Variety Low Irr. Med. Irr. High Irr. Avg. FM1740B2F 353 437 610 467 FM9160B2F 363 680 463 502 FM9170B2F 408 481 640 510 FM9180B2F 375 501 548 475 ST4288B2F 474 626 459 520
AVG 395 545 544
9
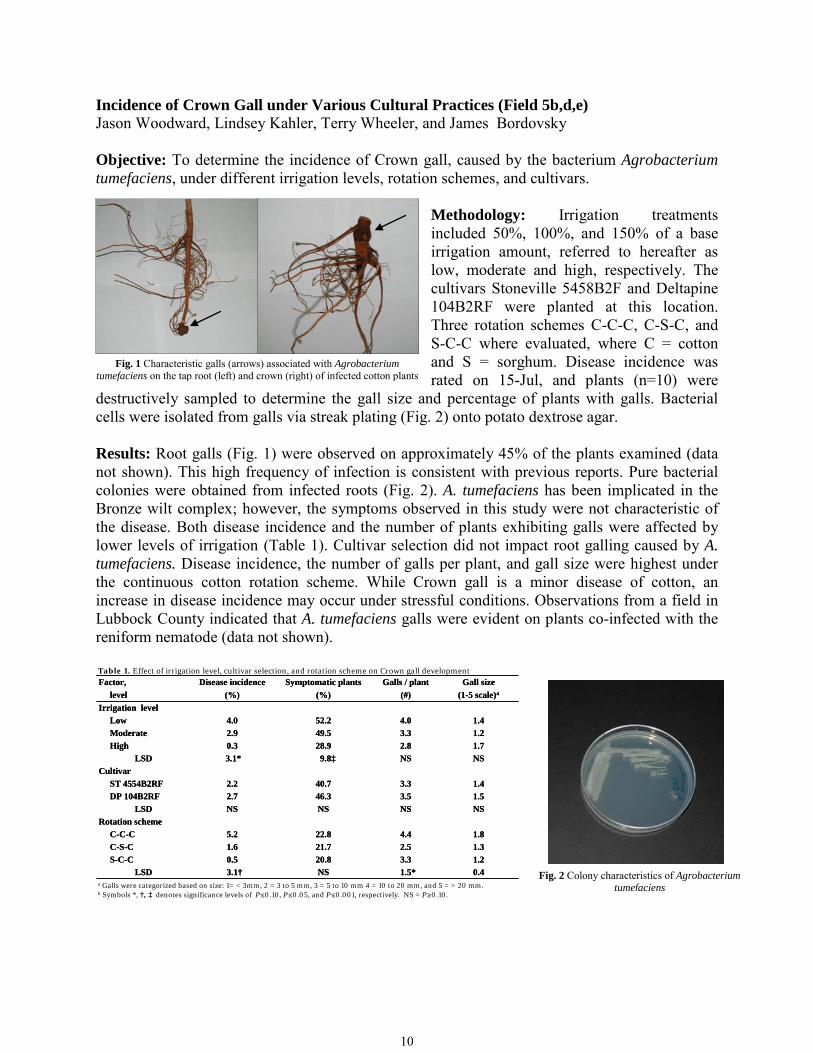
Incidence of Crown Gall under Various Cultural Practices (Field 5b,d,e) Jason Woodward, Lindsey Kahler, Terry Wheeler, and James Bordovsky Objective: To determine the incidence of Crown gall, caused by the bacterium Agrobacterium tumefaciens, under different irrigation levels, rotation schemes, and cultivars.
Methodology: Irrigation treatments included 50%, 100%, and 150% of a base irrigation amount, referred to hereafter as low, moderate and high, respectively. The cultivars Stoneville 5458B2F and Deltapine 104B2RF were planted at this location. Three rotation schemes C-C-C, C-S-C, and S-C-C where evaluated, where C = cotton and S = sorghum. Disease incidence was rated on 15-Jul, and plants (n=10) were
destructively sampled to determine the gall size and percentage of plants with galls. Bacterial cells were isolated from galls via streak plating (Fig. 2) onto potato dextrose agar. Results: Root galls (Fig. 1) were observed on approximately 45% of the plants examined (data not shown). This high frequency of infection is consistent with previous reports. Pure bacterial colonies were obtained from infected roots (Fig. 2). A. tumefaciens has been implicated in the Bronze wilt complex; however, the symptoms observed in this study were not characteristic of the disease. Both disease incidence and the number of plants exhibiting galls were affected by lower levels of irrigation (Table 1). Cultivar selection did not impact root galling caused by A. tumefaciens. Disease incidence, the number of galls per plant, and gall size were highest under the continuous cotton rotation scheme. While Crown gall is a minor disease of cotton, an increase in disease incidence may occur under stressful conditions. Observations from a field in Lubbock County indicated that A. tumefaciens galls were evident on plants co-infected with the reniform nematode (data not shown). Factor,
levelDisease incidence
(%)Symptomatic plants
(%)Galls / plant
(#)Gall size
(1-5 scale)a
Irrigation levelLow 4.0 52.2 4.0 1.4Moderate 2.9 49.5 3.3 1.2High 0.3 28.9 2.8 1.7
LSD 3.1* 9.8‡ NS NSCultivar
ST 4554B2RF 2.2 40.7 3.3 1.4DP 104B2RF 2.7 46.3 3.5 1.5
LSD NS NS NS NSRotation scheme
C-C-C 5.2 22.8 4.4 1.8C-S-C 1.6 21.7 2.5 1.3S-C-C 0.5 20.8 3.3 1.2
LSD 3.1† NS 1.5* 0.4
Factor, level
Disease incidence(%)
Symptomatic plants(%)
Galls / plant (#)
Gall size(1-5 scale)a
Irrigation levelLow 4.0 52.2 4.0 1.4Moderate 2.9 49.5 3.3 1.2High 0.3 28.9 2.8 1.7
LSD 3.1* 9.8‡ NS NSCultivar
ST 4554B2RF 2.2 40.7 3.3 1.4DP 104B2RF 2.7 46.3 3.5 1.5
LSD NS NS NS NSRotation scheme
C-C-C 5.2 22.8 4.4 1.8C-S-C 1.6 21.7 2.5 1.3S-C-C 0.5 20.8 3.3 1.2
LSD 3.1† NS 1.5* 0.4a Galls were categorized based on size: 1= < 3mm, 2 = 3 to 5 mm, 3 = 5 to 10 mm 4 = 10 to 20 mm, and 5 = > 20 mm. b Symbols *, †, ‡ denotes significance levels of P≤0.10, P≤0.05, and P≤0.001, respectively. NS = P≥0.10.
Table 1. Effect of irrigation level, cultivar selection, and rotation scheme on Crown gall development
Fig. 2 Colony characteristics of Agrobacterium
tumefaciens
Fig. 1 Characteristic galls (arrows) associated with Agrobacterium tumefaciens on the tap root (left) and crown (right) of infected cotton plants
10
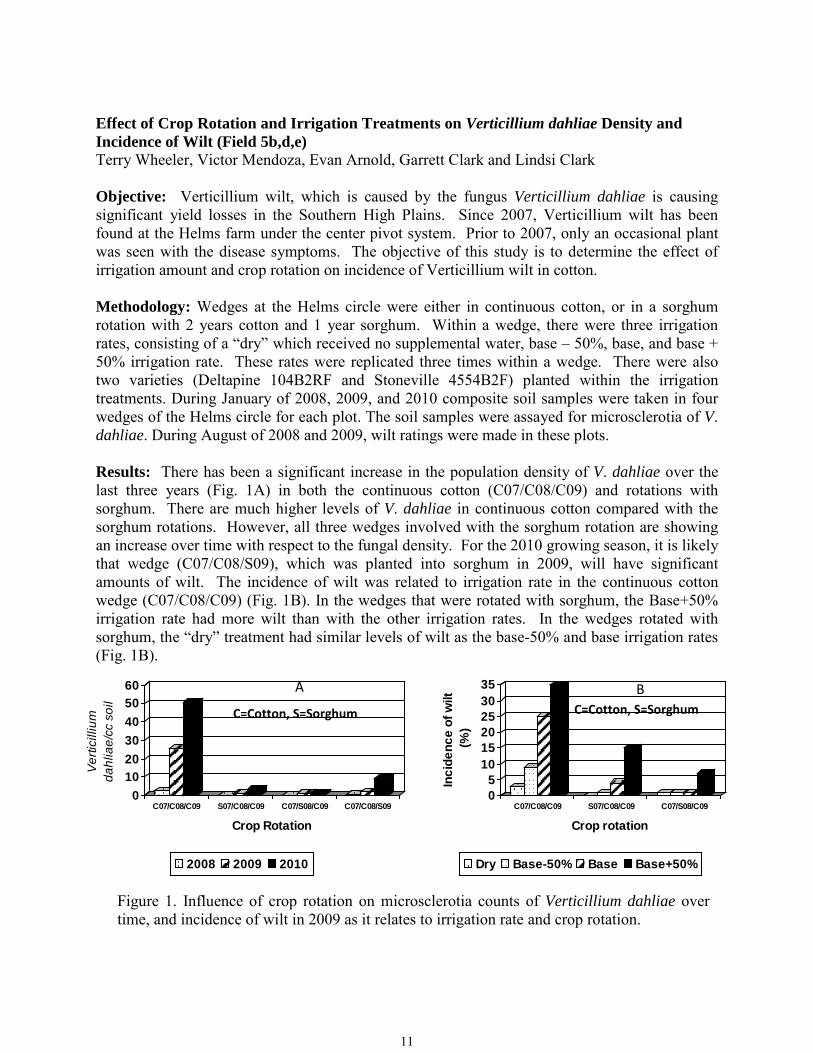
Effect of Crop Rotation and Irrigation Treatments on Verticillium dahliae Density and Incidence of Wilt (Field 5b,d,e) Terry Wheeler, Victor Mendoza, Evan Arnold, Garrett Clark and Lindsi Clark Objective: Verticillium wilt, which is caused by the fungus Verticillium dahliae is causing significant yield losses in the Southern High Plains. Since 2007, Verticillium wilt has been found at the Helms farm under the center pivot system. Prior to 2007, only an occasional plant was seen with the disease symptoms. The objective of this study is to determine the effect of irrigation amount and crop rotation on incidence of Verticillium wilt in cotton. Methodology: Wedges at the Helms circle were either in continuous cotton, or in a sorghum rotation with 2 years cotton and 1 year sorghum. Within a wedge, there were three irrigation rates, consisting of a “dry” which received no supplemental water, base – 50%, base, and base + 50% irrigation rate. These rates were replicated three times within a wedge. There were also two varieties (Deltapine 104B2RF and Stoneville 4554B2F) planted within the irrigation treatments. During January of 2008, 2009, and 2010 composite soil samples were taken in four wedges of the Helms circle for each plot. The soil samples were assayed for microsclerotia of V. dahliae. During August of 2008 and 2009, wilt ratings were made in these plots. Results: There has been a significant increase in the population density of V. dahliae over the last three years (Fig. 1A) in both the continuous cotton (C07/C08/C09) and rotations with sorghum. There are much higher levels of V. dahliae in continuous cotton compared with the sorghum rotations. However, all three wedges involved with the sorghum rotation are showing an increase over time with respect to the fungal density. For the 2010 growing season, it is likely that wedge (C07/C08/S09), which was planted into sorghum in 2009, will have significant amounts of wilt. The incidence of wilt was related to irrigation rate in the continuous cotton wedge (C07/C08/C09) (Fig. 1B). In the wedges that were rotated with sorghum, the Base+50% irrigation rate had more wilt than with the other irrigation rates. In the wedges rotated with sorghum, the “dry” treatment had similar levels of wilt as the base-50% and base irrigation rates (Fig. 1B).
Figure 1. Influence of crop rotation on microsclerotia counts of Verticillium dahliae over time, and incidence of wilt in 2009 as it relates to irrigation rate and crop rotation.
0102030405060
Ver
ticill
ium
da
hlia
e/cc
soi
l
C07/C08/C09 S07/C08/C09 C07/S08/C09 C07/C08/S09
Crop Rotation
2008 2009 2010
05
101520253035
Inci
denc
e of
wilt
(%
)
C07/C08/C09 S07/C08/C09 C07/S08/C09
Crop rotation
Dry Base-50% Base Base+50%
C=Cotton, S=Sorghum B
C=Cotton, S=Sorghum
A
11
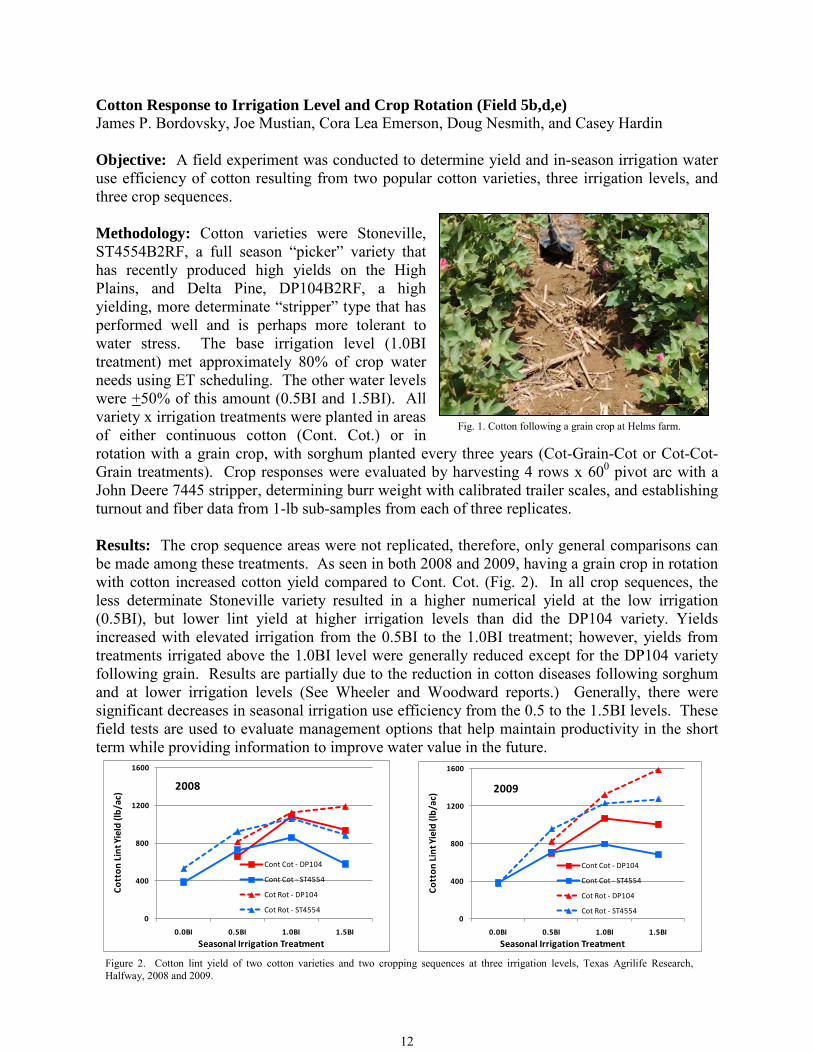
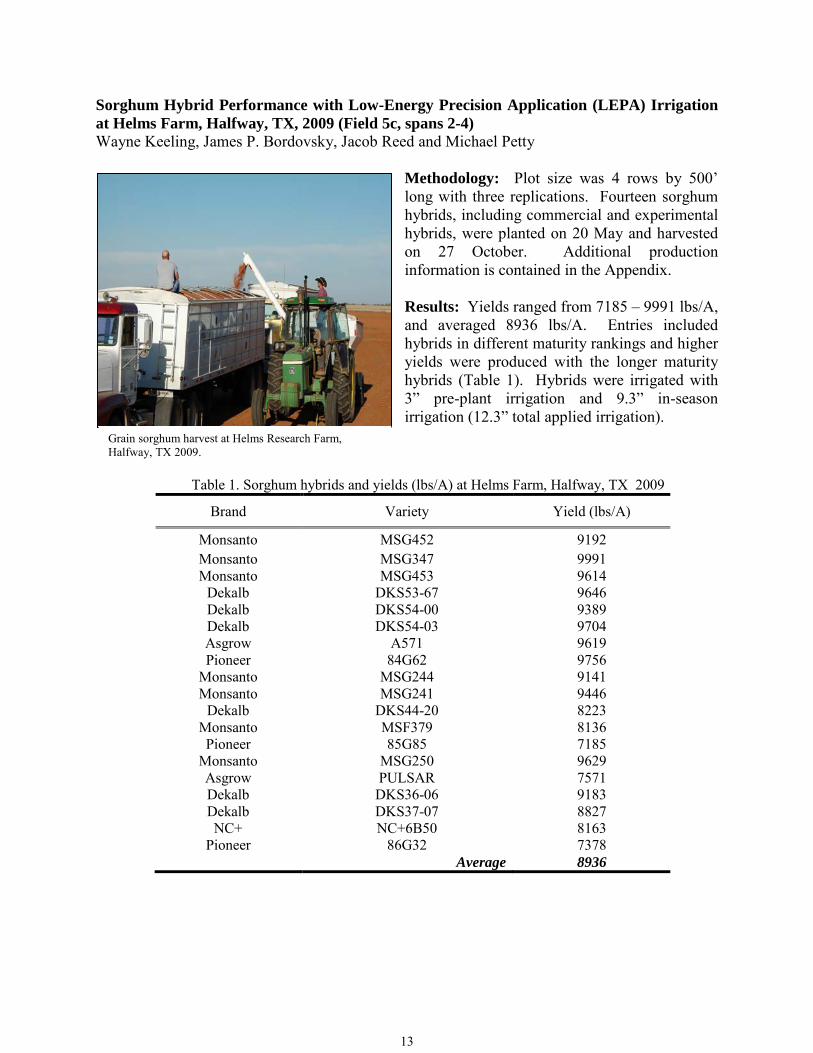
Cotton Response to Irrigation Level and Crop Rotation (Field 5b,d,e) James P. Bordovsky, Joe Mustian, Cora Lea Emerson, Doug Nesmith, and Casey Hardin Objective: A field experiment was conducted to determine yield and in-season irrigation water use efficiency of cotton resulting from two popular cotton varieties, three irrigation levels, and three crop sequences. Methodology: Cotton varieties were Stoneville, ST4554B2RF, a full season “picker” variety that has recently produced high yields on the High Plains, and Delta Pine, DP104B2RF, a high yielding, more determinate “stripper” type that has performed well and is perhaps more tolerant to water stress. The base irrigation level (1.0BI treatment) met approximately 80% of crop water needs using ET scheduling. The other water levels were +50% of this amount (0.5BI and 1.5BI). All variety x irrigation treatments were planted in areas of either continuous cotton (Cont. Cot.) or in rotation with a grain crop, with sorghum planted every three years (Cot-Grain-Cot or Cot-Cot-Grain treatments). Crop responses were evaluated by harvesting 4 rows x 600 pivot arc with a John Deere 7445 stripper, determining burr weight with calibrated trailer scales, and establishing turnout and fiber data from 1-lb sub-samples from each of three replicates. Results: The crop sequence areas were not replicated, therefore, only general comparisons can be made among these treatments. As seen in both 2008 and 2009, having a grain crop in rotation with cotton increased cotton yield compared to Cont. Cot. (Fig. 2). In all crop sequences, the less determinate Stoneville variety resulted in a higher numerical yield at the low irrigation (0.5BI), but lower lint yield at higher irrigation levels than did the DP104 variety. Yields increased with elevated irrigation from the 0.5BI to the 1.0BI treatment; however, yields from treatments irrigated above the 1.0BI level were generally reduced except for the DP104 variety following grain. Results are partially due to the reduction in cotton diseases following sorghum and at lower irrigation levels (See Wheeler and Woodward reports.) Generally, there were significant decreases in seasonal irrigation use efficiency from the 0.5 to the 1.5BI levels. These field tests are used to evaluate management options that help maintain productivity in the short term while providing information to improve water value in the future.
Fig. 1. Cotton following a grain crop at Helms farm.
Figure 2. Cotton lint yield of two cotton varieties and two cropping sequences at three irrigation levels, Texas Agrilife Research, Halfway, 2008 and 2009.
0
400
800
1200
1600
0.0BI 0.5BI 1.0BI 1.5BI
Cott
on L
int Y
ield
(lb/
ac)
Seasonal Irrigation Treatment
Cont Cot - DP104
Cont Cot - ST4554
Cot Rot - DP104
Cot Rot - ST4554
2009
0
400
800
1200
1600
0.0BI 0.5BI 1.0BI 1.5BI
Cott
on L
int Y
ield
(lb/
ac)
Seasonal Irrigation Treatment
Cont Cot - DP104
Cont Cot - ST4554
Cot Rot - DP104
Cot Rot - ST4554
2008
12
Sorghum Hybrid Performance with Low-Energy Precision Application (LEPA) Irrigation at Helms Farm, Halfway, TX, 2009 (Field 5c, spans 2-4) Wayne Keeling, James P. Bordovsky, Jacob Reed and Michael Petty
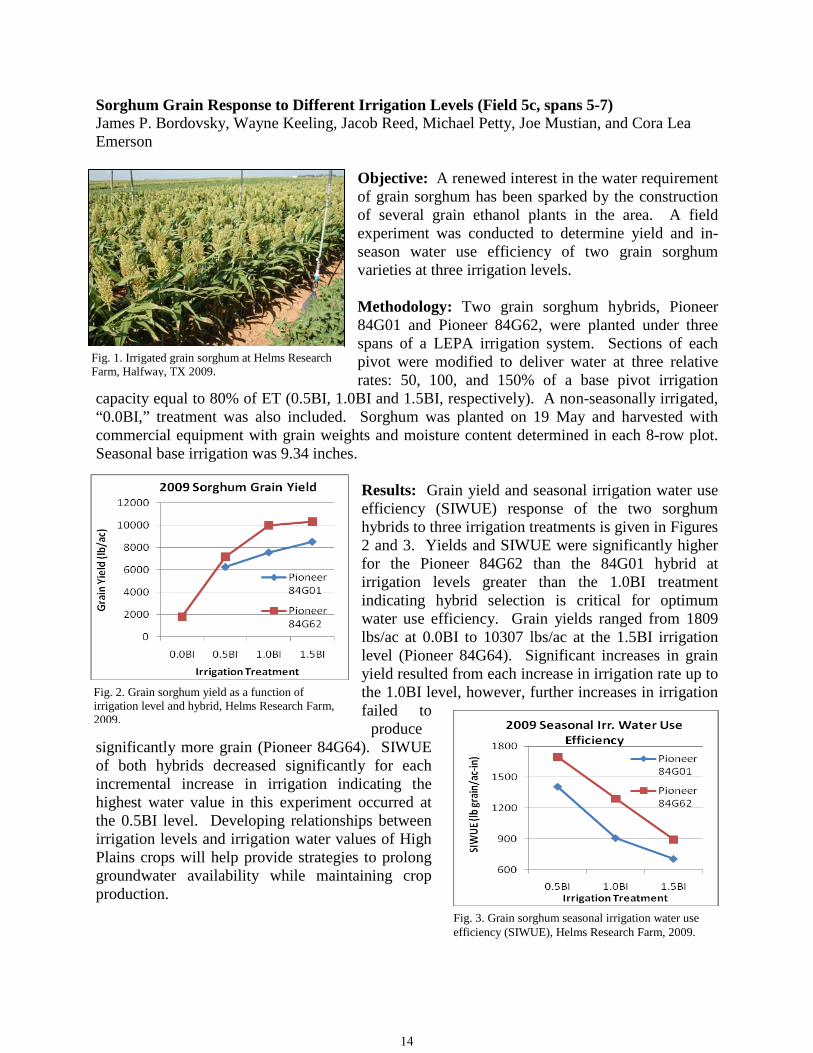
Methodology: Plot size was 4 rows by 500’ long with three replications. Fourteen sorghum hybrids, including commercial and experimental hybrids, were planted on 20 May and harvested on 27 October. Additional production information is contained in the Appendix. Results: Yields ranged from 7185 – 9991 lbs/A, and averaged 8936 lbs/A. Entries included hybrids in different maturity rankings and higher yields were produced with the longer maturity hybrids (Table 1). Hybrids were irrigated with 3” pre-plant irrigation and 9.3” in-season irrigation (12.3” total applied irrigation).
Table 1. Sorghum hybrids and yields (lbs/A) at Helms Farm, Halfway, TX 2009
Brand Variety Yield (lbs/A)
Monsanto MSG452 9192 Monsanto MSG347 9991 Monsanto MSG453 9614
Dekalb DKS53-67 9646 Dekalb DKS54-00 9389 Dekalb DKS54-03 9704 Asgrow A571 9619 Pioneer 84G62 9756
Monsanto MSG244 9141 Monsanto MSG241 9446
Dekalb DKS44-20 8223 Monsanto MSF379 8136 Pioneer 85G85 7185
Monsanto MSG250 9629 Asgrow PULSAR 7571 Dekalb DKS36-06 9183 Dekalb DKS37-07 8827 NC+ NC+6B50 8163
Pioneer 86G32 7378 Average 8936
Grain sorghum harvest at Helms Research Farm, Halfway, TX 2009.
13
Sorghum Grain Response to Different Irrigation Levels (Field 5c, spans 5-7) James P. Bordovsky, Wayne Keeling, Jacob Reed, Michael Petty, Joe Mustian, and Cora Lea Emerson
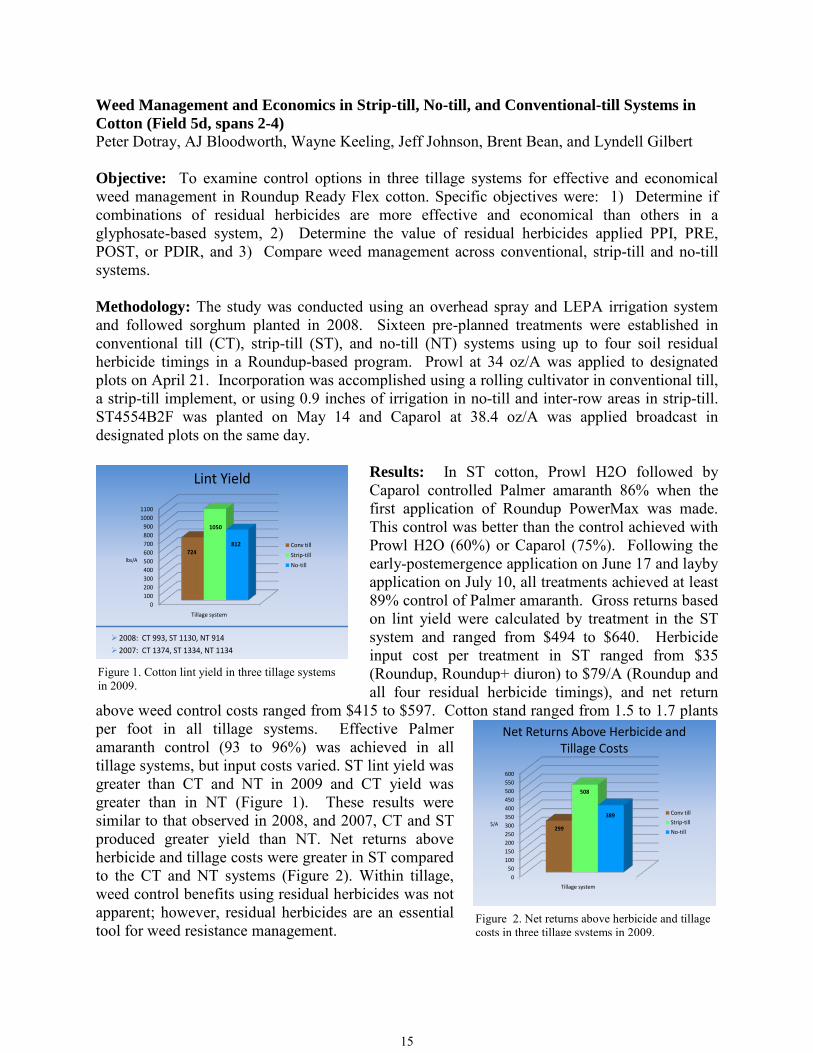
Objective: A renewed interest in the water requirement of grain sorghum has been sparked by the construction of several grain ethanol plants in the area. A field experiment was conducted to determine yield and in-season water use efficiency of two grain sorghum varieties at three irrigation levels. Methodology: Two grain sorghum hybrids, Pioneer 84G01 and Pioneer 84G62, were planted under three spans of a LEPA irrigation system. Sections of each pivot were modified to deliver water at three relative rates: 50, 100, and 150% of a base pivot irrigation
capacity equal to 80% of ET (0.5BI, 1.0BI and 1.5BI, respectively). A non-seasonally irrigated, “0.0BI,” treatment was also included. Sorghum was planted on 19 May and harvested with commercial equipment with grain weights and moisture content determined in each 8-row plot. Seasonal base irrigation was 9.34 inches.
Results: Grain yield and seasonal irrigation water use efficiency (SIWUE) response of the two sorghum hybrids to three irrigation treatments is given in Figures 2 and 3. Yields and SIWUE were significantly higher for the Pioneer 84G62 than the 84G01 hybrid at irrigation levels greater than the 1.0BI treatment indicating hybrid selection is critical for optimum water use efficiency. Grain yields ranged from 1809 lbs/ac at 0.0BI to 10307 lbs/ac at the 1.5BI irrigation level (Pioneer 84G64). Significant increases in grain yield resulted from each increase in irrigation rate up to the 1.0BI level, however, further increases in irrigation failed to
produce significantly more grain (Pioneer 84G64). SIWUE of both hybrids decreased significantly for each incremental increase in irrigation indicating the highest water value in this experiment occurred at the 0.5BI level. Developing relationships between irrigation levels and irrigation water values of High Plains crops will help provide strategies to prolong groundwater availability while maintaining crop production.
Fig. 1. Irrigated grain sorghum at Helms Research Farm, Halfway, TX 2009.
Fig. 3. Grain sorghum seasonal irrigation water use efficiency (SIWUE), Helms Research Farm, 2009.
Fig. 2. Grain sorghum yield as a function of irrigation level and hybrid, Helms Research Farm, 2009.
14
Weed Management and Economics in Strip-till, No-till, and Conventional-till Systems in Cotton (Field 5d, spans 2-4) Peter Dotray, AJ Bloodworth, Wayne Keeling, Jeff Johnson, Brent Bean, and Lyndell Gilbert Objective: To examine control options in three tillage systems for effective and economical weed management in Roundup Ready Flex cotton. Specific objectives were: 1) Determine if combinations of residual herbicides are more effective and economical than others in a glyphosate-based system, 2) Determine the value of residual herbicides applied PPI, PRE, POST, or PDIR, and 3) Compare weed management across conventional, strip-till and no-till systems. Methodology: The study was conducted using an overhead spray and LEPA irrigation system and followed sorghum planted in 2008. Sixteen pre-planned treatments were established in conventional till (CT), strip-till (ST), and no-till (NT) systems using up to four soil residual herbicide timings in a Roundup-based program. Prowl at 34 oz/A was applied to designated plots on April 21. Incorporation was accomplished using a rolling cultivator in conventional till, a strip-till implement, or using 0.9 inches of irrigation in no-till and inter-row areas in strip-till. ST4554B2F was planted on May 14 and Caparol at 38.4 oz/A was applied broadcast in designated plots on the same day.
Results: In ST cotton, Prowl H2O followed by Caparol controlled Palmer amaranth 86% when the first application of Roundup PowerMax was made. This control was better than the control achieved with Prowl H2O (60%) or Caparol (75%). Following the early-postemergence application on June 17 and layby application on July 10, all treatments achieved at least 89% control of Palmer amaranth. Gross returns based on lint yield were calculated by treatment in the ST system and ranged from $494 to $640. Herbicide input cost per treatment in ST ranged from $35 (Roundup, Roundup+ diuron) to $79/A (Roundup and all four residual herbicide timings), and net return
above weed control costs ranged from $415 to $597. Cotton stand ranged from 1.5 to 1.7 plants per foot in all tillage systems. Effective Palmer amaranth control (93 to 96%) was achieved in all tillage systems, but input costs varied. ST lint yield was greater than CT and NT in 2009 and CT yield was greater than in NT (Figure 1). These results were similar to that observed in 2008, and 2007, CT and ST produced greater yield than NT. Net returns above herbicide and tillage costs were greater in ST compared to the CT and NT systems (Figure 2). Within tillage, weed control benefits using residual herbicides was not apparent; however, residual herbicides are an essential tool for weed resistance management.
Figure 2. Net returns above herbicide and tillage costs in three tillage systems in 2009.
050
100150200250300350400450500550600
Tillage system
299
508
389 Conv till
Strip-till
No-till$/A
Net Returns Above Herbicide and Tillage Costs
Figure 1. Cotton lint yield in three tillage systems in 2009.
0100200300400500600700800900
10001100
Tillage system
724
1050
812 Conv till
Strip-till
No-tilllbs/A
Lint Yield
2008: CT 993, ST 1130, NT 914
2007: CT 1374, ST 1334, NT 1134
15
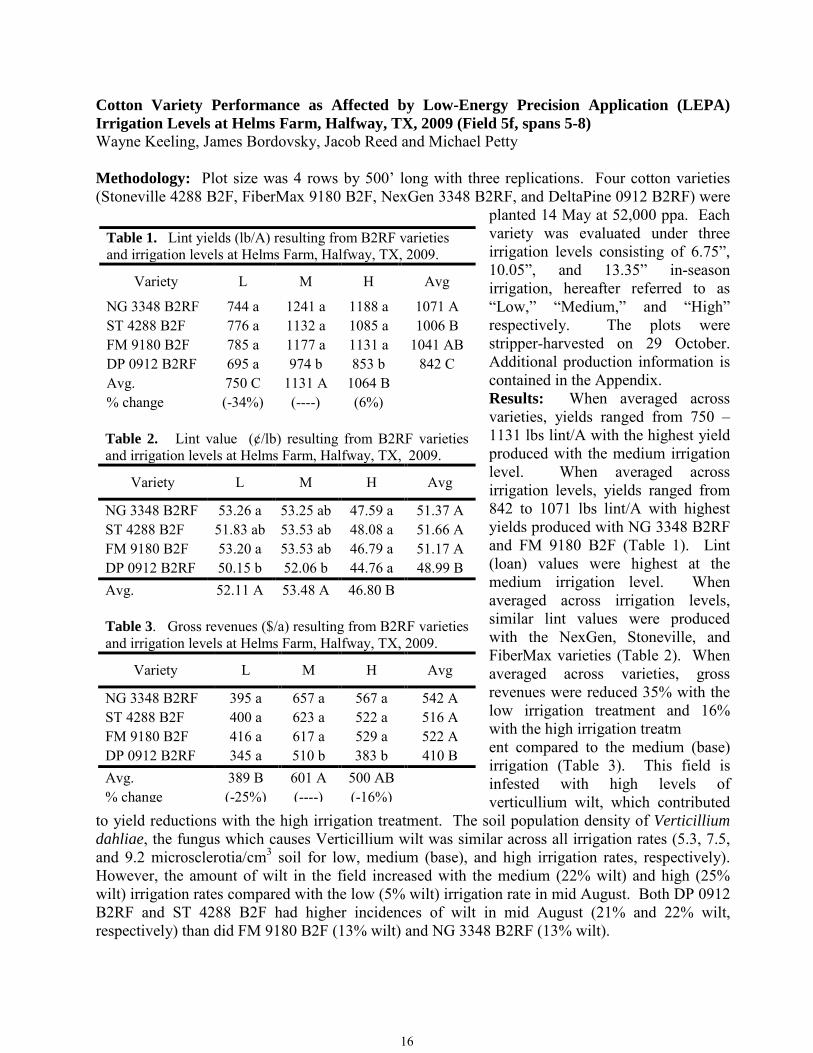
Table 1. Lint yields (lb/A) resulting from B2RF varieties and irrigation levels at Helms Farm, Halfway, TX, 2009.
Variety L M H Avg
NG 3348 B2RF 744 a 1241 a 1188 a 1071 A ST 4288 B2F 776 a 1132 a 1085 a 1006 B FM 9180 B2F 785 a 1177 a 1131 a 1041 AB DP 0912 B2RF 695 a 974 b 853 b 842 C Avg. 750 C 1131 A 1064 B % change (-34%) (----) (6%) Table 2. Lint value (¢/lb) resulting from B2RF varieties and irrigation levels at Helms Farm, Halfway, TX, 2009.
Variety L M H Avg
NG 3348 B2RF 53.26 a 53.25 ab 47.59 a 51.37 A ST 4288 B2F 51.83 ab 53.53 ab 48.08 a 51.66 A FM 9180 B2F 53.20 a 53.53 ab 46.79 a 51.17 A DP 0912 B2RF 50.15 b 52.06 b 44.76 a 48.99 B Avg. 52.11 A 53.48 A 46.80 B Table 3. Gross revenues ($/a) resulting from B2RF varieties and irrigation levels at Helms Farm, Halfway, TX, 2009.
Variety L M H Avg
NG 3348 B2RF 395 a 657 a 567 a 542 A ST 4288 B2F 400 a 623 a 522 a 516 A FM 9180 B2F 416 a 617 a 529 a 522 A DP 0912 B2RF 345 a 510 b 383 b 410 B Avg. 389 B 601 A 500 AB % change (-25%) (----) (-16%)
Cotton Variety Performance as Affected by Low-Energy Precision Application (LEPA) Irrigation Levels at Helms Farm, Halfway, TX, 2009 (Field 5f, spans 5-8) Wayne Keeling, James Bordovsky, Jacob Reed and Michael Petty Methodology: Plot size was 4 rows by 500’ long with three replications. Four cotton varieties (Stoneville 4288 B2F, FiberMax 9180 B2F, NexGen 3348 B2RF, and DeltaPine 0912 B2RF) were
planted 14 May at 52,000 ppa. Each variety was evaluated under three irrigation levels consisting of 6.75”, 10.05”, and 13.35” in-season irrigation, hereafter referred to as “Low,” “Medium,” and “High” respectively. The plots were stripper-harvested on 29 October. Additional production information is contained in the Appendix. Results: When averaged across varieties, yields ranged from 750 – 1131 lbs lint/A with the highest yield produced with the medium irrigation level. When averaged across irrigation levels, yields ranged from 842 to 1071 lbs lint/A with highest yields produced with NG 3348 B2RF and FM 9180 B2F (Table 1). Lint (loan) values were highest at the medium irrigation level. When averaged across irrigation levels, similar lint values were produced with the NexGen, Stoneville, and FiberMax varieties (Table 2). When averaged across varieties, gross revenues were reduced 35% with the low irrigation treatment and 16% with the high irrigation treatm ent compared to the medium (base) irrigation (Table 3). This field is infested with high levels of verticullium wilt, which contributed
to yield reductions with the high irrigation treatment. The soil population density of Verticillium dahliae, the fungus which causes Verticillium wilt was similar across all irrigation rates (5.3, 7.5, and 9.2 microsclerotia/cm3 soil for low, medium (base), and high irrigation rates, respectively). However, the amount of wilt in the field increased with the medium (22% wilt) and high (25% wilt) irrigation rates compared with the low (5% wilt) irrigation rate in mid August. Both DP 0912 B2RF and ST 4288 B2F had higher incidences of wilt in mid August (21% and 22% wilt, respectively) than did FM 9180 B2F (13% wilt) and NG 3348 B2RF (13% wilt).
16
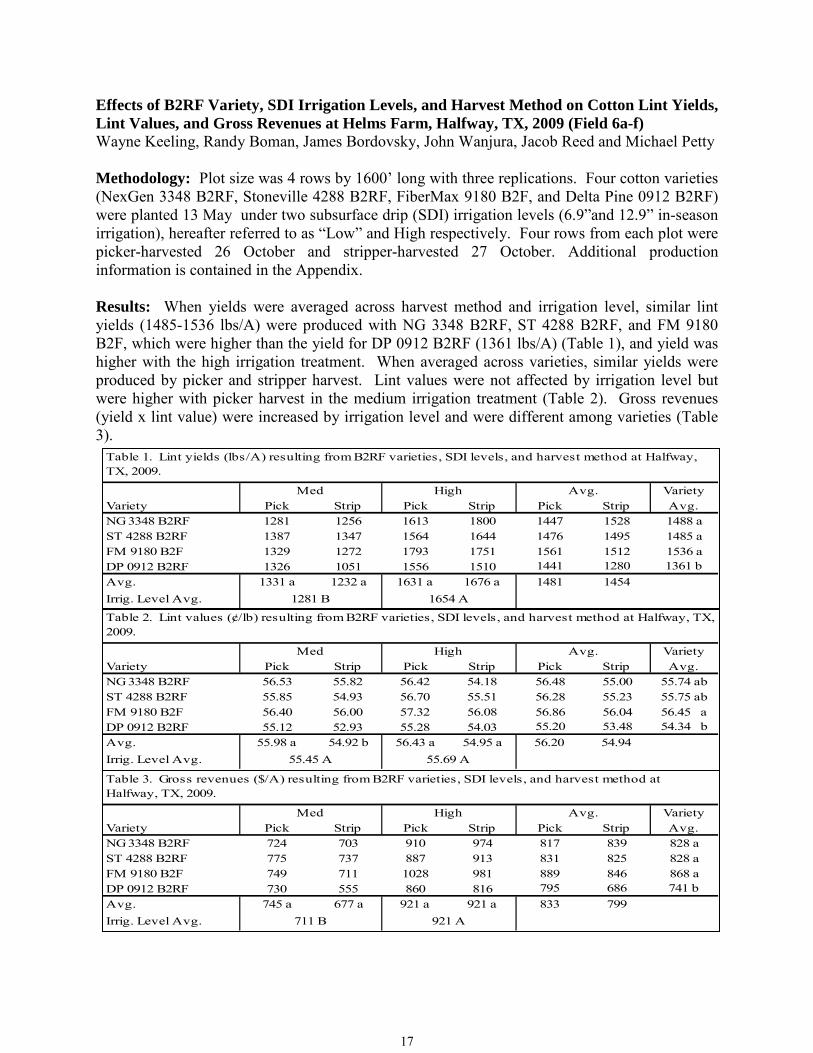
Effects of B2RF Variety, SDI Irrigation Levels, and Harvest Method on Cotton Lint Yields, Lint Values, and Gross Revenues at Helms Farm, Halfway, TX, 2009 (Field 6a-f) Wayne Keeling, Randy Boman, James Bordovsky, John Wanjura, Jacob Reed and Michael Petty
Methodology: Plot size was 4 rows by 1600’ long with three replications. Four cotton varieties (NexGen 3348 B2RF, Stoneville 4288 B2RF, FiberMax 9180 B2F, and Delta Pine 0912 B2RF) were planted 13 May under two subsurface drip (SDI) irrigation levels (6.9”and 12.9” in-season irrigation), hereafter referred to as “Low” and High respectively. Four rows from each plot were picker-harvested 26 October and stripper-harvested 27 October. Additional production information is contained in the Appendix. Results: When yields were averaged across harvest method and irrigation level, similar lint yields (1485-1536 lbs/A) were produced with NG 3348 B2RF, ST 4288 B2RF, and FM 9180 B2F, which were higher than the yield for DP 0912 B2RF (1361 lbs/A) (Table 1), and yield was higher with the high irrigation treatment. When averaged across varieties, similar yields were produced by picker and stripper harvest. Lint values were not affected by irrigation level but were higher with picker harvest in the medium irrigation treatment (Table 2). Gross revenues (yield x lint value) were increased by irrigation level and were different among varieties (Table 3).
VarietyVariety Pick Strip Pick Strip Pick Strip Avg.NG 3348 B2RF 1281 1256 1613 1800 1447 1528 1488 aST 4288 B2RF 1387 1347 1564 1644 1476 1495 1485 aFM 9180 B2F 1329 1272 1793 1751 1561 1512 1536 aDP 0912 B2RF 1326 1051 1556 1510 1441 1280 1361 bAvg. 1331 a 1232 a 1631 a 1676 a 1481 1454Irrig. Level Avg. 1281 B 1654 A
Table 1. Lint yields (lbs/A) resulting from B2RF varieties, SDI levels, and harvest method at Halfway, TX, 2009.
Med High Avg.
VarietyVariety Pick Strip Pick Strip Pick Strip Avg.NG 3348 B2RF 56.53 55.82 56.42 54.18 56.48 55.00 55.74 abST 4288 B2RF 55.85 54.93 56.70 55.51 56.28 55.23 55.75 abFM 9180 B2F 56.40 56.00 57.32 56.08 56.86 56.04 56.45 aDP 0912 B2RF 55.12 52.93 55.28 54.03 55.20 53.48 54.34 bAvg. 55.98 a 54.92 b 56.43 a 54.95 a 56.20 54.94Irrig. Level Avg.
Table 2. Lint values (¢/lb) resulting from B2RF varieties, SDI levels, and harvest method at Halfway, TX, 2009.
Med High Avg.
55.45 A 55.69 A
VarietyVariety Pick Strip Pick Strip Pick Strip Avg.NG 3348 B2RF 724 703 910 974 817 839 828 aST 4288 B2RF 775 737 887 913 831 825 828 aFM 9180 B2F 749 711 1028 981 889 846 868 aDP 0912 B2RF 730 555 860 816 795 686 741 bAvg. 745 a 677 a 921 a 921 a 833 799Irrig. Level Avg.
High Avg.
711 B 921 A
Table 3. Gross revenues ($/A) resulting from B2RF varieties, SDI levels, and harvest method at Halfway, TX, 2009.
Med
17
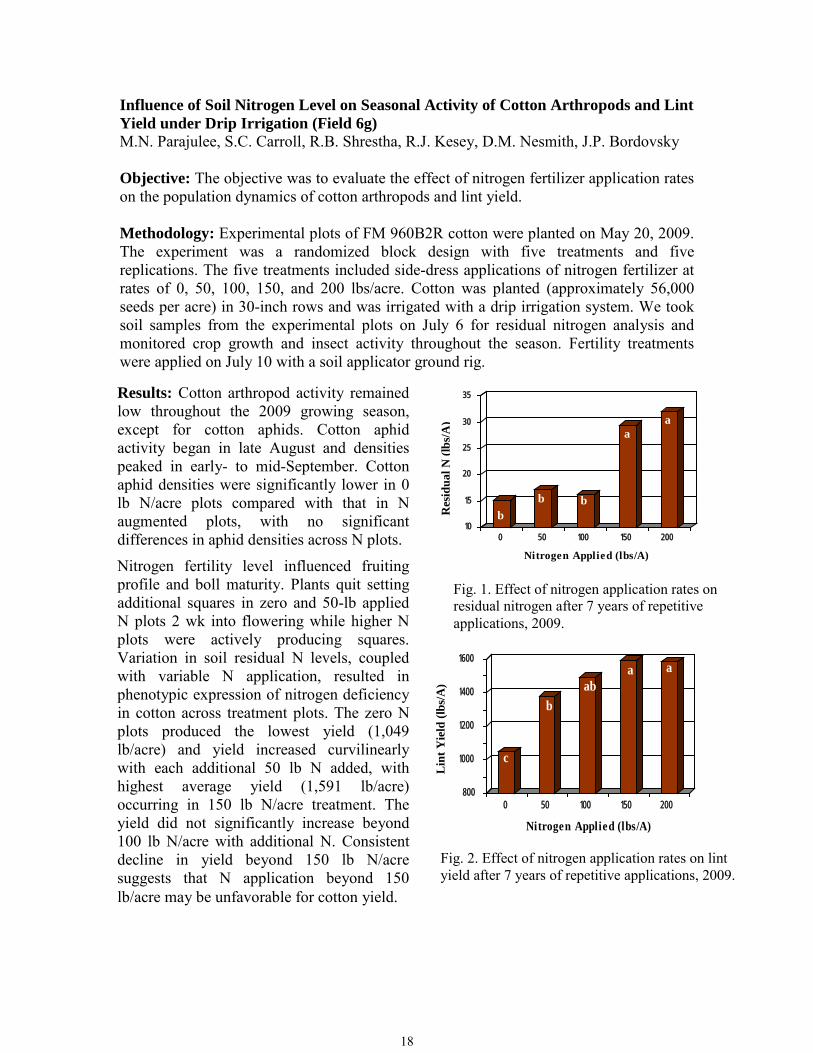
Influence of Soil Nitrogen Level on Seasonal Activity of Cotton Arthropods and Lint Yield under Drip Irrigation (Field 6g) M.N. Parajulee, S.C. Carroll, R.B. Shrestha, R.J. Kesey, D.M. Nesmith, J.P. Bordovsky Objective: The objective was to evaluate the effect of nitrogen fertilizer application rates on the population dynamics of cotton arthropods and lint yield. Methodology: Experimental plots of FM 960B2R cotton were planted on May 20, 2009. The experiment was a randomized block design with five treatments and five replications. The five treatments included side-dress applications of nitrogen fertilizer at rates of 0, 50, 100, 150, and 200 lbs/acre. Cotton was planted (approximately 56,000 seeds per acre) in 30-inch rows and was irrigated with a drip irrigation system. We took soil samples from the experimental plots on July 6 for residual nitrogen analysis and monitored crop growth and insect activity throughout the season. Fertility treatments were applied on July 10 with a soil applicator ground rig.
Results: Cotton arthropod activity remained low throughout the 2009 growing season, except for cotton aphids. Cotton aphid activity began in late August and densities peaked in early- to mid-September. Cotton aphid densities were significantly lower in 0 lb N/acre plots compared with that in N augmented plots, with no significant differences in aphid densities across N plots.
Nitrogen fertility level influenced fruiting profile and boll maturity. Plants quit setting additional squares in zero and 50-lb applied N plots 2 wk into flowering while higher N plots were actively producing squares. Variation in soil residual N levels, coupled with variable N application, resulted in phenotypic expression of nitrogen deficiency in cotton across treatment plots. The zero N plots produced the lowest yield (1,049 lb/acre) and yield increased curvilinearly with each additional 50 lb N added, with highest average yield (1,591 lb/acre) occurring in 150 lb N/acre treatment. The yield did not significantly increase beyond 100 lb N/acre with additional N. Consistent decline in yield beyond 150 lb N/acre suggests that N application beyond 150 lb/acre may be unfavorable for cotton yield.
bb b
aa
10
15
20
25
30
35
0 50 100 150 200
Nitrogen Applied (lbs/A)
Res
idua
l N (l
bs/A
)
c
bab
a a
800
1000
1200
1400
1600
0 50 100 150 200
Nitrogen Applied (lbs/A)
Lin
t Yie
ld (l
bs/A
)
Fig. 2. Effect of nitrogen application rates on lint yield after 7 years of repetitive applications, 2009.
Fig. 1. Effect of nitrogen application rates on residual nitrogen after 7 years of repetitive applications, 2009.
18
Farm Scale Yield Comparisons of Subsurface Drip Irrigation to Center Pivot Irrigation James P. Bordovsky and Doug Nesmith Objective: Compare lint yields and irrigation quantities from farm scale cotton production irrigated by subsurface drip irrigation (SDI) and LEPA.
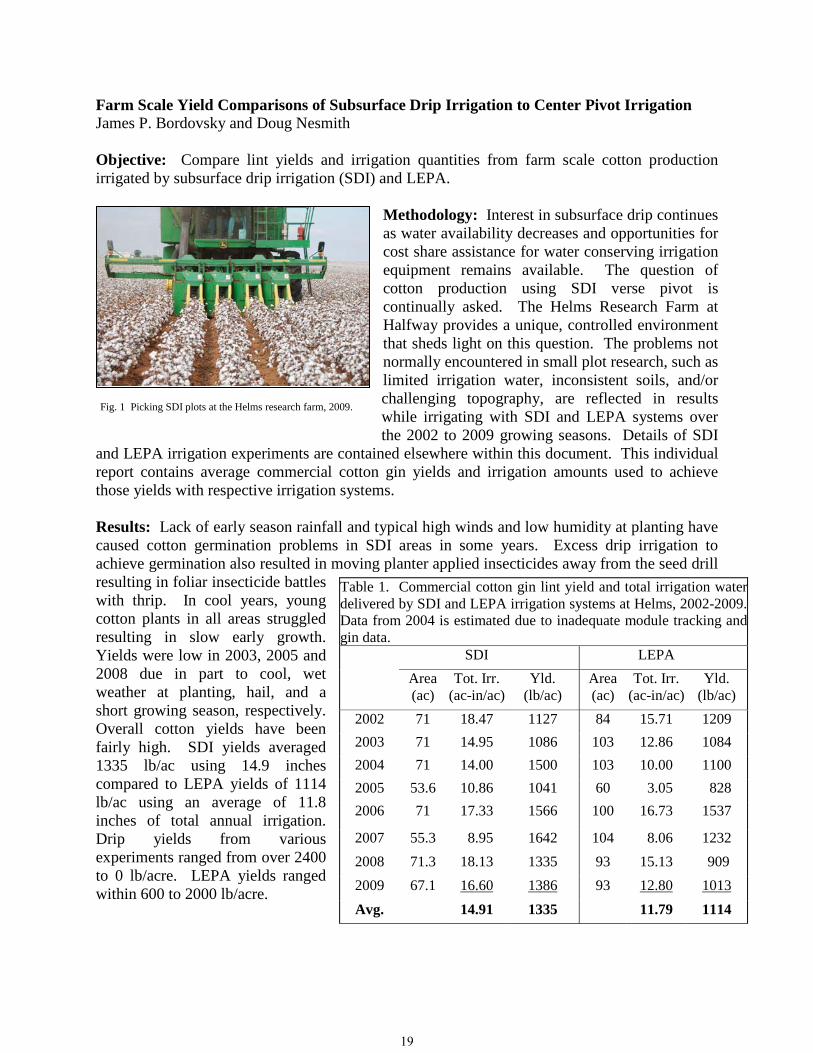
Methodology: Interest in subsurface drip continues as water availability decreases and opportunities for cost share assistance for water conserving irrigation equipment remains available. The question of cotton production using SDI verse pivot is continually asked. The Helms Research Farm at Halfway provides a unique, controlled environment that sheds light on this question. The problems not normally encountered in small plot research, such as limited irrigation water, inconsistent soils, and/or challenging topography, are reflected in results while irrigating with SDI and LEPA systems over the 2002 to 2009 growing seasons. Details of SDI
and LEPA irrigation experiments are contained elsewhere within this document. This individual report contains average commercial cotton gin yields and irrigation amounts used to achieve those yields with respective irrigation systems. Results: Lack of early season rainfall and typical high winds and low humidity at planting have caused cotton germination problems in SDI areas in some years. Excess drip irrigation to achieve germination also resulted in moving planter applied insecticides away from the seed drill resulting in foliar insecticide battles with thrip. In cool years, young cotton plants in all areas struggled resulting in slow early growth. Yields were low in 2003, 2005 and 2008 due in part to cool, wet weather at planting, hail, and a short growing season, respectively. Overall cotton yields have been fairly high. SDI yields averaged 1335 lb/ac using 14.9 inches compared to LEPA yields of 1114 lb/ac using an average of 11.8 inches of total annual irrigation. Drip yields from various experiments ranged from over 2400 to 0 lb/acre. LEPA yields ranged within 600 to 2000 lb/acre.
Table 1. Commercial cotton gin lint yield and total irrigation water delivered by SDI and LEPA irrigation systems at Helms, 2002-2009. Data from 2004 is estimated due to inadequate module tracking and gin data.
SDI LEPA Area
(ac) Tot. Irr.
(ac-in/ac) Yld.
(lb/ac) Area (ac)
Tot. Irr. (ac-in/ac)
Yld. (lb/ac)
2002 71 18.47 1127 84 15.71 1209 2003 71 14.95 1086 103 12.86 1084 2004 71 14.00 1500 103 10.00 1100 2005 53.6 10.86 1041 60 3.05 828 2006 71 17.33 1566 100 16.73 1537
2007 55.3 8.95 1642 104 8.06 1232 2008 71.3 18.13 1335 93 15.13 909 2009 67.1 16.60 1386 93 12.80 1013 Avg. 14.91 1335 11.79 1114
Fig. 1 Picking SDI plots at the Helms research farm, 2009.
19
APPENDIX
20
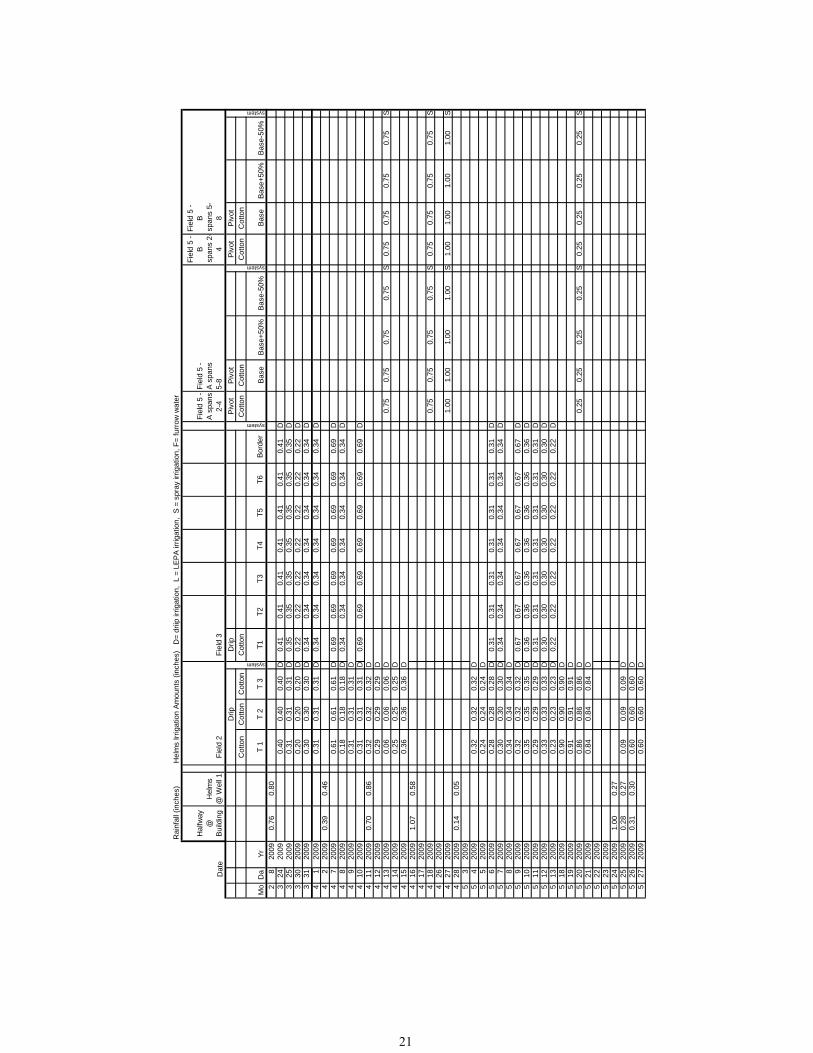
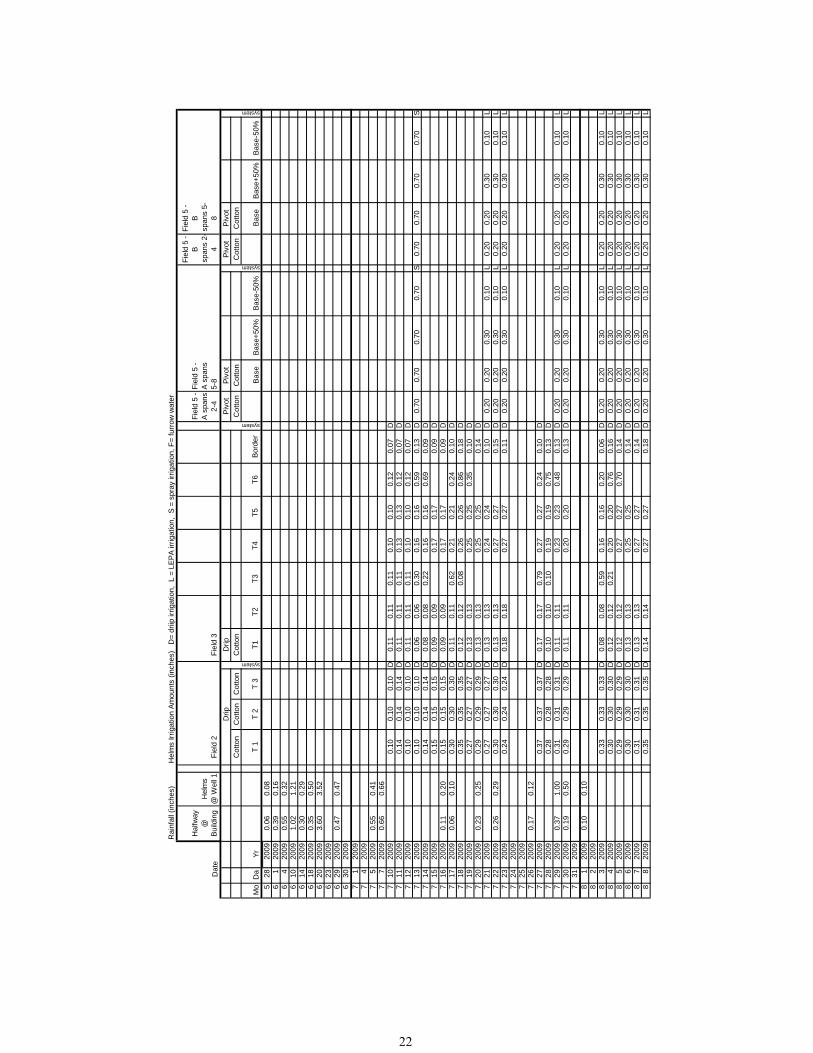
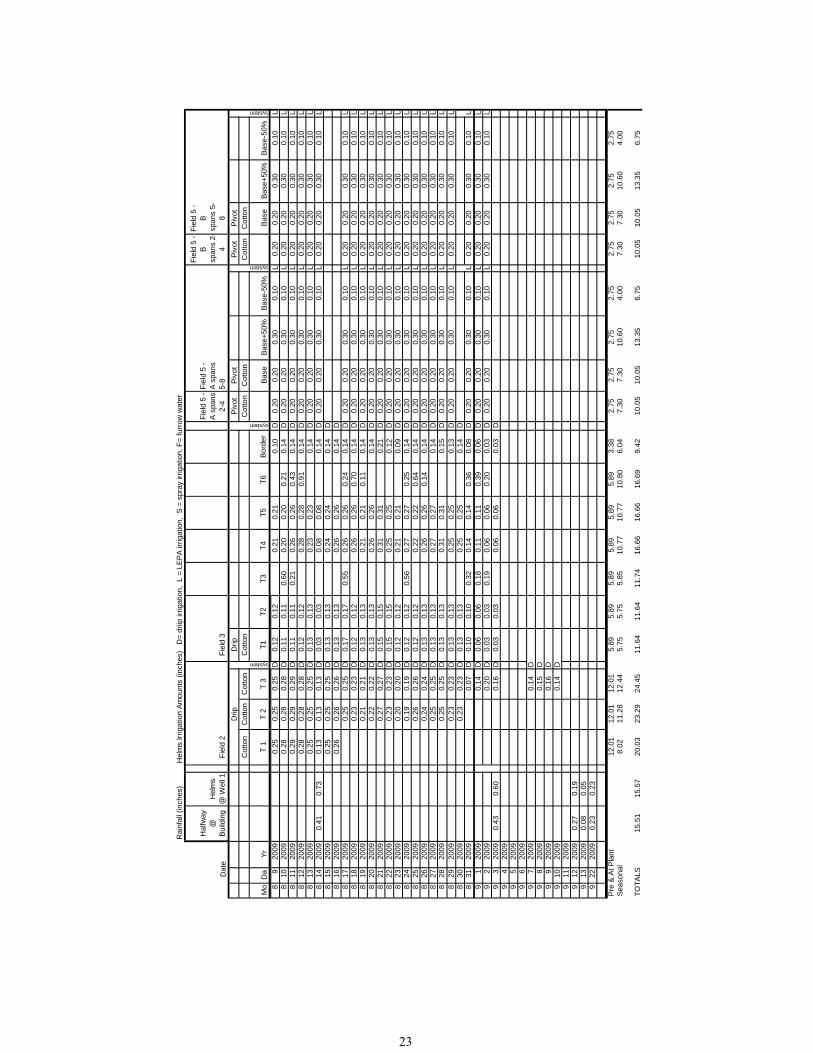
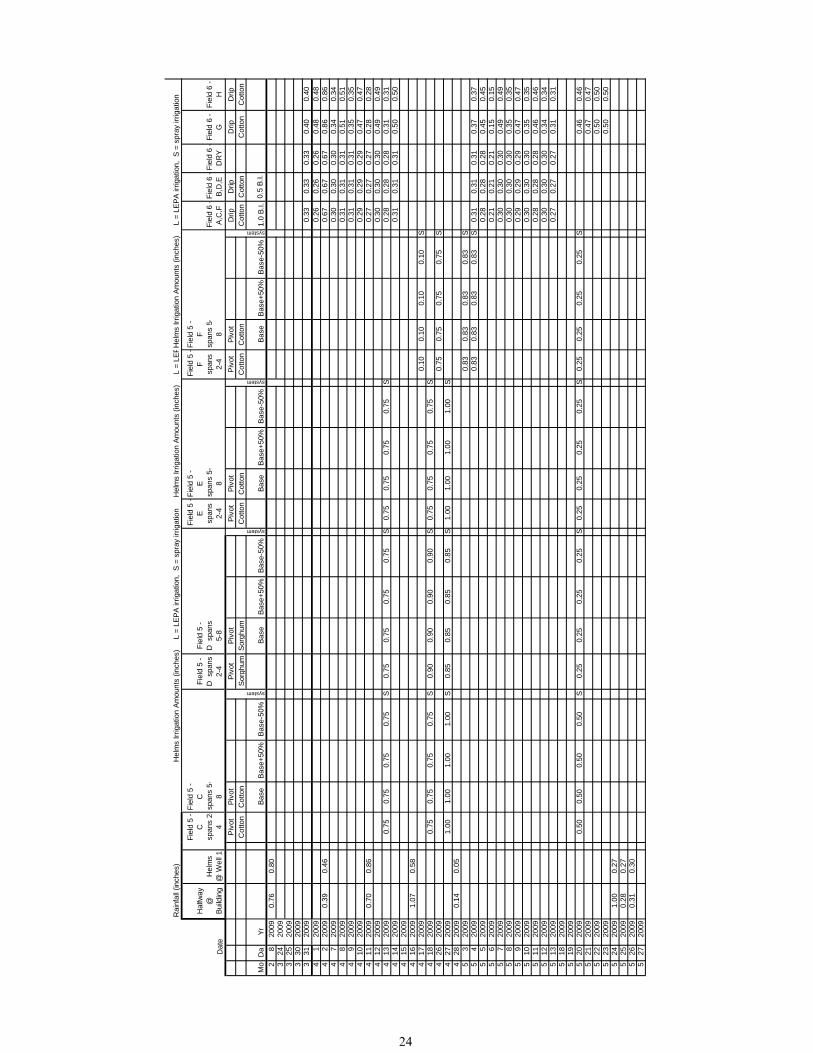
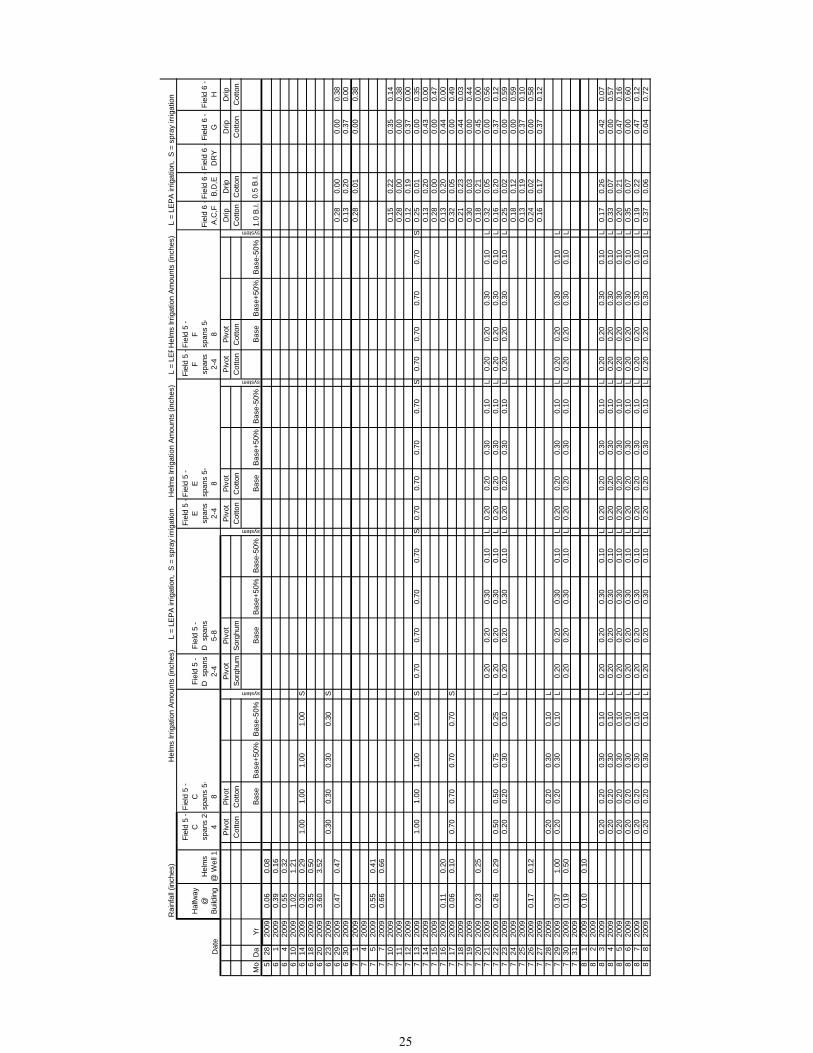
Rai
nfal
l (in
ches
)H
elm
s Irr
igat
ion
Amou
nts
(inch
es)
D=
driip
irrig
atio
n, L
= L
EPA
irrig
atio
n, S
= s
pray
irrig
atio
n, F
= fu
rrow
wat
er
Hal
fway
@
Bu
ildin
gH
elm
s @
Wel
l 1Fi
eld
2Fi
eld
3
Fiel
d 5
- A
span
s 2-
4
Fiel
d 5
- A
span
s 5-
8
Fiel
d 5
- B
sp
ans
2-4
Fiel
d 5
- B
sp
ans
5-8
Drip
Drip
Pivo
tPi
vot
Pivo
tPi
vot
Cot
ton
Cot
ton
Cot
ton
Cot
ton
Cot
ton
Cot
ton
Cot
ton
Cot
ton
Mo
Da
YrT
1T
2T
3T1
T2T3
T4T5
T6Bo
rder
Base
Base
+50%
Base
-50%
Base
Base
+50%
Base
-50%
28
2009
0.76
0.80
324
2009
0.40
0.40
0.40
D0.
410.
410.
410.
410.
410.
410.
41D
325
2009
0.31
0.31
0.31
D0.
350.
350.
350.
350.
350.
350.
35D
330
2009
0.20
0.20
0.20
D0.
220.
220.
220.
220.
220.
220.
22D
331
2009
0.30
0.30
0.30
D0.
340.
340.
340.
340.
340.
340.
34D
41
2009
0.31
0.31
0.31
D0.
340.
340.
340.
340.
340.
340.
34D
42
2009
0.39
0.46
47
2009
0.61
0.61
0.61
D0.
690.
690.
690.
690.
690.
690.
69D
48
2009
0.18
0.18
0.18
D0.
340.
340.
340.
340.
340.
340.
34D
49
2009
0.31
0.31
0.31
D4
1020
090.
310.
310.
31D
0.69
0.69
0.69
0.69
0.69
0.69
0.69
D4
1120
090.
700.
860.
320.
320.
32D
412
2009
0.29
0.29
0.29
D4
1320
090.
060.
060.
06D
0.75
0.75
0.75
0.75
S0.
750.
750.
750.
75S
414
2009
0.25
0.25
0.25
D4
1520
090.
360.
360.
36D
416
2009
1.07
0.58
417
2009
418
2009
0.75
0.75
0.75
0.75
S0.
750.
750.
750.
75S
426
2009
427
2009
1.00
1.00
1.00
1.00
S1.
001.
001.
001.
00S
428
2009
0.14
0.05
53
2009
54
2009
0.32
0.32
0.32
D5
520
090.
240.
240.
24D
56
2009
0.28
0.28
0.28
D0.
310.
310.
310.
310.
310.
310.
31D
57
2009
0.30
0.30
0.30
D0.
340.
340.
340.
340.
340.
340.
34D
58
2009
0.34
0.34
0.34
D5
920
090.
320.
320.
32D
0.67
0.67
0.67
0.67
0.67
0.67
0.67
D5
1020
090.
350.
350.
35D
0.36
0.36
0.36
0.36
0.36
0.36
0.36
D5
1120
090.
290.
290.
29D
0.31
0.31
0.31
0.31
0.31
0.31
0.31
D5
1220
090.
330.
330.
33D
0.30
0.30
0.30
0.30
0.30
0.30
0.30
D5
1320
090.
230.
230.
23D
0.22
0.22
0.22
0.22
0.22
0.22
0.22
D5
1820
090.
900.
900.
90D
519
2009
0.91
0.91
0.91
D5
2020
090.
860.
860.
86D
0.25
0.25
0.25
0.25
S0.
250.
250.
250.
25S
521
2009
0.84
0.84
0.84
D5
2220
095
2320
095
2420
091.
000.
275
2520
090.
280.
270.
090.
090.
09D
526
2009
0.31
0.30
0.60
0.60
0.60
D5
2720
090.
600.
600.
60D
Dat
e
system
system
system
system
21
Rai
nfal
l (in
ches
)H
elm
s Irr
igat
ion
Amou
nts
(inch
es)
D=
driip
irrig
atio
n, L
= L
EPA
irrig
atio
n, S
= s
pray
irrig
atio
n, F
= fu
rrow
wat
er
Hal
fway
@
Bu
ildin
gH
elm
s @
Wel
l 1Fi
eld
2Fi
eld
3
Fiel
d 5
- A
span
s 2-
4
Fiel
d 5
- A
span
s 5-
8
Fiel
d 5
- B
sp
ans
2-4
Fiel
d 5
- B
sp
ans
5-8
Drip
Drip
Pivo
tPi
vot
Pivo
tPi
vot
Cot
ton
Cot
ton
Cot
ton
Cot
ton
Cot
ton
Cot
ton
Cot
ton
Cot
ton
Mo
Da
YrT
1T
2T
3T1
T2T3
T4T5
T6Bo
rder
Base
Base
+50%
Base
-50%
Base
Base
+50%
Base
-50%
Dat
e
system
system
system
system
528
2009
0.06
0.08
61
2009
0.39
0.16
64
2009
0.55
0.32
610
2009
1.02
1.21
614
2009
0.30
0.29
618
2009
0.35
0.50
620
2009
3.60
3.52
623
2009
629
2009
0.47
0.47
630
2009
71
2009
74
2009
75
2009
0.55
0.41
77
2009
0.66
0.66
710
2009
0.10
0.10
0.10
D0.
110.
110.
110.
100.
100.
120.
07D
711
2009
0.14
0.14
0.14
D0.
110.
110.
110.
130.
130.
120.
07D
712
2009
0.10
0.10
0.10
D0.
110.
110.
110.
100.
100.
120.
07D
713
2009
0.10
0.10
0.10
D0.
060.
060.
300.
160.
160.
590.
13D
0.70
0.70
0.70
0.70
S0.
700.
700.
700.
70S
714
2009
0.14
0.14
0.14
D0.
080.
080.
220.
160.
160.
690.
09D
715
2009
0.15
0.15
0.15
D0.
090.
090.
170.
170.
09D
716
2009
0.11
0.20
0.15
0.15
0.15
D0.
090.
090.
170.
170.
09D
717
2009
0.06
0.10
0.30
0.30
0.30
D0.
110.
110.
620.
210.
210.
240.
10D
718
2009
0.35
0.35
0.35
D0.
120.
120.
080.
260.
260.
860.
18D
719
2009
0.27
0.27
0.27
D0.
130.
130.
250.
250.
350.
10D
720
2009
0.23
0.25
0.29
0.29
0.29
D0.
130.
130.
250.
250.
14D
721
2009
0.27
0.27
0.27
D0.
130.
130.
240.
240.
10D
0.20
0.20
0.30
0.10
L0.
200.
200.
300.
10L
722
2009
0.26
0.29
0.30
0.30
0.30
D0.
130.
130.
270.
270.
15D
0.20
0.20
0.30
0.10
L0.
200.
200.
300.
10L
723
2009
0.24
0.24
0.24
D0.
180.
180.
270.
270.
11D
0.20
0.20
0.30
0.10
L0.
200.
200.
300.
10L
724
2009
725
2009
726
2009
0.17
0.12
727
2009
0.37
0.37
0.37
D0.
170.
170.
790.
270.
270.
240.
10D
728
2009
0.28
0.28
0.28
D0.
100.
100.
100.
190.
190.
750.
13D
729
2009
0.37
1.00
0.31
0.31
0.31
D0.
110.
110.
230.
230.
480.
13D
0.20
0.20
0.30
0.10
L0.
200.
200.
300.
10L
730
2009
0.19
0.50
0.29
0.29
0.29
D0.
110.
110.
200.
200.
13D
0.20
0.20
0.30
0.10
L0.
200.
200.
300.
10L
731
2009
81
2009
0.10
0.10
82
2009
83
2009
0.33
0.33
0.33
D0.
080.
080.
590.
160.
160.
200.
06D
0.20
0.20
0.30
0.10
L0.
200.
200.
300.
10L
84
2009
0.30
0.30
0.30
D0.
120.
120.
210.
200.
200.
760.
16D
0.20
0.20
0.30
0.10
L0.
200.
200.
300.
10L
85
2009
0.29
0.29
0.29
D0.
120.
120.
270.
270.
700.
14D
0.20
0.20
0.30
0.10
L0.
200.
200.
300.
10L
86
2009
0.30
0.30
0.30
D0.
130.
130.
250.
250.
14D
0.20
0.20
0.30
0.10
L0.
200.
200.
300.
10L
87
2009
0.31
0.31
0.31
D0.
130.
130.
270.
270.
14D
0.20
0.20
0.30
0.10
L0.
200.
200.
300.
10L
88
2009
0.35
0.35
0.35
D0.
140.
140.
270.
270.
18D
0.20
0.20
0.30
0.10
L0.
200.
200.
300.
10L
22
Rai
nfal
l (in
ches
)H
elm
s Irr
igat
ion
Amou
nts
(inch
es)
D=
driip
irrig
atio
n, L
= L
EPA
irrig
atio
n, S
= s
pray
irrig
atio
n, F
= fu
rrow
wat
er
Hal
fway
@
Bu
ildin
gH
elm
s @
Wel
l 1Fi
eld
2Fi
eld
3
Fiel
d 5
- A
span
s 2-
4
Fiel
d 5
- A
span
s 5-
8
Fiel
d 5
- B
sp
ans
2-4
Fiel
d 5
- B
sp
ans
5-8
Drip
Drip
Pivo
tPi
vot
Pivo
tPi
vot
Cot
ton
Cot
ton
Cot
ton
Cot
ton
Cot
ton
Cot
ton
Cot
ton
Cot
ton
Mo
Da
YrT
1T
2T
3T1
T2T3
T4T5
T6Bo
rder
Base
Base
+50%
Base
-50%
Base
Base
+50%
Base
-50%
Dat
e
system
system
system
system
89
2009
0.25
0.25
0.25
D0.
120.
120.
210.
210.
10D
0.20
0.20
0.30
0.10
L0.
200.
200.
300.
10L
810
2009
0.28
0.28
0.28
D0.
110.
110.
600.
200.
200.
210.
14D
0.20
0.20
0.30
0.10
L0.
200.
200.
300.
10L
811
2009
0.29
0.29
0.29
D0.
110.
110.
210.
260.
260.
430.
14D
0.20
0.20
0.30
0.10
L0.
200.
200.
300.
10L
812
2009
0.28
0.28
0.28
D0.
120.
120.
280.
280.
910.
14D
0.20
0.20
0.30
0.10
L0.
200.
200.
300.
10L
813
2009
0.25
0.25
0.25
D0.
130.
130.
230.
230.
14D
0.20
0.20
0.30
0.10
L0.
200.
200.
300.
10L
814
2009
0.41
0.73
0.13
0.13
0.13
D0.
030.
030.
080.
080.
14D
0.20
0.20
0.30
0.10
L0.
200.
200.
300.
10L
815
2009
0.25
0.25
0.25
D0.
130.
130.
240.
240.
14D
816
2009
0.26
0.26
0.26
D0.
130.
130.
260.
260.
14D
817
2009
0.25
0.25
D0.
170.
170.
550.
260.
260.
240.
14D
0.20
0.20
0.30
0.10
L0.
200.
200.
300.
10L
818
2009
0.23
0.23
D0.
120.
120.
260.
260.
700.
14D
0.20
0.20
0.30
0.10
L0.
200.
200.
300.
10L
819
2009
0.21
0.21
D0.
130.
130.
210.
210.
110.
14D
0.20
0.20
0.30
0.10
L0.
200.
200.
300.
10L
820
2009
0.22
0.22
D0.
130.
130.
260.
260.
14D
0.20
0.20
0.30
0.10
L0.
200.
200.
300.
10L
821
2009
0.27
0.27
D0.
150.
150.
310.
310.
21D
0.20
0.20
0.30
0.10
L0.
200.
200.
300.
10L
822
2009
0.23
0.23
D0.
150.
150.
250.
250.
12D
0.20
0.20
0.30
0.10
L0.
200.
200.
300.
10L
823
2009
0.20
0.20
D0.
120.
120.
210.
210.
09D
0.20
0.20
0.30
0.10
L0.
200.
200.
300.
10L
824
2009
0.19
0.19
D0.
120.
120.
560.
270.
270.
250.
14D
0.20
0.20
0.30
0.10
L0.
200.
200.
300.
10L
825
2009
0.26
0.26
D0.
120.
120.
220.
220.
640.
14D
0.20
0.20
0.30
0.10
L0.
200.
200.
300.
10L
826
2009
0.24
0.24
D0.
130.
130.
260.
260.
140.
14D
0.20
0.20
0.30
0.10
L0.
200.
200.
300.
10L
827
2009
0.25
0.25
D0.
130.
130.
270.
270.
14D
0.20
0.20
0.30
0.10
L0.
200.
200.
300.
10L
828
2009
0.25
0.25
D0.
130.
130.
310.
310.
15D
0.20
0.20
0.30
0.10
L0.
200.
200.
300.
10L
829
2009
0.23
0.23
D0.
130.
130.
250.
250.
13D
0.20
0.20
0.30
0.10
L0.
200.
200.
300.
10L
830
2009
0.23
0.23
D0.
130.
130.
250.
250.
14D
831
2009
0.07
D0.
100.
100.
320.
140.
140.
360.
08D
0.20
0.20
0.30
0.10
L0.
200.
200.
300.
10L
91
2009
0.14
D0.
060.
060.
180.
110.
110.
390.
06D
0.20
0.20
0.30
0.10
L0.
200.
200.
300.
10L
92
2009
0.20
D0.
030.
030.
190.
060.
060.
200.
03D
0.20
0.20
0.30
0.10
L0.
200.
200.
300.
10L
93
2009
0.43
0.60
0.16
D0.
030.
030.
060.
060.
03D
94
2009
95
2009
96
2009
97
2009
0.14
D9
820
090.
15D
99
2009
0.16
D9
1020
090.
14D
911
2009
912
2009
0.27
0.19
913
2009
0.08
0.05
922
2009
0.23
0.23
Pre
& At
Pla
nt12
.01
12.0
112
.01
5.89
5.89
5.89
5.89
5.89
5.89
3.38
2.75
2.75
2.75
2.75
2.75
2.75
2.75
2.75
Seas
onal
8.02
11.2
812
.44
5.75
5.75
5.85
10.7
710
.77
10.8
06.
047.
307.
3010
.60
4.00
7.30
7.30
10.6
04.
00
15.5
115
.57
20.0
323
.29
24.4
511
.64
11.6
411
.74
16.6
616
.66
16.6
99.
4210
.05
10.0
513
.35
6.75
10.0
510
.05
13.3
56.
75TO
TALS
23
Rai
nfal
l (in
ches
)
Hal
fway
@
Bu
ildin
gH
elm
s @
Wel
l 1
Mo
Da
Yr2
820
090.
760.
803
2420
093
2520
093
3020
093
3120
094
120
094
220
090.
390.
464
720
094
820
094
920
094
1020
094
1120
090.
700.
864
1220
094
1320
094
1420
094
1520
094
1620
091.
070.
584
1720
094
1820
094
2620
094
2720
094
2820
090.
140.
055
320
095
420
095
520
095
620
095
720
095
820
095
920
095
1020
095
1120
095
1220
095
1320
095
1820
095
1920
095
2020
095
2120
095
2220
095
2320
095
2420
091.
000.
275
2520
090.
280.
275
2620
090.
310.
305
2720
09
Dat
e
Hel
ms
Irrig
atio
n Am
ount
s (in
ches
)
L =
LEPA
irrig
atio
n, S
= s
pray
irrig
atio
nH
elm
s Irr
igat
ion
Amou
nts
(inch
es)
L
= LE
P
Hel
ms
Irrig
atio
n Am
ount
s (in
ches
)
L =
LEPA
irrig
atio
n, S
= s
pray
irrig
atio
n
Fiel
d 5
- C
sp
ans
2-4
Fiel
d 5
- C
sp
ans
5-8
Fiel
d 5
- D
spa
ns
2-4
Fiel
d 5
- D
spa
ns
5-8
Fiel
d 5
- E
sp
ans
2-4
Fiel
d 5
- E
sp
ans
5-8
Fiel
d 5
- F
sp
ans
2-4
Fiel
d 5
- F
sp
ans
5-8
Fiel
d 6
-A,
C,F
Fiel
d 6
- B,
D,E
Fiel
d 6
- D
RY
Fiel
d 6
- G
Fiel
d 6
- H
Pivo
tPi
vot
Pivo
tPi
vot
Pivo
tPi
vot
Pivo
tPi
vot
Drip
Drip
Drip
Drip
Cot
ton
Cot
ton
Sorg
hum
Sorg
hum
Cot
ton
Cot
ton
Cot
ton
Cot
ton
Cot
ton
Cot
ton
Cot
ton
Cot
ton
Base
Base
+50%
Base
-50%
Base
Base
+50%
Base
-50%
Base
Base
+50%
Base
-50%
Base
Base
+50%
Base
-50%
1.0
B.I.
0.5
B.I.
0.33
0.33
0.33
0.40
0.40
0.26
0.26
0.26
0.48
0.48
0.67
0.67
0.67
0.86
0.86
0.30
0.30
0.30
0.34
0.34
0.31
0.31
0.31
0.51
0.51
0.31
0.31
0.31
0.35
0.35
0.29
0.29
0.29
0.47
0.47
0.27
0.27
0.27
0.28
0.28
0.30
0.30
0.30
0.49
0.49
0.75
0.75
0.75
0.75
S0.
750.
750.
750.
75S
0.75
0.75
0.75
0.75
S0.
280.
280.
280.
310.
310.
310.
310.
310.
500.
50
0.10
0.10
0.10
0.10
S0.
750.
750.
750.
75S
0.90
0.90
0.90
0.90
S0.
750.
750.
750.
75S
0.75
0.75
0.75
0.75
S1.
001.
001.
001.
00S
0.85
0.85
0.85
0.85
S1.
001.
001.
001.
00S
0.83
0.83
0.83
0.83
S0.
830.
830.
830.
83S
0.31
0.31
0.31
0.37
0.37
0.28
0.28
0.28
0.45
0.45
0.21
0.21
0.21
0.15
0.15
0.30
0.30
0.30
0.49
0.49
0.30
0.30
0.30
0.35
0.35
0.29
0.29
0.29
0.47
0.47
0.30
0.30
0.30
0.35
0.35
0.28
0.28
0.28
0.46
0.46
0.30
0.30
0.30
0.34
0.34
0.27
0.27
0.27
0.31
0.31
0.50
0.50
0.50
0.50
S0.
250.
250.
250.
25S
0.25
0.25
0.25
0.25
S0.
250.
250.
250.
25S
0.46
0.46
0.47
0.47
0.50
0.50
0.50
0.50
system
system
system
system
24
Rai
nfal
l (in
ches
)
Hal
fway
@
Bu
ildin
gH
elm
s @
Wel
l 1
Mo
Da
Yr
Dat
e
528
2009
0.06
0.08
61
2009
0.39
0.16
64
2009
0.55
0.32
610
2009
1.02
1.21
614
2009
0.30
0.29
618
2009
0.35
0.50
620
2009
3.60
3.52
623
2009
629
2009
0.47
0.47
630
2009
71
2009
74
2009
75
2009
0.55
0.41
77
2009
0.66
0.66
710
2009
711
2009
712
2009
713
2009
714
2009
715
2009
716
2009
0.11
0.20
717
2009
0.06
0.10
718
2009
719
2009
720
2009
0.23
0.25
721
2009
722
2009
0.26
0.29
723
2009
724
2009
725
2009
726
2009
0.17
0.12
727
2009
728
2009
729
2009
0.37
1.00
730
2009
0.19
0.50
731
2009
81
2009
0.10
0.10
82
2009
83
2009
84
2009
85
2009
86
2009
87
2009
88
2009
Hel
ms
Irrig
atio
n Am
ount
s (in
ches
)
L =
LEPA
irrig
atio
n, S
= s
pray
irrig
atio
nH
elm
s Irr
igat
ion
Amou
nts
(inch
es)
L
= LE
P
Hel
ms
Irrig
atio
n Am
ount
s (in
ches
)
L =
LEPA
irrig
atio
n, S
= s
pray
irrig
atio
n
Fiel
d 5
- C
sp
ans
2-4
Fiel
d 5
- C
sp
ans
5-8
Fiel
d 5
- D
spa
ns
2-4
Fiel
d 5
- D
spa
ns
5-8
Fiel
d 5
- E
sp
ans
2-4
Fiel
d 5
- E
sp
ans
5-8
Fiel
d 5
- F
sp
ans
2-4
Fiel
d 5
- F
sp
ans
5-8
Fiel
d 6
-A,
C,F
Fiel
d 6
- B,
D,E
Fiel
d 6
- D
RY
Fiel
d 6
- G
Fiel
d 6
- H
Pivo
tPi
vot
Pivo
tPi
vot
Pivo
tPi
vot
Pivo
tPi
vot
Drip
Drip
Drip
Drip
Cot
ton
Cot
ton
Sorg
hum
Sorg
hum
Cot
ton
Cot
ton
Cot
ton
Cot
ton
Cot
ton
Cot
ton
Cot
ton
Cot
ton
Base
Base
+50%
Base
-50%
Base
Base
+50%
Base
-50%
Base
Base
+50%
Base
-50%
Base
Base
+50%
Base
-50%
1.0
B.I.
0.5
B.I.
system
system
system
system
1.00
1.00
1.00
1.00
S
0.30
0.30
0.30
0.30
S0.
280.
000.
000.
380.
130.
200.
370.
000.
280.
010.
000.
38
0.15
0.22
0.35
0.14
0.28
0.00
0.00
0.38
0.12
0.19
0.37
0.00
1.00
1.00
1.00
1.00
S0.
700.
700.
700.
70S
0.70
0.70
0.70
0.70
S0.
700.
700.
700.
70S
0.25
0.01
0.00
0.35
0.13
0.20
0.43
0.00
0.28
0.00
0.00
0.47
0.13
0.20
0.44
0.00
0.70
0.70
0.70
0.70
S0.
320.
050.
000.
490.
210.
230.
440.
030.
300.
030.
000.
440.
180.
210.
450.
000.
200.
200.
300.
10L
0.20
0.20
0.30
0.10
L0.
200.
200.
300.
10L
0.32
0.05
0.00
0.56
0.50
0.50
0.75
0.25
L0.
200.
200.
300.
10L
0.20
0.20
0.30
0.10
L0.
200.
200.
300.
10L
0.16
0.20
0.37
0.12
0.20
0.20
0.30
0.10
L0.
200.
200.
300.
10L
0.20
0.20
0.30
0.10
L0.
200.
200.
300.
10L
0.25
0.02
0.00
0.59
0.18
0.12
0.00
0.59
0.13
0.19
0.37
0.10
0.24
0.02
0.00
0.58
0.16
0.17
0.37
0.12
0.20
0.20
0.30
0.10
L0.
200.
200.
300.
10L
0.20
0.20
0.30
0.10
L0.
200.
200.
300.
10L
0.20
0.20
0.30
0.10
L0.
200.
200.
300.
10L
0.20
0.20
0.30
0.10
L0.
200.
200.
300.
10L
0.20
0.20
0.30
0.10
L0.
200.
200.
300.
10L
0.20
0.20
0.30
0.10
L0.
200.
200.
300.
10L
0.17
0.26
0.42
0.07
0.20
0.20
0.30
0.10
L0.
200.
200.
300.
10L
0.20
0.20
0.30
0.10
L0.
200.
200.
300.
10L
0.33
0.07
0.00
0.57
0.20
0.20
0.30
0.10
L0.
200.
200.
300.
10L
0.20
0.20
0.30
0.10
L0.
200.
200.
300.
10L
0.20
0.21
0.47
0.16
0.20
0.20
0.30
0.10
L0.
200.
200.
300.
10L
0.20
0.20
0.30
0.10
L0.
200.
200.
300.
10L
0.35
0.07
0.00
0.60
0.20
0.20
0.30
0.10
L0.
200.
200.
300.
10L
0.20
0.20
0.30
0.10
L0.
200.
200.
300.
10L
0.19
0.22
0.47
0.12
0.20
0.20
0.30
0.10
L0.
200.
200.
300.
10L
0.20
0.20
0.30
0.10
L0.
200.
200.
300.
10L
0.37
0.06
0.04
0.72
25
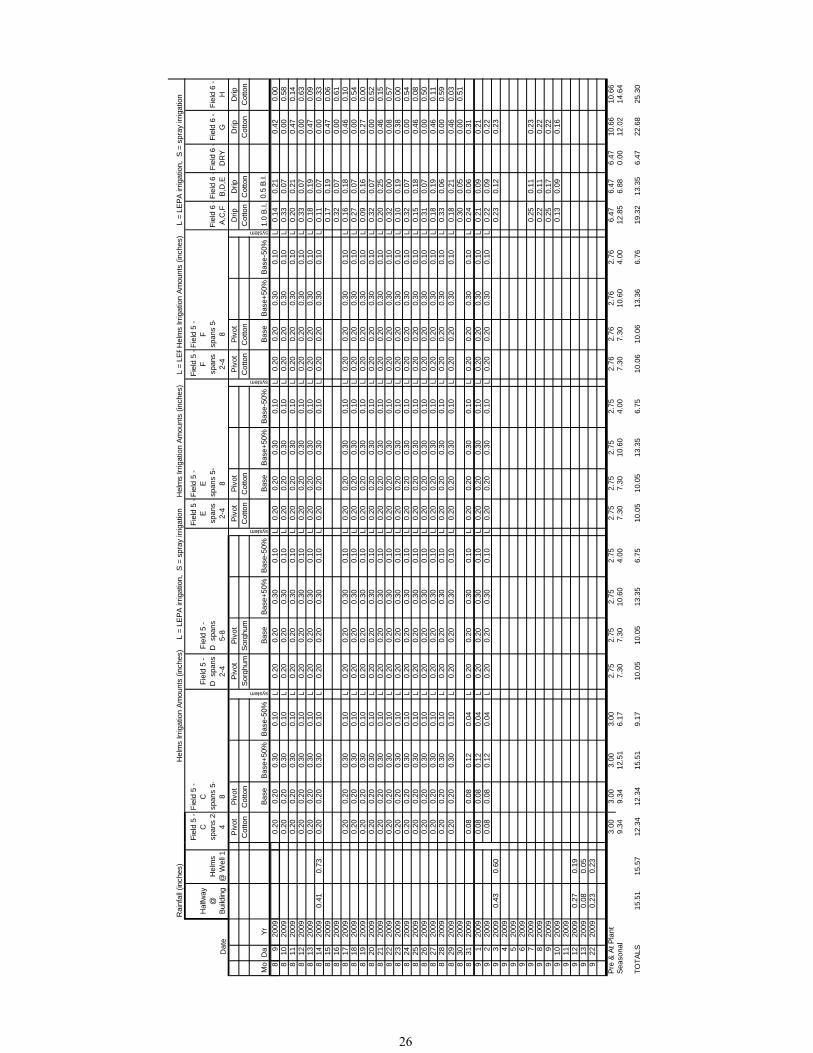
Rai
nfal
l (in
ches
)
Hal
fway
@
Bu
ildin
gH
elm
s @
Wel
l 1
Mo
Da
Yr
Dat
e
89
2009
810
2009
811
2009
812
2009
813
2009
814
2009
0.41
0.73
815
2009
816
2009
817
2009
818
2009
819
2009
820
2009
821
2009
822
2009
823
2009
824
2009
825
2009
826
2009
827
2009
828
2009
829
2009
830
2009
831
2009
91
2009
92
2009
93
2009
0.43
0.60
94
2009
95
2009
96
2009
97
2009
98
2009
99
2009
910
2009
911
2009
912
2009
0.27
0.19
913
2009
0.08
0.05
922
2009
0.23
0.23
Pre
& At
Pla
ntSe
ason
al
15.5
115
.57
TOTA
LS
Hel
ms
Irrig
atio
n Am
ount
s (in
ches
)
L =
LEPA
irrig
atio
n, S
= s
pray
irrig
atio
nH
elm
s Irr
igat
ion
Amou
nts
(inch
es)
L
= LE
P
Hel
ms
Irrig
atio
n Am
ount
s (in
ches
)
L =
LEPA
irrig
atio
n, S
= s
pray
irrig
atio
n
Fiel
d 5
- C
sp
ans
2-4
Fiel
d 5
- C
sp
ans
5-8
Fiel
d 5
- D
spa
ns
2-4
Fiel
d 5
- D
spa
ns
5-8
Fiel
d 5
- E
sp
ans
2-4
Fiel
d 5
- E
sp
ans
5-8
Fiel
d 5
- F
sp
ans
2-4
Fiel
d 5
- F
sp
ans
5-8
Fiel
d 6
-A,
C,F
Fiel
d 6
- B,
D,E
Fiel
d 6
- D
RY
Fiel
d 6
- G
Fiel
d 6
- H
Pivo
tPi
vot
Pivo
tPi
vot
Pivo
tPi
vot
Pivo
tPi
vot
Drip
Drip
Drip
Drip
Cot
ton
Cot
ton
Sorg
hum
Sorg
hum
Cot
ton
Cot
ton
Cot
ton
Cot
ton
Cot
ton
Cot
ton
Cot
ton
Cot
ton
Base
Base
+50%
Base
-50%
Base
Base
+50%
Base
-50%
Base
Base
+50%
Base
-50%
Base
Base
+50%
Base
-50%
1.0
B.I.
0.5
B.I.
system
system
system
system
0.20
0.20
0.30
0.10
L0.
200.
200.
300.
10L
0.20
0.20
0.30
0.10
L0.
200.
200.
300.
10L
0.14
0.21
0.42
0.00
0.20
0.20
0.30
0.10
L0.
200.
200.
300.
10L
0.20
0.20
0.30
0.10
L0.
200.
200.
300.
10L
0.33
0.07
0.00
0.58
0.20
0.20
0.30
0.10
L0.
200.
200.
300.
10L
0.20
0.20
0.30
0.10
L0.
200.
200.
300.
10L
0.20
0.21
0.47
0.14
0.20
0.20
0.30
0.10
L0.
200.
200.
300.
10L
0.20
0.20
0.30
0.10
L0.
200.
200.
300.
10L
0.33
0.07
0.00
0.63
0.20
0.20
0.30
0.10
L0.
200.
200.
300.
10L
0.20
0.20
0.30
0.10
L0.
200.
200.
300.
10L
0.18
0.19
0.47
0.09
0.20
0.20
0.30
0.10
L0.
200.
200.
300.
10L
0.20
0.20
0.30
0.10
L0.
200.
200.
300.
10L
0.11
0.07
0.00
0.33
0.17
0.19
0.47
0.06
0.32
0.07
0.00
0.61
0.20
0.20
0.30
0.10
L0.
200.
200.
300.
10L
0.20
0.20
0.30
0.10
L0.
200.
200.
300.
10L
0.16
0.18
0.46
0.10
0.20
0.20
0.30
0.10
L0.
200.
200.
300.
10L
0.20
0.20
0.30
0.10
L0.
200.
200.
300.
10L
0.27
0.07
0.00
0.54
0.20
0.20
0.30
0.10
L0.
200.
200.
300.
10L
0.20
0.20
0.30
0.10
L0.
200.
200.
300.
10L
0.09
0.16
0.27
0.00
0.20
0.20
0.30
0.10
L0.
200.
200.
300.
10L
0.20
0.20
0.30
0.10
L0.
200.
200.
300.
10L
0.32
0.07
0.00
0.52
0.20
0.20
0.30
0.10
L0.
200.
200.
300.
10L
0.20
0.20
0.30
0.10
L0.
200.
200.
300.
10L
0.20
0.25
0.46
0.15
0.20
0.20
0.30
0.10
L0.
200.
200.
300.
10L
0.20
0.20
0.30
0.10
L0.
200.
200.
300.
10L
0.32
0.00
0.08
0.57
0.20
0.20
0.30
0.10
L0.
200.
200.
300.
10L
0.20
0.20
0.30
0.10
L0.
200.
200.
300.
10L
0.10
0.19
0.38
0.00
0.20
0.20
0.30
0.10
L0.
200.
200.
300.
10L
0.20
0.20
0.30
0.10
L0.
200.
200.
300.
10L
0.32
0.07
0.00
0.54
0.20
0.20
0.30
0.10
L0.
200.
200.
300.
10L
0.20
0.20
0.30
0.10
L0.
200.
200.
300.
10L
0.15
0.18
0.46
0.08
0.20
0.20
0.30
0.10
L0.
200.
200.
300.
10L
0.20
0.20
0.30
0.10
L0.
200.
200.
300.
10L
0.31
0.07
0.00
0.50
0.20
0.20
0.30
0.10
L0.
200.
200.
300.
10L
0.20
0.20
0.30
0.10
L0.
200.
200.
300.
10L
0.18
0.19
0.46
0.11
0.20
0.20
0.30
0.10
L0.
200.
200.
300.
10L
0.20
0.20
0.30
0.10
L0.
200.
200.
300.
10L
0.33
0.06
0.00
0.59
0.20
0.20
0.30
0.10
L0.
200.
200.
300.
10L
0.20
0.20
0.30
0.10
L0.
200.
200.
300.
10L
0.18
0.21
0.46
0.03
0.30
0.05
0.00
0.51
0.08
0.08
0.12
0.04
L0.
200.
200.
300.
10L
0.20
0.20
0.30
0.10
L0.
200.
200.
300.
10L
0.24
0.06
0.31
0.08
0.08
0.12
0.04
L0.
200.
200.
300.
10L
0.20
0.20
0.30
0.10
L0.
200.
200.
300.
10L
0.21
0.09
0.21
0.08
0.08
0.12
0.04
L0.
200.
200.
300.
10L
0.20
0.20
0.30
0.10
L0.
200.
200.
300.
10L
0.22
0.09
0.22
0.23
0.12
0.23
0.25
0.11
0.23
0.22
0.11
0.22
0.25
0.17
0.22
0.13
0.09
0.16
3.00
3.00
3.00
3.00
2.75
2.75
2.75
2.75
2.75
2.75
2.75
2.75
2.76
2.76
2.76
2.76
6.47
6.47
6.47
10.6
610
.66
9.34
9.34
12.5
16.
177.
307.
3010
.60
4.00
7.30
7.30
10.6
04.
007.
307.
3010
.60
4.00
12.8
56.
880.
0012
.02
14.6
4
12.3
412
.34
15.5
19.
1710
.05
10.0
513
.35
6.75
10.0
510
.05
13.3
56.
7510
.06
10.0
613
.36
6.76
19.3
213
.35
6.47
22.6
825
.30
26
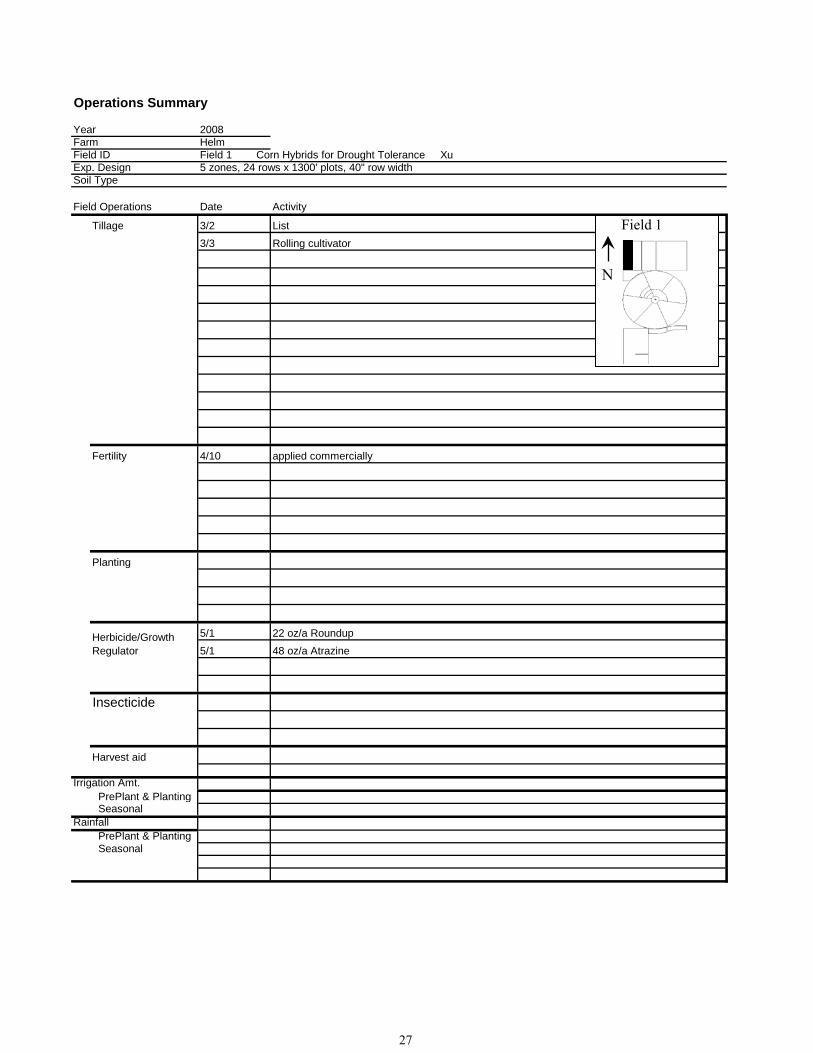
Operations Summary
Year 2008Farm HelmField ID Field 1 Corn Hybrids for Drought Tolerance XuExp. Design 5 zones, 24 rows x 1300' plots, 40" row width Soil Type
Field Operations Date Activity
Tillage 3/2 List3/3 Rolling cultivator
Fertility 4/10 applied commercially
Planting
5/1 22 oz/a Roundup 5/1 48 oz/a Atrazine
Insecticide
Harvest aid
Irrigation Amt. PrePlant & Planting Seasonal
Rainfall PrePlant & Planting Seasonal
Herbicide/Growth Regulator
Field 1
N
27
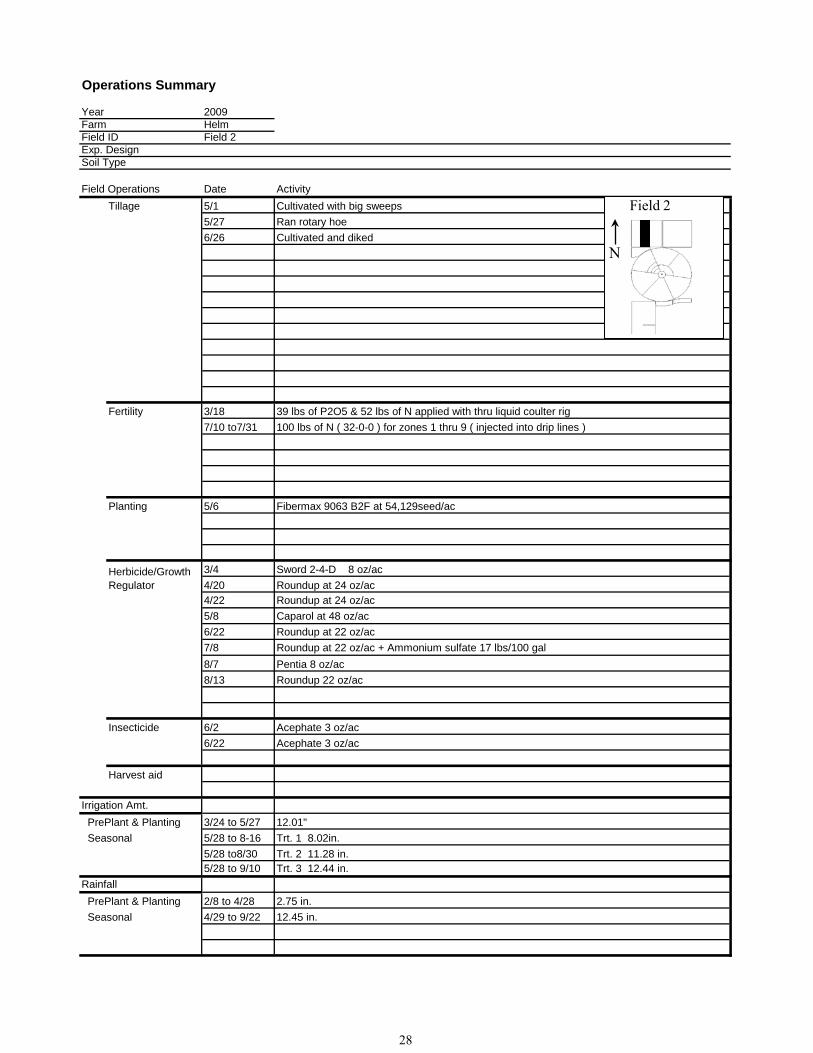
Operations Summary
Year 2009Farm HelmField ID Field 2 Exp. DesignSoil Type
Field Operations Date ActivityTillage 5/1 Cultivated with big sweeps
5/27 Ran rotary hoe6/26 Cultivated and diked
Fertility 3/18 39 lbs of P2O5 & 52 lbs of N applied with thru liquid coulter rig7/10 to7/31 100 lbs of N ( 32-0-0 ) for zones 1 thru 9 ( injected into drip lines )
Planting 5/6 Fibermax 9063 B2F at 54,129seed/ac
3/4 Sword 2-4-D 8 oz/ac4/20 Roundup at 24 oz/ac4/22 Roundup at 24 oz/ac5/8 Caparol at 48 oz/ac6/22 Roundup at 22 oz/ac 7/8 Roundup at 22 oz/ac + Ammonium sulfate 17 lbs/100 gal8/7 Pentia 8 oz/ac8/13 Roundup 22 oz/ac
Insecticide 6/2 Acephate 3 oz/ac6/22 Acephate 3 oz/ac
Harvest aid
Irrigation Amt. PrePlant & Planting 3/24 to 5/27 12.01" Seasonal 5/28 to 8-16 Trt. 1 8.02in.
5/28 to8/30 Trt. 2 11.28 in.5/28 to 9/10 Trt. 3 12.44 in.
Rainfall PrePlant & Planting 2/8 to 4/28 2.75 in. Seasonal 4/29 to 9/22 12.45 in.
Herbicide/Growth Regulator
Field 2
N
28
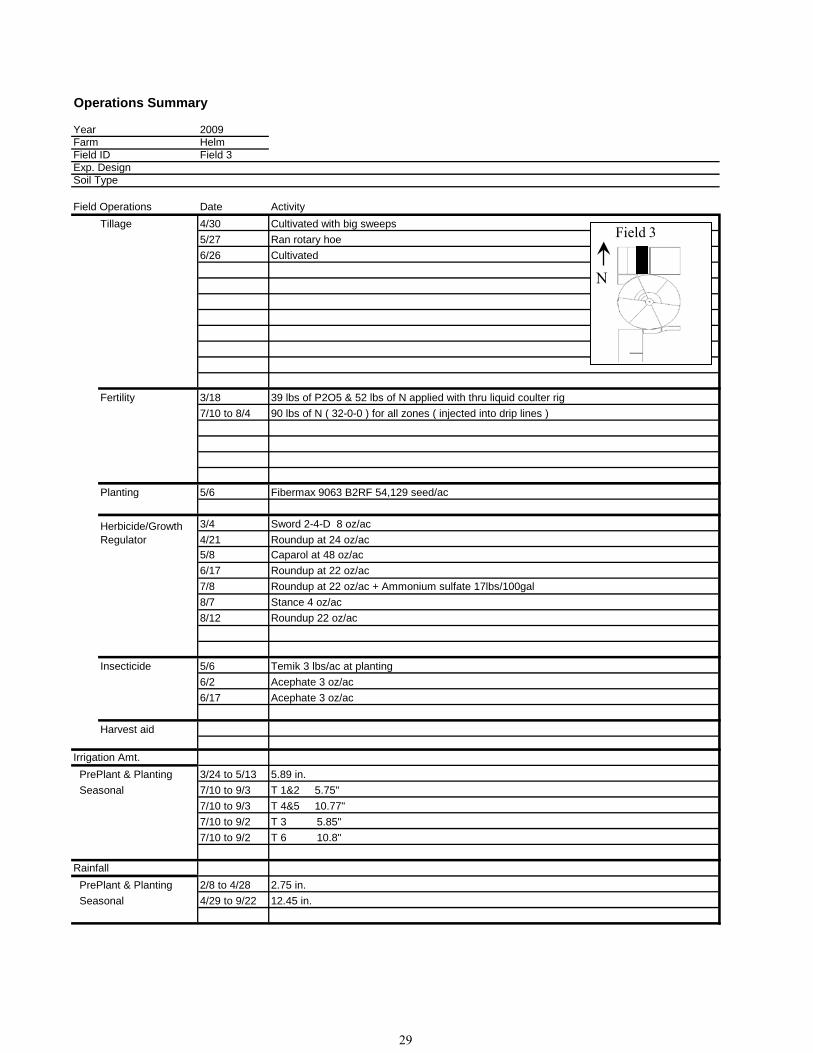
Operations Summary
Year 2009Farm HelmField ID Field 3 Exp. DesignSoil Type
Field Operations Date ActivityTillage 4/30 Cultivated with big sweeps
5/27 Ran rotary hoe6/26 Cultivated
Fertility 3/18 39 lbs of P2O5 & 52 lbs of N applied with thru liquid coulter rig7/10 to 8/4 90 lbs of N ( 32-0-0 ) for all zones ( injected into drip lines )
Planting 5/6 Fibermax 9063 B2RF 54,129 seed/ac
3/4 Sword 2-4-D 8 oz/ac4/21 Roundup at 24 oz/ac5/8 Caparol at 48 oz/ac6/17 Roundup at 22 oz/ac 7/8 Roundup at 22 oz/ac + Ammonium sulfate 17lbs/100gal8/7 Stance 4 oz/ac8/12 Roundup 22 oz/ac
Insecticide 5/6 Temik 3 lbs/ac at planting6/2 Acephate 3 oz/ac6/17 Acephate 3 oz/ac
Harvest aid
Irrigation Amt. PrePlant & Planting 3/24 to 5/13 5.89 in. Seasonal 7/10 to 9/3 T 1&2 5.75"
7/10 to 9/3 T 4&5 10.77"7/10 to 9/2 T 3 5.85"7/10 to 9/2 T 6 10.8"
Rainfall PrePlant & Planting 2/8 to 4/28 2.75 in. Seasonal 4/29 to 9/22 12.45 in.
Herbicide/Growth Regulator
Field 3
N
29
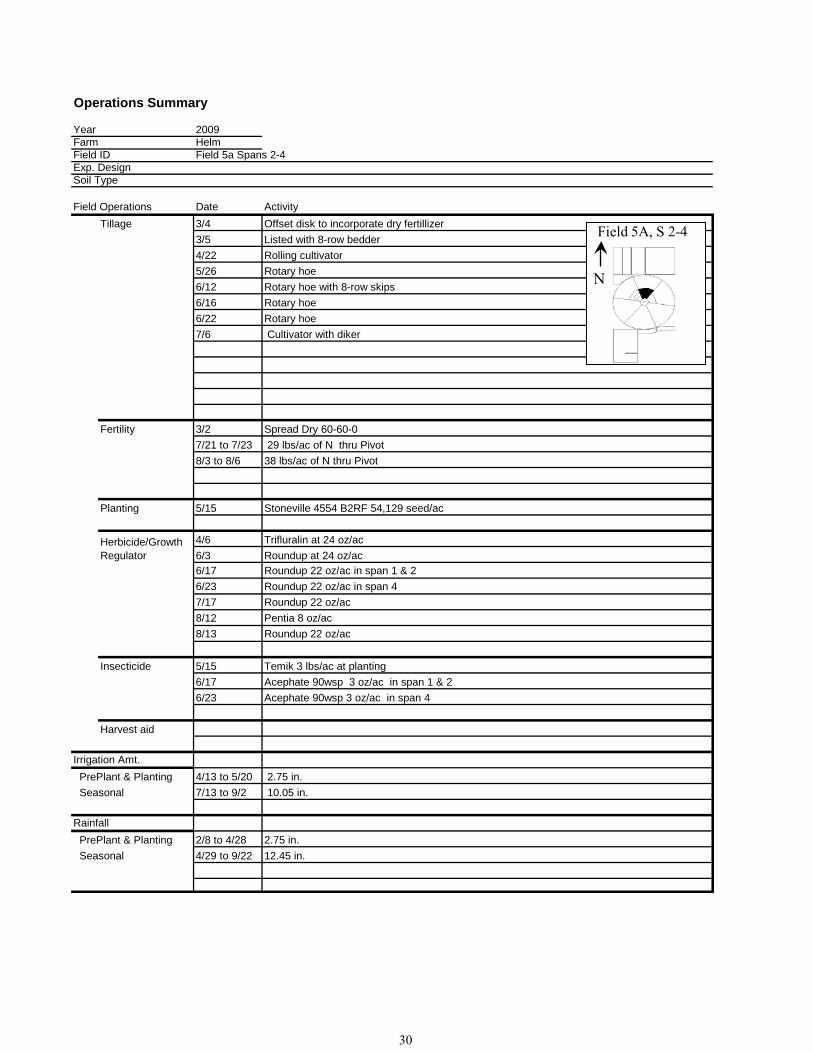
Operations Summary
Year 2009Farm HelmField ID Field 5a Spans 2-4 Exp. DesignSoil Type
Field Operations Date ActivityTillage 3/4 Offset disk to incorporate dry fertillizer
3/5 Listed with 8-row bedder4/22 Rolling cultivator5/26 Rotary hoe6/12 Rotary hoe with 8-row skips6/16 Rotary hoe6/22 Rotary hoe7/6 Cultivator with diker
Fertility 3/2 Spread Dry 60-60-07/21 to 7/23 29 lbs/ac of N thru Pivot 8/3 to 8/6 38 lbs/ac of N thru Pivot
Planting 5/15 Stoneville 4554 B2RF 54,129 seed/ac
4/6 Trifluralin at 24 oz/ac 6/3 Roundup at 24 oz/ac6/17 Roundup 22 oz/ac in span 1 & 26/23 Roundup 22 oz/ac in span 47/17 Roundup 22 oz/ac 8/12 Pentia 8 oz/ac8/13 Roundup 22 oz/ac
Insecticide 5/15 Temik 3 lbs/ac at planting6/17 Acephate 90wsp 3 oz/ac in span 1 & 26/23 Acephate 90wsp 3 oz/ac in span 4
Harvest aid
Irrigation Amt. PrePlant & Planting 4/13 to 5/20 2.75 in. Seasonal 7/13 to 9/2 10.05 in.
Rainfall PrePlant & Planting 2/8 to 4/28 2.75 in. Seasonal 4/29 to 9/22 12.45 in.
Herbicide/Growth Regulator
Field 5A, S 2-4
N
30
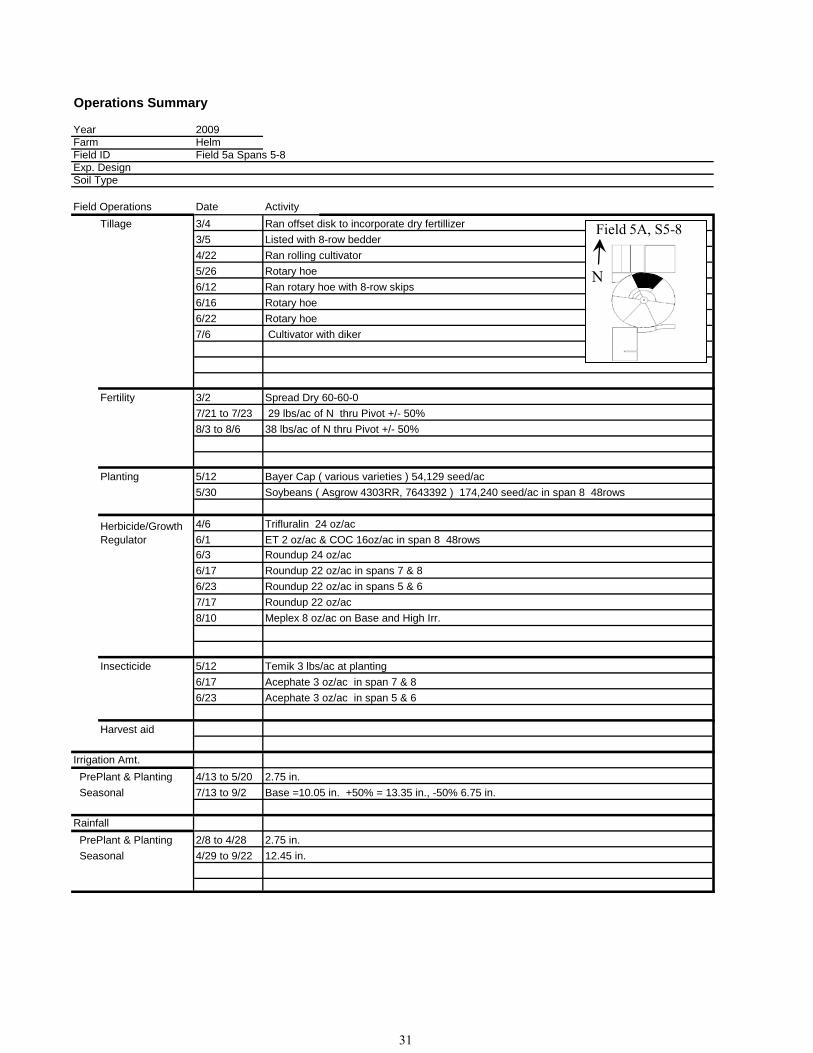
Operations Summary
Year 2009Farm HelmField ID Field 5a Spans 5-8 Exp. DesignSoil Type
Field Operations Date ActivityTillage 3/4 Ran offset disk to incorporate dry fertillizer
3/5 Listed with 8-row bedder4/22 Ran rolling cultivator5/26 Rotary hoe6/12 Ran rotary hoe with 8-row skips6/16 Rotary hoe6/22 Rotary hoe7/6 Cultivator with diker
Fertility 3/2 Spread Dry 60-60-07/21 to 7/23 29 lbs/ac of N thru Pivot +/- 50% 8/3 to 8/6 38 lbs/ac of N thru Pivot +/- 50%
Planting 5/12 Bayer Cap ( various varieties ) 54,129 seed/ac5/30 Soybeans ( Asgrow 4303RR, 7643392 ) 174,240 seed/ac in span 8 48rows
4/6 Trifluralin 24 oz/ac 6/1 ET 2 oz/ac & COC 16oz/ac in span 8 48rows6/3 Roundup 24 oz/ac6/17 Roundup 22 oz/ac in spans 7 & 8 6/23 Roundup 22 oz/ac in spans 5 & 6 7/17 Roundup 22 oz/ac8/10 Meplex 8 oz/ac on Base and High Irr.
Insecticide 5/12 Temik 3 lbs/ac at planting6/17 Acephate 3 oz/ac in span 7 & 86/23 Acephate 3 oz/ac in span 5 & 6
Harvest aid
Irrigation Amt. PrePlant & Planting 4/13 to 5/20 2.75 in. Seasonal 7/13 to 9/2 Base =10.05 in. +50% = 13.35 in., -50% 6.75 in.
Rainfall PrePlant & Planting 2/8 to 4/28 2.75 in. Seasonal 4/29 to 9/22 12.45 in.
Herbicide/Growth Regulator
Field 5A, S5-8
N
31
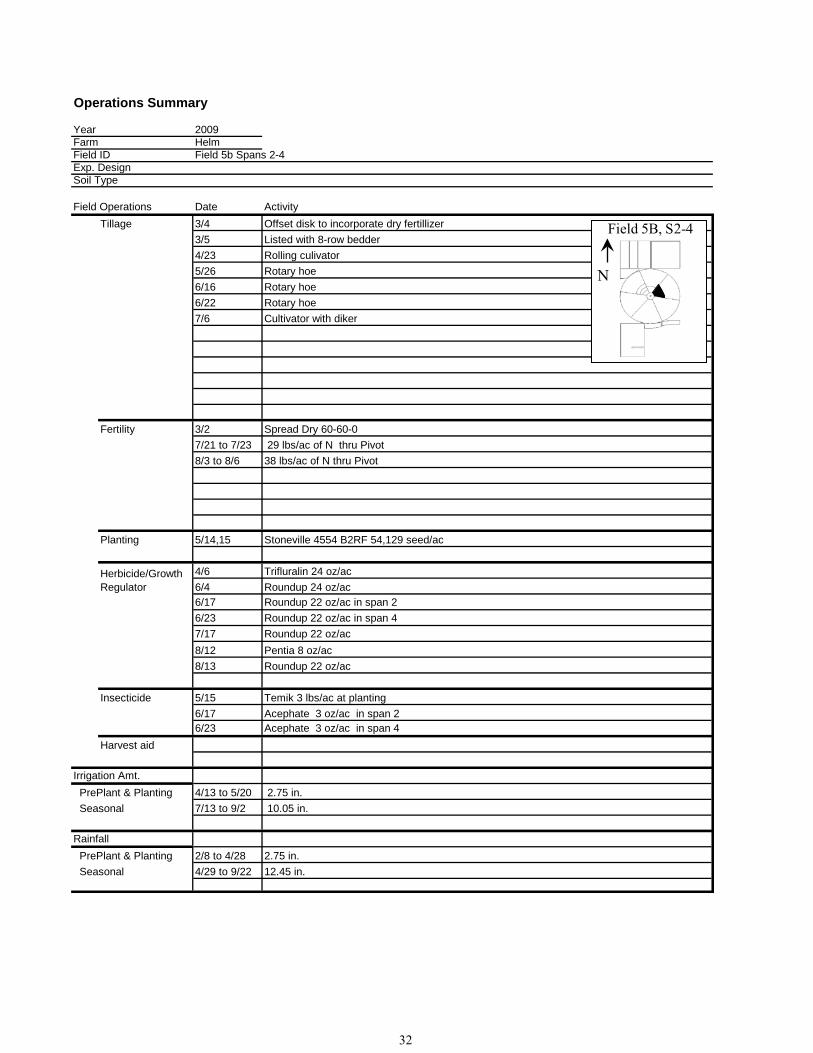
Operations Summary
Year 2009Farm HelmField ID Field 5b Spans 2-4 Exp. DesignSoil Type
Field Operations Date ActivityTillage 3/4 Offset disk to incorporate dry fertillizer
3/5 Listed with 8-row bedder4/23 Rolling culivator5/26 Rotary hoe6/16 Rotary hoe6/22 Rotary hoe7/6 Cultivator with diker
Fertility 3/2 Spread Dry 60-60-07/21 to 7/23 29 lbs/ac of N thru Pivot 8/3 to 8/6 38 lbs/ac of N thru Pivot
Planting 5/14,15 Stoneville 4554 B2RF 54,129 seed/ac
4/6 Trifluralin 24 oz/ac 6/4 Roundup 24 oz/ac 6/17 Roundup 22 oz/ac in span 2 6/23 Roundup 22 oz/ac in span 47/17 Roundup 22 oz/ac8/12 Pentia 8 oz/ac8/13 Roundup 22 oz/ac
Insecticide 5/15 Temik 3 lbs/ac at planting6/17 Acephate 3 oz/ac in span 26/23 Acephate 3 oz/ac in span 4
Harvest aid
Irrigation Amt. PrePlant & Planting 4/13 to 5/20 2.75 in. Seasonal 7/13 to 9/2 10.05 in.
Rainfall PrePlant & Planting 2/8 to 4/28 2.75 in. Seasonal 4/29 to 9/22 12.45 in.
Herbicide/Growth Regulator
Field 5B, S2-4
N
32
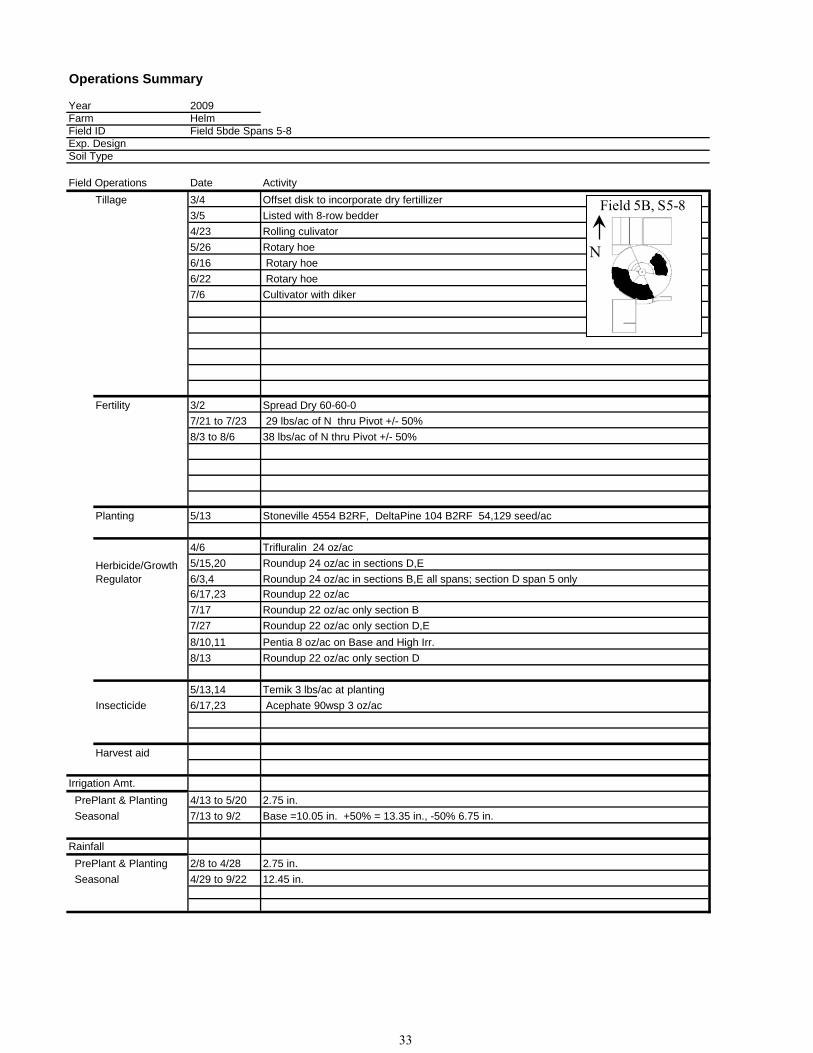
Operations Summary
Year 2009Farm HelmField ID Field 5bde Spans 5-8Exp. DesignSoil Type
Field Operations Date ActivityTillage 3/4 Offset disk to incorporate dry fertillizer
3/5 Listed with 8-row bedder4/23 Rolling culivator5/26 Rotary hoe6/16 Rotary hoe6/22 Rotary hoe7/6 Cultivator with diker
Fertility 3/2 Spread Dry 60-60-07/21 to 7/23 29 lbs/ac of N thru Pivot +/- 50% 8/3 to 8/6 38 lbs/ac of N thru Pivot +/- 50%
Planting 5/13 Stoneville 4554 B2RF, DeltaPine 104 B2RF 54,129 seed/ac
4/6 Trifluralin 24 oz/ac 5/15,20 Roundup 24 oz/ac in sections D,E6/3,4 Roundup 24 oz/ac in sections B,E all spans; section D span 5 only6/17,23 Roundup 22 oz/ac 7/17 Roundup 22 oz/ac only section B7/27 Roundup 22 oz/ac only section D,E8/10,11 Pentia 8 oz/ac on Base and High Irr.8/13 Roundup 22 oz/ac only section D
5/13,14 Temik 3 lbs/ac at plantingInsecticide 6/17,23 Acephate 90wsp 3 oz/ac
Harvest aid
Irrigation Amt. PrePlant & Planting 4/13 to 5/20 2.75 in. Seasonal 7/13 to 9/2 Base =10.05 in. +50% = 13.35 in., -50% 6.75 in.
Rainfall PrePlant & Planting 2/8 to 4/28 2.75 in. Seasonal 4/29 to 9/22 12.45 in.
Herbicide/Growth Regulator
N
Field 5B, S5-8
33
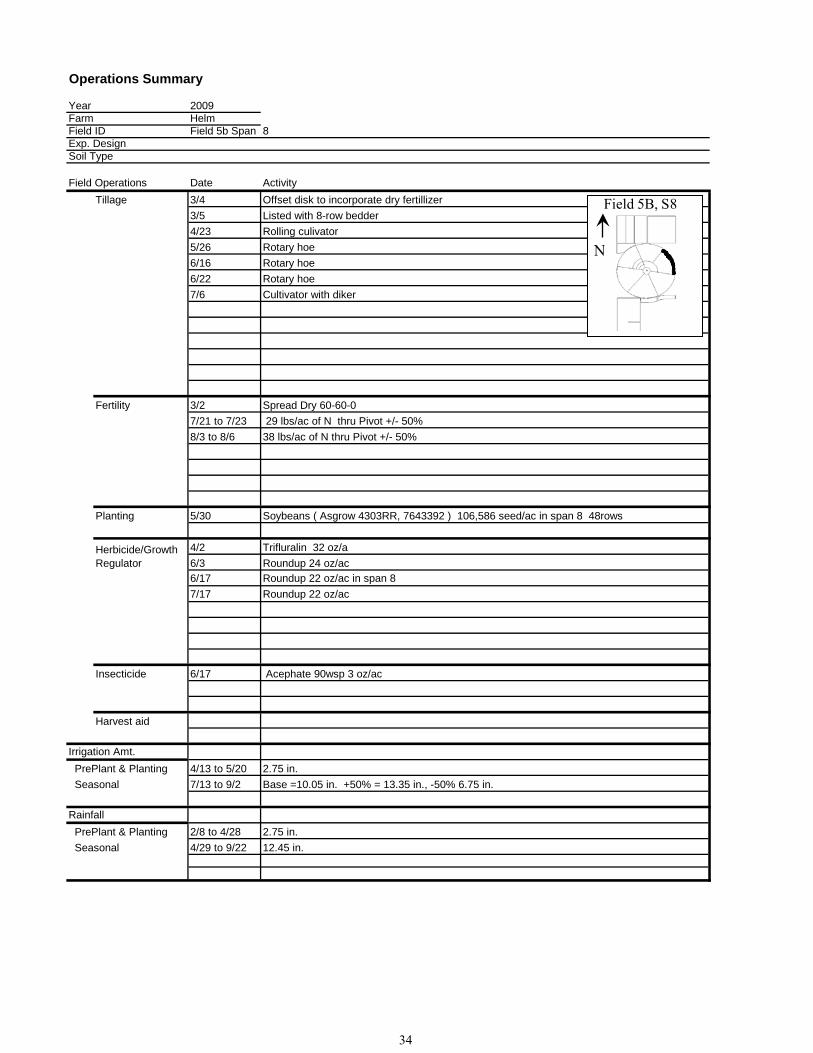
Operations Summary
Year 2009Farm HelmField ID Field 5b Span 8Exp. DesignSoil Type
Field Operations Date ActivityTillage 3/4 Offset disk to incorporate dry fertillizer
3/5 Listed with 8-row bedder4/23 Rolling culivator5/26 Rotary hoe6/16 Rotary hoe6/22 Rotary hoe7/6 Cultivator with diker
Fertility 3/2 Spread Dry 60-60-07/21 to 7/23 29 lbs/ac of N thru Pivot +/- 50% 8/3 to 8/6 38 lbs/ac of N thru Pivot +/- 50%
Planting 5/30 Soybeans ( Asgrow 4303RR, 7643392 ) 106,586 seed/ac in span 8 48rows
4/2 Trifluralin 32 oz/a6/3 Roundup 24 oz/ac6/17 Roundup 22 oz/ac in span 8 7/17 Roundup 22 oz/ac
Insecticide 6/17 Acephate 90wsp 3 oz/ac
Harvest aid
Irrigation Amt. PrePlant & Planting 4/13 to 5/20 2.75 in. Seasonal 7/13 to 9/2 Base =10.05 in. +50% = 13.35 in., -50% 6.75 in.
Rainfall PrePlant & Planting 2/8 to 4/28 2.75 in. Seasonal 4/29 to 9/22 12.45 in.
Herbicide/Growth Regulator
Field 5B, S8
N
34
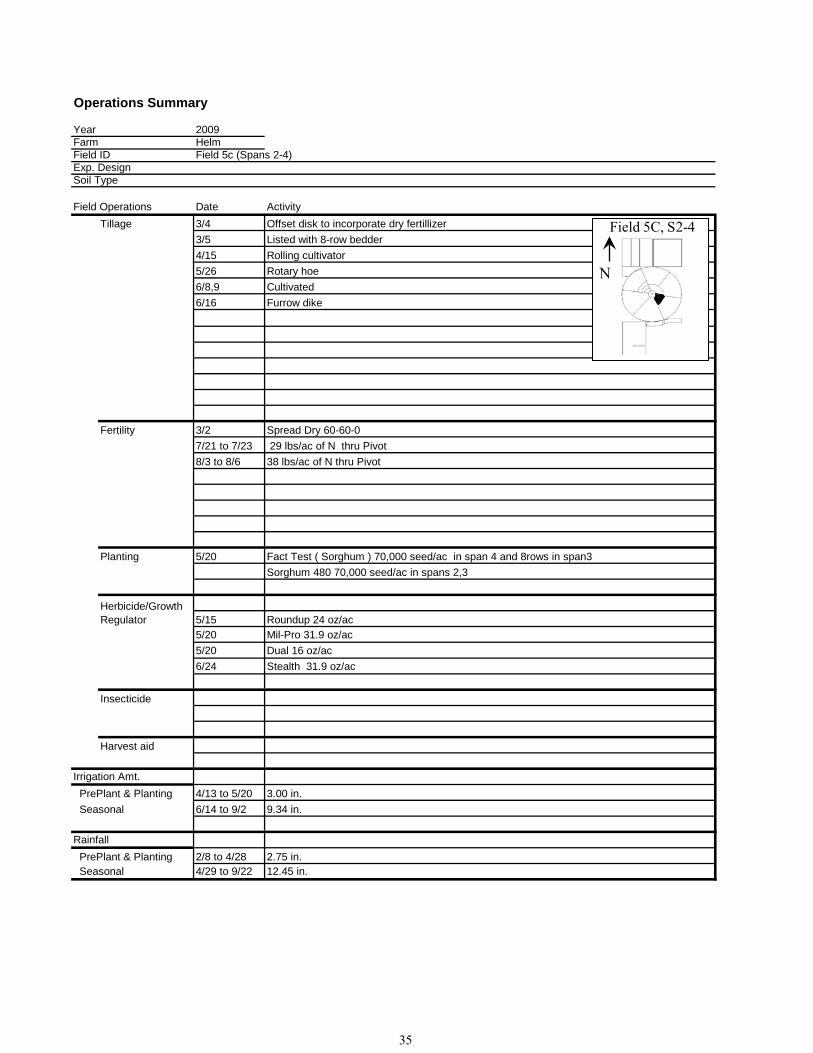
Operations Summary
Year 2009Farm HelmField ID Field 5c (Spans 2-4) Exp. DesignSoil Type
Field Operations Date ActivityTillage 3/4 Offset disk to incorporate dry fertillizer
3/5 Listed with 8-row bedder4/15 Rolling cultivator5/26 Rotary hoe6/8,9 Cultivated6/16 Furrow dike
Fertility 3/2 Spread Dry 60-60-07/21 to 7/23 29 lbs/ac of N thru Pivot 8/3 to 8/6 38 lbs/ac of N thru Pivot
Planting 5/20 Fact Test ( Sorghum ) 70,000 seed/ac in span 4 and 8rows in span3 Sorghum 480 70,000 seed/ac in spans 2,3
5/15 Roundup 24 oz/ac5/20 Mil-Pro 31.9 oz/ac5/20 Dual 16 oz/ac6/24 Stealth 31.9 oz/ac
Insecticide
Harvest aid
Irrigation Amt. PrePlant & Planting 4/13 to 5/20 3.00 in. Seasonal 6/14 to 9/2 9.34 in.
Rainfall PrePlant & Planting 2/8 to 4/28 2.75 in. Seasonal 4/29 to 9/22 12.45 in.
Herbicide/Growth Regulator
Field 5C, S2-4
N
35
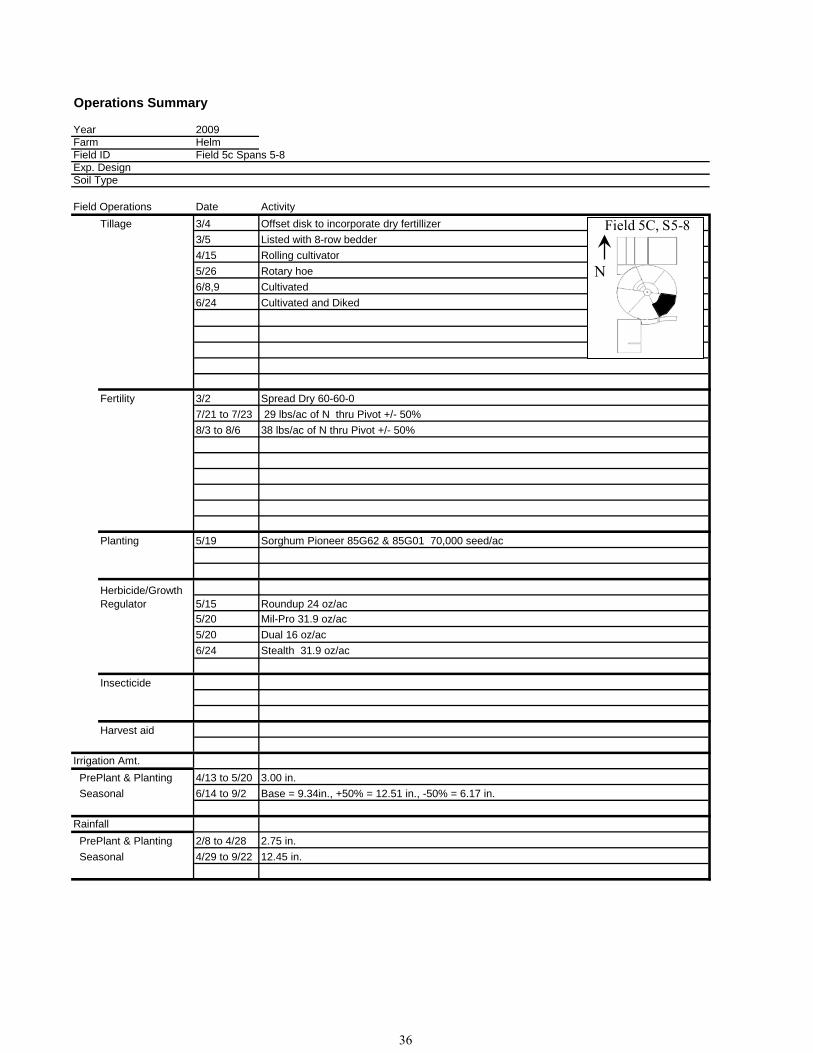
Operations Summary
Year 2009Farm HelmField ID Field 5c Spans 5-8 Exp. DesignSoil Type
Field Operations Date ActivityTillage 3/4 Offset disk to incorporate dry fertillizer
3/5 Listed with 8-row bedder4/15 Rolling cultivator5/26 Rotary hoe6/8,9 Cultivated6/24 Cultivated and Diked
Fertility 3/2 Spread Dry 60-60-07/21 to 7/23 29 lbs/ac of N thru Pivot +/- 50% 8/3 to 8/6 38 lbs/ac of N thru Pivot +/- 50%
Planting 5/19 Sorghum Pioneer 85G62 & 85G01 70,000 seed/ac
5/15 Roundup 24 oz/ac5/20 Mil-Pro 31.9 oz/ac5/20 Dual 16 oz/ac6/24 Stealth 31.9 oz/ac
Insecticide
Harvest aid
Irrigation Amt. PrePlant & Planting 4/13 to 5/20 3.00 in. Seasonal 6/14 to 9/2 Base = 9.34in., +50% = 12.51 in., -50% = 6.17 in.
Rainfall PrePlant & Planting 2/8 to 4/28 2.75 in. Seasonal 4/29 to 9/22 12.45 in.
Herbicide/Growth Regulator
Field 5C, S5-8
N
36
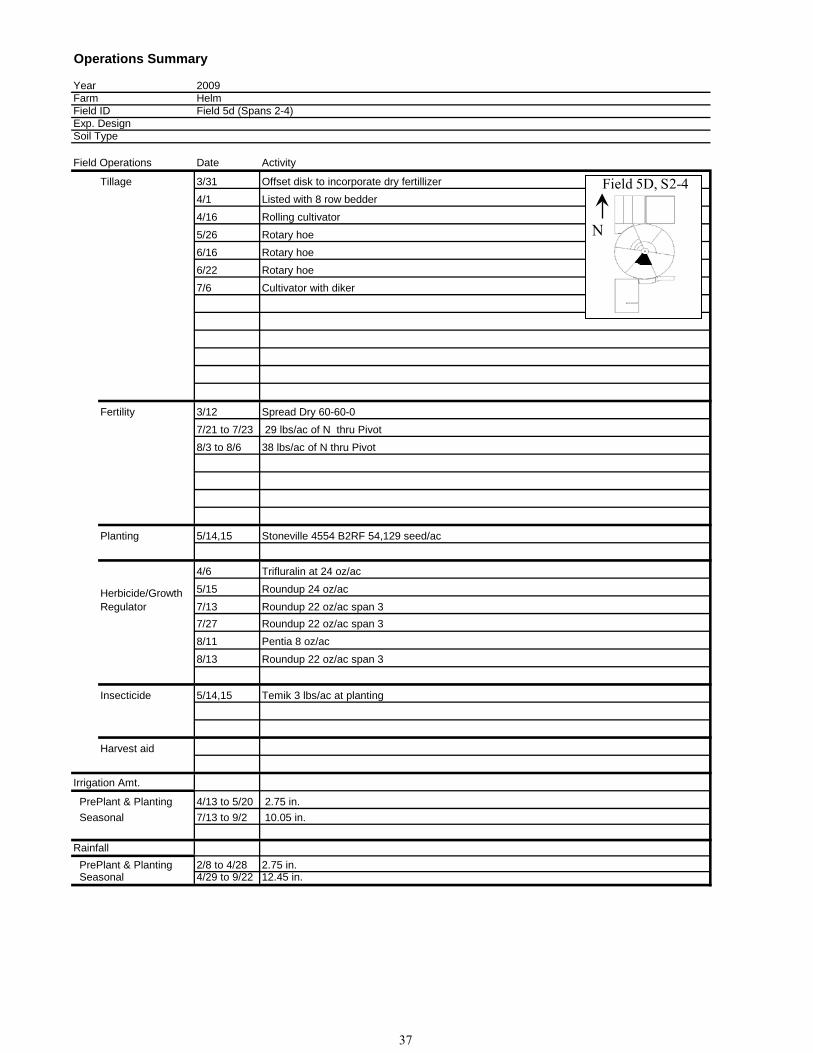
Operations Summary
Year 2009Farm HelmField ID Field 5d (Spans 2-4)Exp. DesignSoil Type
Field Operations Date Activity
Tillage 3/31 Offset disk to incorporate dry fertillizer4/1 Listed with 8 row bedder4/16 Rolling cultivator5/26 Rotary hoe6/16 Rotary hoe6/22 Rotary hoe7/6 Cultivator with diker
Fertility 3/12 Spread Dry 60-60-07/21 to 7/23 29 lbs/ac of N thru Pivot 8/3 to 8/6 38 lbs/ac of N thru Pivot
Planting 5/14,15 Stoneville 4554 B2RF 54,129 seed/ac
4/6 Trifluralin at 24 oz/ac 5/15 Roundup 24 oz/ac7/13 Roundup 22 oz/ac span 37/27 Roundup 22 oz/ac span 38/11 Pentia 8 oz/ac 8/13 Roundup 22 oz/ac span 3
Insecticide 5/14,15 Temik 3 lbs/ac at planting
Harvest aid
Irrigation Amt.
PrePlant & Planting 4/13 to 5/20 2.75 in. Seasonal 7/13 to 9/2 10.05 in.
Rainfall PrePlant & Planting 2/8 to 4/28 2.75 in. Seasonal 4/29 to 9/22 12.45 in.
Herbicide/Growth Regulator
Field 5D, S2-4
N
37
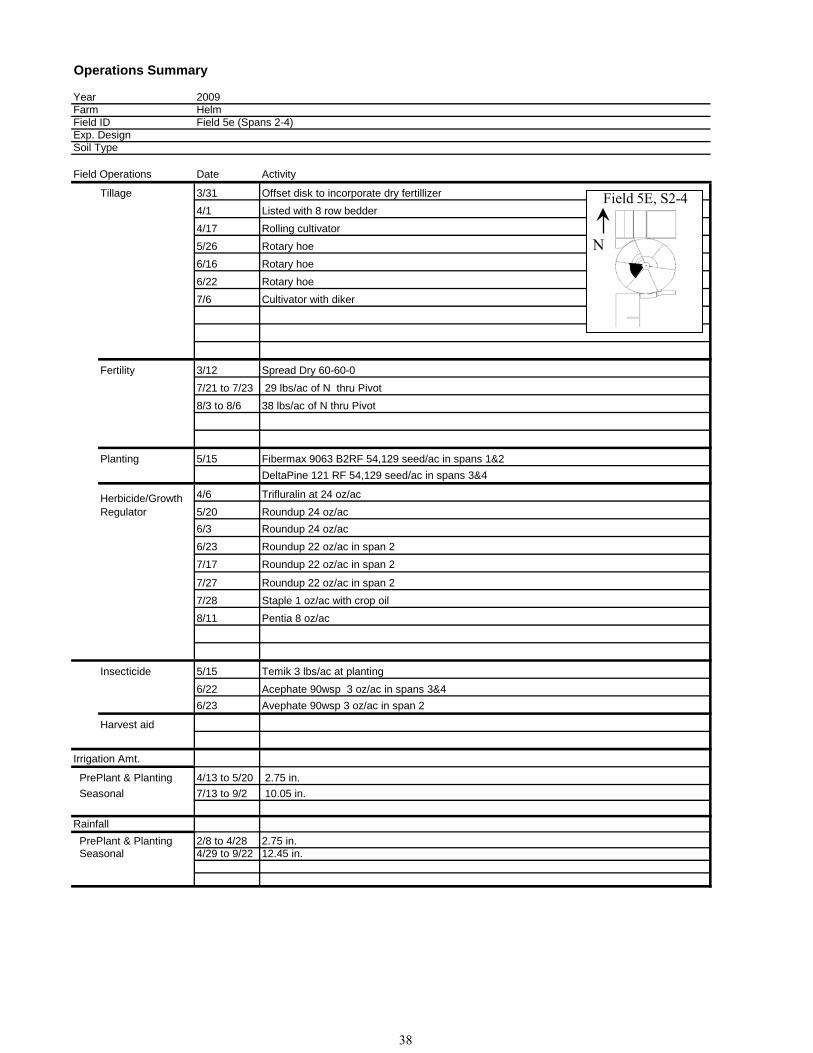
Operations Summary
Year 2009Farm HelmField ID Field 5e (Spans 2-4)Exp. DesignSoil Type
Field Operations Date Activity
Tillage 3/31 Offset disk to incorporate dry fertillizer4/1 Listed with 8 row bedder4/17 Rolling cultivator5/26 Rotary hoe6/16 Rotary hoe6/22 Rotary hoe7/6 Cultivator with diker
Fertility 3/12 Spread Dry 60-60-07/21 to 7/23 29 lbs/ac of N thru Pivot 8/3 to 8/6 38 lbs/ac of N thru Pivot
Planting 5/15 Fibermax 9063 B2RF 54,129 seed/ac in spans 1&2DeltaPine 121 RF 54,129 seed/ac in spans 3&4
4/6 Trifluralin at 24 oz/ac 5/20 Roundup 24 oz/ac6/3 Roundup 24 oz/ac6/23 Roundup 22 oz/ac in span 27/17 Roundup 22 oz/ac in span 2
7/27 Roundup 22 oz/ac in span 27/28 Staple 1 oz/ac with crop oil8/11 Pentia 8 oz/ac
Insecticide 5/15 Temik 3 lbs/ac at planting6/22 Acephate 90wsp 3 oz/ac in spans 3&46/23 Avephate 90wsp 3 oz/ac in span 2
Harvest aid
Irrigation Amt.
PrePlant & Planting 4/13 to 5/20 2.75 in. Seasonal 7/13 to 9/2 10.05 in.
Rainfall PrePlant & Planting 2/8 to 4/28 2.75 in. Seasonal 4/29 to 9/22 12.45 in.
Herbicide/Growth Regulator
Field 5E, S2-4
N
38
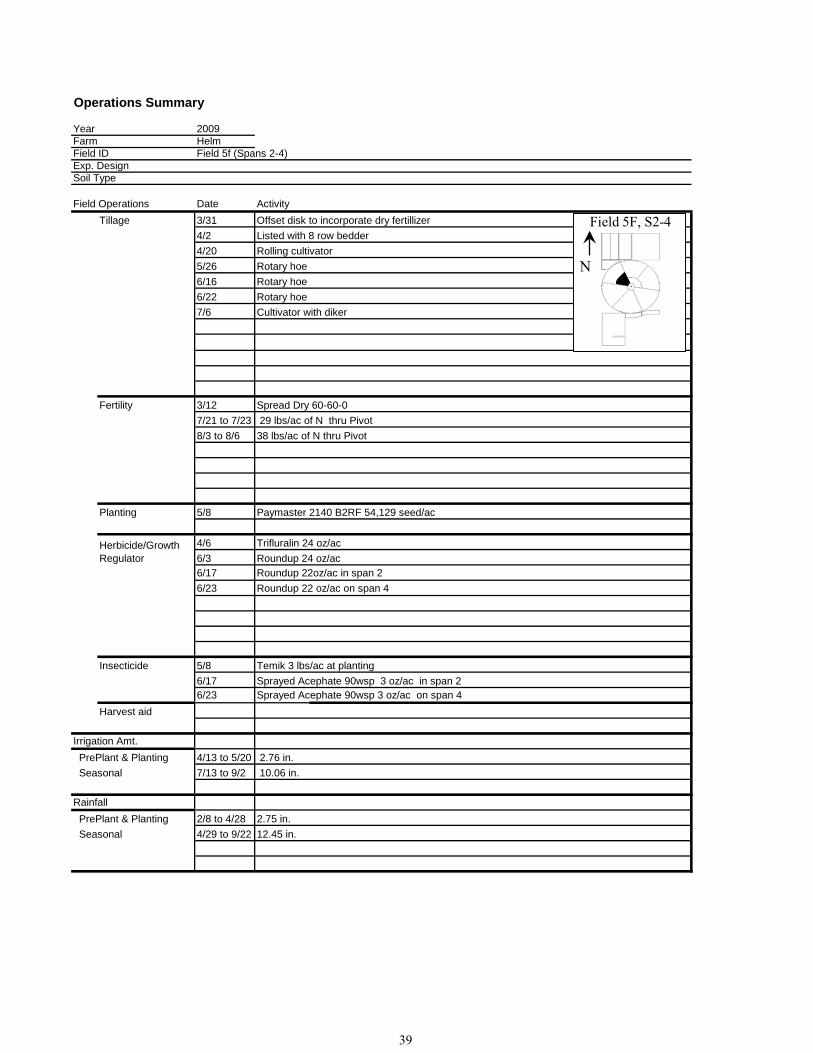
Operations Summary
Year 2009Farm HelmField ID Field 5f (Spans 2-4)Exp. DesignSoil Type
Field Operations Date ActivityTillage 3/31 Offset disk to incorporate dry fertillizer
4/2 Listed with 8 row bedder4/20 Rolling cultivator5/26 Rotary hoe6/16 Rotary hoe6/22 Rotary hoe7/6 Cultivator with diker
Fertility 3/12 Spread Dry 60-60-07/21 to 7/23 29 lbs/ac of N thru Pivot 8/3 to 8/6 38 lbs/ac of N thru Pivot
Planting 5/8 Paymaster 2140 B2RF 54,129 seed/ac
4/6 Trifluralin 24 oz/ac 6/3 Roundup 24 oz/ac6/17 Roundup 22oz/ac in span 26/23 Roundup 22 oz/ac on span 4
Insecticide 5/8 Temik 3 lbs/ac at planting6/17 Sprayed Acephate 90wsp 3 oz/ac in span 26/23 Sprayed Acephate 90wsp 3 oz/ac on span 4
Harvest aid
Irrigation Amt. PrePlant & Planting 4/13 to 5/20 2.76 in. Seasonal 7/13 to 9/2 10.06 in.
Rainfall PrePlant & Planting 2/8 to 4/28 2.75 in. Seasonal 4/29 to 9/22 12.45 in.
Herbicide/Growth Regulator
Field 5F, S2-4
N
39
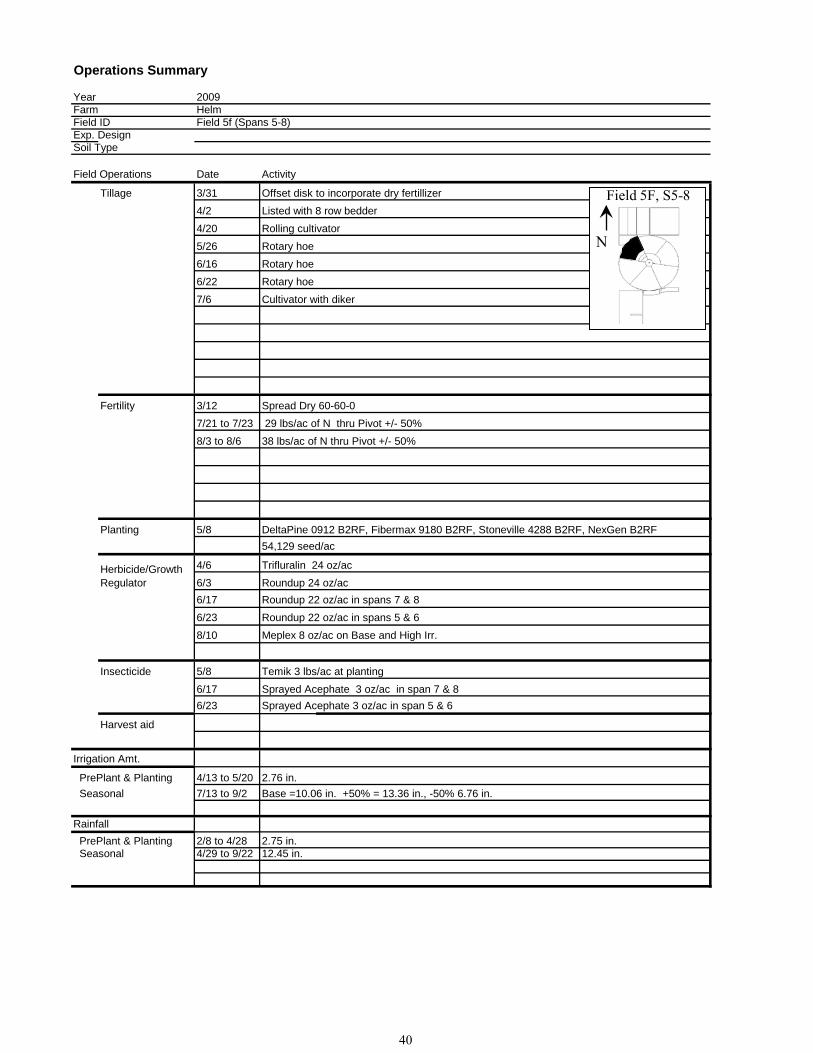
Operations Summary
Year 2009Farm HelmField ID Field 5f (Spans 5-8)Exp. DesignSoil Type
Field Operations Date Activity
Tillage 3/31 Offset disk to incorporate dry fertillizer4/2 Listed with 8 row bedder4/20 Rolling cultivator5/26 Rotary hoe6/16 Rotary hoe6/22 Rotary hoe7/6 Cultivator with diker
Fertility 3/12 Spread Dry 60-60-07/21 to 7/23 29 lbs/ac of N thru Pivot +/- 50% 8/3 to 8/6 38 lbs/ac of N thru Pivot +/- 50%
Planting 5/8 DeltaPine 0912 B2RF, Fibermax 9180 B2RF, Stoneville 4288 B2RF, NexGen B2RF54,129 seed/ac
4/6 Trifluralin 24 oz/ac 6/3 Roundup 24 oz/ac6/17 Roundup 22 oz/ac in spans 7 & 86/23 Roundup 22 oz/ac in spans 5 & 6 8/10 Meplex 8 oz/ac on Base and High Irr.
Insecticide 5/8 Temik 3 lbs/ac at planting6/17 Sprayed Acephate 3 oz/ac in span 7 & 86/23 Sprayed Acephate 3 oz/ac in span 5 & 6
Harvest aid
Irrigation Amt.
PrePlant & Planting 4/13 to 5/20 2.76 in. Seasonal 7/13 to 9/2 Base =10.06 in. +50% = 13.36 in., -50% 6.76 in.
Rainfall PrePlant & Planting 2/8 to 4/28 2.75 in. Seasonal 4/29 to 9/22 12.45 in.
Herbicide/Growth Regulator
Field 5F, S5-8
N
40
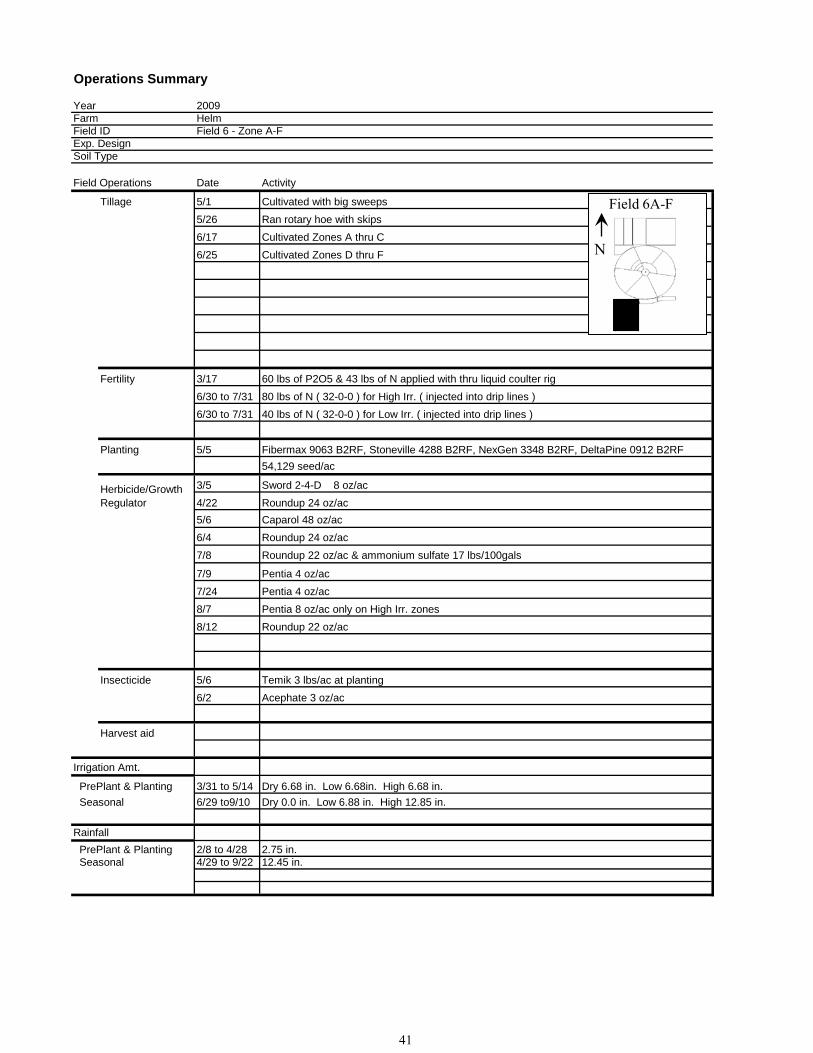
Operations Summary
Year 2009Farm HelmField ID Field 6 - Zone A-F Exp. DesignSoil Type
Field Operations Date Activity
Tillage 5/1 Cultivated with big sweeps5/26 Ran rotary hoe with skips6/17 Cultivated Zones A thru C 6/25 Cultivated Zones D thru F
Fertility 3/17 60 lbs of P2O5 & 43 lbs of N applied with thru liquid coulter rig6/30 to 7/31 80 lbs of N ( 32-0-0 ) for High Irr. ( injected into drip lines )6/30 to 7/31 40 lbs of N ( 32-0-0 ) for Low Irr. ( injected into drip lines )
Planting 5/5 Fibermax 9063 B2RF, Stoneville 4288 B2RF, NexGen 3348 B2RF, DeltaPine 0912 B2RF54,129 seed/ac
3/5 Sword 2-4-D 8 oz/ac4/22 Roundup 24 oz/ac5/6 Caparol 48 oz/ac6/4 Roundup 24 oz/ac7/8 Roundup 22 oz/ac & ammonium sulfate 17 lbs/100gals
7/9 Pentia 4 oz/ac7/24 Pentia 4 oz/ac8/7 Pentia 8 oz/ac only on High Irr. zones8/12 Roundup 22 oz/ac
Insecticide 5/6 Temik 3 lbs/ac at planting6/2 Acephate 3 oz/ac
Harvest aid
Irrigation Amt.
PrePlant & Planting 3/31 to 5/14 Dry 6.68 in. Low 6.68in. High 6.68 in. Seasonal 6/29 to9/10 Dry 0.0 in. Low 6.88 in. High 12.85 in.
Rainfall PrePlant & Planting 2/8 to 4/28 2.75 in. Seasonal 4/29 to 9/22 12.45 in.
Herbicide/Growth Regulator
Field 6A-F
N
41

Operations Summary
Year 2009Farm HelmField ID Field 6 - Zone G Cotton Drip Irrigated Nitrogen Level Effects on Insects ParajuleeExp. DesignSoil Type
Field Operations Date ActivityTillage 6/12 Rotary Hoe
6/16 Rotary Hoe6/22 Rotary Hoe6/27 Cultivated
Fertility Variouls N levels applied with coulters on wet sides of beds
Planting 5/18 Fibermax 9063B2RF 54,129 seed/ac
3/5 Sword 2-4-D 8 oz/ac4/22 Roundup 24 oz/ac5/22 Roundup 24 oz/ac & LI700 42.26 oz/ac6/22 Roundup 22 oz/ac
Insecticide 6/2 Acephate 3 oz/ac 8/17 Karate 4 oz/ac8/28 Karate 4 oz/ac8/31 Karate 4 oz/ac
Harvest aid
Irrigation Amt. PrePlant & Planting 3/31 to 5/23 10.66 in. Seasonal 6/29 to 9/10 12.02 in.
Rainfall PrePlant & Planting 2/8 to 4/28 2.75 in. Seasonal 4/29 to 9/22 12.45 in.
Herbicide/Growth Regulator
Field 6G
N
42
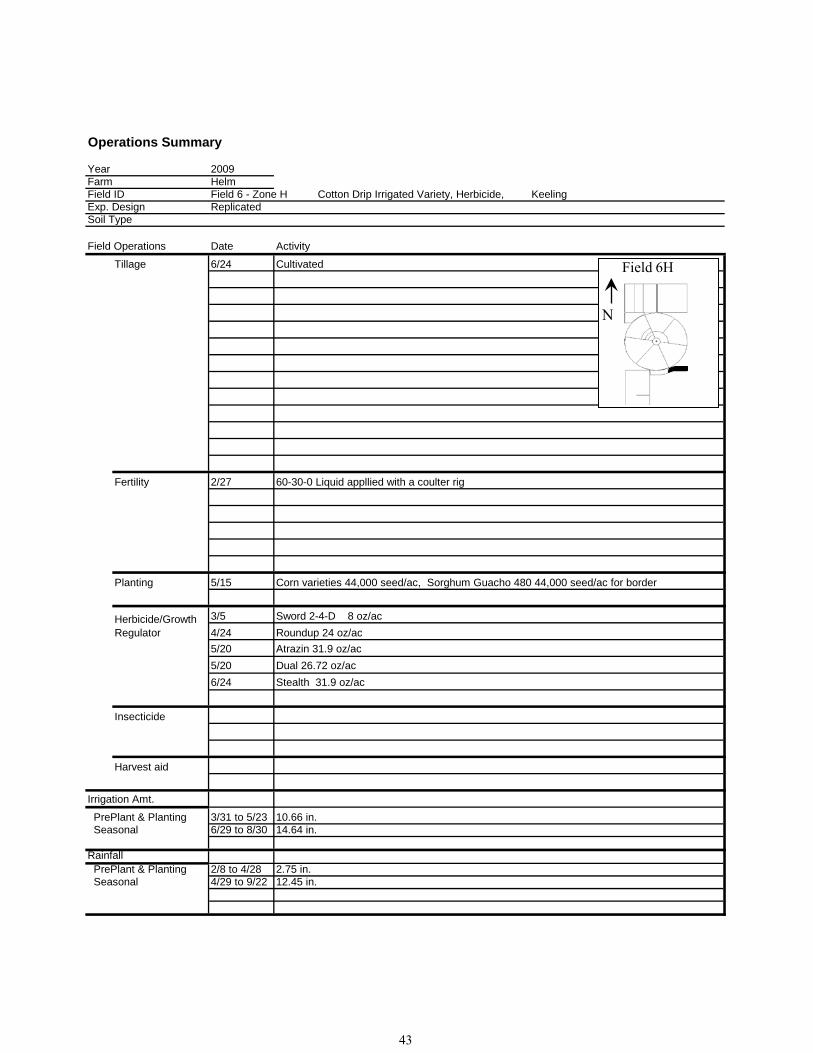
Operations Summary
Year 2009Farm HelmField ID Field 6 - Zone H Cotton Drip Irrigated Variety, Herbicide, KeelingExp. Design Replicated Soil Type
Field Operations Date Activity
Tillage 6/24 Cultivated
Fertility 2/27 60-30-0 Liquid appllied with a coulter rig
Planting 5/15 Corn varieties 44,000 seed/ac, Sorghum Guacho 480 44,000 seed/ac for border
3/5 Sword 2-4-D 8 oz/ac4/24 Roundup 24 oz/ac5/20 Atrazin 31.9 oz/ac5/20 Dual 26.72 oz/ac6/24 Stealth 31.9 oz/ac
Insecticide
Harvest aid
Irrigation Amt.
PrePlant & Planting 3/31 to 5/23 10.66 in. Seasonal 6/29 to 8/30 14.64 in.
Rainfall PrePlant & Planting 2/8 to 4/28 2.75 in. Seasonal 4/29 to 9/22 12.45 in.
Herbicide/Growth Regulator
Field 6H
N
43