helen m. bowers university of delaware, lerner …...value of fairness opinions in us mergers and...
TRANSCRIPT

The authors would like to thank the participants in the Laboratoire des Stratégies Idustrielles (LASI) seminar at the Université de Paris1 Panthéon-Sorbonne, Thomas Bates and Darren Latham for their helpful comments. Contact information: Helen Bowers: [email protected], William Latham: [email protected].
Value of Fairness Opinions in US Mergers and Acquisitions, 1980-2003
Helen M. Bowers University of Delaware, Lerner College of Business and Economics, Department of Finance,
Newark, DE 19716, USA
and
William R. Latham III University of Delaware, Lerner College of Business and Economics, Department of Economics,
Newark, DE 19716, USA
Draft: November 23, 2004
ABSTRACT
In the market for corporate control, a potential market failure of asymmetric or inadequate information arises if any of the market participants (the acquiring or target firms’ management, boards of directors or shareholders) have insufficient knowledge about the real market value of a target firm. This failure may be mitigated by the market’s participants choosing to purchase additional information about the value of the target firm. An opinion by a third party regarding this value is known as a “fairness opinion.” Although it is often the case that at least one party to an acquisition obtains a fairness opinion, the issue of whether they provide any informational value is still debated. US court rulings have increased the potential costs to firms and their boards of directors of making merger and acquisition decisions without sufficient information, thus potentially raising the value of fairness opinions. The paper examines factors influencing the decisions of firms engaged in merger and acquisition activity during the 1980-2002 period to obtain or not to obtain fairness opinions. For each transaction information is available on the primary industry in which the acquiring and target firms operate and on the numbers and types of additional information, including fairness opinions, each of the parties to the transaction sought during the progress of the transaction. Our results show that, for the acquiring firm in an acquisition, the likelihood of purchasing fairness opinions is influenced significantly by (1) the market values of the acquirer and the target firm, (2) the volatility of excess returns of both firms, (3) whether or not the transaction is a “cash” deal, (3) the degree of asymmetric information as measured by the similarity of the acquirer and target firms, (4) the amount of monopoly power the target firm has, (5) whether the acquisition is “hostile,” and (6) whether other financial advisory services have been purchased by either firm. Finally, strong evidence is found indicating that (7) the behavior of acquiring firms, whether incorporated in Delaware or not, has been significantly altered since the 1985 Van Gorkom v. Smith decision by a Delaware court regarding fairness opinions. Our results for target firms are not as strong as those for acquirers, nor are the results for financial advisory services more broadly defined.

2
1. Introduction
“A man’s judgment cannot be better than the information on which he has based it.” Arthur Hays Sulzberger, former publisher, N.Y. Times, in Address to the New York State Publishers Association, August 30, 1948
A fairness opinion, typically presented in the form of a letter to the board, contains the
issuer’s opinion regarding the fairness to the shareholders of the corporation of the financial
terms of a proposed transaction. Although there are no legally specified credentials qualifying
issuers of fairness opinions, the precedent setting court rulings1 have stressed that the providers
of fairness opinions should be “qualified and independent.” Most often, fairness opinions are
written by investment banks, but can also be provided by consulting firms, CPA firms,
commercial banks, appraisers, or consultants specializing in valuation.2
Fairness opinions help meet a key criterion for protection afforded by the “business
judgment rule” which holds that corporate boards are protected from shareholder liability from
the consequences of adverse business decisions if the decision was rationally based, made in
good faith that the action was in the best interest of the company and arrived at in an informed
manner. No other specific document is as universally recognized as evidence of an informed
1 The 1985 Delaware Supreme Court decision in Smith v. Van Gorkom (488 A.2d 858 (Del. 1985)) is usually cited as the precedent setting court ruling (for example, see Bebchuk, 1989) that created the obligation that when evaluating a takeover proposal, the corporate boards of target firms must inform themselves of all reasonably available and relevant information to the decision.
2 A June 11, 2004 Wall Street Journal article ‘NASD Scrutinizes Conflicts in Bankers' 'Fairness Opinions' summarized the situation succinctly: “Fairness opinions became common after a 1985 ruling by the Supreme Court of Delaware, the leading jurisdiction for M&A law because of the large number of companies that incorporate in Delaware. In that case, which involved allegations that Trans Union Corp. sold itself too cheaply to the Pritzker family, the court held that Trans Union's board had violated a duty of care and sold the company for too little money. The court stated that getting a fairness opinion would have helped in fulfilling that duty. The decision prompted corporate boards to routinely seek fairness opinions. But their purpose was as much bullet-proofing a board's decision as exploring valuations.”

3
board as a fairness opinion. Fairness opinions therefore, are imbued with power to reduce, even
eliminate, liability to shareholders for members of corporate boards arising from disagreements
in valuation.
In this paper, we examine whether the empirical evidence supports either of two theories
offered to explain why acquiring or target firms obtain fairness opinions. The first is a theory of
information asymmetry where fairness opinions are more likely to be obtained where there is less
information available in the market regarding the value of the target firm. The second theory is a
one of increased liability, where fairness opinions are more likely to be sought when there is a
perceived higher probability of a successful shareholder lawsuit as a result of the transaction. We
find that, for the acquiring firm in an acquisition, the likelihood of purchasing fairness opinions
is influenced significantly by (1) the market values of the acquirer and the target firm, (2) the
volatility of excess returns of both firms, (3) whether or not the transaction is a “cash” deal, (3)
the degree of asymmetric information as measured by the similarity of the acquirer and target
firms, (4) the amount of monopoly power the target firm has, (5) whether the acquisition is
“hostile,” and (6) whether other financial advisory services have been purchased by either firm.
Finally, strong evidence is found indicating that (7) the behavior of acquiring firms, whether
incorporated in Delaware or not, has been significantly altered since the 1985 Van Gorkom v.
Smith decision by a Delaware court regarding fairness opinions. Our results for target firms are
not as strong as those for acquirers, nor are the results for financial advisory services more
broadly defined.
2. Hypotheses
2.1 Information asymmetry and market value

4
Information about a particular acquisition can be characterized into two types: market
information and costly incremental information. We define market information as the
information that is available to all participants in a semi-strong-form efficient market.
Information provided by the market includes industry analysis, security analysis, and SEC
filings. Incremental information is information that is obtained at a cost by some party to the
acquisition. This incremental information may eventually be disclosed and become market
information, but this is not necessarily so. The focus of this study is on a particular type of
incremental information, the fairness opinion. A fairness opinion contains the issuer’s
assessment of the fairness of the offer to the firm’s shareholders. Although the opinion may state
that an offer is fair, this does not necessarily mean that the issuer of the opinion regards this offer
as the best offer that the target could reasonably expect. If fairness opinions, while only stating
that an offer is fair, mitigate information asymmetry we expect fairness opinions to be more
likely to be sought when there is more value at stake.
We measure the size of the transaction in two ways. First we use the actual dollar value of
the transaction in terms of the market value of the target measured as the average of the market
values over days -25 to -5 relative to the announcement date. We hypothesize that the larger the
size of the firm, the more likely it is that a fairness opinion will be sought. Therefore, we
hypothesize that a firm is more likely to obtain a fairness opinion when the other firm in the
transaction is relatively large. We also hypothesize that, the larger the target is relative to the
acquirer, the more likely it is that the acquirer will seek advice in the form of a fairness opinion.
We expect this relation for the acquiring firm because the acquirer should be more willing to
obtain costly incremental information when the target firm is relatively larger because of the
greater potential impact on the acquirer’s own equity value.

5
2.2 Uncertainty in the information environment
Dierkens (1991) finds empirical evidence that information asymmetry between the
managers of the firms and the market is significant for equity. The magnitude of this
information asymmetry is expected to increase with the volatility of the firm’s stock because this
volatility reflects the underlying uncertainty regarding the firm’s future performance. The
variance of excess returns (Retit - Mktit) has been used in several studies, such as Bizak,
Brickley, and Coles (1993), Boone, Field, Karpoff, and Raheja (2004), Gaver and Gaver (1993),
Lehn, Patro and Zhao (2004), Smith and Watts (1992), and Yermack (1995) as a measure of the
uncertainty in the information environment. We argue that when making the decision whether to
obtain a fairness opinion, the relative uncertainty regarding the information environment is a
critical determinant. The firm would seek to obtain the costly incremental information in a
fairness opinion if the other firm in the transactions is in a more uncertain information
environment than that of their own firm.
2.3 Industry “closeness” and structure and the value of information
Information asymmetry can also arise in the market based on differential experiences `of
firms. Those with similar experiences will share an information base not shared by those without
such experience. One form of experience is simply operating a business in particular markets
with all of the institutional details that differentiate real-world markets from each other. We
hypothesize that industry “closeness” will affect the value of the kind of information provided by
fairness opinions. Firms that are “close” to each other in the sense that they are in the same or
similar industries (which is not the same is being close in a geographic distance sense) they may
be more likely to have higher levels of prior knowledge about each other than firms in dissimilar

6
lines of business. It would follow that these firms with higher prior levels of knowledge would
find the additional information provided by a fairness opinion less valuable than dissimilar firms.
Thus we measure how close firms are to each other and then examine whether or not the
closeness of firms to each other reduces the likelihood of obtaining a fairness opinion.
2.3.1 Measuring industry closeness
Every target and acquiring firm is assigned to an industry based on its primary line of
business. For firms that produce a wide range of products and services these assignments may
not be precisely descriptive of the firm’s activities. However, the notion of an “industry” in
which a firm participates is an intuitively appealing concept that has also generally been found to
be useful in empirical investigations. In fact, most firms produce a range of products from the
same or closely related industries. The North American Industry Classification System (NAICS)
and its predecessor, the US Standard Industrial Classification system, both have numerical codes
that group firms into industries. Industries from related sectors have similar codes: all
manufacturing industries have NAICS codes beginning with the 2-digits 31, 32 or 33, wholesale
trade begins with 42, etc. Increasingly detailed industries are indicated by codes with more and
more digits. For example, NAICS code 325 is chemical manufacturing, 3255 is paint, coating
and adhesive manufacturing, and 325520, is adhesive manufacturing. The coding system extends
to as many as nine digits, but six digits is more than enough to identify an industry in most cases.
The COMPUSTAT data we use have six-digit NAICS (and four-digit SIC codes) for both target
and acquiring firms. The structure of the coding systems places firms that produce similar
products in industries with codes that are numerically similar. For example, NAICS industry
code 325510 is assigned to paint manufacturing which is obviously similar to adhesive
manufacturing which is assigned the NAICS code 325520. We construct a measure of industry
similarity or closeness based on these codes. Because firms in industries that produce similar

7
products have industry codes that are numerically close to each, the absolute value of the
difference between the numerical values of the target and acquiring firms’ NAICS (or SIC) codes
might be used as a measure of how similar the industries are in which the target and acquiring
firms operate. The closeness measure for firms in paint manufacturing (325510) and adhesive
manufacturing (325520) would be 10 while the closeness measure for a firm in paint
manufacturing and a firm in any kind of metal fabrication (332***) would be at least 6,490
(332000 - 325510). Within the manufacturing sector, there does seem to be a rough sort of
correspondence, at least ordinally, between the absolute differences between codes and the
degree of dissimilarity between industries. However, the numerical code numbers were not
designed to indicate closeness and do so only imperfectly, especially from one major industry
group to another. There are obviously multiple dimensions of closeness that cannot be reflected
by such a one-dimensional array of numbers. For example, all financial institutions have NAICS
codes that begin with 52 so that their 6-digit codes are 52****. Thus the closeness measure for a
financial institution and paint manufacturing would be at least 194,490 (520000 – 325510).
Professional services, which may be just as closely related to a manufacturing industry as a
financial institution, but in a different dimension, have codes that begin with 54 so their
minimum measures of closeness to paint manufacturing would be 214,490. It does not make
sense to say that any financial institution is “closer” to paint manufacturing than any professional
service. To avoid this problem, which arises from the arbitrariness in the assignment of the first
two digits in the codes for major industry groups, we assign a closeness measure of 30,000
whenever the acquirer and the target are from different major industry groups. The value of
30,000 is chosen because the largest maximum within-major-industry-group difference, which is
in manufacturing, is 29,999. The final adjustment to the closeness measure we make is to invert

8
the scale by subtracting each value from 30,000 so that the intuition of low numbers indicating
geater closeness and high numbers its absence is established. The result is that we have a
measure of the degree of closeness for pairs of firms within the same general classification and
for all other pairs we assign a large number.
An alternative approach to industry closeness is to use a 0-1 dummy variable to identify
as “close” transactions for which both target and acquiring firms are from the same industry
group. The precision of the definition of closeness in this case depends upon how disaggregated
the industry groups are. An a priori selection must be made of the industry codes to place into
specific groups that, for some characteristics, are more homogeneous within the groups than
across groups. We choose to implement this alternative using the 48 industry groups used by
Fama and French (“Industry Costs of Equity,” JFE (43) 1997, pp 153-193).3 Fama and French’s
industry groups are aggregations of SIC codes of related industries from different parts of the
SIC system. For example, their Business Services group includes the codes for industries from
Commercial Printing (SICs 2750-2759, NAICS 323110 and 323114), Signs and Advertising
Displays (SIC 39930, NAICS 33995), parts of Business Services other than computers (SICs
7300-7372, NAICS 5418 and 5614), and a variety of other sectors. Table 1 shows the
distribution of industries in the Fama and French industry groups for all of the acquisition
announcements for which there is financial advisor data available in SDC and for those
announcements that were included in our regressions.
3 Other schemes for aggregating industry codes into industry groups exist. For example, Compustat defines a different set of industry groups. In another context it is has been found that using Compustat industry definitions rather than Fama-French industries does not affect analytical results (e.g., Boone,et al. [2004]). Because we are not interested in the individual industry results explicitly, but only need to determine whether two firms are in the same or different industries, the particular assignment scheme should not matter as long as the levels of aggregation are similar. The particular assignment scheme might be more important when industry is used as a proxy for other unmeasured factors such as firm complexity and in this context we again rely on finding such as those of Boone,et al. [2004].

9
2.3.2 Industry structure and the value of information
We hypothesize that industry structure will affect the value of the kind of information
provided by fairness opinions. It is relatively easy to find information on firms in highly
competitive industries so that they can be compared with other firms to determine the
reasonableness of an offer. Monopoly firms, however, by their nature, are unique and
consequently more difficult to value by referring to other firms because less information is
available and there are not comparable firms. Thus we hypothesize that the more competitive the
industry is, the less value a fairness opinion would be expected to have. We measure
competitiveness using the percentage of industry sales by the four firms with the highest sales in
the industry (the 4-firm concentration ratio). This measure is admittedly somewhat arbitrary, but
it is widely used and does, at least, provide an initial measure of competitiveness to test. In
addition it is available from the U.S. Bureau of the Census.4 While industry competitiveness
varies over time it does not vary greatly in many industries within relatively short time spans.
Thus we use a competitiveness measure for 1997 for all of the transactions in our sample. If we
find that the competitiveness measure has significantly more discernable effects around 1997, we
can refine the measure to more closely match the period in which the transaction occurs.
2.4 Medium of exchange
The initial terms of the acquisition offer are included in the announcement of the offer,
including whether the offer will be cash, stock or some other medium of exchange. Because a
4 Concentration measures for 1997 by detailed NAICS codes are available from the U.S. Census Bureau for all industries except Mining (NAICS 21), Construction (NAICS 23) and Management of Companies and Enterprises (NAICS 55). See http://www.census.gov/epcd/www/concentration.html. Other measures calculated by the Census Bureau include the 8-firm, 20-firm and 50-firm concentration ratios for all industries included and the Hirshman-Herfindahl Index only for manufacturing industries. The last is viewed by most economists as the best of these measures because it utilizes information from the full distribution of firms within the industry and weights the larger shares more heavily. However, it is not available for industries other than manufacturing, so we choose to use a measure which is available for all of the industries instead.
10
fairness opinion concerns the fairness of the offer to the shareholders, the less ambiguous the
value of the offer, the less incremental information is provided in an opinion. Therefore, we
hypothesize that a firm will be less likely to seek a fairness opinion when the medium of
exchange is all cash.
3. Increased liability hypothesis
We hypothesize that if fairness opinions can be used to satisfy one of the requirements
for protection under the business judgment rule, then opinions are more likely to be sought when
there is the perception that the potential for a successful shareholder lawsuit is relatively high.
3.1 Court rulings and the value of information
First, we include a dummy variable for the Van Gorkom decision. Previous studies have
found an initial increase in the frequency in the use of fairness opinions after the Delaware
Supreme Court decision in 1985 (Bowers 2002) and we expect o confirm this in the present tudy
even after contolling for many factors not considered in the prior work..
3.2 “Attitude” of the deal and the value of information The initial reaction of the target firm’s management to the announcement of the offer
may be an indication of potential litigation resulting from the acquisition. Therefore, we
hypothesize that a firm is more likely to obtain a fairness opinion if the acquisition is “hostile.” A
finding of a negative sign might indicate that control, not valuation, is the issue in hostile
takeovers and that additional valuation information is not sought because the value is not at
issue.
3.3 Number of advisory services and the value of information
We regard other advisory services as probably functioning as substitutes for fairness
opinions and thus hypothesize that, the larger the number of other advisory services obtained, the
lower will be the probability of obtaining a fairness opinion. A finding of a positive sign would

11
indicate that other advisory services are complements to fairness opinions and not substitutes for
them.
3.4 Time period of the transaction and the value of information
We use the year that the transaction is announced. We use the time period as a proxy for
business cycle and market conditions not related to target and acquirers excess returns or their
market values and other unobserved factors that may influence the decision to seek a fairness
opinion. We also use a continuous time variable to capture any time trend effect not associated
with the calendar years. This variable has a value of 1 on the first day in the sample period
(January 1, 1980) and increases linearly each day to the end of the period (December 31, 2002).
4. Binomial logit regression models
The following basic model was estimated separately for acquirers and targets for i=1 to T
transactions5
ititt
iiiiiiiii
igigg
iiiiii
YEARFAIRATTDELBDELTDELAVGMPRVALVALT
VALAINDCONTCONACLSEADVTADVAFOP
εαβββββ
βγββββββ
+++++++++++
+++++++=
∑
∑
=
=
2002
19801110987
6
48
1543210
Where
FOPi = 1 if a fairness opinion was sought by the firm, 0 otherwise;
5 Note that in the empirical analysis the number of observations varies from one estimated equatiion to another because of missing data for some variables for some observations. We feel that the gain from the additional numbers of observation made possible in many of the estimations by this approach (in terms of precision of estimates) more than offsets the loss of certainty that the particular sample is not driving the results when exactly the same observations are not used in all estimations. However, to ensure that selectivity has not biased the results, Hausman’s test have been run and the results indicate that selectivity does not seem to be a problem.

12
or = the number of fairness opinions reported by the firm ADVAi = Number of non-fairness opinion advisory services used by the acquiring firm ADVTi = Number of non-fairness opinion advisory services used by the target firm CLSEi =Closeness =|NAICSAi – NAICSTi |if 1st 2 digits match, otherwise = 30,000 or = 1 if both firms are in the same Fama-French industry group, 0 otherwise CONAi = 4-firm concentration ratio of acquiring firm’s industry CONTi = 4-firm concentration ratio of target firm’s industry INDgi = 1 if the target firm’s industry is in Fama-French industry group g, 0 otherwise VALAi = Total market value of the acquiring firm VALTi = Total market value of the target firm RVALi = Market value of the target firm relative to the market value of the acquiring firm MPi = Merger premium VGi = 1 for transactions after 1985, the year of the the Van Gorkham decision DELAi = 1 for transactions in which the acquiring firm is incorporated in Delaware DELTi = 1 for transactions in which the target firm is incorporated in Delaware DELBi = 1 for transactions in which both firms are incorporated in Delaware FAIRi = 1 for transactions after 1995, the year of the SEC’s Fair Disclosure regulation YEARti = 1 if the year in which transaction was completed is year t, 0 otherwise ATTi = 1 if the attitude of the deal is Friendly; 0 if it is Hostile
The theoretical considerations that lead to the model specified have strong restrictions on
neither the forms of the variables nor the forms of the equations to be estimated. Thus we have
considerable freedom to choose forms that lead to functions that fit the data best. Most of the
variables are dichotomous dummies for which alternative functional forms are not considered.
Several of the other variables have limited ranges of values (e.g., FO which only has integer
values between 0 and 7, or CONA or CONT which have values in the 0-1 interval) making them
less attractive candidates for transformation also. This leaves the closeness measure, CLSE,
based on NAICS codes, the market values of the firms, VALT and VALA and the merger
premium, MP. If the Closeness variable has affects that are more attenuated the farther apart the
two firms are, this affect can be modeled by using a quadratic form in closeness. Confirmation
of the hypothesis of an attenuated effect of closeness with greater distance would be a negative
13
linear term and a positive squared term (the variable’s values are between 30,000, for firms in the
same industry to 0, for firms far apart.
5. Data Collection and Summary Statistics
Sample transactions are drawn from a pool of 7,818 merger announcements between
1980 and 2002 obtained from the Securities Data Corporation (SDC) domestic mergers and
acquisitions database. These observations include those announcements for which the acquiring
and target firms were public and the value of the deal was disclosed. In addition, for an
observation to be included in the sample, its SDC classification for the form of the deal had to be
as a merger, acquisition, acquisition of stock assets or majority interest. Announcements were
excluded from the sample if, according to SDC, the status of the deal was unknown, the
transaction was classified as rumored or where either firm had only announced plans to seek out
a buyer or seller for all or part of its assets. Also, if SDC classified the deal type as a spin-off,
recapitalization, self-tender, minority stake purchase, privatization, or acquisition of remaining
interest, or if the proposed transaction was a cross-border deal, it was excluded from the sample.
Of the 7,818 merger announcements, fairness opinion data was available for 4,228 of the
acquirers and 4,229 of the targets.
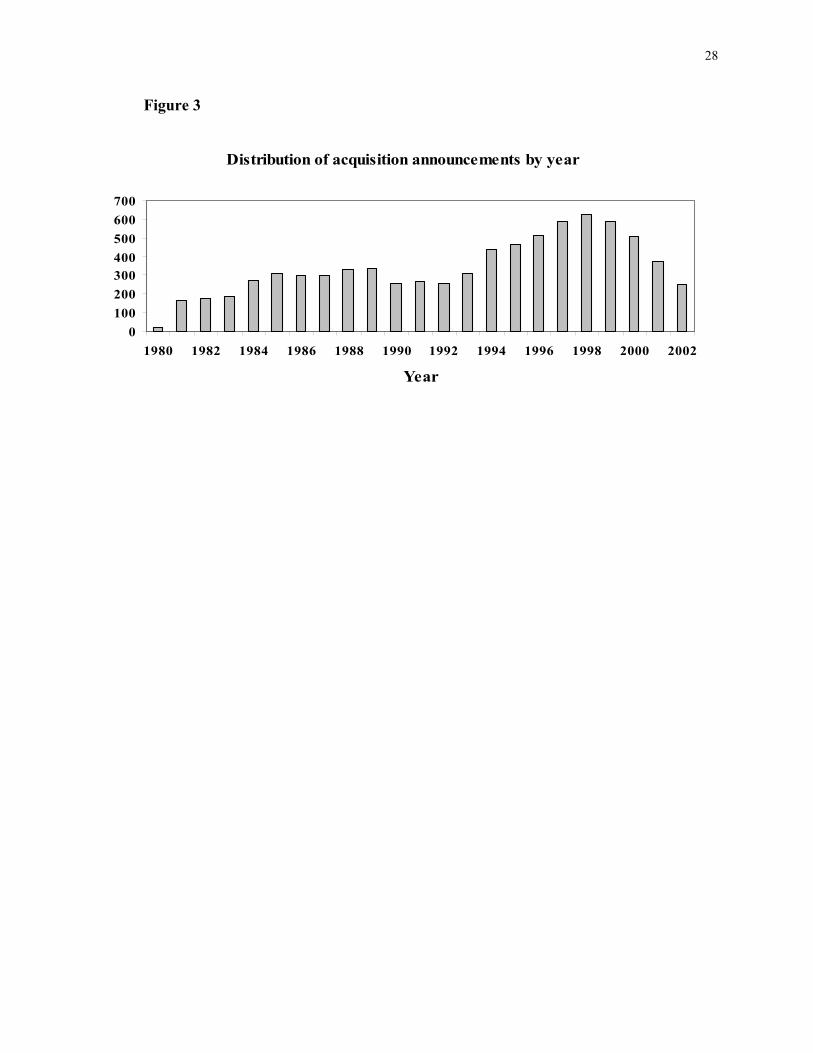
Fairness opinions are routinely by not universally sought. Figure 1 shows the number of
fairness opinions obtained by acquiring and target firms over the period 1980-2002. Figure 2
shows the firms that obtained fairness opinions as a percentage of all 4,228 of the acquirers and
4,229 of the targets for which fairness opinion data were available from the SDC dataset. The
sample period begins in 1980 to capture the any affect of the Van Gorkom court decision in
1985. The number of acquirers and targets obtaining fairness opinions has trended upward since

14
1980. However, the frequency of firms obtaining fairness opinions, although varying from year
to year is relatively much more stable, exhibiting a slight upward trend over the long term.
There are two possible reasons for the drop-off in frequency of firms seeking fairness
opinions after 2000. First, the decrease may be due to the purported escalation in the prices of
obtaining opinions and the decline in willing providers of opinions because of the increased
potential liability after the recent corporate governance scandals. However, the Securities
Exchange Commission (SEC) adoption of Regulation Fair Disclosure in October 2000, may have
reduced the value of fairness opinions. Eleswarapu, Thompson, Venkataraman (2004) have
found that information asymmetry declined following the SEC’s adoption of Regulation Fair
Disclosure in October 2000, concluding that “the SEC appears to have diminished the advantage
of informed investors.” If the SEC’s adoption of Fair Disclosure has reduced the potential value
of fairness opinions and then we would expect there will be fewer fairness opinions sought
cateris paribus following October 2000.6
The change in percentage of firms seeking fairness opinions on a yearly basis roughly
corresponds with change in the number of acquisitions announcements per year as reported in
Figure 3. Over the entire sample period 12 percent of acquiring firms announcing acquisitions
obtained fairness opinions compared with 31 percent of the targets.
6. Determinants of Fairness Opinions
Table 3 summarizes the results of estimating binary logit regression models for
dependent variables that record whether or not acquirers and targets obtained fairness opinions or
some form of financial advice. All of the coefficients in this and the following table represent
6 The authors are currently investigating which of these is the reason for the decrease in fairness opinions after 2000.

15
changes in the log of the odds ratio in favor of a firm using a fairness opinion or other financial
advice when the independent variable changes by one unit. The values are, consequently, not as
easily interpretable in magnitude as “normal” regression coefficients. Fortunately, the signs and
significance levels of the individual coefficients, shown as p-values in the table, and the
characteristics of the overall regression are the more important results. In Tables 2 and 3 we
have chosen to show only a single overall goodness-of-fit measure, McFadden’s R-squared. We
choose this measure because of its ease of interpretation as an R-squared showing the relative
explanatory power of the equation and its widespread acceptance as a valid measure.7
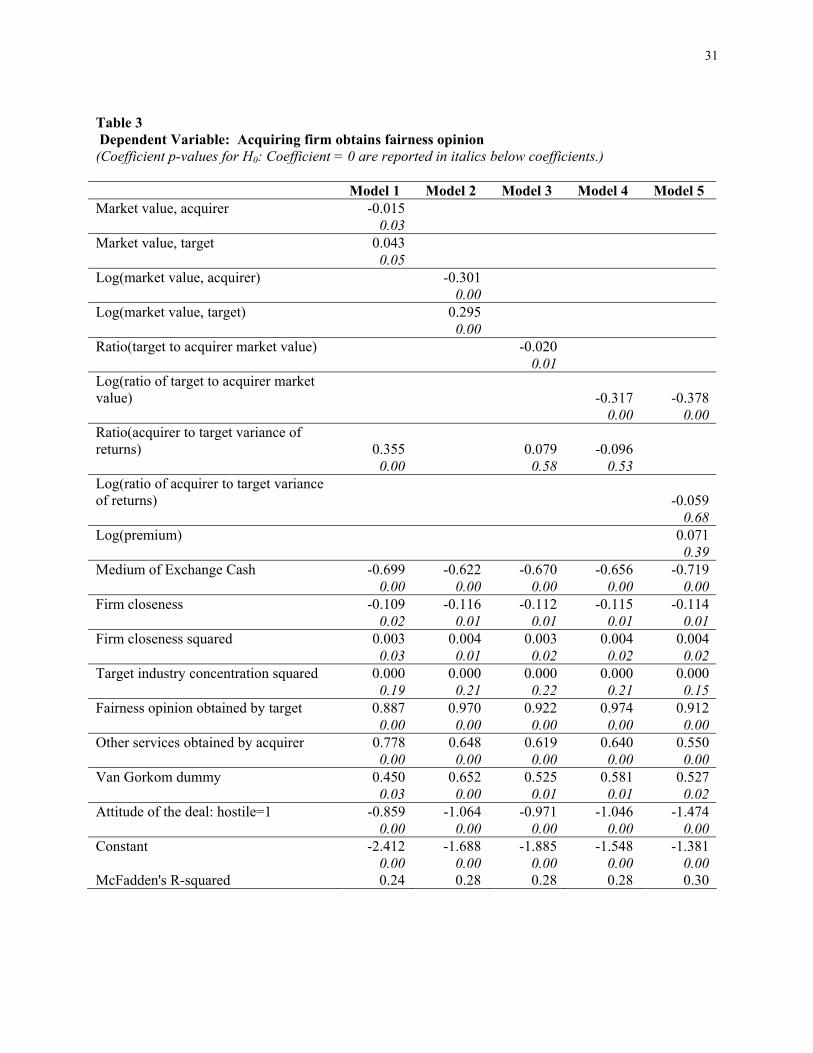
Model 1 in Table 3 presents the results for fairness opinions obtained by acquiring firms.
Many of the signs are as expected and most of the variables are highly significant as indicated by
the low p-values. Thus a number of our basic hypotheses regarding the major determinants of the
decisions of acquirers to obtain a fairness opinion are supported by the data. As expected, the
effect of the size of the target firm, as measured by market value, is positive and significant,
supporting the hypothesis that information is more valuable when there is more value at stake. In
addition we find that the effect of the size of the acquiring firm, also measured by market value,
is negative and significant. This may indicate that larger acquirers are simply less concerned
about the costs of acquisitions of any given size. In consumer demand theory this phenomenon is
known as the budget effect: the smaller the proportion of expenditure on an item is in a
consumer’s overall budget, the lower the consumer’s sensitivity to the expenditure.
7 Many aggregate measures of goodness of fit have been proposed for logit regressions and statistical software packages often present a number of them. William H. Green is among the econometricians who recommend the use of McFadden’s R-squared. (William H. Greene, Econometric Analysis, 4th ed., Prentice-Hall Englewood Cliffs, N.J. 2000) All of the equations are highly significant according to a variety of measures. For example, the p-values of the likelihood ratio statistics for all of the equations are 0.

16
The information asymmetry variables have mixed effects in Model 1.We find that the
relative volatility of excess returns for the two firms has a positive and significant effect on the
probability of obtaining a fairness opinion. We interpret this result as showing that firms that
have experienced more volatility (and for whom the market assessment is that the market has
less relative information about them) are more willing to incur the cost of obtaining a fairness
opinion because they do want to negatively impact their volatility further through an unwise
acquisition. Information asymmetry is greater when firms are more dissimilar or when they are
not “close” according to our measure. As expected, the closer firms are to each other the lower is
the probability of obtaining a fairness opinion. The closeness measure was also found to have a
nonlinear effect: its negative effect on the probability obtaining a fairness opinion diminishes as
the distance between the firms increases, as shown by the positive sign on closeness squared.
The closeness results may also be interpreted as indicating that firms contemplating horizontal
mergers are more likely to seek fairness opinions than firms involved in vertical or conglomerate
mergers.
Information asymmetry is also expected to increase in more concentrated industries in
which one of the results of market power may be less of a need to reveal information. The
positive sign in Model 1’s results shows that industry concentration in the target firm’s industry
does increase the probability of an acquirer paying for the additional information provided by a
fairness opinion. The variable is squared to reflect a nonlinear effect of increasing concentration.8
The variable’s p-value is only .2171, indicating insignificance at any of the usual significance
8 A Hirshman-Herfindahl Index (HHI) is often used as a measure of concentration. HHI captures the nonlinear nature of the effect of rising concentration by using the square of market shares. HHI values are sometimes computed using only the data in Compustat, which contains data only for exchange listed firms. We felt that being able to use concentration ratios based on complete data for all firms in all industries was more important than not using HHI.

17
levels. However, because of the theoretical support for the variable, its correct sign, and it’s z-
value exceeding one, we choose to retain it in the equation.
As expected the variable which designates that a transaction will be completed with a
cash (or cash-like) payment as the Medium of Exchange has a negative and significant sign
showing that when the value of the payment component of a transaction is certain, there is a
reduced probability of a fairness opinion being obtained. This effect is independent of the market
value of the transaction as indicated by a low correlation between the target’s market value and
the use of cash. The results for the Attitude of the Deal being “Hostile” according to the SDC
data are not as hypothesized: instead we adopt an alternative explanation that our negative and
significant coefficient indicates that, when a transaction is hostile, the acquirer may have
committed to gain control by purchasing the assets and value is no longer an issue to the
acquirer. In this case the acquirer does not need a fairness opinion to help with the decision.
In the positive and significant coefficient for Other Financial Advice Obtained, we find
evidence of complimentarity rather than the substitutability among types of information that we
had hypothesized. It appears that, when acquirers obtain other kinds of financial advice, they are
more likely to obtain a fairness opinion. There may be a behavioral interpretation of this result as
well: more risk-averse acquirers can attempt to reduce risk as much as possible by obtaining as
much information as possible including not only fairness opinions but also other kinds of
financial advice. The positive and significant value for the coefficient on Fairness Opinion
Obtained, Target may be evidence that, to some extent, there is symmetry in the need for
information in some transactions such that whatever the circumstances are which compel target
firms to obtain fairness opinions, the same circumstances may also motivate acquirers to obtain
fairness opinions. For example, when general market conditions produce a high degree of

18
uncertainty regarding the future value of a target, both the target itself and the acquirer will be
more likely to obtain a fairness opinion.
The final variable in Model 1 is the dummy variable which divides the sample time
period into pre- and post- the Smith v. Van Gorkom decision, indicated by the Van Gorkom
Dummy variable. The finding that it is positive and significant (at the 6.6% level) is as expected:
following the Van Gorkom decision, boards of directors have become less willing to make
merger and acquisition decisions without a formal fairness opinion. However, the expectation
that, because Smith v. Van Gorkom was decided in a Delaware court, this effect would be
especially strong for firms incorporated in Delaware was not supported by the data. Dummy
variables for Delaware incorporation for the acquirer, for the target and for both were all found
to be insignificant in all models. We believe that there are several reasons for this finding. First,
the Van Gorkom decision has been used outside of Delaware and thus it is of significance to
firms not incorporated in Delaware. Westlaw shows it cited in 90 non-Delaware cases since the
year of the decision (1985). Second, Van Gorkom's primary holding inspired a Delaware statute
the following year that actually superseded it and then as many as 36 other states followed suit
with similar statutes. Finally, a number of states have adopted Delaware statutory or decisional
law on corporations and, hence, would automatically follow Van Gorkom or the Delaware
statute without explicit action.
After examining the results of estimating Model 1, a number of alternative specifications
were considered. An obvious alternative measure for the market values is relative market value,
measured as the size of the acquirer relative to the size of the target which also provides a way to
combine these effects. Table 3 also shows the results of several alternative specifications for
Model 1. In Table 3, Model 3 shows the results of using the ratio of the two market values in the
19
specification. As can be seen, the result is that the relative value measure is insignificant and that
the R-squared value falls as well. However, as seen in Model 4 when the log of the relative
market value measure is used, the coefficient is significant and the R-squared value improves as
well. When the two market values are entered separately as logs, the variable representing the
relative volatility of returns becomes insignificant. When it is dropped from the equation, the
result is Model 2. Model 2 has the highest R-square of any of the alternative specifications tried
for Model 1. We prefer Model 1’s specification only because the relative volatility measure has
such strong theoretical justification. In Model 5 we show an alternative which utilizes the merger
premium and the log of the ratio of excess returns. The latter is highly significant (with a p-value
of .01) just as it was in level form in three of the first four models. However, the merger
premium is not significant in this equation, nor was it found to be significant in any of the other
equations for acquirer fairness opinions.
Other variables that were introduced into the equations but were found to either have no
meaningful significance or, when introduced as alternative measures of concepts already in the
model, were found not to produce as strong results. The level of annual aggregate merger
activity, as measured by the number of transactions among the 7818 in our sample, was found
not to be significant in any of the specifications. The book value of assets is an alternative
measure of firm size that was entered into the equations but did not provide as much explanatory
power as market value. We attempted to use industry dummy variables as these have often been
found to be significant conditioning variables in other studies. We used Fama and French’s
industry definitions and introduced a full set of dummy variables into the regressions but found
them to be insignificant as a group. In fact, only 2 individual industries had even modest
significance. For this reason we omitted the industry dummies from the models reported herein.

20
We also attempted to use the Fama and Frecnch industries to obtain an alternative
measure of closeness. We defined a dummy variable that had a value of 1 if both the acquirer
and the target were from the same Fama-French industry and 0 otherwise, but the results were
that this variable had less explanatory value in the models than the combination of our Closeness
and Closeness-squared variables.
We attempted to introduce either of the time variables identified in section 3, the year of
the transaction and a continuous time variable for the days within the period, but neither was
found to contribute any significance to the explanatory power of the equations.
Table 4 presents results of estimating the models for the decision of the target firm to
obtain a fairness opinion. The models whose estimation results are in Table 4 parallel those for
acquirers in Table 3. Again the alternative models represent experiments with the functional
form of the regression equations, especially regarding whether the two firm size measures should
enter separately or as a ratio with both forms either linear or logged. In contrast to the acquirer
models, the target models do not provide support for many of the theoretical hypotheses. Perhaps
this should not be surprising given that the distribution of the asymmetric information in the
market favors the target firms. However, this consideration should also lead target firms to less
frequently obtain fairness opinions while the observed distribution goes the other way. Only 12%
of acquirers and over 30% of targets obtained fairness opinions. Examining the results variable
by variable in an attempt to gain an understanding of why the target models do not work well is
not very revealing. None of the five models in Table 4 has significant coefficients for both
market value and the ratio of excess returns. Probably an as yet undiscovered combination of
these concepts needs to be found. Some results are very surprising, such as the failure of the cash
transaction variable to contribute as it did for the acquirer models. Similarly, it appears that

21
targets are unconcerned about the ramifications of the Van Gorkom decision since it is not
significant in any of the models. The asymmetric information variables, closeness and
concentration appear to have no effect on the targets’ decisions to obtain fairness opinions. There
are only two consistently significant explanatory variables. The first is the complimentary input
variable, indicating that other financial services were obtained by the target. The second is the
indicator that there are as-yet unmeasured general conditions affecting the firm value, of which
both acquirer and target are aware, as measured by a fairness opinion being obtained by the
acquirer. Given the much less significant results it is not surprising that the McFadden R-squared
values in Table 4 are also significantly lower, the largest being only .18 whereas in Table 3
Model 2 has an R-squared of .29.
Are fairness opinions really a special kind of information not contained in other types of
information that firms can obtain? We have attempted to address this question. The SDC
database records the numbers of financial advisors listed by both acquiring and target firms. It is
possible that this kind of financial advice is a substitute for a formal fairness opinion. In our
sample almost half (49.5%) of all acquiring firms that had any information of this type listed
financial advisors whereas only 12.1% obtained a fairness opinion. Because a small number of
firms obtained fairness opinions and did not list other financial advisors, the total percentage of
acquiring firms with either a fairness opinion or a financial advisor rises to 50.8%. The figures
for target firms are: 31.1% fairness opinions, 71.8% financial advisors and 71.9% either.
To get an idea of whether the inclination of firms to obtain any kind of financial services,
including but not limited to fairness opinions, is different from their decisions regarding fairness
opinions alone, the models in Table 5 were estimated. In this case both the models for the
acquirers and for the targets are better in some ways that the models for targets shown in Table 4

22
but neither is as good as the acquirer models in Table 3. Surprisingly, Model 12 for targets has a
higher R-squared value than Model 11 for acquirers. Models 11 and 12 also exhibit some curious
signs, such as the positive value of cash for target firms, although this result might indicate that
the when cash is going to be received, and there is no possible additional upside gain following
the closing of the transaction, the target may want to obtain some additional assurances that full
value is being received. Such behavior could be revealing a bias on the part of targets to believe
that noncash receipts are likely to appreciate in value. In both Models 11 and 12 the Van
Gorkom dummy variable is significant indicating that, while the Van Gorkom decision addressed
only fairness opinions in a narrow sense, it’s broader implications have been to induce a higher
level of consumption of financial advisory services of all kinds.
7. Results
Our results show that for the acquiring firm in an acquisition, the likelihood of
purchasing fairness opinions is influenced significantly by (1) the market values of the acquirer
and the target firm, (2) the volatility of excess returns of both firms, (3) whether or not the
transaction is a “cash” deal, (3) the degree of asymmetric information as measured by the
similarity of the acquirer and target firms, (4) the amount of monopoly power the target firm has,
(5) whether the acquisition is “hostile,” and (6) whether other financial advisory services have
been purchased by either firm. Finally, strong evidence is found indicating that (7) the behavior
of acquiring firms, whether incorporated in Delaware or not, has been significantly altered since
the 1985 Van Gorkom v. Smith decision by a Delaware court regarding fairness opinions. Our
results for target firms are not as strong as those for acquirers, nor are the results for financial
advisory services more broadly defined.

23
8. Work in Progress
The results reported above are encouraging, especially those for the acquirers. More
systematic exploration of alternative model specifications and variable forms will probably be
productive even for acquirers. Considerable work is needed to refine a model for targets to the
point of having results as reliable and reasonable as those for acquirers. Fruitful work can also be
done to tie the models in this paper more directly to those in the information asymmetry
literature. Further exploration of the legal and corporate governance aspects (board structure,
etc.) also seems warranted.
The authors are continuing to pursue each of the above issues and welcome criticism and
comments.

24
9. References
Bebchuk , Lucian Arye and Marcel Kahan, 1989, Fairness Opinions: How Fair Are They and What Can Be Done About It?, Duke Law Review, 29-45.
Berger, Philip G. and Eli Ofek, 1995, Diversification’s Effect on Firm Value, Journal of
Financial Economics, 39-65. Bizjak, J., J. Brickley, and J. Coles, 1993, “Stock-based Incentive Compensation and Investment
Behavior,” Journal of Accounting and Economics 16, 349-372. Boone, Audra, Laura Casarer Field, Jonathan M. Karpoff and Charu G. Raheja, 2004, The
Determinants of Corporate Board Size and Composition: An Empirical Analysis, Working paper College of William and Mary.
Bowers, Helen M., 2002, Fairness Opinions and The Business Judgment Rule: An Empirical
Investigation of Target Firms’ Use Of Fairness Opinions, Northwestern University Law Review, 567-578.
Dierkens Nathalie, 1991, Information Asymmetry and Equity Prices, Journal of Financial and
Quantitative Analysis, 191-199. Eleswarapu, Venkat R., Rex Thompson, and Kumar Venkataraman, 2004, The Impact of
Regulation Fair Disclosure: Trading Costs and Information Asymmetry, Journal of Financial and Quantitative Analysis, 209-25.
Elson, Charles M., 1995. The Duty Of Care, Compensation, And Stock Ownership, University
of Cincinnatti Law Review, 649-677. Fama, Eugene F. and Kenneth R. French, 1997, The Industry Costs of Equity, Journal of
Financial Economics, 153-193. Fama, Eugene F. and Kenneth R. French, 1995, Size and Book-to-Market Factors in Earnings
and Returns, Journal of Finance, 131-55. Fan, Joseph P. H. and Larry H. P. Lang, 2000, The Measurement of Relatedness: An Application
to Corporate Diversification, Journal of Business, 629-60. Frankel, Richard and Xu Li, 2004, Characteristics of a Firm's Information Environment and the
Information Asymmetry between Insiders and Outsiders, Journal of Accounting and Economics, 229-59.
Gaver, J. and K. Gaver, 1993, “Additional Evidence on the Association Between the Investment
Opportunity Set and Corporate Financing, Dividend, and Compensation Policies,” Journal ofAccounting and Economics 16, 125-160.

25
Haire, M. Breen, 1999, Comment, The Fiduciary Responsibilities Of Investment Bankers In
Change-Of-Control Transactions: In Re Daisy Systems Corp., New York University Law Review, 277- .
Jensen, Michael C.,1986, Agency Costs Of Free Cash Flow, Corporate Finance, And Takeovers,
American Economic Review, 323-29. Kahle, Kathleen M. and Ralph A. Walkling, 1996, The Impact of Industry Classification on
Financial Research, Journal of Financial and Quantitative Analysis, 309-335. Kole, S., 1997, “The complexity of compensation contracts,” Journal of Financial Economics
43, pp 79-104. Lang, Larry H. P. and Rene M. Stulz, 1994, Tobin's q, Corporate Diversification, and Firm
Performance, Journal of Political Economy, 1248-80. Lehn, Kenneth, Sukesh Patro and Mengxin Zhao, 2003, Determinants of the Size and Structure
of Corporate Boards: 1935-2000, Working Paper University of Pittsburgh. Moeller, Sara B., Frederik P. Schlingemann and Rene M. Stulz, 2004, Do Acquirers With More
Uncertain Growth Prospects Gain Less From Acquisitions? Forthcoming Journal of Finance.
Moeller, Sara B., Frederik P. Schlingemann and Rene M. Stulz, 2004, Wealth Destruction on a
Massive Scale? A Study of Acquiring-Firm Returns in the Recent Merger Wave, Forthcoming Journal of Finance.
Rhodes-Kropf , Matthew David Robinson and S. Viswanathan, 2001, Valuation Waves and
Merger Activity: The Empirical Evidence, Working Paper Columbia University. Rhodes-Kropf , Matthew and S. Viswanathan, 2004, Market Valuation And Merger Waves,
Forthcoming Journal of Finance. Shaw, Bill and Edward J. Gac, 1995, Fairness Opinions In Leveraged Buy Outs: Should
Investment Bankers Be Directly Liable To Shareholders?, Securities Regulation Law Review, 293- .
Shleifer, Andrei and Robert W. Vishny, 2003, Stock Market Driven Acquisitions, Journal of
Financial Economics, 295-311. Smith, C. and R. Watts, 1992, The Investment Opportunity Set and Corporate Financing,
Dividend, and Compensation Policies, Journal of Financial Economics 32, 263-292.

26
Walker, M. Mark, 2000, Corporate Takeovers, Strategic Objectives, and Acquiring-Firm
Shareholder Wealth, Financial Management, 53-66. Yermark, D. 1995, Do Corporations Award CEO Stock Options Effectively? Journal of
Financial Economics 39, 237-269.

27
Percentage of firms obtaining fairness opinions by year 1980-2002
0%
10%
20%
30%
40%
50%
60%
70%
1980 1982 1984 1986 1988 1990 1992 1994 1996 1998 2000 2002
Announcement year
Acquirers Targets
Number of firms obtaining fairness opinions by year 1980-2002
0
20
40
60
80
100
120
140
160
180
1980 1982 1984 1986 1988 1990 1992 1994 1996 1998 2000 2002
Announcement year
Acquirers Targets
Figure 1
Figure 2
28
Distribution of acquisition announcements by year
0100200300400500600700
1980 1982 1984 1986 1988 1990 1992 1994 1996 1998 2000 2002
Year
Figure 3

29
Table 1 Distribution of acquisition announcements by Fama and French (1997) industry groups
All acquisition announcements from 1980-2002 (Source: SDC)
All acquisition announcements included in regression results
Acquirers Targets Acquirers Targets Industry N % N % N % N % Agricrulture 15 0.19% 22 0.28% 1 0.07% 6 0.41%Food Products 99 1.27% 75 0.96% 34 2.31% 24 1.63%Candy and Soda 14 0.18% 16 0.20% 4 0.27% 5 0.34%Alcoholic Beverages 11 0.14% 10 0.13% 5 0.34% 5 0.34%Tobacco Products 5 0.06% 1 0.01% 0 0.00% 1 0.07%Recreational Products 57 0.73% 54 0.69% 10 0.68% 12 0.82%Entertainment 122 1.56% 133 1.70% 21 1.43% 17 1.15%Printing and Publishing 44 0.56% 39 0.50% 15 1.02% 5 0.34%Consumer Goods 124 1.59% 104 1.33% 42 2.85% 31 2.11%Apparel 34 0.43% 44 0.56% 5 0.34% 10 0.68%Healthcare 211 2.70% 226 2.89% 25 1.70% 28 1.90%Medical Equipment 170 2.17% 194 2.48% 30 2.04% 46 3.13%Pharmaceutical Products 213 2.72% 172 2.20% 51 3.46% 40 2.72%Chemicals 102 1.30% 80 1.02% 29 1.97% 25 1.70%Rubber and Plastic Products 45 0.58% 52 0.67% 11 0.75% 19 1.29%Textiles 34 0.43% 36 0.46% 8 0.54% 6 0.41%Construction Materials 98 1.25% 113 1.45% 44 2.99% 35 2.38%Construction 65 0.83% 59 0.76% 10 0.68% 8 0.54%Steel Works, Etc. 76 0.97% 60 0.77% 15 1.02% 6 0.41%Fabricated Products 12 0.15% 19 0.24% 6 0.41% 7 0.48%Machinery 193 2.47% 164 2.10% 54 3.67% 56 3.80%Electrical Equipment 68 0.87% 56 0.72% 17 1.15% 11 0.75%Miscellaneous 0 0.00% 0 0.00% 0 0.00% 0 0.00%Automobiles and Trucks 82 1.05% 62 0.79% 21 1.43% 17 1.15%Aircraft 53 0.68% 37 0.47% 20 1.36% 12 0.82%Shipbuilding, Railroad Equipment 9 0.12% 14 0.18% 1 0.07% 6 0.41%Defense 15 0.19% 14 0.18% 7 0.48% 6 0.41%Precious Metals 24 0.31% 26 0.33% 5 0.34% 6 0.41%Nonmetal Mining 23 0.29% 14 0.18% 7 0.48% 3 0.20%Coal 5 0.06% 5 0.06% 0 0.00% 0 0.00%Petroleum and Natural Gas 340 4.35% 337 4.31% 65 4.42% 67 4.55%

30
Table 12 (cont’d) Distribution of acquisition announcements by Fama and French (1997) industry groups
All acquisition announcements from 1980-2002 (Source: SDC)
All acquisition announcements included in regression results
Acquirers Targets Acquirers Targets Industry N % N % N % N % Utilities 264 3.38% 223 2.85% 48 3.26% 39 2.65%Telecommunications 381 4.87% 302 3.87% 47 3.19% 36 2.45%Personal Services 49 0.63% 42 0.54% 9 0.61% 9 0.61%Business Services 676 8.65% 802 10.27% 136 9.24% 158 10.73%Electronic Equipment 266 3.40% 310 3.97% 60 4.08% 75 5.10%Measuring and Control Equipment 89 1.14% 114 1.46% 23 1.56% 38 2.58%Business Supplies 67 0.86% 61 0.78% 27 1.83% 23 1.56%Shipping Containers 11 0.14% 17 0.22% 2 0.14% 3 0.20%Transportation 147 1.88% 163 2.09% 37 2.51% 42 2.85%Wholesale 188 2.40% 203 2.60% 26 1.77% 26 1.77%Retail 254 3.25% 312 3.99% 50 3.40% 55 3.74%Restaurants, Hotel, Motel 151 1.93% 165 2.11% 19 1.29% 26 1.77%Banking 1888 24.15% 1929 24.69% 258 17.53% 269 18.27%Insurance 269 3.44% 183 2.34% 42 2.85% 27 1.83%Real Estate 60 0.77% 63 0.81% 9 0.61% 5 0.34%Trading 453 5.79% 386 4.94% 51 3.46% 45 3.06% 7818 100% 7812 100% 1472 100% 1472 100%
Table 2: Summary Statistics for Variables Included in the Main Reported Regressions
Mean
(N=1472)Standard Deviation Minimum Maximum
Market Value, Acquirer (Billions of $) 7.8530 329.4781 0.0177 585.0000Market Value, Target (Billions of $) 0.6585 28.8130 0.0150 64.7169Variance of Returns, Acquirer 0.0259 0.0149 0.0074 0.1484Variance of Returns, Target 0.0367 0.0222 0.0085 0.2819Attitude of the Deal: Hostile 0.06 0.23 0 1Medium of Exchange: Cash 0.3578 0.4795 0 1Firm Closeness 7.6265 12.3529 0.0000 30.0000Target Industry Concentration 15.0343 12.4019 0.6000 67.6000Fairness Opinion Obtained, Acquirer 0.1216 0.3269 0 1Other Financial Advisory Obtained, Acquirer 0.5802 0.4937 0 1Fairness Opinion Obtained, Target 0.3376 0.4731 0 1Other Financial Advisory Obtained, Target 0.3376 0.4004 0 1Van Gorkom Dummy 0.8845 0.3197 0 1
31
Table 3 Dependent Variable: Acquiring firm obtains fairness opinion (Coefficient p-values for H0: Coefficient = 0 are reported in italics below coefficients.) Model 1 Model 2 Model 3 Model 4 Model 5 Market value, acquirer -0.015 0.03 Market value, target 0.043 0.05 Log(market value, acquirer) -0.301 0.00 Log(market value, target) 0.295 0.00 Ratio(target to acquirer market value) -0.020 0.01 Log(ratio of target to acquirer market value) -0.317 -0.378 0.00 0.00 Ratio(acquirer to target variance of returns) 0.355 0.079 -0.096 0.00 0.58 0.53 Log(ratio of acquirer to target variance of returns) -0.059 0.68 Log(premium) 0.071 0.39 Medium of Exchange Cash -0.699 -0.622 -0.670 -0.656 -0.719 0.00 0.00 0.00 0.00 0.00 Firm closeness -0.109 -0.116 -0.112 -0.115 -0.114 0.02 0.01 0.01 0.01 0.01 Firm closeness squared 0.003 0.004 0.003 0.004 0.004 0.03 0.01 0.02 0.02 0.02 Target industry concentration squared 0.000 0.000 0.000 0.000 0.000 0.19 0.21 0.22 0.21 0.15 Fairness opinion obtained by target 0.887 0.970 0.922 0.974 0.912 0.00 0.00 0.00 0.00 0.00 Other services obtained by acquirer 0.778 0.648 0.619 0.640 0.550 0.00 0.00 0.00 0.00 0.00 Van Gorkom dummy 0.450 0.652 0.525 0.581 0.527 0.03 0.00 0.01 0.01 0.02 Attitude of the deal: hostile=1 -0.859 -1.064 -0.971 -1.046 -1.474 0.00 0.00 0.00 0.00 0.00 Constant -2.412 -1.688 -1.885 -1.548 -1.381 0.00 0.00 0.00 0.00 0.00 McFadden's R-squared 0.24 0.28 0.28 0.28 0.30

32
Table 4 Dependent Variable: Target firm obtains fairness opinion (Coefficient p-values for H0: Coefficient = 0 are reported in italics below coefficients.) Model 6 Model 7 Model 8 Model 9 Model 10 Market value, acquirer 0.000 0.70 Market value, target 0.007 0.62 Log(market value, acquirer) 0.068 0.02 Log(market value, target) -0.040 0.25 Ratio(target to acquirer market value) 0.000 0.05 Log(ratio of target to acquirer market value) 0.063 0.036 0.02 0.24 Ratio(acquirer to target variance of returns) 0.105 0.044 0.035 0.02 0.41 0.50 Log(ratio of acquirer to target variance of returns) 0.125 0.228 0.01 0.03 Log(premium) -0.099 0.16 Medium of Exchange Cash 0.036 0.044 0.039 0.037 -0.025 0.65 0.58 0.63 0.65 0.76 Firm closeness -0.006 -0.005 -0.004 -0.006 -0.008 0.79 0.84 0.87 0.81 0.74 Firm closeness squared 0.000 0.000 0.000 0.000 0.000 0.83 0.86 0.92 0.84 0.73 Target industry concentration squared 0.000 0.000 0.000 0.000 0.000 0.73 0.65 0.76 0.64 0.60 Fairness opinion obtained by acquirer 0.935 0.997 0.936 1.001 0.959 0.00 0.00 0.00 0.00 0.00 Other services obtained by target 2.156 2.106 2.154 2.133 2.037 0.00 0.00 0.00 0.00 0.00 Van Gorkom dummy 0.031 -0.017 0.039 -0.006 0.039 0.81 0.90 0.76 0.97 0.77 Attitude of the deal: hostile=1 -0.202 -0.146 -0.198 -0.127 0.015 0.26 0.43 0.26 0.48 0.94 Constant -2.671 -3.006 -2.694 -2.677 -2.529 0.00 0.00 0.00 0.00 0.00 McFadden's R-squared 0.18 0.18 0.18 0.18 0.15

33
Table 5 Dependent Variable: Acquiring and target firm obtains fairness opinion or any financial advisory services (Coefficients p-values for H0: are reported in parenthesis.)
Acquirer Model 11
Target Model 12
Market value, acquirer -0.0126
(0.00) 0.1560(0.05)
Market value, target 0.1300 (0.00)
-0.3490(0.00)
Ratio of target to acquirer σ2 excess returns 0.4964 (0.01)
0.2956(0.01)
Medium of exchange: cash=1 -0.1420
(0.26) 0.4662 (0.00)
Firm closeness 0.0118 (0.76)
-0.0316(0.49)
(Firm Closeness)2 -0.0002
(0.85) 0.0013(0.40)
(Target Industry Concentration) 2 0.0000 (0.96)
0.0004 (0.03)
Fairness opinion or any financial advisory services by other firm 2.0616 (0.00)
2.1083(0.00)
Van Gorkom dummy 0.4002 (0.03)
0.7129(0.00)
Attitude of the deal: hostile=1 -0.02
(0.95) 0.83
(0.04)
Constant -2.2702
(0.00) -1.1994
(0.00)McFadden's R-Squared 0.1795 0.2255