hefting for a maximum distance throw: a smart … for a maximum distance throw: a smart perceptual...
TRANSCRIPT

Hefting for a Maximum DistanceThrow: A Smart PerceptualMechanism*
Geoffrey P. Bingham,t R. C. Schmidt,tt and Lawrence D.Rosenblumttt
Preferred objects for throwing to a maximum distance were selected by heftingobjects varying in size and weight. The weight of preferred objects increased withincreasing size. The scaling relation between weight and volume of preferredobjects reproduced that found in studies on the size-weight illusion. When objectswere thrown to maximum distances, preferred objects were thrown the farthest,showing that participants had detected a functionally constrained property ofthese objects. Throwing was analyzed as a smart device and compared to heftingas a smart perceptual mechanism. Two strategies for conveying high kineticenergy to the projectile were investigated in two experiments in which thekinematics of hefting with Light, Preferred, and Heavy objects was recorded andanalyzed. Changes in tendon lengths occurring when objects of varying size weregrasped were found to correspond to changes in stiffness at the wrist. Hefting withPreferred objects was found to produce invariant phase relations betweenmovements at the wrist and elbow. This pattern of results corresponded to anoptimal relation at peak kinetic energy between 'coupling' and 'non-coupling'terms of the kinetic energy equation for the hefting machine. This researchillustrates a methodological paradigm for the study of perceptual properties.The paradigm uses a strong functional context to guide research in place of naturallanguage categories. Comparison is made to size-weight illusion methodology.
INTRODUCTION
A task familiar to many from childhood is that of standing on a beach, in a field, oron a cliff and selecting, by hefting, the stone that can be thrown the farthest distance.Like the perfect skipping stone, the optimal throwing stone evokes an ardent glow ofconfidence in one's apility to discover and use this appealingly simple, yet distinct tool.What is the optimal thrOWing stone? Assuming a spherical shape and a fairlyhomogeneous mass distribution, the relevant object properties are size and weight.What is the appropriate configuration of size and weight and how is it detennined? Arewe truly able to select froni objects varying in size and weight those optimal forthrowing to a maximum distance? If so, how are we able to do this?
Haskins Laboratories
Status Report on Speech Research151
SR-95/96
1988

152
The human perception/action system has been described as a system thattemporarily assembles smart. special purpose. deterministic machines over relevantphysical properties of the organism and the environment to perform specific tasks(Bingham. in press; Fowler & Turvey. 1978; Kugler & Tuxvey. 1987; Saltzman & Kelso.1987; Solomon & Turvey. 1988). According to this approach. a stone for throwing wouldbe a component of a softly assembled throwing machine. For optimal performance. theprojectile's properties must be scaled to the remaining components of this task specificdevice according to its dynamical organiZation. How might the optimal configurationof projectile mass and size. as determined by the dynamics of throwing. be perceivedthrough hefting? Runeson (l977a) suggested that perceptual mechanisms are "smart...meaning that they take advantage of peculiar. task specific circumstances in theinterests of efficiency and reliability in task performance. Taking advantage of taskspecific circumstances often may be the only means of achieving successfulperformance (Bingham. in press). Hefting shares both anatomy and certain kinematic.and by :implication dynamic. properties with throwing. These common aspects couldprovide the circumstantial basis for "smart" perceptual organiZation. If hefting andthrOWing exhibit similar dynamical organization. then hefting could containinformation about the dynamiCS of throwing. In particular. hefting with an objectmight provide information about that object as a potential component of a thrOwingmachine. The required information would be. in part. about the mass of the potentialprojectile. Mass is a dynamic property (Bingham. 1988).
Perceptual information about dynamics must be mapped through the kinematics ofactions and events to spatial-temporal patterns that can be detected by the perceptualsystems (Bingham. 1987a. 1987b; 1988; in press; Rlmeson. 1977b: Runeson & Frykholm.1983). Information about the mass related properties of events resides in resultingpatterns of motion. For instance. Runeson and Frykholm (1983) demonstrated that theamount of weight being lifted by a person can be judged accurately given only visualapprehension of the pattern of lifting motions. Bingham (1987a) showed that visualjudgments of weight lifted in a one-arm curl reflected changes in the kinematic fonn oflifts represented in phase plane plots of the one degree of freedom motion. Bingham(1987b) showed that the fonn of trajectories on the phase plane allowed a variety ofboth animate and inanimate events to be identified where each event corresponded to aparticular dynamical organization producing a specifiC kinematic fonn.
Perception via the haptic system involves the kinematic specification of dynamicsno less than does the visual system (Bingham. in press). Hefting does not provideprivileged access to dynamic properties. The dynamic states of the muscles aremonitored through the kinematic states of so-called mechano-receptors. which arestretched or compressed by the forces impinging on them. For instance. paciniancorpuscles embedded in muscle respond to a change in their diameter. whereas Ruffinitype end organs in muscle or Golgi tendon organs respond to changes in length (Bloch &!berall. 1982; Lee. 1984). Among the perceptual systems. the haptic system in hefting isnotable for being accessible to kinematic measurement. Thus. we can examinekinematic properties of hefting in search of properties infonnative of the configurationof size and weight corresponding to optimal throwability.
The hefting of objects varying in size and weight has been studied frequently inpsychological laboratories. An old chestnut in the literature of perceptual psychologyis the size-weight "illUSion." The effect occurs when people hefting objects varying involume are asked to judge weight. For two objects of equal physical weight. the objectwith a larger volume will be judged as lighter. often substantially so. The effect can bedeSCribed alternatively as follows: For two objects of different volume to be judged ofequal apparent weight. the larger object must actually weigh more than the object withsmaller volume. This effect has been called an illusion because the relative weight ofobjects is misperceived. Alternatively. psychophysicists have suggested that thehuman perceptual system s:imply detects "heaviness" as a perceptual property
Bingham et aI.

153
corresponding to a specifIc nonlinear relation between the weight and the volume ofobjects being hefted (Cross & Rotk1n, 1975; Stevens & Rubin, 1970). Neithercharacterization, however, provides an account for the size-weight relation. How is itthat the human perceptual system detects this specific relation between size and weightof hefted objects?
Based on the observation that selecting the optimal stone to throw to a maximumdistance shares relevant object properties with tasks producing the size-weight effect,we deCided to investigate hefting for throwing using an experimental design similar tothat employed in the original size-weight Ulusion studies. Participants were asked toheft objects varying in both size and weight and to judge, for objects of a given size,preferred weights for throwing to a maximum distance. 1 In a second experiment, theobjects were thrown to maximum distances by participants in the hefting study todetennine whether preferred objects were optimal for throwing. Finally, in two moreexperiments, the kinematics and dynamics of hefting with the objects was recorded andanalyzed. The hypothesis was that the size-weight relation corresponds to aperceivable property produced by the functionally constrained dynamics of hefting andthrOWing.
EXPERIMENT 1: HEFTING FOR MAXIMUM DISTANCE THROWS
The first step was to perfonn a pilot study to check our intuition that people can selectthe optimal stone for thrOwing to a maximum distance. A set of stones varying in sizeand weight was collected. Maximal diameters varied between .015m and .10m; weightswere between .008 kgs and .500 kgs. Two of the authors tested their ability to select anoptimal stone by throwing the stones three times each to a maximum distance andexamining distances relative to those of stones selected beforehand as preferred.Throwing was perfonned on a football field conveniently marked for distance. Thelanding position of each stone was marked with a ticket of paper labeled with thestone's weight. In each case, the landing positions fonned a distribution on the fieldwith the preferred stone most often lying at the farthest distance. Distances generallydecreased as weights either increased or decreased from the preferred weight. Theresults of thiS pilot convinced us that the task was appropriate for study.
The results of the plIot indicate that, for each thrower, there is an object of optimumweight for thrOWing to a maxlmum distance. Plotting diStance as a function of weight,the curve would exhibit an extremum corresponding to the maximum distance at theoptimal weight. Progressively Ughter or heavier objects would be represented at pointsalong the curve falling progreSSively away from the extremum on either side. ThiSdistance function would renect perfonnance in the task of thrOWing objects to amaximum distance.
The perceptual question is whether throwers can perceive which weights are optimalin advance of throwing them. The plIot results suggest that the optimal weights areapprehended successfully. If indeed participants can perceive the optimum weights,then within the context of the perceptual task, the distance function must be replaced bya perceptual function with an extremum that corresponds to the extremum in thediStance function. The current experiments were perfonned to determine whether sucha perceptual function exists. If it does, then the existence of a mapping that preservesordinal scaling between the perfonnance function and the perceptual function isimplied.2
A Single distance function with an extremum corresponding to the optimal weightwas anticipated as weight was varied for objects of a given size. However, the size ofobjects was to be varied as well. The question was whether the optimum weight valuewould change with changes in object size. Would the location of the extremum over theweight axiS change? In Experiment 1, participants were asked to heft objects varying in
Hefting and Throwing

154
size and weight and to judge, for each size, the objects of optimal weight for throwing toa maximum distance.
Participants were asked to select their top three preferences in each size. Threepreferences were used as a more sensitive measure of preference. A measurementproblem arose because we were sampling the perceptual function diScontinuously withno prior lmowledge of the relative steepness or shallowness of the function on eitherside of the extremum. The question was whether the extremum would move up (ordown) the weight axis as the size of the objects was varied. If the extremum was lesspronounced, then discrete sampling of a shallow CUIVe might not pick up shifts in thelocation of the extremum induced by size changes. Using a weighted mean of the topthree preferences provided a broader sample more likely to reflect any shifts that mightoccur. Across participants, no regular pattern in the weights corresponding topreferences I, 2, and 3 was expected beyond potential shifts in their mean values.
Method
ApparatusThe experiments required spherical objects that varied in size and weight and that
were durable enough to Withstand impacts from maximum distance throws. Sphereswere approximated by cutting cuboctahedrons from blocks of high density styrofoam.A cuboctahedron is a semi-regular polyhedron that can be fonned by truncating thevertices of a cube. The result is a polyhedron with a total of fourteen faces, six squareand eight triangular, as shown in Figure la. This shape was chosen as providing areasonably good approximation to a sphere while affording precision and reliability insizing and shaping. Eight Objects were cut in each of four sizes with radii of .025m,.0375m, .05m, and .0625m. These sizes correspond roughly to kiwi frUit, apple,grapefruit, and cantaloupe size.
Figure 1. a) A cuboctahedron. b) The manner of hefting including the approximate range of motion inthe elbow and wrist.
Object weights were adjusted as follows. Each object was sliced in half. The centerwas scooped out symmetrically from each half and tightly packed with a stochasticallyhomogeneous mixture of clay and lead shot. The two halves were placed back together.
Bingham et al.

155
Then. each object was wrapped tightly with elastic tape. which slightly rounded thecomers and edges. The weight series within each size approximated a geometricprogression with Wn+1 = Wn x 1.33. The weights within each size are presented inTable 1. Weights across sizes were made to correspond to the extent allowed withinlimits set by the maximum possible weight for a given size.
TABLEt
Object Weightswithin Size
Radius (m) Obiect Weights (kl [)
.025 .004 .018 .028 .036 .059 .086 .122 .192
.0375 .012 .031 .051 .087 .133 .194 .300 .450
.05 .031 .051 .090 .122 .178 .294 .448 .717
.0625 .038 .052 .080 .119 .180 .300 .459 .700
ParticipantsEleven University of Connecticut undergraduates from a course in introductory
psychology participated in the experiment for course credit. Eight of the participantswere male. Three were female. Two of the males were left handed.Experimental Procedure
Participants were run individually in an experimental session lasting about 45minutes. At the beginning of each session. a set of anthropometric measures was takenincluding age. height. weight, hand span from outstretched thumb tip to fourth fingertip, hand length to the tip of the middle finger. palm width. index finger length, forearmlength. and arm length (Chaffin & Andersson, 1984).
Hefting and judgment were performed with the participant and expertmenterstanding on opposite sides of a 1 meter high table. An experimental assistant satnearby and recorded judgments. observations. and participant comments on anexperiment protocal sheet. The experimenter described to the participant the commonchildhood experience of standing on a beach and selecting a stone of optimal size andweight for throwing to a maximum distance. All participants indicated that they werefamiliar with this experience. Next. the expertmenter placed five different sizedstyrofoam cuboctahedrons on the table in order of increasing size. The sizes were thesame as described above together with an object of radius equal to .0125m or roughly.acorn size. This small object was added to avoid a potential floor effect in judgments.The participant was asked to judge visually the optimal size object for throwing to amaximum distance. The preferred object was indicated by pointing. Following this. theexperimenter described the hefting and judgment task.
From eight different objects of a given size. participants were asked to select in orderof preference three preferred objects for throwing to a maximum distance. As alreadydescribed. three preferences. as opposed to one. were used to provide greater sensitivityto possible variations in preferred weights over the different object sizes. The weightedmean of the three preferences was used as a measure of preferred weight in addition tothe first preference weights.
The same hefting and judgment procedure was repeated for each of the four differentobject sizes. The order of presentation of the different sizes was randomized over
Hefting and Throwing

156
participants. The participant was asked to turn his or her back to the table while theexper:trnenter removed the eight objects of a given size from a container and arrangedthem on the table in order of increasing weight from left to right. The participant thenturned to face the table and was asked to extend his or her preferred hand for heftingwith the palm up and the forearm level. Beginning with the lightest object andproceeding in order of increasing weight, the exper:trnenter placed each object in theparticipant's extended hand to be hefted.
Preceding the hefting and judgment trials. the experimenter demonstrated themanner in which hefting was to be performed. The object and hand were to be bouncedat the Wrist by a fairly gentle oscillation of the forearm about the elbow as shown inFigure lb. At least three bounces were to be performed on each hefting trial. A heftingtrial was completed by the exper:trnenter's removing the object from the participant'shand and replacing it in its position on the table. Once all eight objects of a size hadbeen hefted, the participant was allowed to select by pointing any of the objects forrepeated hefting. The number of repeated hefts was unrestricted. Participants typicallyperformed repeated hefts with those objects eventually chosen as preferred as well aswith the next lighter and the next heavier objects. When they had finished hefting,participants indicated their preferred three objects by pointing to them in the order ofpreference.
Once hefting and judgment was completed for all four sizes, the participant's firstpreference objects for each size were placed on the table in order of increasing size. Theparticipant hefted these using the same procedure as described above and was asked toselect three preferred objects for a maximum distance throw in order of preference. Theparticipant was asked then to demonstrate the method he or she would use to performthe throw. Following this, participants were asked for general comments concerningtheir experience of the task.Design
A two-way, 4 x 3 repeated measures design was used with eleven observations ineach cell. The first factor was size (.025m, .0375m, .05m. and .0625m). The secondfactor was preference (1st choice, 2nd choice. and 3rd choice). Both factors were withinsubjects.
Results and DiscussionAll of the participants found the task to be appealing and quite natural. In comments
made while performing the judgment task, participants tended to express strongpreferences for the objects that they judged to be optimal. The mean results acrossparticipants reproduced the pattern of the size-weight effect, namely. the qualitativeresult that weights judged of equal apparent heaviness increased over increasingvolume. Both first preference weights and mean preferred weights for throwingincreased over increasing volume. A mean preferred weight for each size was computedby weighting judgments according to preference. First preference weight was multipliedby 3, second preference by 2, and third preference by 1. The mean preferred weight foreach size is shown in Figure 2, where the increase in weight over increasing size isevident.
An analysis of variance (ANOVA) was performed on first preference weights with Size(.025m, .0375m, .05m, and .0625m) as a factor. Size was significant, F(3,30)=21.37,p<.OOL Weight increased with size. An ANOVA was performed also on weights for allthree preferences with Size and Preference (1st, 2nd, and 3rd choice) as factors. Size wassignificant, F(3,30)=33.59, p<.OO1. Preference was not significant. Weight againincreased with size. The lack of any consistent trend in preferences across partiCipantsindicated that no significant information was lost by using in scaling a mean acrossthree preferred weights as a measure more sensitive to variations in preferred weight.
Binghllm et aI.

157
The difference in mean preferred weight between succeeding size levels was muchsmaller for the two largest sizes than for the smaller sizes. Preceding from smallest tolargest object size, the differences between mean preferred weights were .054 kg, .085 kg,and .019 kg. The former differences were both significant, p<.05, in a Fisher post hoctest. However, the latter difference was not significant. This result suggests thatincreases in preferred weights were bounded. Because the increases in weight were afunction of increases in size, a bound on increases in weight must correspond to aparticular size of hefted object. This surmise is supported by the results obtained whenparticipants were asked how they would perform the throw with an optimal object.
Mean Preferred Weights
0.30
0.25
0.20-eo~-.. 0.15.:::eo....QJ
~ 0.10
0.05
0.000.0250 0.0375 0.0500 0.0625
Radius (rn)
Figure 2. Mean preferred weights selected by eleven participants for four different sizes of objects.Weight in kilograms. Size by radius in meters.
When asked how they would perform the throw, all participants indicated that theywould use a typical baseball style overhand throw. However, seven of the participantsspontaneously remarked that such a throwing style would be appropriate for all of thesizes except for the .0625m size. For the largest objects, these participants judged thateither a lob or shotput throwing style would be more suitable. This result indicates thatthe size and weight of the largest objects fall in the neighborhood of a critical pointwhere a transition between action modes is mandated. (See Bingham, in press, foradditional discussion of this point.) This boundary region would be an interesting andpotentially fruitful subject for future research.
When asked to select the optimal size object for throwing from visual inspectionalone, six of the participants chose the .0375m object and five chose the .025m object.At the end of the experiment, participants were asked to choose the optimal size objectonce again, but this time their first preference for weight was provided in each size and
Hefting and Throwing
158
participants were allowed to heft the objects in making their choice. In this case, six ofthe participants chose the .025m object and five chose the .0315m object. Overall. thetwo smaller sizes were judged consistently as optimal for long distance throwing. Thereis a distinct lower bound on preferred size. No participant choose the .0125m objectincluded in the visually examined set. Thus, the preferred sizes correspond to a judgedoptimum.
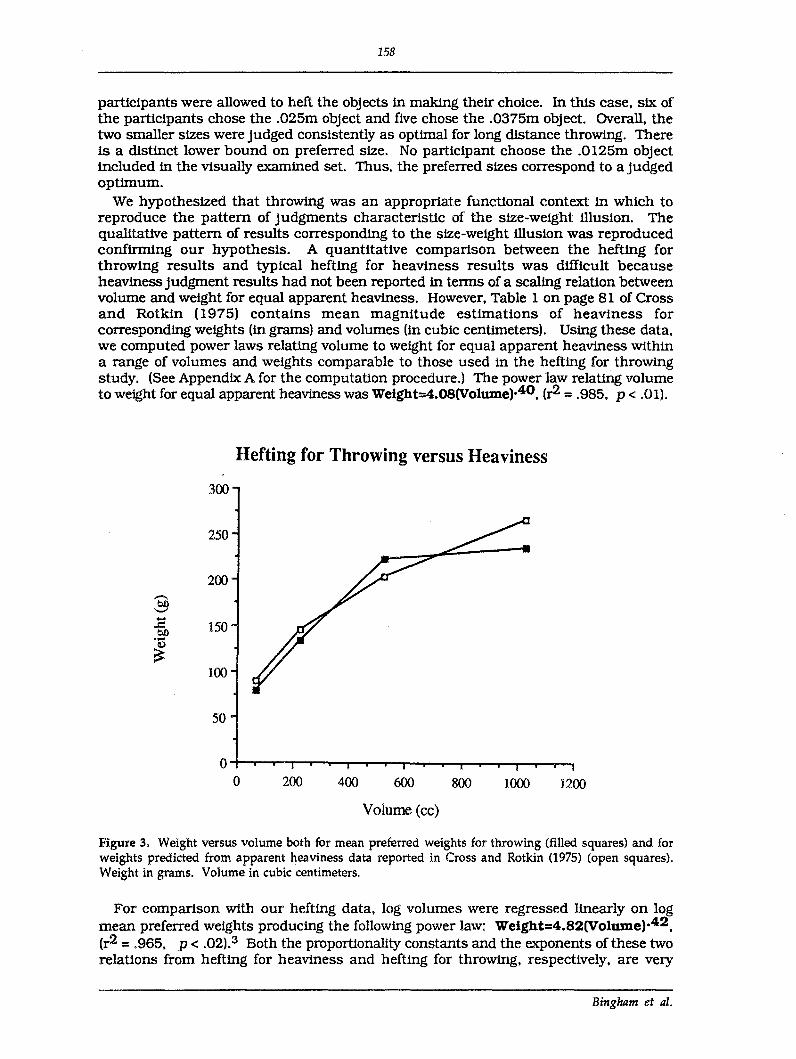
We hypothesized that throwing was an appropriate functional context in which toreproduce the pattern of judgments characteristic of the size-weight illusion. Thequalitative pattern of results corresponding to the size-weight illusion was reproducedconfirming our hypothesis. A quantitative comparison between the hefting forthrowing results and typical hefting for heaviness results was difficult becauseheaviness judgment results had not been reported in tenns of a scaling relation betweenvolume and weight for equal apparent heaviness. However. Table 1 on page 81 of Crossand Rotkin (1915) contains mean magnitude estimations of heaviness forcorresponding weights (in grams) and volumes (in cubic centimeters). Using these data,we computed power laws relating volume to weight for equal apparent heaviness Withina range of volumes and weights comparable to those used in the hefting for throwingstudy. (See Appendix A for the computation procedure.) The power law relating volumeto weight for equal apparent heaviness was Weight=4.08(Volume)·40. (r2 = .985. p < .01).
Hefting for Throwing versus Heaviness
250
200-b.Q-.....c: 150b.Q....~
100
50
00 200 400 600
Volume (cc)
800 1000 1200
Figure 3, Weight versus volume both for mean preferred weights for throwing (filled squares) and forweights predicted from apparent heaviness data reported in Cross and Rotkin (1975) (open squares).Weight in grams. Volume in cubic centimeters.
For comparison With our hefting data. log volumes were regressed linearly on logmean preferred weights prodUCing the follOWing power law: Weight=4.82(Volume)·42.(r2 = .965, p < .02).3 Both the proportionality constants and the exponents of these tworelations from hefting for heaviness and hefting for thrOwing. respectively, are very
Bingham et aI.

159
close in value showing that the scaling relation between volume and weight isessentially the same in both cases. To further illustrate this. the volumes of the fourobjects used in Experiment 1 were substituted into the relation deriVed from heavinessjudgments produCing four corresponding weight values. These were graphed in Figure 3together with the mean preferred weights from Experiment 1. A simple linearregression was performed by regressing one of these two sets of weights on the otherproducing a slope that was very close to 1. slope = .949. r2 = .930. P < .05. In addition. apaired t-test (one-tail) perfonned on the paired weight values was not significant.
Based on this comparison of scaling relations between volume and weight for meanpreferred weights for throwing as opposed to equivalent mean magnitude estimates ofheaviness. we concluded that the task of hefting for maximum distance of throwproduced results identical to those from size-weight illusion research within therelevant range of weight and size values.
EXPERIMENT 2: THROWING TO A MAXIMUM DISTANCE
The participants in Experiment 1 had expressed preferences for objects chosen bythem as optimal for throwing. The next problem was to determine whether or not thepreferred objects were in fact optimal for being thrown by the participants who selectedthem. Does the nonlinear relation between size and weight exhibited in judgmentsreflect a functionally constrained property of the objects that was perceived by theparticipants? In Experiment 2. a subset of the participants from the first experimentthrew the objects judged in Experiment 1 as far as they were able. Distances weremeasured and compared with judgments in Experiment 1.
Because only a subset of the participants in Experiment 1 were to perform thethrowing task, the hefting results from this subset were examined to be sure that theywere representative of the whole. Three of the original 11 hefters participated in thethrowing task. An ANOVA was perfonned on the hefting data with Size and Preferenceas within~subjects factors and Throwing Participation (throwers versus remaininghefters) as a between-subjects factor. As before. Size was significant, Ft3.27)=27.08.p<.001. and Preference was not significant. Throwing Participation was significant.F{1.9)=6.90. p<.03. The throwers were different from the remaining hefters in chOOSingheavier mean preferred weights. However. the pattern of increasing weight withincreasing size was not different. The judgment curves are parallel and the size bythrOwing participation interaction was not significant. The three way interaction alsowas not significant. Thus. the hefting results for the three participants in the thrOwingexperiment were representative of the hefting results as a whole with the exception thatthe throwers selected heavier weights overall.
Method
ApparatusIn addition to the cuboctahedrons used in Experiment 1. a 50m measuring tape was
used to measure throwing distances. Circular arcs were marked with flour on a levelplaying field at 25m increments along a radius extending from the position of thethrower. Arcs were laid out to a distance of 250m from the thrower.Participants
Three of the participants from Experiment 1 volunteered to participate inExperiment 2. All three were male. Two were left handed. The three were payed at arate of$4.00 per hour.Experimental Procedure
Throwing took place on a level grass-covered playing field prepared as describedabove. participants were run individually in experimental sessions lasting about 1 1/4hours. All three sessions took place on the same day in early November. None of the
Hefting and Throwing

160
participants witnessed the performance of another participant. The temperature wasin the low 500fs (lO°c) and there was a breeze of about 5-10 mph (8-16 kph) blowingperpendicularly to the direction of throws.
All three authors acted as experimenters. One experimenter handed objects to bethrown to the participant and recorded distances. observations. and participantcomments on experimental protocol sheets. The two remaining experimenters markedthe landing position .of the thrown objects. measured distances. and recovered thethrown objects.
Upon arrival, the participant was allowed to warm-up his throwing arm by tossing amid-weight .0375m object to one of the experimenters for a few minutes. FollOwingthis, the procedure was described to the thrower. The thrower was allowed to use hispreferred throwing style with each object with the restriction that only a single stepshould be taken. All three throwers used an overarm baseball style throw for all Objectswith a tendency to perform somewhat more of a lob with the largest diameter objects.The lobs were overarm throws using less flexion at the elbow and less extension at thewrist. that is. tending to a straight arm throw about the shoulder.
Five objects in each of the four sizes were thrown. Within a given size. each throwerthrew his preferred three objects together with the next heavier and the next lighterobjects bounding the preferred three in weight. In one instance. a thrower had selectedthe heaviest weight in a size as one of his preferred three and so, the next two lighterweights below the three were included for throwing. Each object was thrown threetimes. Throws were blocked by weight within object size resulting in three blocks offive different weights within four different diameters. Size order was randomizedacross throwers. Weight order was randomized across blocks. Each thrower performeda total of 60 throws (that is. 3 trials x 5 weights x 4 diameters).
After each throw. the distance was measured by the experimenters on the field andcalled aloud to the experimenter who recorded it. Throwing distance was measuredfrom the position of the thrower's foremost foot to the position at which the thrownobject first contacted the ground. Air flight distance was used to eliminate potentialvariance introduced by slight irregularities in the ground surface causing the object tobounce and roll in different directions once it had contacted the ground. The fiveobjects in a block oftrials were retrieved at the end of each block.
The throwing task was performed more than a week after the hefting task. Throwerswere not informed concerning the relation between their three preferred objects and thefive objects of each size to be thrown by them. The objects of each size were labeled 1(lightest) to 8 (heaviest) with .0Im square labels to enable the experimenters to keeptrack of them dUring the throwing experiment. Each thrower was asked after thethrowing was completed if he could in any way remember or recognize his preferredobjects from the hefting task. All throwers reported that they could not, although theycould detect relative optimality dUring the thrOwing by virtue of the feel of the objects asthey had dUring the Original hefting task.
Results and DiscussionThe three throwers varied in thrOWing abilities as indicated by mean throwing
distances shown in Figure 4. Thrower 1 threw to much shorter distances overall thandid throwers 2 and 3. Thrower 1. age 27. was a more sedentary individual who had nothad much throwing experience since childhood. Thrower 1 tended to use a lob muchsooner and more often than did the other two throwers. Throwers 2 and 3, age 18 and 19respectively, were active in sports that involved throwing. An ANOVA was performedon distances with Throwers as a between-subjects factor and Size and Preference (1stchoice. 2nd choice. 3rd choice. and not chosen) as within-subjects factors. The "notchosen" level of the preference factor was the mean distance for the two weights notchosen in each size. Both Size. Ft3.18}=563.44. p<.OOI. and Preference. Ft3.18)=26.61.
Bingham et al.

161
p<.OOI, were significant. However, Throwers was significant also, F{2,6)=268.87,p<.OO1. Furthennore, Throwers was significant in interaction with Size and in thethree way interaction. Because results for throwers were different, separate analyses ofvariance were perfonned on the data for each thrower with Size and Preference asfactors.
Preference was significant for all three throwers: for thrower I, F{3,6)=8.08, p<.02:for thrower 2, F(3,6)=8.91, p<.02: and for thrower 3. F(3,6)=16.48. p<.OO3. The distancecurves in Figure 4 show that the three preferred objects in each size tended to be thrownfarther than the two objects not chosen and in addition, that distance of throw tendedto go with preference. These trends are clear in Figure 5, where mean distances overparticipants for preferences 1,2, and 3 as well as those objects not chosen are shown foreach of the four object sizes. Grand means over the four sizes are shown also. A linearregression perfonned on these four grand means was Significant, r2=.928, p<.05, with aslope equal to -1.6 reflecting the inverse relation between preference and distance.
The distance curves appearing in Figure 4 can be represented approximately asquadratics. The average variance accounted for by quadratic fits to the twelve curves inFigure 4 was 79% with a standard deviation of 14%. By contrast, the average varianceaccounted for by linear fits was 34% with a standard deviation of 28%. The threethrowers exhibited individual differences both in the weights thrown and in thedistances achieved. For each thrower, the weight values were nonnalized by dividingweight values by the thrower's mean thrown weight. Also for each thrower, the distancevalues were nonnalized by dividing distances by the thrower's mean distance. Bothlinear and quadratic fits were perfonned on the combined nonnalized data for eachobject size. None of the linear fits was significant and the average percentage ofvariance accounted for was 10% with a standard deviation of 6%. The results forquadratic fits were as follows: for the .025m radiUS. r2=.464, p<.03: for the .0375mradius, r2=.419, p<.04: for the .05m radius, r2=.649, p<.OI~ and for the .0625m radiUS.r2=.353. (marginal p<.08). In all cases, the p-value associated with the quadratic tennwas p<.03 or better. The representation of the distance curves by quadratics reflects thefact that each of the curves contains an extremum corresponding to the maximumdistance. The maximum distances for each size were reached by objects of optimumweight for throwing.
The optimal objects for maximum distance throws were selected as preferred inadvance of throwing. This means that the scaling relation between size and weightforpreferred objects reflects a functional property with respect to the task of throwing.This property was detected with reasonable accuracy by participants who hefted theobjects.. The ability of participants to select objects of optimal weight for throwingindicates that there must exist a perceptual function with an extremum, for each objectsize, corresponding to the extremum in the respective distance curve similar to thatshown in Figure 6.4 The extrema for the distance curves fall at increasing weight valuesas size increases. Taking the first derivative of the quadratic fits and setting them to 0yielded the nonned weight values corresponding to the extrema. These increasedmonotonically with increasing size. When these were regressed on the mean 'Rreferredweights from Experiment I, they accounted for 96% of the variance. r2=.959,F{1,2)=46.47, p<.02. This underscores the main result from Experiments 1 and 2.Participants successfully selected those weights for each size that corresponded to themaximum distance of throw, where optimal weight increased according to a specificfunction of size. The perceptual function must be a function of both size and weight.
How well the perceptual function captures the remaining aspects of the distancecurves remains to be determined. Quadratic representation of the distance curves isapproximate because it fails to capture the asymmetry that is apparent in all of thecurves. Might this asymmetry in the distance curves be reflected in the perceptualfunction? More generally. might scaling properties more restrictive than ordinality bepreserved in the mapping from the distance curves to the perceptual function? Thequestion remains for future research.
Hefting and Throwing

162
503 1 I
40 N 3 n--- ~5'-' 3~
30 2 illCJI:co:s IV- 20112
is
10
Thrower 10
0.0 0.2 0.4 0.6 0.8Weight (kg)
70 32 1 I
f:';60 n
.-.. 50/ 2= 1&5 III--
~ 40
~1 =zCJ IVI:co:s y -- 30 -112
i:520
10 Thrower 20
0.0 0.2 0.4 0.6 0.8Weight (kg)
701 I
260
R',.-, 505'-'
~ 40 3 1 IIICJ ;:; 2I: • :=::::---:-co:s 30 1 ou:::::!.u- 2III
is IV20
10 Thrower 30
0.0 0.2 0.4 0.6 0.8Weight (kg)
Figure 4. For throwers 1-3, mean distance versus weight for five objects in each of four different sizes.Sizes from small to large by radius: I. .025 m, II. .0375 m, III..05 m, IV..0625 m. Preferences 1-3 arelabeled by arabic numerals. Distance in meters. Weight in kilograms.
Bingham et aI.

163
Mean Distance By Preference
60
50
II-e-OJ40v
=jg III(I)
~....0
IV i>30 '<:::it
I
20 i----r-----,-----r---"""'T'""---1 2 3 Not
Chosen
Preference
Figure 5. Mean distances across throwers by preference for each of four object sizes (open squares).Also shown are overall mean distances by preference (filled diamonds) together with a best fit regressionline, y=J..61x + 44.61, r2=.928, p<.05. Sizes from small to large by radius: I. .025 m, 11..0375 fi, III..05 m,IV..0625 m. Preferences are 1-3 and Not Chosen. Distance in meters.
Participants in Experiment 1 consistently selected smaller objects as optimal forthrowing and ordered objects as increaSingly less preferred as size increased. ThiSresult suggests that the perceptual function might reflect the strong ordering ofdistances according to size. In the ANOVAs, Size was signif1cant for all three throwers:for throWer I, F(3,6)=132.60, p<.OOI; for thrower 2, F(3,6)=197.39, p<.OOI; and forthrower 3, F(3.6)=259.31, p<.OOI.5 As can be seen in Figure 4, distance increased as sizedecreased. The smallest .025m radius objects were thrown consistently farthest. Allthree throwers had chosen, in the hefting task. the .025m radius object as of the optimalsize for throwing. The effect of size on distance of throw can be attributed primarily toan aerodynamic factor. Because air drag is proportional to cross sectional area, largerobjects result in greater air drag, and thus, in shorter distances. However, air drag maynot be solely responsible for differences in distance with size. In the dynamicalequations used to model terrestrial projectile motion, distance is a function of releasevelOCity and release angle, as wen as projectile mass and size (Brancazio, 1984: Dyson,1962/1970: Parker, 1977: Timoshenko & Young. 1948: Zufiria & Sanmartin, 1982).Because the optimal angle of release can vary over a fairly wide range of +/~10 degreeswithout Significant change in flight distance (Zufina & Sanmartin, 1982), anyvariations in this factor should be inSignificant. However, differences in distance withsize and weight might have been produced, in part, by an effect of size and weightchanges on release veloCities. that is. by an effect on the act of thrOwing.
Hefting and Throwing

164
How might maximum distance throwing generate the scaling relation between thesize and weight of optimal objects for throwing? The answer lies in the means by whichmaximum velocities of release are generated.
mapping
< >a; s::~ 0.... -~-Q) U
~--~
Figure 6. The surface corresponding to the distance function, a single valued function of two variables,size and weight. A hypothetical surface corresponding to the perceptual function, also a single valuedfunction of size and weight. The lines following along the peaks in both of these surfaces project onto acurve on the size-weight plane describing the size-weight scaling relation for preferred objects. Thiscommon projection is the basis for a mapping between the two functions as discovered in Experiments 1and 2.
THE KINEMATICS OF HEFTING: INVESTIGATING A SMARTPERCEPTUAL DEVICE
The release velocity together with the pr~ectUemass determine the kinetic energy ofthe projectile at release. K.E.o ::: .5mpvo . This kinetic energy corresponds to thecapacity of the projectile to do work against air resistance and gravity. For a givenrelease angle. the initial kinetic energy determines the flight distance and presents thegreatest difficulty in the need to achieve high velocity in the hand and object by thepoint of release. Long distance throwing is a challenge for throwers who mustaccelerate a projectile over a distinctly limited range of limb motion using actuatorswith limited gain characteristics. Skilled throwing is organized to take advantage ofparticular characteristics of thrower anatomy and physiology so as to overcome theselimitations.
Research on throwing has revealed two strategies that are used to maximize theenergy of the projectile at release (Atwater. 1979; Jaris. van Muyen. van Ingen SChenau.& Kemper. 1985; Kreighbaum & Barthels. 1981). The first strategy is to develop kineticenergy in the more massive trunk and proximal limb segments and to pass this energysuccessively along more distal segments. eventually to the projectile. The secondstrategy is to store energy in the tendons and muscles involved in wrist flexion byprestretching them dUring joint reversal (Jaris et al.. 1985). This energy is recovered ata higher rate in the last 50 ms before release dUring which the majority of the power in athrow is developed. Most of the acceleration of the projectile dUring this period occursas a result of wrist rotation. (See Jaris et al.• 1985. Figures 3 and 6.) Prestretch acts toamplify energy output and allows the wrist flexors to achieve power levels thatotherwise could not be reached.
Bingham et al.

165
The two strategies. kinetic energy flow and tendon prestretch. are expedient. Theytake advantage of particular dynamiC properties of human anatomy in the service of agoal. Such expediency is characteristic of smart devices (Runeson. 1977a).6 Throwingexemplifies the smart. task specifiC device. The organization is temporary and isestablished over the dynamic properties of the relevant anatomy and the projectile. forinstance. the mass distribution in the upper limb. the mass of the projectile. and theenergy storage and power generating characteristics of the forearm flexors. The deviceshould not be equated with these properties or their bearers. however. because a specifiCcoordination of these properties is required to achieve the intended goal. The machinelike. deterministic nature of skilled throwing is enforced by extremely quick andprecise timing. which is entailed. in tum. by the two strategies for achieving highrelease velocities. In less than 150 IDS. a rapid and coordinated. staggered sequence ofaccelerations and decelerations among successive body and limb segments effects theflow of mechanical energy to the projectile (Atwater. 1979; Joris et aI.. 1985).Toyoshima. Hoshikawa. Miyashita. and Oguri (1974. p. 174) observed that "the rapidarm action [in overhand throwing] acts not on the basis of conscious musclecontraction. but from the phySical phenomenon and reflection of the neuromuscularsystem." This organization comprises a throwing machine.
A projectile is an integral component of throwing construed as a task specific device.How does the organization of a thrOwing machine determine the scaling relationbetween the size and weight of optimal projectiles? To answer this question. we studiedthe kinematics and dynamics of hefting. Hefting and overhand throwing exhibitsimilar kinematic characteristics. In particular. both include a reversal in thedirection of motion of the forearm creating a snapping motion at the wrist. Thisproperty was common to various styles of hefting observed in a study preliminary toExperiment 1.
The hefting motion used by participants in Experiment 1 had been standardized. Weintended that the standardized form of hefts should be relatively simple so as tofacilitate the accurate recording of the kinematics. However. we also required that thestandardized heft should capture the characteristics of typical unconstrained hefts andthat it should allow the perceptual task to be performed effectively. A study wasperformed to examine the manner in which participants hefted and handled the objectswhen performing the judgment task. Three participants were videotaped whileperfOrming hefting and judgment.
Each of the three participants used a different style of hefting and handling of theobjects. The first participant performed small amplitude oscillations of the hand aboutthe wrist while holding the object. OCcasionally and most often with objects chosen aspreferred. the object was tossed upwards and caught. The second participant almostalways tossed and caught the objects. In addition. he performed gentle oscillations atthe elbow that caused the hand and object to bounce and oscillate about the wrist. Thethird participant performed this latter motion as well as throwing motions. Thethrowing motions were those typical of an overhand throw except that the object wasnot released (Atwater. 1979; Broer & Houtz. 1967; Hay. 1978). A notable characteristicof these motions was that they included extreme extenSion of the wrist as the forearmwas moved forward. followed by a snapping forward of the hand and object. All threestyles of hefting and handling had in common a distinct bounCing from the position ofmaximal extension at the wrist. On the basis of this observation. the standard heftingmotion chosen for Experiment 1 consisted of a gentle oscillation about the elbowprodUCing an oscillation of tile hand and object about the wrist with a bounce from theposition of maximal extension.
The objective in Experiments 3 and 4 was to discover the information specifying tohefters the dynamic property of hefting corresponding to optimal projectiles. Thatinformation should be contained in kinematic properties of hefting. specifically. ininvariant patterns of motion corresponding to hefts with optimal projectiles. To beinformative. such a kinematic property must correspond to the dynamic property
Hefting and Throwing

166
underlying optimal throwability. The alternative suggested by the dynamics ofthrowing was to explore the kinetic energy exhibited in hefting. The precise timingamong segment motions required in throwing for the effective and efficient transfer ofkinetic energy indicates that the phase relations between movements at different Jointsshould be explored in hefting as a potential source of information for optimalthrowability. We begin. however, in Experiment 3 by considering the effect of changesin object size on the second strategy for maximizing kinetic energy at release. that is.the storage of energy in the extrinsic muscles and tendons through the wrist.
EXPER.Th1ENT 3: OBJECT SIZE, TENDON DISPLACEMENT, ANDDYNAMICS AT THE WRIST
In Experiment 1. increases in preferred weight were evoked by increasing the radiusof the objects being hefted. To understand the relation between preferred weight andsize, we need to understand the effect of changes in object radius on hefting. An obviouSlocus for an effect is in the grasp. Flexion of the fingers required for a grasp is effectedby muscles in the forearm via the extrinsic tendons that run through the carpal tunnelof the wrist to attachments on the palmar side of the distal finger segments (Rasch &Burke. 1978). These same muscles and tendons that effect finger flexion also contributeto wrist flexion by virtue of their spanning both wrist and finger joints. One candemonstrate this relation for oneself by placing one's wrist in hyperextension with thefingers flexed and relaxed. and then attempting to extend the fingers fully. Most peopleare not able to extend the fingers fully without some flexion at the wrist. This is becausethe muscles (i.e.• the flexor digitorum superficialis and the flexor digitorum profundus)are not long enough to permit full extension in all of the joints that they cross. Thegreatest free play in the extrinsic tendons exists when the fingers are somewhat flexedand relaxed and the hand is in the "position of rest" (Napier. 1980). As the fingersextend. the tendons are displaced and pulled handward through the carpal tunnel of thewrist by virtue of their being wrapped around bony protrusions existing at the end of thefinger segments on the prOximal side of the finger joints (Armstrong & Chaffin. 1978).
Armstrong and Chaffin (1978) measured in cadaver hands the amounts of tendondisplacement corresponding to specific degrees ofjoint rotation. Using these data. theydeveloped a modeling equation that predicts the tendon displacement corresponding toJoint displacements for each of the finger joints and for hands of specifiC sizes. Themodel deSCribes tendon displacement towards the forearm as the finger joints flex awayfrom positions of peak extension..that is. the origin or zero displacement correspondsto all finger joints being at maximum extension.
USing this model. the first author estimated the amount of tendon displacementoccurring as a result of his grasping each of the four different sized objects used inExperiments 1 and 2. The model reqUired. as input, measures of finger jOintthicknesses and measures of joint angles as degrees from straight finger. Output wastendon displacement at the wrist in centimeters. Measurements were performed on thesecond (index finger) and third (middle finger) digits. The results for the four objects inthe order of increasing radius were. for digit two. 1.4 em. 1.3 em•.9 em. and .6 em,respectively, and for digit three, 2.4 em, 1.7 em, 1.2 em. and .6 em, respectively. Theaverage differences in displacement between successive size levels were .27 em and .6 emfor the two digits, respectively. These results indicate that increases in the radius ofprOjectiles shorten the portion of the extrinsic tendons running from the muscles in theforearm to the wrist. Alternatively. the overall length of the muscle and tendon isincreased.1 The stiffness of muscle and tendon increases with length, because muscleand tendon stiffness is nonlinear exhibiting the profile of a hard spring (Inman& Ralston, 1968). The implication is that the stiffness at the wrist joint increases withincreases in the radius of grasped objects by virtue of increasing muscle/tendon length.A change in stiffness would result in a change in intersegment timing. Because timing
Bingham et al.

167
is proportional to a ratio of stiffness and mass, increases in preferred mass might beexpected in response to increases in stiffness if t1In1ng is to be preserved.
Experiment 3 was deSigned to test the hypothesis that larger objects correspond togreater stiffness at the wrist. Participants hefted objects varying in radius with weightheld nearly constant. Each heft was perfonned by lJfting the hand and object using theelbow and then allowing them to drop by briefly reversing motion at the elbow. At thebottom of the drop, the hand and object were allowed to bounce at the wrist. The passivebouncing motion was allowed to dampen out without interference. The recordedtrajectOries at the wrist were typical of those produced by damped hannonic oscUlators(Seto, 1964). Given the frequency, mass, and logarithmic decrement associated with anunderdamped hannonic oscUlator, the stiffness can be computed. This approach wasused to derive a measure of variation in stillness at the wrist corresponding tovariations in the radius of hefted objects.
MethodApparatus
For Experiments 3 'and 4, objects s1m1lar to those used in Experiments 1 and 2were constructed. The method of construction was the same as before. The onlydifferences were in weight. Three objects varying in weight were constructed in each ofthe four sizes. First, a series of 'Light' objects, one of each size, consisted only ofstyrofoam wrapped with elastic tape. The weights corresponding to objects ofincreasing radius from .025m to .0625m were .004 kg, .012 kg, .030 kg, and .037 kg.Second, a series of 'Preferred' objects consisted of an object for each size of the meanpreferred weight from Experiment 1. The weights corresponding to objects of increasingradius were .080 kg, .135 kg, .225 kg, and .252 kg. Third, a series of 'Heavy' objects
. consiSted of .200 kg objects for the two smaller sizes and .500 kg objects for the twolarger sizes. Only the Light objects were used in Experiment 3, whereas the full set wasused in Experiment 4.
A TECA-PN4 Polgon gOniometer was used to record changes in angular position atthe wriSt and elbow while hefts were being perfonned. This device requires a polarizedlIght source, with rapidly spinning polarity, placed approximately 1.5 m to the side ofthe hefter. The polarized light was picked up by four TECA photocells: one on eitherside of each of the two joints being measured. Three of the photocells were fastened tothe upper ann and to the foreann's proximal and distal halves, respectively, usingvelcro strips. The fourth photocell was attached to' a metal plate projecting from thedorsal side of the hand. A metal Twas afixed to a weight-lifting glove so that the plateforming the stem of the T projected through elastic webbing in the back of the glove. Aweight-llfting glove, which is cut-off at the fingers, was used to minimize interferencewith grasping while enabling secure attachment of the photocell. Double-sidedsurgeon's tape was used to fix the top of the T to the back of the hefter's hand. The resultwas very stable. Voltage signals proportional to angular position at each joint wererecorded on an SE 7000 12-track FM tape drive for future analysis.
At a later time, the recorded voltage Signals were sampled and input to a VAXcomputer via a DATEL ST-PDP 12-bit analogue-to-digital converter at a sampling rateof 200 Hz. Software developed at Haskins LaboratOries was used to filter and to analyzeposition and time data used in Experiment 1. .Participants
Three graduate students at the University of Connecticut, two of them authors of thisreport, participated in the experiment in addition' to the first author. Two of theparticipants were in their mid-twenties while the rema1n1ng two were in their earlythirties. All participants were male and right handed. None had any motordisabilities. One of the participants began to experience pain in his wrist mid-way
Hefting and Throwing

168
through the experiment. ThiS occurred on occasion of two separate sessions. Thesedata were excluded from analysis, leaving data from three participants.Experimental Procedure
The data reported in Experiments 3 and 4 were collected in a single experimentalsession for each participant. For. both experiments, hefters were required to heftobjects in the same manner as in Experiment 1. Hefters sat upright in a chair andextended their right hand with the palm up, the forearm horizontal, and the upper armvertical. In Experiment 3, hefting was not performed continuously and thus, did notexhibit a periodic motion as in Experiments 1 and 4. Rather, participants performeddiscrete hefts in which the hand, object. and forearm were raised, flipping the hand andobject at the top of the trajectory by, a brief reversal of motion at the elbow. This wasfollowed by a dropping of the hand and object. which were allowed to bounce paSSivelyat the bottom of the trajectory. Participants were instructed to allow this bouncingmotion to dampen out passively and to wait for motion to cease before initiating thenext heft. Upon examination of the recorded form of these trajectories, one of theparticipants was found to have consistently violated thiS noninterference instruction.An occasional heft had the form characteristic of noninterference, but most did not.Hayes and Hatze (1977) controlled for a similar noninterference instruction byexamining simultaneous EMG recordings of relevant muscle groups dUring oscUlationof the limb. One of their three participants was found in thiS way to be unable to avoidactive interference in the movements of the limb. The same must be the case for theparticipant in the present experiment. The data from the two remaining participantswere analyzed and included in the results reported below.
The four Light objects of dUTerent size were hefted in order of increasing size by bothpartiCipants. For each object, the participant began perfOrming diSCrete hefts at regularintervals of a couple of seconds. After the participant had performed 4 or 5 such hefts.trajectories of an additional 8 hefts were recorded. This portion of an experimentalsession lasted about 10 minutes.
Finally, a number of anthropometric measures were taken for each participantincluding height. weight. hand length to the second knuckle of the middle finger,forearm length. upper arm length. palm length. palm width. maximal wrist extension,and maximal wrist flexion.
Results and DiscussionA wrist trajectory typical of those recorded in this experiment appears in Figure 7.
Each heft consists of, first. an irregular rising portion corresponding to active wristflexion followed by a smooth rising portion produced by the flipping of the hand byjoint reversal at the elbow. This is followed by smooth and steep dropping, bounce atpeak extension. and then, smooth rising of the hand and object. After the resulting restposition was held for a moment, the sequence was rep~ated.
,I II ,f"
,I ,. I'Figure 7. A typical wrist trajectory. Angular position versus time in seconds. The dotted line correspondsto 00. Data recorded from partfdpant 1 while hefting the .200 kg (Heavy) object with radius of .025 m. Seethe text for detailed description.
The positions and times of peak flexion, peak extension. and bounce peak flexionwere measured for hefts. Measurements were performed only on hefts for which a
Bingham et aI.

169
bounce flexion peak could be distinguished clearly. A total of 9-10 hefts were measuredfor each object.
The differential equation for a one dimensional. damped harmonic oscillator is
mX{t) + aCt) + kx(t) = O.
where the variables t. x. :ie. and x represent time. position. velocity and acceleration.and the parameters m. c. and k represent mass. damping. and stiffness. The stiffness. k,can be computed for a given trajectory assuming that values of the mass. m. the(angular) frequency. wd. and the logarithmic decrement. a. are known (Seto. 1964). Thelogarithmic decrement is the natural logarithm of the ratio of amplitudes from twosuccessive cycles.8 The equation for stiffness is
The stiffness for each heft was computed using this relation together with amplitudes.frequencies. and masses derived from measured values. The mass values used includedthe mass of the objects added to the mass of the hand as estimated from body weight anda coefficient giVen in Chaffin and Andersson (1984).
Light objects were made purely of styrofoam (and tape) with very slight variations inweight. Thus. the Light objects effectively isolate changes in size from changes inweight. The scattergram of computed stiffnesses versus object radii appears in Figure 8.Except for the largest object. the clear trend is for stiffness to increase with increases inobject size. A simple linear regression was performed on stiffness values for the firstthree object sizes. The result was significant for both participants. For participant 1,Fll,I3)=131.23. r2=.704. p<.OOI. For participant 2. Fll,1l)=5.81. r2=.346. p<.05. Bothregressions resulted in positive slopes reflecting increases in stiffness with increases inobject radiUS. These results are consistent with the hypothesis that the effect ofincreases in object radius is to lengthen the extrinsic tendons and muscles responSiblefor finger and wrist flexion. and thus, to increase stiffness at the wrist due to theexponential fonn of the length-tension relation.
The decrease in stiffness values appearing for the largest object is not consistent withthis hypothesis. In Experiment 1. hefters remarked that a different thrOwing stylewould be appropriate for the largest sized objects. In Experiment 2, throwers threw thelargest objects in a different style from the rest. using a lob in which the wrist and elbowwere kept fairly rigid. This indicates that the muscle/tendon prestretch strategy wasnot being used to the same extent with these objects. Hand lengths from the wrist to thesecond knuckle of the middle finger were measured for participants 1 and 2 inExperiment 3. They were 15.5 cm and 14.2 cm long, respectively. as compared to the12.5 em diameter of the largest objects. The large size of these objects made them moredifficult to grasp stably and more likely to escape a grasp upon perturbation. .All ofthese facts lead to the conclusion that the largest objects cause difficulties in graspingand thus. require a different mode of throwing that does not involve the muscles andtendons spanning the wrist in an active role. but rather. only in a passive. support role.Further. the stiffness values for the .0625m objects would result from less vigoroushefting motions used to avoid dropping them. Indeed. the mean half-cycle 'drop' periodfor the .0625m objects was longer•. 151 ms as opposed to periods of .131•. 132, and .136ms for the remaining objects.
On the basis of these observations, together with the results of the regression onstiffnesses for the first three sizes. we concluded that our hypothesis was confIrmed andthat the effect of increasing the radius of hefted objects was an increase in the stiffnessat the wrist joint due to the lengthening of the extrinsic tendons and muscles spanning
Hefting and Throwing

170
the wrist and finger joints. Additional support for this hypothesiS was found in ananalysis of the pattern of individual differences from Experiment 1.
Although all participants in Experiment 1 exhibited a pattern of increasing preferredweight over increasing size, they varied in the absolute values of preferred weights.Overall mean preferred weight for individual participants varied between .097 kg and.212 kg. Anthropometric measures including height, body weight, hand span, handlength, palm width. palm length. first finger length. forearm length, and arm length. aswell as gender. were regressed on overall mean preferred weights. One outlier appearedin most of the regressions strongly increasing the 90% confidence intervals aroundcomputed slopes. The following results are presented with the outlier removed. Thepattern of results is the same but percentages of variance accounted for by factors isincreased. Only gender. r2=.581, F(1,8)=1 1.07, p<.01, hand length, r2=.627, F(I,8)=13.46.p<.Ol, and palm length, r2=.639, F(1,8)=14.16, p<.01, were significant. while palmwidth (p<.06) was marginal. Hand length and palm width regressed Simultaneously ongender were significant, F(2,7)=33.40, p<.OOl, and accounted for 90% of the variance ingender, r2=.905. In a multiple regression on overall mean preferred weights, handlength, palm Width, and arm length accounted for 94% of the variance. r 2=.941,F(3.6)=32.18, p<.OOl. Beta coefficients, which prOvide a measure of the uniquecontribution of each factor, indicate that hand length (,6=1.49) and palm width (,6=2.27)contribute strongly in a positive direction while arm length (,6=-.53) contributes moreweakly in a negative direction.9 Many studies have compared individual differences inthrowing ability with various anthropometric measures including arm length. but notincluding hand dimension Variables. These have been reviewed by Atwater (1979). whoconcluded that no consistent correlation had been found.
Stiffness vs Object Size
.0375 .05
Radius (m)
1800
1600
---No 1400Q)~ 1200"00 •
.!l41000-~ •~ •
~ 800 •4-i
600 I':JtI2 I400 •
200
0.025
•••••
I
•I
•I•
••I•••
.0625
Figure 8. Stiffness versus radius for Light objects. Hefts from two participants. Stiffness in kilograms perseconds squared. Radius in meters.
Bingham et aI.

171
The effect of object size must be relative to the proportions of the person hefting theobject. We found that preferred weights increase directly with increases in hand lengthand palm width and inversely with increases in arm length. Hand length by palm widthdescribes hand size. This. in tum. reflects the size of the bony protrusions at the joints.The amount of tendon displacement that occurs with joint rotation is determined bythe size of these protrusions. and thus. by hand size (Armstrong & Chaffin. 1978).Overall tendon length. on the other hand. would be proportional to arm length as wellas hand length. Increase in hand size (and thus. in relative tendon displacements) hasgreater effect inversely with overall tendon length. Thus. the pattern of results onindividual differences in preferred weights corresponds well with this understanding ofthe effect of object size on the actuators for the wrist and hand. Objects that are largerrelative to the size of the hefter's hand result in greater tendon displacement in thegrasp. This. in tum. increases the stiffness at the wrist joint.
One of the two strategies used in skilled throwing for achieving high kinetic energy inthe projectile at release involves the storage of energy in the tendons and musclesspanning the wrist joint. The results of Experiments 1 and 3 indicate that this storagemedium stiffens with increasing object size. However. the predominant strategy forachieving high kinetic energy levels is the second strategy that involves a proximal todistal flow of energy along the segments of the limb. The development and flow ofenergy to the projectile at release takes place in less than a second with the forward armswing occurring over about 100 IDS (Atwater. 1979). This rapid action requires skilledand stereotypically precise coordinative timing. In particular. the efficacy of theenergy flow depends on the precise timing and coordination of successive accelerationsand decelerations in progreSSively more distal segments. The majority of the power in
. a throw is developed in the last 50 IDS before release and corresponds to movementabout the wrist (Jaris et al.• 1985). Stiffening of the wrist joint must have an impact onthe timing and coordination of motion in the forearm and hand with coinciding effecton the development of peak kinetic energy. Experiment 4 was designed to study theseeffects.
EXPERIMENT 4: INTERJOINT COORDINATION AND CONTRIBUTIONSTO PEAK KINETIC ENERGY
In view of the stereotypically precise coordinative timing reqUired amongmovements of the limb segments in thrOwing. the phaSing between hefting movementsof the wrist and elbow was measured in Experiment 4 to determine the effects of changesin object size and weight. Continuous. periodic hefting motions identical to thoseperformed in Experiment 1 were recorded using Light. Preferred. and Heavy objects.Preferred objects corresponded to the mean preferred weight in each size selected byhefters in Experiment 1. Heavy objects were approximately twice the weight of thepreferred object for each size. while Light objects all had weights near 0 kg. To evaluatethe independent effect of size changes on phasing. two size series were used. In eachseries. all objects were approximately of the same weight. In the first series. Lightobjects in all four sizes had weights approximately equal to 0 kg. The second seriesincluded the two smaller Heavy objects and the two larger Preferred objects. In thisseries. objects in all four sizes had weights approximately equal to .200 kg. To evaluatethe independent effect of weight changes on phaSing. performance with 0 kg objects wascompared to that with .200 kg objects. Following this. phase differences were studiedfor Preferred objects in which weight varied across object sizes according to the scalingfunction discovered in Experiment 1. Next. using anthropometric data. the kineticenergies corresponding to these measured trajectories were computed and comparedacross weight and size conditions. Finally. the results of this comparison werecorrelated with the results of the phase analysis of the kinematics.
Hefting and Throwing

172
MethodThe apparatus and participants were the same as described in Experiment 3.
Experimental ProcedureHefting was performed in the same manner as in Experiment 1. Participants were
instructed to perform hefts continuously. in a regular. periodic motion. and to performthem at a rate that was most comfortable as if they were to continue hefting all day.Studies have shown that periodic limb motions performed at preferred rates exhibithighly stable and reproducible periods and amplitudes (Kay. Kelso. Saltzman. &Schoner. 1987; Kugler & TuIVey. 1987; and TuIVey. Rosenblum. Schmidt. & Kugler.1986). For each trial. participants were allowed to perform hefting until they hadestablished a preferred rate. The participant then indicated this to the experimenterwho began recording 15 seconds of data. Four trials were run with each of the twelveobjects resulting in a total of 48 trials for each of the three participants. The order ofobjects was randomized within the 4 blocks of trials. This portion of an experimentalsession lasted approximately an hour.Data Processing
Fifteen seconds of data were recorded for each trial in Experiment 4 as deSCribedabove. After digital sampling. 10 seconds of data per trial were available for furtheranalysis.
Software developed at Haskins was used to smooth position-time data. using a 35-mstriangular window. and to compute instantaneous angular velocities by means of atwo-point central difference algorithm. Velocities were smoothed using the sametriangular window. A number of measurements were performed on these trajectOriesincluding mean periods. mean amplitudes. and mean phase differences for each trial.Phase differences are reported as a decimal fraction of the (mean) cycle period. (SeeKay, Munhall. Vatikiotls-Bateson. & Kelso. 1985; and Kay et al.. 1987. for details of theSignal proceSSing.)
USing elbow and wrist velocities. wrist position. forearm length. hand length. palmlength. body weight. object weight, and object radius. the kinetic energy of the forearm,hand. and object was computed continuously over the hefting trajectories. (SeeAppendix B for the details of this computation.) These kinetic energy tr~ectOries
exhibited a Single distinct peak in each hefting cycle. Furthermore, as described below,trajectories corresponding to the individual terms summed in the kinetic energyequation also exhibited such peaks. Phase difference measurements were pexformedon these peaks.
Results and DiscussionAs expected. the periods and amplitudes of hefts were stable and reproducible both
within trials and over trials for each hefter. For instance, standard deviations forwrist cycle periods across trials for participants 1-3 were .026 ms, .111 ms, and .069 InS,
respectively. including systematic variations that occurred over weight conditions.These represent an average of 8% of the corresponding mean periods. Likewise,standard deviations for wrist flexion amplitudes were 6.62 degrees. 7.65 degrees. and13.23 degrees, representing an average of 14% of corresponding mean amplitudes.Representative wrist and elbow trajectories together with velocities are shown in Figure9 for participant 1.
In all, there were 6 features of the elbow and wrist position and velocity trajectOriesto be compared via phase measurements. including peak flexion of the elbow and wrist(EF and WF). peak extension of the elbow and wrist (EE and WE). and peak (extension)velocity of the elbow and wrist (EV and WV). Velocity peaks for flexion were not equallyapparent in the data from all three participants and so. were not included in the phaseanalysis. Given 6 features to be compared. there were 5 degrees of freedom to be fixed.
Bingham et aI.

173
Five phase diIferences were measured directly. Using these. the remaining phaserelations were computed.
The phase differences that were measured directly produCing a mean phase lag foreach trial were as follows: WF versus EF. WE vs EE. WF vs EV. WF vs WE. and WV vs WE.The phase differences that were computed from these were as follows: WV vs EV. WF vsWV. EFvs EE. EFvs EV. and EVvs EE. There were a total of 10 phase differences.
Mean phase differences were computed across participants and across trials. where amean phase lag had been measured for each ten second trial which included 10-15hefting qcles. Thus. there were approximately 120-180 hefting cycles measured (3participants x 4 tI1als x 10-15 cycles) for each me~ phase difference reported. Theabsolute value of phase differences are reported in all instances.
• 11 14 16 17 18
• ,\ IG 18
t-_--J.I~I__-l.:I?..... -14\)__--'1..;..4__-.-J.Ii'-__.JJi,G:...-__u.!7__-JI~e__~!9!--.
Figure 9. Representative wrist and elbow trajectories for participant 1, hefting, in this case, an object ofradius .0375 m and weight .012 kg. From top to bottom, simultaneous elbow position, elbow velocity, wristposition, and wrist velocity. The dotted line corresponds to 00 position and a velocity of 0, respectively. Forposition-time plots, flexion is up and extension down. For velocity-time plots, flexion velocity is above thedotted line while extension velocity is beiow. Time in seconds. Scales on vertical axes are not identical forwrist and elbow plots.
Mean phase differences between peak flexion and extension for the wrist exhibit aneffect of size. but no effe~t of weight as can be seen in Figure lOa. An ANOVA wasperformed on the data for WF vs WE with Weight (0 kg and .200 kg) and Size (.025m•.0375m•.05m. and .0625m) as Within-subjects factors and Participant (1. 2. and 3) as abetween-subjects factor. Size was significant. Fl3. 27)=6.31. p<.002. Participant wasSignificant. F(2. 9)=195.88. p<.OOl. Weight was not significant. However. theParticipant by Weight interaction was significant. F(2. 9)=5.62. p<.03. Simple effectsshow that Weight was significant for Participant 2. F(1. 9)=5.35. p<.05. but not forParticipants 1 and 3.
Hefting and Throwing

174
Peak Flexion versus Peak Extension for the Wrist
0.31
0.30
J 0.29
~
f 0.28
;Q,I 0.27::i1
0.26
0.250.0250 0.0375 0.0500 0.0625
Radius (m)
Peak Flexion versus Peak Extension for the Elbow
0.45
0.44
0.43
0.42
0.41
0.40;---r-----..----r---__-----.0.0250 0.0375 0.0500 0.0625
Radius (m)
Figure 10. a) Phase di{ferences between peak flexion and extension for the wrist. Mean phasedifferences across participants and trials versus object radiui. Radius in meters. Mean Phase Lag as adecimal fraction of cycle period. Absolute values are shown. 0 kg objects (filled squares). .200 kg objects(open squares). b) Phase differences between peak flexion and extension for the elbow. Same as lOa.
Bingham et aI.

175
Mean phase differences between peak flexion and extension for the elbow exhibit aneffect of weight. but no effect of size as shown in Figure lOb. AnANOVAwas perfonnedon the data for EF vs EE with Weight, Size, and Participant as factors. Weight wassignificant, FU, 9)=13.98, p<.005. Participant was Significant, Fl2, 9)=132.28, p<.001.Size was not significant.
These combined phase results show that the phase difference between peak flexionand extension of the wrist increased with object size while the phase difference betweenpeak flexion and extension of the elbow increased with object weight. This indicatesthat increases in weight proportional to increases in object size would have beenreqUired to preserve invariant phase relations between the wrist and the elbow overincreasing object sizes. For Preferred objects, the increase in mean weight between thesmallest objects and the largest was approximately .200 kg. The mean change in phasedifference in the elbow induced by a .200 kg change in weight was .018. (This is themean distance between the two curves in Figure lOb.) The mean change in phasedifference in the wrist induced by the change from the smallest to the largest object was.015. (This is the distance between the points for the .025m and .0625m 0 kg objects inFigure lOa.) These observations provide some indication that weights selected aspreferred effect proportional increases in the phasing of wrist and elbow. The interjoint phase relations were examined to determine whether Preferred objects preservedphase relations that otherwise tended to change in response to changes in object sizeand weight.
Mean phase differences between wrist and elbow peak extension exhibit an effect ofweight, but no effect of size. An ANOVA was perfonned on the data for WE vs EE withWeight, Size, and Participant as factors. Participant was significant, Fl2, 9)=25.92,p<.001. Size was not Significant. Weight was marginal, FlI. 9)=4.09, p<.07. Mean phasedifferences decreased towards 0 as weight increased across weight conditions. UsingLight, Preferred, and Heavy weight conditions, WE vs EE data were tested by Weightcondition for difference from 0 using a one-tailed paired-t test. The results were forLight, t=;l.97, p<.005: for Preferred, t=-1.28, ns: and for Heavy, t=.18, ns. Thus, meanphase differences between wrist and elbow peak extension were only significantlydifferent from 0 for Light objects. Once weight levels were increased to the level ofpreferred weights, wrist and elbow peak extensions were effectively in phase orsynchronous.
Mean phase differences between wrist and elbow peak velocity exhibit an effect ofsize, but no effect of weight. An ANOVA was perfonned on the data for WV vs EV withWeight, Size, and Participant as factors. Size was significant, F(3, 27)=4.12, p<.02.Participant was Significant, Fl2, 9)=16.79, p<.001. Weight (0 kg and .200 kg) was notsignificant. The Participant by Size interaction was significant, F(6, 27)=3.04, p<.02.Simple effects show that Size was not significant for Participant 3.
Similar to WV vs EV, mean phase differences between wrist and elbow peak flexionexhibit an effect of size, but no effect of weight. An ANOVA was perfonned on the datafor WF vs EF with Weight, Size, and Participant as factors. Size was significant. F(3,27)=6.29, p<.002. Participant was Significant, Fl2, 9)=75.97, p<.001. Weight was notSignificant. The Participant by Size interaction was significant. F(6, 27)=3.11, p<.02.Simple effects show that Size was not Significant for Participant 3.
Inter-joint phase relations between the wrist and the elbow exhibited significantchanges with changes in the size and weight of the objects hefted. These phase relationswere analyzed to determine the effect of variations of size and weight for preferredobjects. Because size and weight covaried for Preferred objects according to the scalingrelation discovered in Experiment 1. only a single factor, Size, was used to test for aneffect of size or weight. ANOVAs were perfonned on Preferred weight data for each of theinter-joint phase difference measures with Size and Participant as factors. Only theParticipant factor was significant. p<.OI, for WE vs EE and WV vs EV. Size was notsignificant. In addition to Participant, Size was significant, Fl3, 27)=3.53, p<.03, for WF
Hefting and Throwing

176
vs EF. However. in this case. Size was significant in simple effects only for Participant2. Fl3. 27)=3.44. p<.03. Since homogeneity of variance obtained across means withineach of the phase measures. changes in significance of factors in ANOVAs can beattributed to changes in the relative pattern of means. These results indicate that phaserelations between the wrist and the elbow, which were subject to change with changes inobject size or weight. remained invariant over changes in size for objects of preferredweights as shown in Figure 11. The invariance of these phase differences for Preferredobjects advocates inter-joint phase relations as the kinematic property of hefting thatmight have provided information for optimal throwability to hefters. If so. however.the question arises how might this particular set of phase difference values indicateoptimal throwability?
Inter-Joint Phase Differences for Preferred
0.25
0.20 ------ Ie)C Ie
eo0.15tIS
....J<IICI.ltIS
..s:= 0.10
~~
= ;:tIS<II 0.05~
• ...0.00 .. •
-0.050.0250 0.0375 0.0500 0.0625
Radius (m)
Figure 11. Inter-joint phase differences for Preferred objects. Mean phase differences acrossparticipants and trials versus object radius. Radius in meters. Mean Phase Lag as a decimal fraction ofcycle period. Absolute values are shown. WE vs EE (filled squares). WF vs EV (open squares). WV vs EV(filled triangles). WF vs EF (open triangles). EV vs 1st Ext (crosses).
Discovering the significance of these phase relations required investigation of theunderlying dynamiCS. Because the kinetic energy of a projectile at the moment ofrelease is the primary determinant of flight distance. the kinetic energy of hefting wasselected as the appropriate aspect of the dynamics for investigation. Variations in thecombined kinetic energy of the forearm. hand. and object were examined over thehefting trajectories.
Bingham et aI.

177
A kinetic energy trajectory was computed for each trial using the following relation,which is described in detail in appendJx B: .
A single and distinct kinetic energy peak was found to occur durtng extension for eachhefting cycle. This peak occurred in the vicinity of the peak extension velocities for thewrist and elbow. From the kinetic energy equation. it is clear that both elbow and wristvelocities contribute to this peak, but the exact nature of the respective contributions isnot obviOUS. However, close Inspection of the equation provides some Insight as to howto proceed.
Kinetic energy is proportional to velOCity squared, that is, KE=1/2 mv2. As such,kinetic energy is always positive because mass is positive. The kinetic energy equationin this case includes three terms on the right side, two of which Involve either wrist orelbow velocity squared. Because the respective coefficients always remain positive,these terms are always positive. However, this is not true of the third 'coupling' term,which involves the product of elbow and wrist velocities.
The coupling term can go negative whenever either one, but not both, of the velocitiesgoes negative. Recall that sign on velocity indicates direction of travel, so that thisterm becomes negative whenever the wrist and elbow joints are travelling in oppositedirections, for instance, elbow flexing and wrist extending. Because in throwing therequirement is to maximize kinetic energy at its peak. assuming that this can be madeto correspond to the moment of release, a positive value of the 'coupling' term would beoptimal at the peak value for the sum of the remaining two 'non-coupling' terms. Thatis, the addition of energy by the coupling term to the peak total kinetic energy would bemore efficient than a reduction in the total energy.
An examination of trajectories generated independently by the coupling term and thesum of the non-coupling terms revealed that the coupling term may be both positive andnegative within close proximity to the peak in the summed non-coupling energy. Therelative location of the positive peak in coupling energy varied across trials dependingon the object conditions, Light, Preferred, or Heavy. As can be seen in Figure 12, thecoupling term tended to be positive at the non-coupling peak more often for Preferredobject trials and less often for Ughtand Heavy object trials. The need was to quantifythis observation and the logical means was to measure the phase relations betweenpositive peaks of the coupling and the summed non-coupling terms. However, the noiseassociated with the behavior of the coupling term made it impossible to measure peakswith any precision. An alternative means of establishing the contribution of thecoupling term to the total kinetic energy peak was to measure the phase relationbetween the peak non-coupling kinetic energy and the peak total kinetic energy. A zerophase difference would indicate that a coupling energy peak was adding to the noncoupling energy peak without distortion, implying that the coupling and non-couplingpeaks were isochronous and that the coupling term was positive.
An additional observation motivated these measurements. Recall that the primarystrategy for developing high kinetic energy in a throw is to pass kinetic energy along thelink segments in the prOximal to distal direction. This organiZation is reflectedkinematically in successive accelerations and decelerations of coinciding segments oralternatively, in the successive phasing of peak velOCities. Phillips, Roberts, and Huang(1983) found that deceleration and, in particular, reversal in the direction of motion ofa proximal limb segment caused acceleration of the next distal segment in a directionopposite to the direction of the proximal segment after reversal. This 'flailing' action(Dyson, 1962/1970) is one of the means by which kinetic energy can be transferredamong the link-segments. However.. opposite directions of travel send the couplingterm negative, so that while transfers of this sort may be reqUired, they had best notoccur at the moment of peak kinetic energy. to
Hefting and Throwing

178
Figure 12. Representative non-coupling (solid line) and coupling (broken line) trajectories fromparticipant 1 with a Light, a Preferred, and a Heavy object proceeding from top to bottom.
As shown in Figure 13a. mean phase differences between non-coupling and totalkinetic energy peaks (NCKE vs TKE) exhibit effects of both size and weight. An ANaVAwas performed on the data for NCKE vs TKE with Weight. Size. and Participant asfactors. Size was Significant. F(3. 27)=4.17. p<.02. Weight (Okg and .200kg) wasSignificant. F(1. 9)=18.40. p<.OO2. Participant was not significant. The PartiCipant byWeight interaction was Significant. F(2. 9}=7.48. p<.01. Simple effects show that Weightwas not significant for Participant 3.
As shown in Figure 13b. NCKE and TKE were synchronous across variations in sizeand weight for Preferred objects. An ANaVA was performed on the Preferred weightdata for NCKE vs TKE with Size and Participant as factors. Neither Size norParticipant was significant.
Mean phase differences between NCKE vs TKE for Light. Preferred. and Heavy objectsare shown in Figure 14a for participants 1-3. Light objects produced a positive meanphase difference that was significantly different from zero. Heavy objects resulted in anegative mean phase difference that was also Significantly different from zero.Preferred objects. however. produced a phase difference that was not Significantlydifferent from zero. This pattern was strong for two of the participants and muchweaker for the remaining participant. Palred-t tests (one-tailed) were performed onNCKE vs TKE phase differences for all three participants within Weight conditions totest for difference from O. The tests were Significant for Light and Heavy objects. forLight objects. t=3.67. p<.OO1. and for Heavy objects. t=-4.44. p<.OOI. but the test was notsignificant for Preferred objects. t=-.78. ns.
These combined results show that the Preferred objects produced an isochronousphase relation between coupling and non-coupling kinetic energy at the total kineticenergy peak as shown in both Figures 13b and 14a. In contrast. objects that were lighteror heavier than preferred produced phase differences that were significantly differentfrom 0 as shown in Figure 14a. The phase relation between NCKE and 'IKE varied withboth the size and the weight of objects being hefted as seen in Figure 13a. Phasedifferences increased with increases in size and decreased with increases in weight. The
Binglum et al.

0.02
0.01~
...;lQI(I)l'CI
0.00..c:=..=l'CIQI
~-0.01
179
NCKE versus TKE
-0.02"1'---,---,---..,.---.,.----,0.0250 0.0375 0.0500 0.0625
Radius (m)
NCKE versus TKE for Preferred
0.02
0.01~
...;lQI(I)l'CI
0.00..c:=..=l'CIQI
~-0.01
-0.02+----r---r----,r---~----,0.0250 0.0375 0.0500 0.0625
Radius (m)
Figure 13. a) Phase differences between peak total kinetic energy and peak non-coupling kineticenergy. Mean phase differences across participants and trials versus object radius. Radius in meters.Mean Phase Lag as a decimal fraction of cycle period. 0 kg objects (filled squares)..200 kg objects (opensquares). b) Phase differences between peak total kinetic energy and peak non-coupling kinetic energyfor Preferred objects.
Hefting and Throwing

180
Total vs Non-coupling Kinetic Energy Phase Lag
0.02
0.01
00lU
....J~ 0.00{I)lU..c:=..I:: -0.01lU~
~
-0.02
-0.03Light Preferred Heavy
Elbow Peak Velocity versus First Peak Extension
0.22
0.2100lU
....;l~{I)lU
0.20..c:=..I::lU~
~0.19
0.18 ;--"""---,----r------,r----......,.---..,0.0250 0.0375 0.0500 0.0625
Radius (m)
Figure 14. a) Mean phase differences between peak total kinetic energy and peak non-coupling kineticenergy versus weight conditions, Light, Preferred, and Heavy. Mean phase lag as a decimal fraction ofcycle period. Non-coupling kinetic energy lags total kinetic energy for positive values. Error barsrepresent the standard error. Participant 1 (open squares). Participant 2 (open triangles). Participant 3(filled triangles). b} Phase differences between elbow peak velocity and the first peak extension to occurwhether in the wrist or the elbow. Mean phase differences across participants and trials versus objectradius. Radius in meters. Mean Phase Lag as a decimal fraction of cycle period. Absolute values areshown. 0 kg objects (filled squares). 200 kg objects (open squares).
Bingham et al.

181
scaling relation between size and weight for Preferred objects scales weight increases soas to cancel out changes induced in phasing by size increases with a consistent zerophase difference as a result.
In addition to this isochrony of positive kinetic energy term peaks, the Preferredobjects also corresponded to phase relations between wrist and elbow movements thatremained invariant over changes in object size. The remaining question was whetherthe two results were related. How might the kinetic energy result relate to the phasingbetween the elbow and the wrist?
As deScribed above, changes in the sign of the kinetic energy coupling term occurredat joint reversals. In particular. if one joint' reached peak extension first while bothwrist and elbow joints were extending, then the sign of the coupling term would havechanged from positive to negative as the two joints began to move in oppositedirections. Because the total kinetic energy peak occurred dUring extension of the wristand elbow near peak extension. the relative phase of the first peak extension reached,whether it be for the wrist or for the elbow, would have determined the behavior of thecoupling term in the region of peak total kinetic energy. Further, because peak totalkinetic energy consisted of contributions from both the wrist and elbow peak velocities,the phasing between wrist and elbow peak velocities would have influenced the relativephase of the peak total kinetic energy. Finally, elbow peak velocity often occurred inclose proximity to wrist peak flexion, which marked another sign change in the kineticenergy coupling term.
These factors were captured in a single phase relation by computing the phasedifference between peak elbow velocity and the first peak extension reached (EV vs 1stExt), whether it be in the wrist or in the elbow. EVvs 1st Ext was found to represent allthree inter-joint phase relations. WV vs EV, WE vs EE, and two vectors coding forparticipants were regressed simultaneously on EV vs 1st Ext data for the Preferredobjects only. The result was Significant, r2=.924, p<.OOI, and the partial F's weresignificant. p<.OI. in all cases. The same regression performed on all the data wassignificant also, r2=.919, p<.OOI, and the partial F's were all Significant. p<.OOl. (Recallthat WV vs EV and WF vs EF exhibited the same results in response to manipulations inobject size and weight. In regression, WV vs EV accounted for 82% of the variance in WFvs EF.) Thus. EV vs 1st Ext captures the majority of the variance in the inter-jointphase differences between elbow and wrist. Like those phase differences, the EV vs 1stExt phase difference was invariant over variations in object size for Preferred weightsas seen in Figure 11.
As shown in Figure 14b. the pattern of mean phase differences for EV vs 1st Ext wasthe same. although inverted. as the pattern for NCKE vs TKE shown in Figure 13a. EV vs1st Ext together with two vectors coding for participants were regressed simultaneouslyon NCKE vs TKE data for all three participants. The result was Significant, r2=.217,p<.OOl. Partial F's for all vectors were significant, p<.OOl. Separate regressions of EVvs 1st Ext were performed on NCKE vs TKE data for each participant. For participant I,r2=.310, p<.OOl. For partiCipant 2. r2=.147, p<.Ol. For participant 3, r2=.099, p<.05.The slope was negative in all three instances reflecting the inverted nature of therelationship. Although the kinetic energy peaks were qUite sharp. the elbow and wristvelocity and extension peaks were rather broad in comparison. This contributed somerandom noise variance to the relations between NCKE vs TKE and EV vs 1st Ext.Considering the complexity of the kinetic energy waveforms and the relative simplicityof the single kinematic phase measure, these relations are quite good. They providestrong evidence for a correspondence between the phaSing of peaks in the kinetic energyterms and the phaSing of pea.k flexions, extensions, and velocities in elbow and wristmovements.
The three conclusions drawn from Experiment 4 were as follows. First, Preferredobjects corresponded to a dynamic property of hefting construed as a smart perceptual
Hefting and Throwing

182
mechanism. Preferred objects corresponded to an optimal. isochronous phase relationamong the peaks associated with the terms of the kinetic energy equation. Second.Preferred objects corresponded to a kinematic property of hefting. Preferred objectscorresponded to a set of invariant phase relations between elbow and wrist movements.These phase relations remained invariant over changes in object size for objects ofpreferred weights. Third. the pattern of results for the dynamic property correspondedto the pattern of results for the kinematic property. Therefore. the kinematic propertywas hypothesized to provide information for the dynamiC property of the heftingmachine. Because the kinetic energy developed dUring a throw determines flightdistance and because the kinetic energy coupling term relates to one of the means bywhich kinetic energy is developed and transferred eventually to a projectile. the interjoint phase relations were interpreted as prOViding information for the perceivedproperty "optimal object for throwing to a maximum distance."
GENERAL DISCUSSION
The approach advocated in this paper constitutes a departure from many extantmethods for investigating perceptual properties. in part. because investigation isinitiated and organized with respect to the successful performance of mundane tasks asopposed to the referents of words.
The Methodological Myth of Special AccessThe use of natural language categories for inspiration in formulating research
on perceptual properties is illustrated by entire traditions of research on "heaviness.""weight." "size." "distance." "loudness." "brightness." "slant." "texture." "color.""force." "velocity." "shape." and myriad other words taken straight from thedictionary. The problem inherent in this latter approach is that an isomorphism isassumed implicitly to exist between perceptual properties and natural languagevocabulary. This assumption is made when. in fact. the specific nature of the mappingbetween perceptual properties and the categories found in natural languages isunknown. Word use tends to cut across functional contexts and as a result. words mapto a cross section of perceptual properties. For example. "heaviness" may be used torefer to objects in the context of different tasks involVing different task specificmanipulations. The referent of "heaViness" is subject to conSiderable variationdepending on the task. "Heaviness" may involve rotational inertia in swinging a batand linear inertia in pushing a cart. Rotational inertia varies with a lever arm andwith the specific placement of the axis of rotation in extended bodies. whereas linearinertia is indifferent to these considerations.
ConfUSing words with perceptual properties is bound to result in a confused anddistorted impression of how perception works. Using natural language categories togUide the formulation of perceptual research is to foster a methodological myth ofspecial access. We can not assume that language gives us special access to perceptualproperties. Rather. the nature of the mapping between words and perceptual propertiesremains to be discovered. Describing this mapping requires that we develop anindependent understanding and description of perceptual properties.
Relation to the Size-Weight IllusionThe research deSCribed in this paper was intended to illustrate a methodological
paradigm for the study of perceptual properties. The paradigm uses a mundane taskwith a well-defined goal to gUide intuition and the formulation of successive researchquestions. as well as to provide a frame of reference for the interpretation of perceptualproperties and for the evaluation. interpretation. and comparison of experimentalresults. The selection of a commonly performed mundane task prOVides some
Bingham et al.

183
assurance that the task captures functional capabilities of the human perception andaction systems (Brunswik. 1956; Gibson. 1966. 1979). A second reason for usingcommonly performed tasks is to control for our ignorance of skill acqUisition andpotential variance due to levels of skill in performing tasks (Runeson. unpublishedmanuSCript).
In Experiments 1-4. the task of selecting. among objects varying in size and weight.optimal objects for throwing to a maximum distance was investigated partly as ameans of placing the classic size-weight illusion result in the context of a commonlywell-performed. mundane task. The well-known illusion result is that objects judged ofequal apparent heaviness exhibit weight increases with increases in size. In thedecades since this result was first obtained. much research has been performed in aneffort to provide an explanation for the effect. No convincing account has been given.
Approaching the effect within the context of psychophysical scaling. Stevens andRubin (1970) and Cross and Rotkin (1975) succeeded in providing a precise deSCriptionof the scaling relation between the volumes and weights of objects perceived to be ofequal apparent heaviness. I I Our results from Experiment 1 were found to reproducethis scaling relation within a comparable range of sizes and weights. However. we donot claim to have provided by means of our studies a comprehensive account for thesize-weight illusion or for the extended set of scaling relations deSCribed by thepsychophysicists. There are two reasons for this. First. the sizes and weights used inExperiments 1-4 corresponded only to a very restricted portion of the range of sizes andweights described by Cross and Rotkin (l975). Second. and more importantly. theproblem being investigated in Experiments 1-4 was very different from thatinvestigated in size-weight illusion research. The difference lies in the functionalcontext. Participants judged objects for optimal throwability. Not enough is known tobe able to provide a definitive comparison of this task with the task of judging"heaviness." More to the point. the task ofjudging "heaviness" per se is ill-defined andinadequately constrained for purposes of evaluation and comparison.
An important property of the size-weight effect. as noted by Stevens and Rubin (1970)and Cross and Rotkin (l975). is that it occurs only within a limited range of weights.For example. in a study performed by Ross and DiLello (l970). the effect was found to beextremely weak for weights in the range from. 700 kg to .900 kg. although it was foundto be quite strong for weights in the range from .100 kg to .300 kg. Stevens and Rubinobserved that the effect has been known to be restricted to "small" weights since theniileteenth century (Wolfe. 1898) and that the restricted nature of the effect reqUiresaccounting in a model as much as the specific nonlinear form of the relation itself.Stevens and Rubin surmised that lifting is the functional context implicit in referencesto "small" weights and that lifting ability constrains the range of weights for which thesize-weight effect occurs.
Although these investigators referred to a functional context to account for therestricted range of weights over which the effect occurs, they did not refer to thatfunctional context to account for the specific nonlinear relation between weight andvolume exhibited in perceptual judgments. Would not "lifting" also constrain"heaviness" in this respect? In these investigations. the immediate functional contextwas an experimental task in which the goal was to perform a judgment. PartiCipantswere instructed to perform a Single heft or to lift each object for a second or two withoutholding. shaking. or tilting it. The goal was to judge "heaviness." The difficulty is thatno functional context for "heaviness" was deSCribed explicitly for participants. Theimplicit context might have been to judge "heaviness" with respect to the task ofjudging"heaviness." However. because no specific instructions to this effect were provided,generic lifting might have acted equally well as the implicit context in heavinessjudgments. Either circumstance is problematic. Judging "heaviness" to "judgeheaviness" is at least odd. if not in some way paradoxical. Alternatively. the goalassociated with "lifting" is ambiguous. The goal either is not constrained suffiCientlyto determine a particular task or is so constrained as to render a property perceived by
Hefting and Throwing

184
hefting irrelevant. Lifts are performed in the context of myriad manipulation tasksthat require a variety of different movement trajectories. Merely describing the task aslifting leaves the characteristics of the movement trajectory unconstrained withrespect to amplitude. velocity. direction. and contour of the path. as well as theorientation of the object being lifted. Technically. however. a lift has been performedas soon as the weight of an object is supported by the lifter. If "taking on an object'sweight" is the intended goal. then the goal is accomplished either simultaneous with orbefore the detection by hefting of the information corresponding to "heaviness." In thiscase. the information could not be used in the performance of the task and so. isirrelevant. This is the paradox implicit in judging "heaviness" for "judging heaviness."
Evaluating the relevance of "heaviness." as a perceived property. to "lifting." as anactivity. Is not possible. Word use cuts across functional contexts and a Single word.such as "lifting." does not deSCribe adequately a particular task. Nor does "heaviness"denote adequately a unique perceptual property independent of the goal associated witha task to be performed. Because of the ambigUities associated with mappings betweenwords and perceptual properties. evaluating or interpreting "heaviness" and relating itto "optimal object for throwing to a maximum distance" is an ill-posed problem.
If. however. we restrict consideration to the Stevens and Rubin (1970) data or to theCross and Rotkin (1975) data, we could compare. in principle. the resultant scalingrelations and. on the basis oj this comparison alone. contrast the nature of therespective functional equivalences, that is. object of equal apparent heaviness versusobject optimal for throwing to a maximum distance. Unless the latter equivalence isamended. a difference is immediately apparent. Only one weight in a given size can beoptimal for throwing. whereas any weight in a given size can be equated to some weightin another size according to apparent heaviness. Equal apparent heaviness is a moreopen-ended relation. However. if the perceptual function used injudging optimality forthrowing is of higher order scaling than ordinal. then functional equivalence withrespect to throwing can be amended to a more open-ended form. If people can judgepotential decrements in thrOWing performance according to departures of weight fromthat optimal for a given size. then judgments of relative optimality for throwing in eachsize could be elicited. A possible comparison between the more extensive scalingrelations that would result and scaling relations from judgments of apparent heavinessmust await further research.
Still. one might ask how could the results from the current research be at allcomparable to those from the studies on apparent heaviness? The answer entailed bythe approach taken in Experiments 3 and 4 Is that the scaling relations are based on thesame or on closely related dynamics. Different task specific devices may overlap in thedynamic resources employed. Any task that involves grasping will require the use ofthe extrinsic muscles and tendons for the hand. Exactly how they are used will varywith the nature of the overarching task Nevertheless. one is forced to speculate that thedynamics of these structures are involved in a comparable fashion in both instances.More than this one cannot say.
Bingham et ai.

185
APPENDIX A
The following procedure was used to compute a power law relating volume to weightfor equal apparent heaviness using data from Cross and Rotkin (1975). The power lawwas computed for a range of weights and volumes comparable to that used inExperiment 1. In the first step. log mean magnitude estimates of heaviness wereregressed linearly on log volume for each weight used by Cross and Rotkin from 51 g to6168 g. In the second step. the resulting formulas could be used to compute volumescorresponding to each weight for any particular single magnitude estimation value. Inthe third step. log values of the resulting volumes could be regressed linearly on logweights to derive the power law relating volume to weight for a particular value of equalapparent heaviness. However. the values of proportionality constants and exponentsin thiS power law varied depending on the particular magnitude estimation value usedin the second step of the derivation. For comparison with the hefting for throwing data.a magnitude estimation value was selected that produced volumes for correspondingweights that were close to those used in our hefting experiments. This wasaccomplished as follows.
First. the volumes of the cuboctahedrons were computed by approximation tospheres. Next. log mean preferred weights were regressed on log volumes producing alinear relation. Four of the weight values used by Cross and Rotkin were substitutedinto thiS relation producing four corresponding volumes. The four weights used werethose that were close to mean preferred weights in the hefting for throwing study. Thefour were 51 g. 92 g. 168 g. and 308 g. Returning to the formulas derived in step oneabove relating magnitude estimations of heaviness to volume. we found the magnitudeestimation value producing volumes closest to those computed using the relationderived from our data. In thiS way. a magnitude estimation value of 2 was selected. Instep 2 above. volumes corresponding to the four weights from 51 g to 308 g werecomputed for an equal apparent heaviness estimate of 2. The resulting volumes wereused to regress log volume on log weight. The power law relating volume to weight foran equal apparent heaviness of 2 was Weight=4.08(Volume)·40. (r2 = .985. P < .01). Amagnitude estimate of 1.5 produced an exponent of .42 whereas a magnitude estimate of2.5 produced an exponent of .38.
APPENDIX B
Following the analysis in Saltzman (1979). the kinetic energy equation wasdeveloped in terms of generalized (angular) coordinates. (See also Wells. 1967).Equations describing the linear and angular kinetic energies of each of the twosegments. forearm and hand/object. were derived. CoeffiCients taken from Winter(1979) and from Chaffin and Andersson (1984) were used. together with anthropometricmeasures. to deSCribe the mass and inertia of each of the limb segments. Thecharacteristic manner in which participants grasped the objects was examinedcarefully. The center of mass of the objects was found to lie in all cases on aperpendicular line extending from the palmar surface at the metacarpal-phalangialjoint of the 2nd and 3rd digits. On the basiS of thiS obseIVation. the lever arm from thewrist to the objects' center of mass was computed using palm length. object radius. andthe Pythagorean theorem. The rotational inertia of the objects was approximated byassuming that object mass was distributed homogeneously throughout the objectvolume. Any error introduced by this approximation was very small due to the verysmall contribution to the total kinetic energy of object angular kinetic energy.
The separate equations describing linear and angular kinetic energies were summedand organiZed into three terms corresponding to the elbow and wrist velocities. 1\vo ofthe terms involved either the wrist or elbow velocity squared respectively while thethird "coupling" term involved the product of the wrist and elbow velocities. The
Hefting and Throwing

186
equation derived in this way to describe the total kinetic energy of the forearm. hand.and object as it varied over a hefting trajectory was as follows:
KE(t) = QJe2(t) {(.003 Wbl (I.? + 1.012 IfLh cos 0w{t) + .256 Lh2 ]
+ (.5 WollL? + 2 If (Lp2 + R2).5 cos(0w{t) + arctan(R/Lp)) + (Lp2 + R2)]
+ (.OOO2646Wb 1.h2 +.2 Wo R2] + (.0022137Wb r.f2])
+ QJe(t) 0w{t) {(.003 Wb] (1.012 LrLh cos 0w{t) + .512 Lh2]
where QJe(t) and ~(t) are elbow and wrist velocity in radians per second. 0w(t) is wristposition in radians. Lr. Lh. and Lp are forearm. hand. and palm length in meters. R isobject radius in meters. and Wb and W0 are body and object weight in kilograms.
Notice that only three of these variables change as a function of time. The remainingvariables are. fixed for a given trial by hefter and object characteristics. Thus. for agiven trial. this relation can be written as follows:
where f1 and f2 are functions. varying with wrist position. that include hefter and objectcharacteristics and C is a constant likewise including hefter and object properties.
As noted above. the right side of this relation includes three terms. two of whichinvolve wrist and elbow velocity squared. while the remaining term includes theproduct of the wrist and elbow velocities. The former are referred to in the text as theunon-coupling" terms. while the latter is referred to as the "coupling" term. See the textfor details.
ACKNOWLEDGMENT
The first author was supported by a National Institute of Health Individual Fellowship Award (AM-07412) while peIfonning this work. He also wishes to acknowledgethe help and advice of Roy Davis of the Department of Engineering and ComputerScience at Trinity College. Bruce Kay of the Department of Mechanical Engineering atMIT. Kevin Munhall of the Department of Psychology at the University of WesternOntario. Elliot Saltzman. Bruno Repp. and Len Katz at Haskins Laboratories. Weappreciated the constructive criticism of Jim Cutting. Sverker Runeson. and ananonomous reviewer. Thanks to Ed Wiley and Dick Sharkany at Haskins for providingtechnical assistance.
Bingham et al.

187
REFERENCES
Armstrong, T. J., & Chaffin, D. B. (1978). An investigation of the relationship between displacements ofthe finger and wrist joints and the extrinsic finger flexor tendons. Journal of Biomechanics, 11, 119-128.
Atwater, A. E. (1979). Biomechanics of overarm throwing movements and of throwing injuries. In R. S.Hutton & D. I. Miller (Eds.), Exercise and sport sciences reviews <Vol. 7, pp. 43-85). Philadelphia:Franklin Institute Press.
Bingham, G. P. (1987a). Kinematic form and scaling: Further investigations on the visual perception oflifted weight. Journal of Experimental Psychology: Human Perception and Performance, 13, 155-177.
Bingham, G. P. (1987b). Dynamical systems and event perception: A working paper Parts I-III.Perception/Action Workshop Review, 2,4-14.
Bingham, G. P. (1988). A note on dynamics and kinematics, ISEP Newsletter, 3 (a), 3-6.Bingham, G. P. (in press). Task specific devices and the perceptual bottleneck. Human Movement
Science.Bloch, E. H., & Iberall, A. S. (1982). Toward a concept of the functional unit of mammalian skeletal
muscle. American Journal of Physiology, 242, R411-420.Brancazio, P. J. (1984). Sport science. (pp.330-341) New York: Simon & Schuster.Broer, M. R., & Houtz, S. J. (1967). Patterns of muscular activity in selected sport skills. (pp. 35-42)
Springfield, IL: Charles C. Thomas.Brunswik, E. (1956). Perception and the representative design of psychological experiments. University
of California Press.Cavagna, G. A. (1977). Storage and utilization of elastic energy in skeletal muscle. In R. S. Hutton <Ed.),
Exercise and sport sciences reviews <Vol. 5). Santa Barbara: Journal Publications Affiliates.Chaffin, D. B., & Andersson, G. (1984). Occupational biomechanics. New York: Wiley.Cross, D. V., & Rotkin, L. (1975). The relation between size and apparent heaviness. Perception &
Psychophysics, 18, 79-87.Dyson, G. H. G. (1962/1970). The mechanu:s of athletics. London: University of London Press.Erlichson, H. (1983). Maximum projectile range with drag and lift, with particular application to golf.
American Journal of Physics, 51, 357-361.Fowler, C. A., & Turvey, M. T. (1978). Skill acquisition: An event approach with special reference to
searching for the optimum of a function of several variables. In G. Stelmach (Ed.), Informationprocessing in motor control and learning. New York: Academic Press.
Gibson, J. J. (1966). The senses considered as perceptual systems. Boston: Houghton Mifflin.Gibson, J. J. (1979). The ecological approach to visual perception. Boston: Houghton Mifflin.Hay, J. G. (1978). The biomechanics of sport techniques. Englewood Cliffs: Prentice HallHayes, K. C., & Hatze, H. (1977). Passive visco-elastic properties of the structures spanning the human
elbow joint. European Journal of Applied Physiology, 37, 265-274.Inman, V. T., & Ralston, H. J. (1968). The mechanics of voluntary muscle. (Chap. 11, pp. 296-317). Human
limbs and their substitutes. New York: Hafner.Joris, H. J. J., van Muyen, A. J. E., van Ingen Schenau, G. J., & Kemper, H. C. G. (1985). Force, velocity and
energy flow during the overarm throw in female handball players. Journal of Biomechanics, 18, 409-414. .
Kay, B. A., Kelso, J. A. 5., Saltzman, E. L., & SchOner, G. (1987). Space-time behavior of single andbimanual rhythmic movements: Data and limit cycle model. Journal of Experimental Psychology:Human Perception and Performance, 13, 178-192.
Kay, B. A., Munhall, I<. G., Vatikiotis-Bateson, E., & Kelso, J. A. S. (1985). A note on processing kinematicdata: Sampling, filtering, and differentiation. Haskins Laboratories Status Report on Speech Research,SR-81, 291-303.
Koseleff, P. (1957-58). Studies in the perception of heaviness. I. Some relevant facts concerning the sizeweight effect. Acta Psychologia, 13, 242-252.
Kreighbaum, E., & Barthels, I<. M. (1981). Biomechanics: A qualitative approach for studying humanmovement. Minneapolis: Burgers.
Kugler, P. N., Kelso, J. A. 5., & Turvey, M. T. (1980). On the concept of coordinative structures asdissipative structures: 1. Theoretical lines of convergence. In G. E. Stelmach & J. Requin (Eds.),Tutorials in motor behavior (pp. 3-47). New York: North-Holland.
Kugler, P. N., & Turvey, M. T. (1987). Information, natural law, and the self-assembly of rhythmicmovement: theoretical and experimental investigations. Hillsdale, NJ: Erlbaum.
Lee, W. A. (1984). Neuromotor synergies as a basis for coordinated intentional action. Journal of MotorBehavior, 16, 135-170.
Napier, J. (1980). Hands. New York: Pantheon Books.
Hefting and Throwing

188
Parker, G. W. (1977). Projectile motion with air resistence quadratic in the speed. American Journal ofPhysics, 45, 606-610.
Phillips, S. J., Roberts, E. M., & Huang, T. C. (1983). Quantification of intersegmental reactions duringrapid swing motion. Journal of Biomechanics, 16, 411-417.
Rasch, P. J., & Burke, R. K. (1978). Kinesiology and applied anatomy (6th Ed.) Philadelphia: Lea &Febiger.
Ross, J., & DiLallo, V. (1970). Differences in heaviness in relation to density and weight. Perception &Psychophysics, 7, 161-162.
Runeson, S. (1977a). On the possibility of "smart" perceptual mechanisms. Scandinavian Journal ofPsychology, 18, 172-170.
Runeson, S. (1977b). On the visual perception of dynamic events. Ph.D. Thesis, Department ofPsychology, University of Uppsala, Uppsala, Sweden.
Runeson, 5., & Frykholm, G. (1983). Kinematic specification of dynamics as an informational basis forperson and action perception: Expectation, gender recognition, and deceptive intention. Journal ofExperimental Psychology: General, 112, 585-615.
Saltzman, E. (1979). Levels of sensorimotor representation. Journal of Mathematical Psychology, 20, 91163.
Saltzman, E., & Kelso, J. A. S. (1987). Skilled actions: A task dynamic approach. Psychological Review, 94,84-106.
Seto, W. W. (1964). Theory and problems of mechanical vibrations. New York: McGraw-Hill.Solomon, Y., & Turvey, M. T. (1988) Haptically perceiving the distances reachable with hand-held
objects. Journal of Experimental Psychology: Human Perception and Performance.Stevens, J. C., & Rubin, L. L. (1970). Psychophysical scales of apparent heaviness and the size-weight
illusion. Perception & Psychophysics, 8, 225-230.Timoshenko,S., & Young, D. H. (1948). Advanced dynamics. New York: McGraw-Hill.Toyoshima, 5., Hoshikawa, T., Miyashita, M. & Oguri, T. (1974). Contribution of the body parts to throwing
performance. In R. C. Nelson & C. A. Morehouse (Eds.) Biomechanics N (pp. 169-174). Baltimore:University Park Press.
Turvey, M. T. (1977). Preliminaries to a theory of action with reference to vision. In R. Shaw & J. Bransford(Eds.), Perceiving, acting, and knowing (pp. 211-266). Hillsdale, NJ: Erlbaum.
Turvey, M. T., Rosenblum, L. D., Schmidt, R. c., & Kugler, P. N. (1986). Flucuations and phase symmetryin coordinated rhythmic movements. Journal of Experimental Psychology: Human Perception andPerformance, 12, 564-583.
Turvey, M. T., Shaw, R. E., & Mace, W. M. (1978). Issues in the theory of action: Degrees of freedom,coordinative structures and coalitions. In J. Requin (Ed.), Attention and performance VII (pp. 557-595).Hillsdale, NJ: Erlbaum.
Wells, D. A. (1967). Lagrangian dynamics. New York: McGraw-Hill.Winter, D. A. (1979). Biomechanics of human movement. New York: Wiley.Wolfe, H. K. (1898). Some effects of size on judgments of weight. Psychological Review,S, 25-54.Zufiria, J. A., & Sanmartin, J. R. (1982). Influence of air drag on the optimal hand launching of a small,
round projectile. American Journal of Physics, 50, 59-64.
FOOTNOTES
·Journal of Experimental Psychology: Human Perception and Performance, in press.
tNow at Trinity College, Hartford, crttThe Center for the Ecological Study of Perception and Action
tttNow at Wellesley College, Wellesley, MA
1 Comparison of thesa results with size-weight illusion results was based on the fact that bothjudgment tasks establish a functional equivalence of weights between objects of different size. Inhefting for throwing, the equivalence is in optimality for throwing to a maximum distance. In heftingfor heaviness, the equivalence is in apparent heaviness.
2 However, the direction of ordering may be inverted. The extremum in the perceptual functionneed not be a maximum as is the extremum in the distance function. It might be a minimum.Further, whether the mapping between performance and perceptual functions preserves strongerscaling properties remains for future investigations. For instance, does the mapping between the
Bingham et al.

189
perceptual curve and the distance curve preserve the rate of curvature meaning that participantscould judge the relative deterioration in performance with variations in weight away from theoptimum weight?
3 The power law produced by using first preference weights instead of mean preferred weights wascomparable: Weight=S.73(Volume)·44, (r2=.958, p<.02).4 We should emphasize that we have, as yet, no information about the degree of curvature in thesurface for the perceptual function depicted in Figure 6.
Sue interaction between preference and size was significant in ANOVA only for the second thrower,F(9,18)=3.29, p<.02. The "not chosen" level of the preference factor was relatively higher for the .0Smsize in this case. Recalling that the mean distance for objects not chosen was used, this result can beattributed primarily to the data for the lighter not chosen object of .05m size together with theconsistent asymmetry of the curves.
6such organization also has been referred to as a coordinative structure (e.g., Turvey, 1977, andKugler, Kelso, &: Turvey, 1980) or as a functional synergy (e.g. Turvey, Shaw, &: Mace, 1978), but suchepithets implicate less strongly the expedient nature of the organization
7The absolute values of these measurements can not be interpreted. Only digits 2 and 3 weremeasured to provide a sense of the trend in tendon displacement. Digits 4 and 5 also are involved ingrasping the two larger objects, in particular.
8rhe amplitudes are measured from the rest position of the oscillator. This position could not bedetermined accurately with measured trajectories from the wrist. However, a" computed from halfcycle angular excursions measured from peak flexion to peak extension can be shown to be equal toa/2. Thus, d'" x 2 = a.9With the outlier included, this regression accounted for 70% of the variance and the 90% confidencelimits on B's changed from .969 - 2.005 to -.114 - 2.065, from .073 - 3.461 to -.756 - 5.603, and from -.756- -.312 to 1.08 - -.089 for the three factors, respectively.
10With these observations, it is interesting to note that the coefficient on the coupling term is identicalto those representing acceleration couplings in the torque equation, which is derived by putting thekinetic energy equation through the Lagrangian operator (Saltzman, 1979). Acceleration couplingsdesCribe precisely the effect studied by Philips et al. (1983). The amount of noise introduced into themeasured position-time trajectories by the polgon apparatus prevented us from examining behaviorat the torque level because the amplification of noise effected by differentiation becameoverwhelming for the second derivative.
llStevens and Rubin (1970) and Cross and Rotkin (1975) did not report their findings in exactly thisform, but they are subject to this interpretation without controversy.
Hefting and Throwing