hedging, financing, and investment decisions: a simultaneous equations ... · federal reserve bank...
TRANSCRIPT

WORKING PAPER SERIESFED
ERAL
RES
ERVE
BAN
K of A
TLAN
TA
Hedging, Financing, and Investment Decisions: A Simultaneous Equations Framework Chen-Miao Lin and Stephen D. Smith Working Paper 2005-5 March 2005

FEDERAL RESERVE BANK of ATLANTA WORKING PAPER SERIES
Hedging, Financing, and Investment Decisions: A Simultaneous Equations Framework Chen-Miao Lin and Stephen D. Smith Working Paper 2005-5 March 2005 Abstract: The purpose of this paper is to empirically investigate the interaction between hedging, financing, and investment decisions. This work is relevant in that theoretical predictions are not necessarily identical to those in the case where only two decisions are being made. We argue that the way in which hedging affects the firms’ financing and investing decisions differs for firms with different growth opportunities. We empirically find that high-growth firms increase their investment, but not their leverage, by hedging. However, we also find that firms with few investment opportunities use derivatives to increase their leverage. JEL classification: G31, G32 Key words: investment, financing, hedging
The views expressed here are the authors’ and not necessarily those of the Federal Reserve Bank of Atlanta or the Federal Reserve System. Any remaining errors are the authors’ responsibility. Please address questions regarding content to Chen-Miao Lin, Department of Finance, School of Business Administration, Clark Atlanta University, 223 James P. Brawley Drive, SW, Atlanta, Georgia 30314, 404-880-8461, [email protected], or Stephen D. Smith, Department of Finance, J. Mack Robinson College of Business, Georgia State University, 35 Broad Street, NW, Atlanta, Georgia 30303, 404-651-1236, [email protected]. Federal Reserve Bank of Atlanta working papers, including revised versions, are available on the Atlanta Fed’s Web site at www.frbatlanta.org. Click “Publications” and then “Working Papers.” Use the WebScriber Service (at www.frbatlanta.org) to receive e-mail notifications about new papers.

-1-
I. Introduction
According to the theory of Modigliani and Miller (1958, 1963), in a perfect capital
market neither hedging nor financing decisions add value to shareholders since companies can
always obtain external funds at the same costs as internal funds to finance their investment
opportunities. Thus, in order for investors to care about these decisions by corporations, some
market imperfections must exist.
Most existing theories discuss either investment and financing, investment and hedging
or financing and hedging. They show that various imperfections affect hedging and financing,
hedging and investment, or investment and financing decisions. Underinvestment theories raised
by Bessembinder (1991) and Froot, Scharfstein, and Stein (1993) argue that firms with greater
growth opportunities should hedge more because of capital market imperfections. Tax shields
associated with debt financing lead Stulz (1996), Ross (1996), and Leland (1998) to posit that
hedging causes an increase in firm value by enabling firms to increase leverage. The debt
capacity argument thus predicts a positive relationship between hedging and leverage. When
looking at financing and investment, Myers (1977) demonstrates that firms with good investment
opportunities should carry less debt since a high level of debt induces managers to forgo positive
NPV projects.
However, the theoretical relationship between hedging, financing, and investment
decisions can be different than when we consider just two of three decisions in isolation. For
example, by considering the relation among hedging, leverage, and investment, Ross (1996)
argues that hedging to increase leverage may not mitigate the underinvestment problem, since if
firms increase debt capacity after hedging then this higher leverage increases the agency cost of
debt that in turn leads to the incentive for underinvestment. Ross’ argument implies that firms

2
with high growth opportunities are more likely to hedge to mitigate the underinvestment problem
and are less likely to increase debt capacity. For firms with few growth opportunities, Stulz
(1996) suggests that a manager with interests that are aligned with those of shareholders would
be more likely to hedge to increase leverage in order to maximize shareholder wealth.
Given these often conflicting theories, the purpose of this paper is to empirically
investigate the interaction between hedging, financing, and investment decisions for firms with
different growth opportunities. We argue that a three equation system is more consistent with the
idea that all three decisions are made at the same time. Therefore, we investigate these decisions
within a simultaneous framework in order to avoid the standard problem of endogeneity. In
particular, we use derivative usage to measure the extent of risk management. While we
recognize that derivatives can be used for speculation purposes, due to the data constraints we
assume that derivatives are used as hedging instruments.
By conducting cross-sectional regressions as well as tests for new users of derivatives, we
find empirical evidence to support Ross’ hypothesis (1996) that firms with high investment
opportunities are more likely to mitigate the underinvestment problem by hedging. Moreover, we
do not find that those firms increase their leverage by hedging. However, we find that, consistent
with Stulz (1996), firms with poor investment opportunities increase their leverage by hedging.
The remainder of the paper proceeds as follows: Section II reviews the current literature
and develops the hypotheses. Section III provides the methodology. Section IV describes our
data and Section V provides empirical results. We conclude in Section VI.
II. Literature Review and Hypotheses
II.1 Literature Review
3
Most of hedging and financing theories attempt to explain why investors concern
themselves with these decisions by introducing some market imperfection(s) into the classic
Modigliani and Miller (1958) paradigm. The following summarizes some of the imperfections
that induce firms to make investment, financial or risk management decisions that influence firm
value.
II.1.1 Hedging and Financing
The likelihood of incurring bankruptcy costs is a disadvantage to the use of debt
financing. In the case of financial distress, the value of the firm is reduced because payments
must be made to third parties other than bond- or shareholders. Mayers and Smith (1982) and
Smith and Stulz (1985) demonstrate that if financial distress is costly, hedging lowers the
probability of encountering financial distress by reducing cash flow variability and, thus,
increases firm value. By using leverage to proxy for the possibility of incurring financial distress,
Dolde (1995), Berkman and Bradbury (1996), Haushalter (2000), Gay and Nam (1998), and
Graham and Roders (2002) find a positive relation between hedging and leverage. However,
using the same proxy but a different sample and control variables, Nance, Smith, and Smithson
(1993), Geczy, Minton, and Schrand (1997), and Allayannis and Ofek (2001) find no support for
this hypothesis.
Stulz (1996), Ross (1996) and Leland (1998) suggest that tax shields associated with debt
financing provide an incentive for risk management. They argue that by reducing risk, hedging
enables the firm to increase debt capacity and to reduce tax liabilities due to increases in leverage.
Graham and Rogers (2002) look at derivatives and leverage decisions and find that firms with
higher leverage are more likely to hedge and that hedging leads to higher leverage. However,

4
using a different sample and control variables, Geczy, Minton, and Schrand (1997) find no
support for this hypothesis.
II.1.2 Hedging and Investment
The underinvestment problem raised by Myers (1977) provides an incentive for hedging.
Myers (1977) suggests that a firm’s investment opportunities are options and since shareholders
are the residual claimholders of the firm, a firm carrying a high level of debt has an incentive to
forgo a positive NPV project if the gain from the project accrues primarily to debtholders rather
than the equityholders.
By assuming that a firm simultaneously selects the level of hedging and debt before the
selection of investment, Bessembinder (1991) shows that hedging reduces the underinvestment
problem because hedging shifts some future states of the world from default to nondefault states
and. Therefore, this increases the states where shareholders receive a larger proportion of the
incremental benefits from the projects, which in turn reduces the incentives for equityholders to
underinvest.
Froot, Scharfstein, and Stein (1993) suggest, based on Myers and Majluf (1984), that
costly external funds provide incentives for corporate hedging. With perfect capital markets,
internal and external financing are perfect substitutes. However, previous studies find that, other
things being equal, the asymmetry of information about investment quality leads to a gap
between internal and external financing costs due to information problems. Froot, Scharfstein,
and Stein (1993) thus argue that since external funds are more expensive, a stable supply of
internal cash flows reduces the underinvestment problem. Therefore, both Bessembinder (1991)
and Froot, Scharfstein, and Stein (1993) suggest that firms with more investment opportunities
should hedge more.

5
Empirically, Nance, Smith, and Smithson (1993), Dolde (1995), Gay and Nam (1998),
and Graham and Rogers (2002) all find that there is a significant positive relation between R&D
expenses, a proxy for growth opportunities, and hedging. Howton and Perfect (1998), however,
do not find the same relationship between hedging and R&D expenses. However, using market-
to-book to proxy for investment opportunities, Nance, Smith, and Smithson (1993), Mian (1996),
Geczy, Minton, and Schrand (1997), Graham and Rogers (2002), and Allayannis and Ofek
(2001) find no support for the underinvestment hypothesis.
Instead of investigating whether investment opportunities provide an incentive for
hedging, Allayannis and Mozumdar (2000) investigate whether or not hedging can smooth the
cash flows of the firm and thus reduce the sensitivity of investment to cash flows. They find
results that support the hypothesis of Froot, Scharfstein, and Stein (1993). That is, they find that
hedging enables a firm to reduce its dependence on external funds.
II.1.3 Financing and Investment
As mentioned previously, Myers (1977) argues that the agency problem between
shareholders and debtholders leads to an underinvestment problem. Since agency costs between
shareholders and debtholders are assumed to be higher for firms with higher growth
opportunities, firms with good investment opportunities are more likely to have less debt.
Moreover, in the case of an adverse liquidity shock, a firm with a high degree of leverage
is more likely to be forced to forgo its investment opportunities when external capital market
imperfections restrict the firm’s ability to raise capital. Since leverage limits a firm’s ability to
pursue its investment policy, a firm with good investment opportunities would, other things the
same, like to carry less debt in order to have flexibility to grow.

6
Empirical findings, using R&D expenses, market-to-book ratios, and capital expenditures
to proxy for growth opportunities, generally support the negative relation between investment
and leverage. Bradley, Jarrell, and Kim (1984), Long and Malitz (1985), and Fama and French
(2002) find that firms with higher R&D expenses use less debt. Rajan and Zingales (1995) find
that firms with higher market-to-book ratios carry less debt. Lang, Ofek, and Stulz (1996) find a
strong negative relation between leverage and capital expenditures. However, Titman and
Wessels (1988) find an insignificant relation between leverage and investment opportunities.
II.2 Hypothesis Development
Figure 1 shows that the underinvestment theories predict a positive relation between
hedging and investment opportunities, while debt capacity theories argue that hedging allows
firms to increase their debt ratios. However, the negative effects of leverage on investment lead
Ross (1996) to argue that if a firm hedges and increases its leverage, the effect of hedging on
underinvestment is ambiguous. Hedging reduces the probability of underinvestment by providing
stable cash flows on one hand but, on the other hand, higher leverage increases the probability of
underinvestment since a higher portion of the project benefits go toward bondholders. Based on
the arguments of Myers (1977) and Ross (1996), we thus hypothesize that managers with high
investment opportunities are more likely to hedge to mitigate the underinvestment problem and
are less likely to increase debt capacity by hedging.
Which firms should hedge to increase debt capacity? Stulz (1996) argues that managers
who try to maximize shareholders’ wealth but with few growth opportunities should hedge to
increase debt capacity. Stulz (1996) points out that “the substitution of debt for equity leads
managers to pay out excess capital- an action that could be a major source of value added in
industries with overcapacity and few promising investment opportunities” (page 17).
7
The above discussion motivates the following hypothesis:
Hypothesis: Managers with high (low) growth opportunities are more likely to increase their
levels of investment (leverage) by hedging and less likely to increase leverage
(investment) by hedging.
III. Model and Methodology
To test our hypotheses, we will create an interaction variable, d1 × P/E ratio. Follow
Nance, Smith, and Smithson (1993), Geczy, Minton, and Schrand (1997) and Allayannis and
Weston (2001), we use a binary variable, d1, to indicate whether a firm hedges or not. The term
d1 is equal to one for derivatives users, and 0 otherwise. We do not use notional amounts of
derivatives use because Geczy, Minton, and Schrand (1997) argue that “the annual report
disclosures are noisy, often because of aggregation and netting” (page 1334). Graham and
Rogers (2002) also state that prior to the issue of SFAF 119 (which came into effect in 1994)
“financial statement disclosures were generally inadequate to analyze the extent of deriva tives
hedging” (page 823). Our sample firms cover fiscal years from 1992 to 1996. During these years
the notional amounts of commodity derivatives were not available and many firms in the sample
report the use of derivatives but do not report their levels, we feel that a dummy variable is a
more appropriate proxy than notional amounts. Finally, Smith (2002) shows that if a regressor is
measured with error, then the estimated coefficient will be biased toward zero and there is no
way to recover the true coefficient. However, by using the dummy variable approach, not only
do we not encounter the above problems but we can obtain the true estimate, provided that the
cut off rate is known, as it is in this case (i.e., zero). For our empirical tests we follow McConnell
and Servaes (1995) and use the P/E ratio as a proxy for growth opportunities. The P/E ratio is

8
calculated by dividing the stock price at the end of fiscal year by operating earnings before
depreciation per share.
We first investigate hedging, financing, and investment decisions in a fixed-effects model
since our data represents a panel data-set. We also provide some tests using a simultaneous
equations framework since estimation within a system allows us to avoid false inferences of
causality among these decisions that are due to spurious correlations.
III.1 Financing model
To test our hypothesis, we regress leverage on the interaction variable, d1 × P/E ratio, and
other control variables suggested by Titman and Wessels (1988). The leverage model is specified
as follows:
titititi
titititi
SizeTaxonDepreciati
IPEenditureCapitalEPddLeverage
,,7,6,5
,4,3,12110,
)()()(
)()exp()/()()(
εααα
ααααα
++++
++×++=
where leverage is measured as long-term debt plus current portion of long-term debt over total
assets. The ratio of capital expenditure expenses to total assets is used as a proxy for investment.
Inventory, plant & equipment (IPE), a proxy for collateral value, is measured by the ratio of
inventory plus plant and equipment to total assets. It is thought that firms with a higher level of
IPE should be able to carry higher debt levels. Depreciation, measured by depreciation scaled by
total assets, and the ratio of net operating loss carry forwards over total assets (Tax), are proxies
for non-debt tax shields. Firm size is measured by the log of total assets. We expect α2 to be
negative if firms with high growth opportunities are less likely to hedge to increase debt
capacity.
III.2 Investment model
To investigate the relationship between derivative use and investment, we follow the
same procedure as we do in the leverage model. We regress capital expenditure expenses scaled

9
by total assets on the interaction variable and a set of control variables suggested by Fazzari,
Hubbard, and Petersen (1988, 1998) and Lang, Ofek, and Stulz (1996) in order to test our three
hypotheses. The investment model is defined as follows:
titi
titititi
SizeflowCash
LeverageEPddenditureCapital
,5,4
,3,12,110,
)()(
)()/()()exp(
ββ
ββββ
++
+×++=
All dependent and independent variables are the same as those specified in the debt model expect
for cash flow. Cash flow is defined as operating income before depreciation less the sum of
taxes, interest expenses, common dividends, and preferred dividends scaled by total assets. Cash
flow enters into this equation because the literature finds that, other things being equal,
investment is highly sensitive to internal funds.1 We expect β2 to be positive since firms with
good investment opportunities are more likely to hedge to alleviate underinvestment problems.
III.3 Hedging model
To investigate the incentives for hedging, we specify the model of hedging decisions
following Geczy, Minton, and Schrand (1997).2 The model is as follows:
titi
tititititi
SizeAccuracy
TaxratioQuickenditureCapitalLeverageh
,6,5
,4,3,2,10,1
)()(
)()()exp()()(
γγ
γγγγγ
++
++++=
The quick ratio, a proxy for liquidity, is measured as cash and short-term investments over
current liabilities. The more liquid firms have less need of hedging. Tax, as defined in the
leverage equation, is a proxy for tax function convexity since Smith and Stulz (1985) suggest
that firms facing convex tax schedules have greater incentives to hedge. Analyst forecast
accuracy (Accuracy) is a proxy for asymmetric information. DeMarzo and Duffie (1991, 1995)
argue that if managers have private information, shareholders will be better off if the firm hedges
1 See Fazzari, Hubbard, and Ptersen (1988), Hoshi, Kashyap, and Scharfstein (1991), and Hubbard (1998). 2 All the control variables are suggested by Geczy, Minton, and Schrand (1997), but they also include other control variables in the model, which we ignore.

10
since hedging can eliminate noise and thus improve the informativeness of corporate earnings as
a signal of project quality. Therefore, firms with a high level of asymmetric information are more
likely to hedge. Following DaDalt, Gay, and Nam (2002), we construct analyst forecast accuracy
for earnings by calculating the absolute value of the difference between the analysts' composite
mean earnings per share forecast made in the last I/B/E/S reporting month prior to the release of
actual earnings and the actual earnings per share for that year. We then divide this difference by
the absolute value of the actual earnings per share. The other control variables are the same as
those specified previously.
IV. The Data
We construct our sample of non-financial firms from the Swaps Monitor database,
covering fiscal years from 1992 to 1996 (the last year of data reported). Swap Monitor reports
derivatives usage information for all Fortune 500 and Business Week 1000 firms, all other
industrial firms with revenues greater than $500 million or assets greater than $500 million, and
other known derivatives users regardless of firm size. Table 1 presents information on the
number of interest rate, exchange rate, and/or commodity derivatives users and non-users. The
number of users increases from 644 in 1992 to 1035 in 1996 and the number of non-users
decreases from 1,108 in 1992 to 717 in 1996. We obtain financial data from the Standard and
Poor’s Compustat and analysts forecasts from I/B/E/S. Table 2 reports the summary statistics for
the explanatory variables used in this study.

11
V. Empirical Results
In this section, we use multivariate tests to examine hedging, financing, and investment
decisions. We conduct fixed-effects models and simultaneous equations specifications for a
sample of derivatives users and non-users as well as for a sample of new users of derivatives.
V.1.1 Fixed-effects estimation
Since our data is a panel data-set, we introduce fixed-effects models to control for
possible industry and time effects which might affect a firm’s financing, hedging, and investment
decisions. The industry effects are measured by four-digit SIC dummy variables.
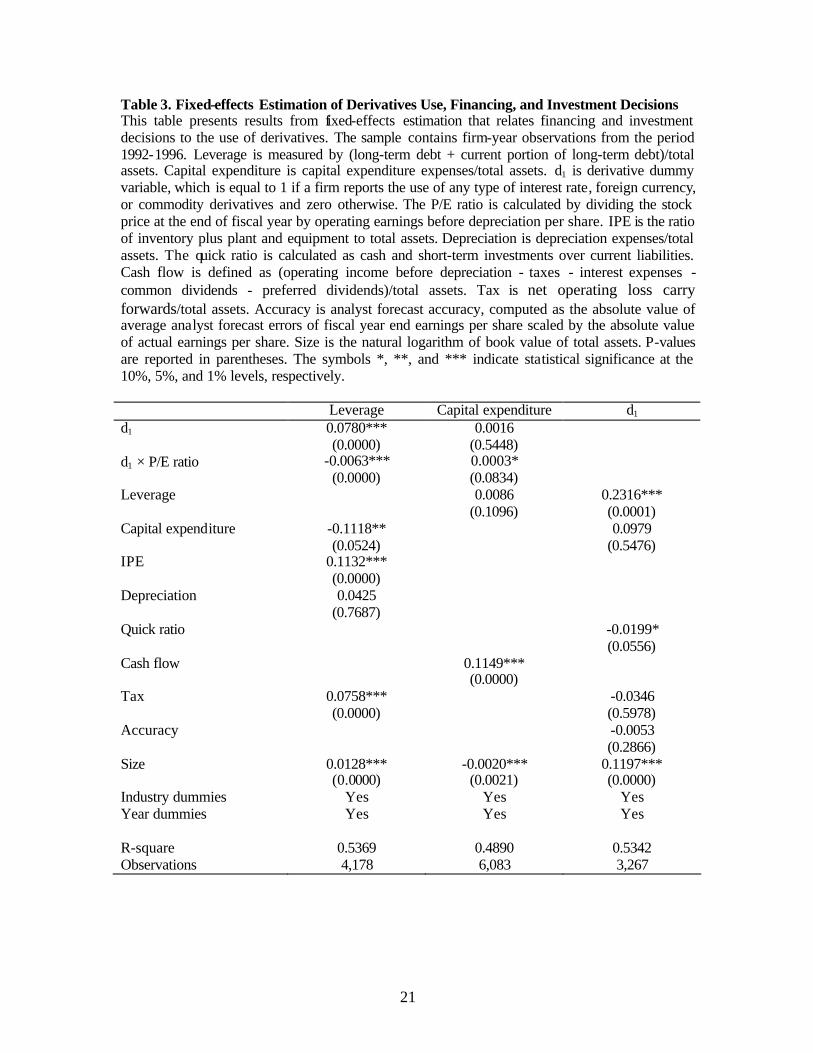
Table 3 reports the results from fixed-effects estimation. The leverage model shows that
hedging allows firms to increase its debt capacity. In particular, the coefficient of d1 is significant
at 1% level. Consistent with our hypothesis, high-growth firms do not hedge to increase debt
capacity. The coefficient of d1 × P/E is negative and significant at 1% level. With respect to the
other explanatory variables, we find a significantly negative relation between capital expenditure
and leverage, which is consistent with the empirical findings of most of the previous research.
We also find a positive relationship between leverage and collateral value (IPE) as well as net
operating loss carry forwards (Tax), which is consistent with theory.
From the investment equation, we do not find a positive relation between hedging and
investment, but we do find that high-growth firms hedge to increase their investment
opportunities. The coefficient of d1 × P/E is positive and significant at the 10% level. Consistent
with Fazzari, Hubbard, and Petersen (1988, 1998), we also find a positive relation between cash
flows and capital expenditure.
12
In the derivatives use equation, we find that leverage is significantly positively related to
derivatives use, which is consistent with the financial distress argument. We also find that firm
size is positively correlated with the hedging decision. We do not find a significant relation
between hedging and capital expenditure, asymmetric information measure, or tax incentive for
hedging.
V.2 Simultaneous equations of hedging, leverage, and investment
Our tests, up until now, implicitly assumed the derivatives use decision is exogenous.
However, in reality, hedging, financing, and investment decisions are more likely to be
endogenous. Estimation within a system allows us to avoid false inferences of causality among
these decisions that are due to least squares bias.
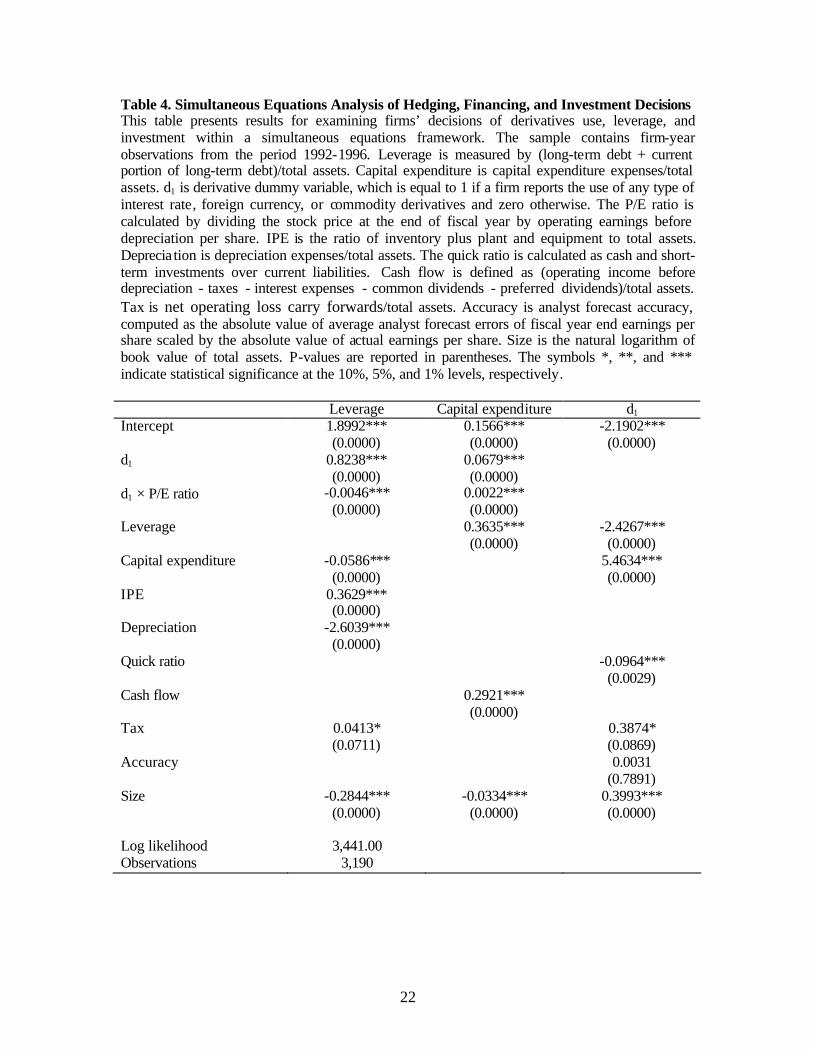
Table 4 reports the results of derivatives use, leverage, and investment within a
simultaneous equation framework. We have adjusted our estimation methodology to account for
the fact that one of the endogenous variables is zero/one. We use a two-stage estimation method
discussed in Maddala (1983), (pages 242-247) to provide consistent estimates of the parameters.3
In the first stage, separate OLS regressions are run for the leverage and capital expenditure
decisions and probit regression for the derivatives use decision. In the second stage, structural
equations are estimated by replacing the explanatory variables with the predicted values from the
first-stage regressions.
The leverage equation shows that on average, derivative use (d1) leads to a significant
increase in the level of leverage but the level decreases as a firm’s growth opportunities increase.
This is consistent with our hypothesis that firms with high growth opportunities are less likely to
hedge to increase debt capacity than firms with low growth opportunities.
3 We thank Ping Hu from the SAS institute for providing us with an estimation package. We note that this code will generally be available to the public in the next version of the SAS estimation packages.

13
The capital expenditure equation indicates that hedgers have a significant ly higher level
of investment than non-hedgers and the level is enhanced by a firm’s growth opportunities. This
result supports our hypothesis that high growth firms hedge to increase their investment
opportunities.
The derivative use equation shows that bigger firms and firms with a high level of capital
expenditure and net operating loss carry forward hedge more. But surprisingly, we find a
negative relation between hedging and leverage. Nance, Smith, and Smithson (1993) also find a
negative relation between hedging and leverage and their interpretation for this result is that high
growth firms tend to hedge more and borrow less.
V.3 New Derivatives Users
In this section, we further investigate the relationship between hedging, financing and
investment for new users of derivatives. By looking at new users, we can alleviate the concern
that non-users may not be an appropriate control group for users due to different firm
characteristics. Following Guay (1999), a firm is defined as a new derivatives user if it reports
derivatives use in year t, but does not report a position in derivatives in any years prior to year t
during the sample period. Firms that report derivatives use in the year 1992 are not identified as
new users since the data on derivatives usage for 1991 is unavailable. The initial sample contains
828 firms that are identified as new users.
Table 5 reports the results from fixed-effects models. Consistent with the cross sectional
tests, we find that firms with high growth opportunities are less likely to hedge to increase debt
capacity. The coefficient of d1 × P/E is significantly negative. However, in the capital
expenditure equation, we do not find a significant relation between the interaction variable (d1 ×
P/E) and capital expenditure.
14
Table 6 presents the results that examine the relationship of derivatives use, leverage, and
investment for new users within a simultaneous equations framework. The results indicate a
positive relation between capital expenditure and d1 × P/E but a marginally significant positive
relation between leverage and d1 × P/E. Overall, our results are consistent with those of a using
cross-sectional regressions but are somewhat weaker in terms of magnitude.
VI. Conclusions This paper empirically investigates the interaction between hedging, financing, and
investment decisions. Theoretical predictions looking at the three decisions together are different
from earlier literature that looks at just two of the three decisions in isolation.
The results of the study, conducted via fixed-effects models and simultaneous equations,
strongly support the idea that firms with plentiful growth opportunities manage risk in order to
hedge their high growth opportunities, but they do not hedge to increase leverage. The results
confirm Ross’ hypothesis (1996) that hedging to increase debt capacity would not mitigate the
underinvestment problem, which is the goal that a high-growth firm would be more likely to
pursue. However, firms with few investment opportunities increase their leverage by hedging.
The results support Stulz’s argument (1996) that hedging to increase tax shields, resulting from
increases in leverage, could be a major source of value added for firms with low growth
opportunities.

15
References Allayannis, George, and Eli Ofek, 2001, “Exchange rate exposure, hedging, and the use of
foreign currency derivatives,” Journal of International Money and Finance 20, 273-296. Allayannis, George, and Abon Mozumdar, 2000, “Cash flow, investment, and hedging,” working
paper. Allayannis, George, and James P. Weston, 2001, “The use of foreign currency derivatives and
firm market value,” The Review of Financial Studies 14, 243-276. Berkman, Henk, and Michael E. Bradbury (1996), “Empirical evidence on the corporate use of
derivatives,” Financial Management 25, 5-13. Bessembinder, Hendrik, 1991, “Forward contracts and firm value: investment incentive and
contracting effects,” Journal of Finance and Quantitative Analysis 26, 519-532. Bradly, Michael, Gregg A. Jarrell, and E. Han Kim, 1984, “On the existence of an optimal
capital structure: Theory and evidence,” Journal of Finance 39, 857-880. DaDalt, Peter, Gerald D. Gay, and Jouahn Nam, 2002, “Asymmetric information and corporate
derivatives use,” Journal of Futures Markets 22, No. 3, 241-267. DeMarzo, Peter M., and Darrell Duffie, 1991, “Corporate financial hedging with proprietary
information,” Journal of Economic Theory 53, 261-286. DeMarzo, Peter M., and Darrell Duffie, 1995, “Corporate incentives for hedging and hedge
accounting,” The Review of Financial Studies 8, 743-771. Dolde, Walter, 1995, “Hedging, leverage, and primitive risk,” Journal of Financial Engineering
4, 187-216. Fama, Eugene F., and Kenneth R. French, 2002, “Testing tradeoff and pecking order predictions
about dividends and debt,” Review of Financial Studies 15, No.1, 1-33. Fazzari, Steven, R. Glen Hubbard, and Bruce Petersen, 1988, “Financing constraints and
corporate investment,” Brookings Papers On Economic Activity 1, 141-195. Fazzari, Steven, R. Glen Hubbard, and Bruce Petersen, 1998, “Investment-cash flow sensitivities
are useful: a comment on Kaplan and Zingales,” working paper, Columbia University. Froot, Kenneth A., David S. Scharfstein and Jeremy, C. Stein, 1993, “Risk Management:
Coordinating Corporate Investment and Financing Policies,” Journal of Finance 48, 1629-1658.

16
Gay, Gerald D., and Jouahn Nam, 1998, “The underinvestment problem and corporate derivatives use,” Financial Management 52, 53-69.
Geczy, Christopher, Bernadette A. Minton, and Catherine Schrand, 1997, “Why firms use
currency derivatives?,” Journal of Finance, 1323-1354. Graham, John R., and Daniel A. Rogers, 2002, “Do firms hedge in response to tax incentives?”
Journal of Finance 57, No. 2; 815-839. Haushalter, G. David, 2000, “Financing policy, basis risk, and corporate hedging: evidence from
oil and gas producers,” Journal of Finance 55, No. 1, 107-152. Hoshi, Takeo, Anil Kashyap, and David Scharfstein, 1991, “Corporate structure, liquidity, and
investment: evidence from Japanese industrial groups,” Quarterly Journal of Economics 106, 33-60.
Howton, Shawn D., and Steven B. Perfect, 1998, “Currency and interest-rate derivatives use in
US firms,” Financial Management 27, 111-121. Hubbard, R. Glenn, 1998, “Capital-market imperfections and investment,” Journal of Economic
Literature 36, 193-225. Jensen, Michael C., 1986, “Agency costs of free-cash-flow, corporate finance, and takeover,”
American economic Review 76, 323-329.
Lang, Larry, Eli Ofek, and Rene M. Stulz, 1996, “Leverage investment, and firm growth,” Journal of Financial Economics 40, 3-29.
Leland, Hayne E., 1998, “Agency costs, risk management, and capital structure,” Journal of
Finance 53, 1213-1243. Long, Michael S., and Ileen B. Malitz, 1985, “Investment patterns and financial leverage,” in
Benjamin J. Friedman (ed.), Corporate Capital Structures in the United States, Chicago, University of Chicago Press.
Maddala, G. S. 1977, “Econometrics”, McGraw-Hill, New York. Mayers, David, and Clifford W. Smith, 1982, “On the corporate demand for insurance,” Journal
of Business 55, 281-296. McConnell, John J., and Henri Servaes, 1995, “Equity ownership and the two faces of debt,”
Journal of Financial Economics 39, 131-157. Mian, Shehzad L., 1996, “Evidence on corporate hedging policy,” Journal of Financial and
Quantitative Analysis 31, 419-439.

17
Modigliani, Franco, and Merton H. Miller, 1958, “The cost of capital, corporation finance, and the theory of investment,” American Economic Review 48, 261-297.
Modigliani, Franco, and Merton H. Miller, 1963, “Corporate income taxes and the cost of
capital,” American Economic Review 53, 433-443. Myers, Stewart C., 1977, “Determinants of Corporate Borrowing,” Journal of Financial
Economics 5, 147-175. Myers, Stewart C., and Nicholas Majluf, 1984, “Corporate financing and investment decisions
when firms have information that investors do not have,” Journal of Financial Economics, 187-221.
Nance, Deana, R., Clifford W. Smith, and Charles W. Smithson, 1993, “On the determinants of
corporate hedging,” Journal of Finance 48, 267-284. Rajan, Raghuram G., and Luigi Zingales, 1995, “What do we know about capital structure?
Some evidence from international data,” Journal of Finance 50, 1421-1460. Ross, Michael P., 1996, “Corporate hedging: what, why and how?,” working paper, Haas School
of Business, University of California, Berkeley. Smith, Clifford W., and Rene M. Stulz, 1985, “The Determinants of Firms’ Hedging Policies,”
Journal of Financial and Quantitative Analysis 20, 391-405. Smith, Stephen D., 2002, “Dummy vs. continuous variables when regressors are measured with
error”, manuscript, Georgia State University. Stulz, Rene M., 1996, “Rethinking risk management,” Journal of Applied Corporate Finance 9,
No. 3, 8-24. Titman, Sheridan, and Roberto Wessels, 1988, “The determinants of capital structure choice,”
Journal of Finance 43, 1-19.

18
Figure 1: The relation among hedging, leverage, and investment. The underinvestment theories predict that firms with greater investment opportunities are more likely to hedge and thus hedging allows firms to take on more attractive investment opportunities. The financial distress cost argument predicts that firms with high debt ratios are more likely to hedge and the debt capacity argument posits that firms are all better off hedging in order to increase leverage. The agency costs between shareholders and debtholders suggest a negative relation between investment and leverage. By considering the relation among hedging, leverage, and investment, Ross (1996) argues that hedging to increase leverage may not alleviate underinvestment problems since higher leverage increases the agency costs of debt that would lead to the incentives for underinvestment. Thus, firms with higher growth opportunities are more likely to hedge to increase investment and less likely to increase leverage.
Hedging
Investment Leverage
(-)
(-)
(+) (-) (+) (+)
Hedging
Investment Leverage
(-)
(-)
(+) (+) (+) (+)
Traditional predictions for any two of the three hedging, financing, and investment decisions
Ross’ predictions when considering these three decisions instead of two out of the three.

19
Table 1. Descriptive Information of Derivatives Users and Non-Users This table provides descriptive statistics of non-financial firms defined as interest rate, and/or exchange rate, and/or commodity derivatives users or non-users from 1992 to 1996 as reported in the Swaps Monitor database. Interest-Rate
Derivatives Currency
Derivatives Commodity Derivatives
All Firmsa
Year Users Non-users Users Non-users Users Non-users Users Non-users
1992 434 1,145 346 1,233 91 338 644 1,108 1993 511 1,068 402 1,177 147 282 761 991 1994 529 1,050 491 1,088 210 219 886 866 1995 529 1,050 414 1,165 224 205 847 905 1996 639 940 480 1,099 264 165 1,035 717 a. The number of users (non-users) in these columns will not equal to the sum of users (non-users) of interest-rate, currency, and commodity derivatives if firms that use multiple derivatives.

20
Table 2. Explanatory variables-Summary Statistics This table provides summary information for the independent variables used in this study. The sample contains firm-year observations from the period 1992-1996. d1 is derivative dummy variable, which is equal to 1 if a firm reports the use of any type of interest rate , foreign currency, or commodity derivatives and zero otherwise. The P/E ratio is calculated by dividing the stock price at the end of fiscal year by operating earnings before depreciation per share. Leverage is measured by (long-term debt + current portion of long-term debt)/total assets. Capital expenditure is capital expenditure expenses/total assets. IPE is the ratio of inventory plus plant and equipment to total assets. Depreciation is depreciation expenses/total assets. The quick ratio is calculated as cash and short-term investments over current liabilities. Cash flow is defined as (operating income before depreciation - taxes - interest expenses - common dividends - preferred dividends)/total assets. Tax is net operating loss carry forwards/total assets. Accuracy is analyst forecast accuracy, computed as the absolute value of average analyst forecast errors of fiscal year end earnings per share scaled by the absolute value of actual earnings per share. Size is the natural logarithm of book value of total assets. P-values are reported in parentheses. No. obs Mean Std. Dev. Median 10th percentile 90th percentile d1 × P/E ratio 6,533 3.862 6.197 2.285 0.000 9.937 Leverage 6,512 0.289 0.217 0.273 0.028 0.525 Capital expenditure
6,429 0.077 0.076 0.057 0.018 0.152
IPE 6,436 0.523 0.221 0.534 0.210 0.815 Depreciation 6,532 0.049 0.031 0.044 0.020 0.084 Quick ratio 6,042 0.540 2.170 0.164 0.021 1.233 Cash flow 6,203 0.072 0.096 0.076 0.010 0.149 Tax 4,303 0.055 0.281 0.000 0.000 0.102 Accuracy 5,227 0.296 1.724 0.038 0.004 0.444 Size 6,533 6.389 1.795 6.302 4.123 8.783
21
Table 3. Fixed-effects Estimation of Derivatives Use, Financing, and Investment Decisions This table presents results from fixed-effects estimation that relates financing and investment decisions to the use of derivatives. The sample contains firm-year observations from the period 1992-1996. Leverage is measured by (long-term debt + current portion of long-term debt)/total assets. Capital expenditure is capital expenditure expenses/total assets. d1 is derivative dummy variable, which is equal to 1 if a firm reports the use of any type of interest rate, foreign currency, or commodity derivatives and zero otherwise. The P/E ratio is calculated by dividing the stock price at the end of fiscal year by operating earnings before depreciation per share. IPE is the ratio of inventory plus plant and equipment to total assets. Depreciation is depreciation expenses/total assets. The quick ratio is calculated as cash and short-term investments over current liabilities. Cash flow is defined as (operating income before depreciation - taxes - interest expenses - common dividends - preferred dividends)/total assets. Tax is net operating loss carry forwards/total assets. Accuracy is analyst forecast accuracy, computed as the absolute value of average analyst forecast errors of fiscal year end earnings per share scaled by the absolute value of actual earnings per share. Size is the natural logarithm of book value of total assets. P-values are reported in parentheses. The symbols *, **, and *** indicate statistical significance at the 10%, 5%, and 1% levels, respectively. Leverage Capital expenditure d1 d1 0.0780***
(0.0000) 0.0016
(0.5448)
d1 × P/E ratio -0.0063*** (0.0000)
0.0003* (0.0834)
Leverage 0.0086 (0.1096)
0.2316*** (0.0001)
Capital expenditure -0.1118** (0.0524)
0.0979 (0.5476)
IPE 0.1132*** (0.0000)
Depreciation 0.0425 (0.7687)
Quick ratio -0.0199* (0.0556)
Cash flow 0.1149*** (0.0000)
Tax 0.0758*** (0.0000)
-0.0346 (0.5978)
Accuracy -0.0053 (0.2866)
Size 0.0128*** (0.0000)
-0.0020*** (0.0021)
0.1197*** (0.0000)
Industry dummies Yes Yes Yes Year dummies Yes Yes Yes R-square 0.5369 0.4890 0.5342 Observations 4,178 6,083 3,267
22
Table 4. Simultaneous Equations Analysis of Hedging, Financing, and Investment Decisions This table presents results for examining firms’ decisions of derivatives use, leverage, and investment within a simultaneous equations framework. The sample contains firm-year observations from the period 1992-1996. Leverage is measured by (long-term debt + current portion of long-term debt)/total assets. Capital expenditure is capital expenditure expenses/total assets. d1 is derivative dummy variable, which is equal to 1 if a firm reports the use of any type of interest rate, foreign currency, or commodity derivatives and zero otherwise. The P/E ratio is calculated by dividing the stock price at the end of fiscal year by operating earnings before depreciation per share. IPE is the ratio of inventory plus plant and equipment to total assets. Deprecia tion is depreciation expenses/total assets. The quick ratio is calculated as cash and short-term investments over current liabilities. Cash flow is defined as (operating income before depreciation - taxes - interest expenses - common dividends - preferred dividends)/total assets. Tax is net operating loss carry forwards/total assets. Accuracy is analyst forecast accuracy, computed as the absolute value of average analyst forecast errors of fiscal year end earnings per share scaled by the absolute value of actual earnings per share. Size is the natural logarithm of book value of total assets. P-values are reported in parentheses. The symbols *, **, and *** indicate statistical significance at the 10%, 5%, and 1% levels, respectively. Leverage Capital expenditure d1 Intercept 1.8992***
(0.0000) 0.1566*** (0.0000)
-2.1902*** (0.0000)
d1 0.8238*** (0.0000)
0.0679*** (0.0000)
d1 × P/E ratio -0.0046*** (0.0000)
0.0022*** (0.0000)
Leverage 0.3635*** (0.0000)
-2.4267*** (0.0000)
Capital expenditure -0.0586*** (0.0000)
5.4634*** (0.0000)
IPE 0.3629*** (0.0000)
Depreciation -2.6039*** (0.0000)
Quick ratio -0.0964*** (0.0029)
Cash flow 0.2921*** (0.0000)
Tax 0.0413* (0.0711)
0.3874* (0.0869)
Accuracy 0.0031 (0.7891)
Size -0.2844*** (0.0000)
-0.0334*** (0.0000)
0.3993*** (0.0000)
Log likelihood 3,441.00 Observations 3,190

23
Table 5. Fixed-effects Estimation of Derivatives Use, Financing, and Investment Decisions for New Users of Derivatives This table presents results from fixed-effects estimation that relates financing and investment decisions to the use of derivatives for new users of derivatives. The sample contains firm-year observations from the period 1992-1996. Leverage is measured by (long-term debt + current portion of long-term debt)/total assets. Capital expenditure is capital expenditure expenses/total assets. d1 is derivative dummy variable, which is equal to 1 if a firm reports the use of any type of interest rate, foreign currency, or commodity derivatives and zero otherwise. The P/E ratio is calculated by dividing the stock price at the end of fiscal year by operating earnings before depreciation per share. IPE is the ratio of inventory plus plant and equipment to total assets. Depreciation is depreciation expenses/total assets. The quick ratio is calculated as cash and short-term investments over current liabilities. Cash flow is defined as (operating income before depreciation - taxes - interest expenses - common dividends - preferred dividends)/total assets. Tax is net operating loss carry forwards/total assets. Accuracy is analyst forecast accuracy, computed as the absolute value of average analyst forecast errors of fiscal year end earnings per share scaled by the absolute value of actual earnings per share. Size is the natural logarithm of book value of total assets. P-values are reported in parentheses. The symbols *, **, and *** indicate statistical significance at the 10%, 5%, and 1% levels, respectively. Leverage Capital expenditure d1 d1 0.0562***
(0.0052) 0.0048
(0.4230)
d1 × P/E ratio -0.0052*** (0.0001)
0.0004 (0.2713)
Leverage 0.0463*** (0.0002)
0.0579 (0.5450)
Capital expenditure -0.0453 (0.6365)
0.4462* (0.0559)
IPE 0.1002** (0.0293)
Depreciation 0.0191 (0.9421)
Quick ratio -0.0091 (0.5001)
Cash flow 0.1987*** (0.0000)
Tax 0.0175 (0.4211)
-0.2981** (0.0331)
Accuracy 0.0144 (0.4277)
Size 0.0186*** (0.0004)
-0.0066*** (0.0000)
0.0545*** (0.0009)
Industry dummies Yes Yes Yes Year dummies Yes Yes Yes R-square 0.6334 0.5728 0.7347 Observations 1,711 2,581 1,241

24
Table 6. Simultaneous Equations Analysis of Hedging and Financing, and Investment Decisions for New Users of Derivatives This table presents results for examining firms’ decisions of derivatives use, leverage, and investment within a simultaneous equations framework for new users of derivatives. The sample contains firm-year observations from the period 1992-1996. Leverage is measured by (long-term debt + current portion of long-term debt)/total assets. Capital expenditure is capital expenditure expenses/total assets. d1 is derivative dummy variable, which is equal to 1 if a firm reports the use of any type of interest rate, foreign currency, or commodity derivatives and zero otherwise. The P/E ratio is calculated by dividing the stock price at the end of fiscal year by operating earnings before depreciation per share. IPE is the ratio of inventory plus plant and equipment to total assets. Depreciation is depreciation expenses/total assets. The quick ratio is calculated as cash and short-term investments over current liabilities. Cash flow is defined as (operating income before depreciation - taxes - interest expenses - common dividends - preferred dividends)/total assets. Tax is net operating loss carry forwards/total assets. Accuracy is analyst forecast accuracy, computed as the absolute value of average analyst forecast errors of fiscal year end earnings per share scaled by the absolute value of actual earnings per share. Size is the natural logarithm of book value of total assets. P-values are reported in parentheses. The symbols *, **, and *** indicate statistical significance at the 10%, 5%, and 1% levels, respectively. Leverage Capital expenditure d1 Intercept 0.1375
(0.1685) -0.0630 (0.1781)
-1.5167*** (0.0000)
d1 0.1574** (0.0199)
-0.0636* (0.0812)
d1 × P/E ratio 0.0025* (0.0814)
0.0022*** (0.0000)
Leverage 0.3832*** (0.0000)
-1.6856** (0.0147)
Capital expenditure -3.9713*** (0.0000)
3.9183*** (0.0000)
IPE 0.8366*** (0.0000)
Depreciation 3.2048*** (0.0000)
Quick ratio -0.0322 (0.4019)
Cash flow 0.2294*** (0.0000)
Tax 0.2897*** (0.0000)
0.1878 (0.5893)
Accuracy -0.0408 (0.3907)
Size -0.0231 (0.1092)
0.0020 (0.8072)
0.2445*** (0.0000)
Log likelihood 893.53 Observations 1,203