hector latorre, abb facts, 201611- -24 tcsc introduction ... · tcsc introduction and its...
TRANSCRIPT

© ABB Group November 28, 2016 | Slide 1
TCSC Introduction and its capability on SSR Mitigation
Hector Latorre, ABB FACTS, 2016-11-24

© ABB Group November 28, 2016 | Slide 2
500 kV TCSC

© ABB Group November 28, 2016 | Slide 3
TCSC Single Line Diagram
Capacitor Bank
MOV
Thyristorvalve
Reactor
Bypassswitch
Bypassswitch
Bypassdisconnector
Seriesdisconnector

TCSCOperational objectives
Thyristor Controlled Series Compensations (TCSC)
Subsynchronous resonance (SSR) mitigation,
Power oscillation damping,
Transient stability
Current (power flow) control,
Voltage control (reactance control),
Phase balancing control
© ABB Group November 28, 2016 | Slide 4

TCSCMain components
Capacitor bank:compensation degree given by the customer
MOV:study performed as a FSC
Reactor:determined by the factor 𝜆𝜆
𝜆𝜆 = 𝜔𝜔0𝜔𝜔𝑁𝑁
𝜆𝜆 = 𝑋𝑋𝐶𝐶𝑋𝑋𝐿𝐿
𝜆𝜆 can be between 2 and 4. Typical values: 2.5 and 3.5
Thyristor valves:Number of thyrstors is mainly a function of the capacitorvoltage at triggering instant and protective level
© ABB Group November 28, 2016 | Slide 5

TCSCSteady state operation
Currents in TCSC circuit
𝑖𝑖𝑉𝑉 = 𝑖𝑖𝐿𝐿−𝑗𝑗𝑋𝑋𝐶𝐶
𝑗𝑗 𝑋𝑋𝐿𝐿 − 𝑋𝑋𝐶𝐶
𝑖𝑖𝐶𝐶 = 𝑖𝑖𝐿𝐿−𝑗𝑗𝑋𝑋𝐿𝐿
𝑗𝑗 𝑋𝑋𝐿𝐿 − 𝑋𝑋𝐶𝐶
© ABB Group November 28, 2016 | Slide 6
iCiL
iV
iLXC
XL
© ABB Group November 28, 2016 | Slide 7
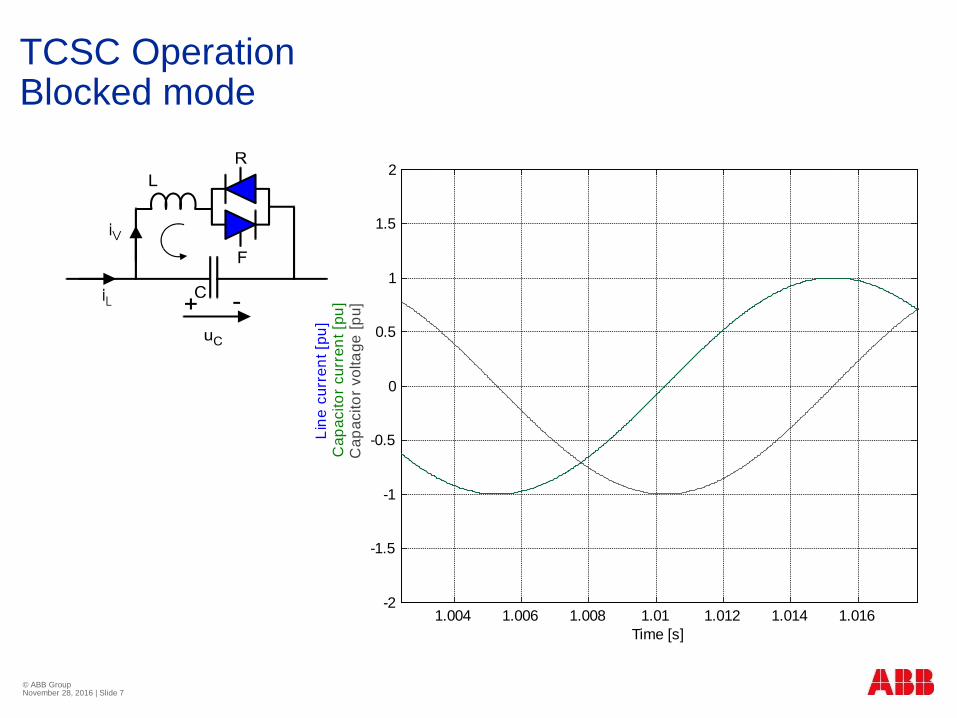
TCSC OperationBlocked mode
1.004 1.006 1.008 1.01 1.012 1.014 1.016-2
-1.5
-1
-0.5
0
0.5
1
1.5
2
Time [s]
Lin
e cu
rren
t [pu
] C
apac
itor
curr
ent [
pu]
Cap
acito
r vo
ltage
[pu]

© ABB Group November 28, 2016 | Slide 8
TCSC OperationCapacitive (boost or Vernier) mode
-50 0 50 100 150 200 250
-1
-0.5
0
0.5
1
-50 0 50 100 150 200 250-2
-1
0
1
2
-50 0 50 100 150 200 250-2
-1
0
1
2
deg
α
β
α−π/2 IL
UC
IV
𝑖𝑖𝐿𝐿
𝑢𝑢𝐶𝐶
𝑖𝑖𝑉𝑉

© ABB Group November 28, 2016 | Slide 9
TCSC OperationCapacitive (boost or Vernier) mode
1.004 1.006 1.008 1.01 1.012 1.014 1.016-2
-1.5
-1
-0.5
0
0.5
1
1.5
2
Time [s]
Lin
e cu
rren
t [pu
] V
alve
cur
rent
[pu]
Cap
acito
r cu
rren
t [pu
] C
apac
itor
volta
ge [p
u]
𝑘𝑘𝐵𝐵 =�𝑈𝑈𝐶𝐶𝐶�𝑈𝑈𝐶𝐶𝐶
Boost factor:
𝑘𝑘𝐵𝐵 =𝑋𝑋𝑎𝑎𝑎𝑎𝑎𝑎𝑋𝑋𝐶𝐶𝐶

© ABB Group November 28, 2016 | Slide 10
Operation in CAP mode
-200 0 200-2
-1
0
1
2
deg
uCbeta= 20.0 deg
-200 0 200-3
-2
-1
0
1
2
3
deg
iL, i
V
-200 0 200-2
-1
0
1
2
deguC
beta= 25.0 deg
-200 0 200-3
-2
-1
0
1
2
3
deg
iL, i
V-200 0 200
-2
-1
0
1
2
deg
uC
beta= 30.0 deg
-200 0 200-3
-2
-1
0
1
2
3
deg
iL, i
V
© ABB Group November 28, 2016 | Slide 11
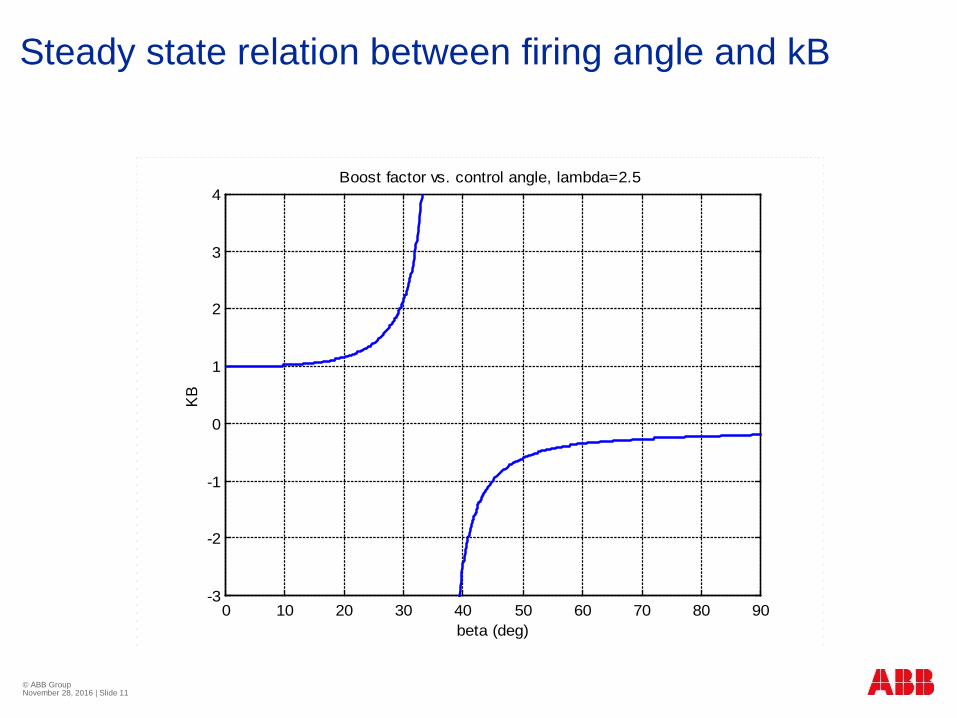
Steady state relation between firing angle and kB
0 10 20 30 40 50 60 70 80 90-3
-2
-1
0
1
2
3
4
beta (deg)
KBBoost factor vs. control angle, lambda=2.5

© ABB Group November 28, 2016 | Slide 12
Typical operating range for POD

© ABB Group November 28, 2016 | Slide 13
Typical operating range for SSR mitigation
0 0.2 0.4 0.6 0.8 1 1.2 1.4 1.6 1.8 2-0.5
0
0.5
1
1.5
2
2.5
3
3.5
Line current [pu]
Boo
st fa
ctor
kB
CAP-mode: Continuous operationCAP-mode: 30 min overloadCAP-mode: 10 sec overloadBP-mode: Continuous operationBP-mode: 30 min overloadBP-mode: 10 sec overload

© ABB Group November 28, 2016 | Slide 14
TCSC ControlSynchronous Voltage Reversal
-50 0 50 100 150 200 250
-1
-0.5
0
0.5
1
-50 0 50 100 150 200 250-2
-1
0
1
2
-50 0 50 100 150 200 250-2
-1
0
1
2
deg
α
β
α−π/2 IL
UC
IV
𝑖𝑖𝐿𝐿
𝑢𝑢𝐶𝐶
𝑖𝑖𝑉𝑉

1.818 1.819 1.82 1.821 1.822 1.823 1.824 1.825 1.826 1.827 1.828-1
0
1
2
3
4
5
6
Lin
e cu
rren
t [kA
]
1.818 1.819 1.82 1.821 1.822 1.823 1.824 1.825 1.826 1.827 1.828-50
0
50
Cap
vol
tage
[kV
]
1.818 1.819 1.82 1.821 1.822 1.823 1.824 1.825 1.826 1.827 1.828-5
-4
-3
-2
-1
0
1
Time [s]
Val
ve c
urre
nt [k
A]
© ABB Group November 28, 2016 | Slide 15
Synchronous Voltage ReversalThyristor action
-30 -20 -10 0 10 20 30
-25
-20
-15
-10
-5
0
5
10
15
20
25
angle [deg]
uC [k
V]
Capacitor voltage: xC= 20.0 ohms, fN= 50 Hz, iL= 1.5 kA, uZ= -10 kV
-30 -20 -10 0 10 20 30-7
-6
-5
-4
-3
-2
-1
0
1
angle [deg]
iV [k
A]
Valve current: xC= 20.0 ohms, fN= 50 Hz, iL= 1.5 kA, uZ= -10 kV

© ABB Group November 28, 2016 | Slide 16
Equivalent instantaneous voltage reversal
boost
boost
realvoltagereversal
equivalentinstantaneous
voltage reversal
thyristor current
a)
b)
c)
tF tZ

© ABB Group November 28, 2016 | Slide 17
Idealized steady-state voltage
Uc
t
Line current
Thyristor action

© ABB Group November 28, 2016 | Slide 18
Boost control
uC
iL iL iL
uC
∆u >0Z∆u =0Z
∆ϕ >0C
uC
∆u <0Z
∆ϕ <0C
Line current
Capacitor voltage
constantboost
increasingboost
decreasingboost

© ABB Group November 28, 2016 | Slide 19
Outline TCSC control
boost controller
SVR trig pulse
generation
apparent Z evaluation
phasor evaluation
PLL
A ∕ B
Σ
A
B-XC0
kBref
re
im
pulsesiL uC
OCT
OVT
OCT: Optical Current TransducerOVT: Optical Voltage Transducer

© ABB Group November 28, 2016 | Slide 20
Apparent impedance
𝑍𝑍𝑎𝑎𝑎𝑎𝑎𝑎 =∆𝑈𝑈∆𝐼𝐼
𝐼𝐼 + ∆𝐼𝐼 𝑈𝑈 + ∆𝑈𝑈

© ABB Group November 28, 2016 | Slide 21
Apparent impedance for FSC and TCSC
iVsub
iLsub
iLsub
uCsub
uCsub
z = ------- = - j ---- xapp C
z = ------- = - j ---- ------------- xapp C= ?
uCsub
uCsub
iLsub
iLsub
fN
fN
fsub
fsub
i -iLsub Vsub
iLsub
xC
xC
fixed series capacitor
TCSC

© ABB Group November 28, 2016 | Slide 22
10 Hz current in a fixed SC
0 0.02 0.04 0.06 0.08 0.1 0.12 0.14 0.16 0.18 0.2-1.5
-1
-0.5
0
0.5
1
1.5
iL [k
A]
Fixed series capacitor xC=20ohms, iL=1000A(50 Hz)+100A(10 Hz)
total line curentonly 10 Hz current
0 0.02 0.04 0.06 0.08 0.1 0.12 0.14 0.16 0.18 0.2-30
-20
-10
0
10
20
30
time [s]
uC [k
V]
total cap voltageonly 10 Hz voltage

© ABB Group November 28, 2016 | Slide 23
DC injection
3.45 3.5 3.55 3.6 3.65 3.7
-2
-1
0
1
2
Lin
e cu
rren
t [kA
] d
c co
mpo
nent
[kA
]
3.45 3.5 3.55 3.6 3.65 3.7-2
-1
0
1
2
Thy
risto
r va
lve
curr
ent [
kA]
3.45 3.5 3.55 3.6 3.65 3.7-20
-10
0
10
20
Time [s]
Cap
acito
r vo
ltage
[kV
]

© ABB Group November 28, 2016 | Slide 24
10 Hz current in a TCSC
0 0.02 0.04 0.06 0.08 0.1 0.12 0.14 0.16 0.18 0.2-1.5
-1
-0.5
0
0.5
1
1.5iL
[kA]
TCSC disturbed operation iL=1000A(50Hz)+100A(10Hz)
total line currentonly 10 Hz current
0 0.02 0.04 0.06 0.08 0.1 0.12 0.14 0.16 0.18 0.2-30
-20
-10
0
10
20
30
time [s]
uC [k
V]
total cap voltage currentonly 10 Hz voltage

© ABB Group November 28, 2016 | Slide 25
SVR apparent subsynchronous impedance
0 0.02 0.04 0.06 0.08 0.1 0.12 0.14 0.16 0.18 0.2-100
-50
0
50
100
time (s)
diLi
ne (A
)

© ABB Group November 28, 2016 | Slide 26
SVR apparent subsynchronous impedance
0 0.02 0.04 0.06 0.08 0.1 0.12 0.14 0.16 0.18 0.2-100
-50
0
50
100
diLi
ne (A
)
xC=20.0 ohms, fN=50.0 Hz fSub=10.0 Hz
0 0.02 0.04 0.06 0.08 0.1 0.12 0.14 0.16 0.18 0.2-4000
-2000
0
2000
4000
duCa
p (V
)
time (s)

© ABB Group November 28, 2016 | Slide 27
SVR apparent subsynchronous impedance
0 0.02 0.04 0.06 0.08 0.1 0.12 0.14 0.16 0.18 0.2-100
-50
0
50
100
diLi
ne (A
)
xC=20.0 ohms, fN=50.0 Hz fSub=10.0 Hz
0 0.02 0.04 0.06 0.08 0.1 0.12 0.14 0.16 0.18 0.2-4000
-2000
0
2000
4000
duCa
p (V
)
time (s)

© ABB Group November 28, 2016 | Slide 28
SVR apparent subsynchronous impedance
0 0.02 0.04 0.06 0.08 0.1 0.12 0.14 0.16 0.18 0.2-100
-50
0
50
100
diLi
ne (A
)
xC=20.0 ohms, fN=50.0 Hz fSub=10.0 Hz
0 0.02 0.04 0.06 0.08 0.1 0.12 0.14 0.16 0.18 0.2-4000
-2000
0
2000
4000
time (s)
duCa
p (V
)
© ABB Group November 28, 2016 | Slide 29
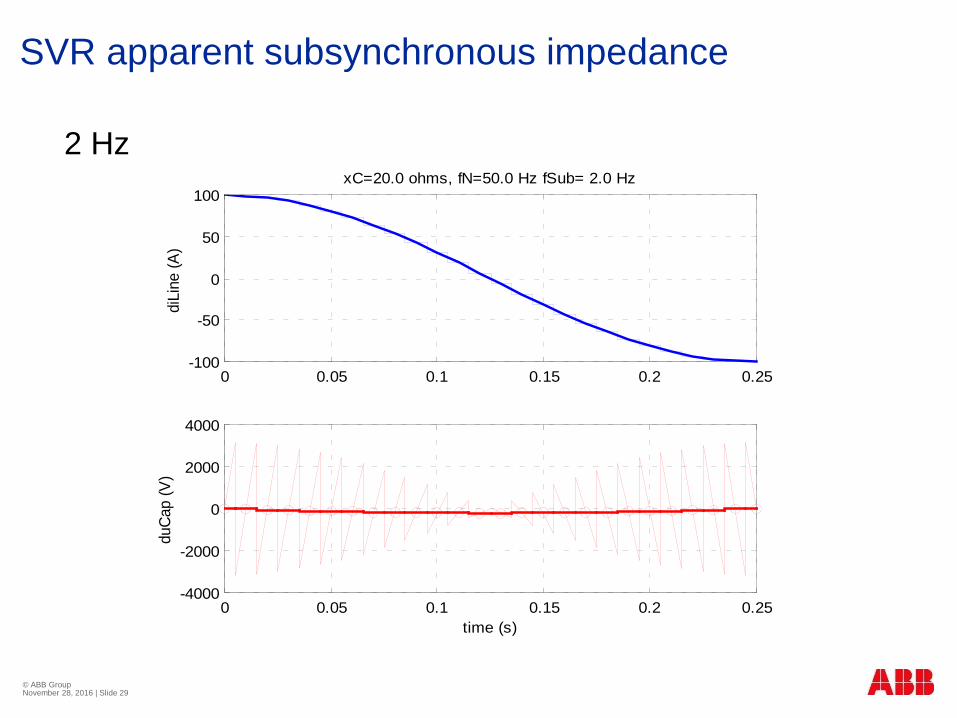
SVR apparent subsynchronous impedance
0 0.05 0.1 0.15 0.2 0.25-100
-50
0
50
100di
Line
(A)
xC=20.0 ohms, fN=50.0 Hz fSub= 2.0 Hz
0 0.05 0.1 0.15 0.2 0.25-4000
-2000
0
2000
4000
time (s)
duCa
p (V
)2 Hz

© ABB Group November 28, 2016 | Slide 30
SVR apparent subsynchronous impedance
0 0.05 0.1 0.15 0.2 0.25-100
-50
0
50
100di
Line
(A)
xC=20.0 ohms, fN=50.0 Hz fSub= 5.0 Hz
0 0.05 0.1 0.15 0.2 0.25-4000
-2000
0
2000
4000
time (s)
duCa
p (V
)5 Hz

© ABB Group November 28, 2016 | Slide 31
SVR apparent subsynchronous impedance
0 0.05 0.1 0.15 0.2 0.25-100
-50
0
50
100di
Line
(A)
xC=20.0 ohms, fN=50.0 Hz fSub=10.0 Hz
0 0.05 0.1 0.15 0.2 0.25-4000
-2000
0
2000
4000
time (s)
duCa
p (V
)10 Hz

© ABB Group November 28, 2016 | Slide 32
TCSC impedance characteristics

SSR Mitigation ExampleTCSC
Screening Studies
© ABB Group November 28, 2016 | Slide 33
5 10 15 20 25 30 35 40 45-0.4
-0.3
-0.2
-0.1
0
0.1
0.2
0.3
0.4y ,
Ele
ctric
al d
ampi
ng,
De [
-]
Torsional frequency [Hz]
No SCFSCTCSC

SSR Mitigation ExampleTCSC
RTDS Tests
© ABB Group November 28, 2016 | Slide 34
∆W
Te
Tm
Subsynchronous mechanical
frequency injection
∆ Y
ZLine TCSC
Synchronousmachine
VoltageSource

15 20 25 30 35 40 45 50-14
-12
-10
-8
-6
-4
-2
0
2
4S1:Mode 5 CAP FAT, S2:Mode 5 BLK FAT
Mechanical frequency [Hz] Mechanical frequency [Hz]
Ele
ctric
al d
ampi
ng [t
orqu
e pu
/ spe
ed p
u] E
lect
rical
dam
ping
[tor
que
pu/ s
peed
pu]
SSR Mitigation ExampleTCSC
RTDS Tests
© ABB Group November 28, 2016 | Slide 35

SSR Mitigation ExampleTCSC and FSC
RTDS Tests
© ABB Group November 28, 2016 | Slide 36
∆W
Te
Tm
Subsynchronous mechanical
frequency injection
∆ Y
ZLine TCSC FSC
Synchronousmachine
VoltageSource

15 20 25 30 35 40 45 50-70
-60
-50
-40
-30
-20
-10
0
10S1:Mode 4 CAP FAT, S2:Mode 4 BLK FAT
Mechanical frequency [Hz] Mechanical frequency [Hz]
Ele
ctric
al d
ampi
ng [t
orqu
e pu
/ spe
ed p
u] E
lect
rical
dam
ping
[tor
que
pu/ s
peed
pu]
SSR Mitigation ExampleTCSC and FSC
RTDS Tests
© ABB Group November 28, 2016 | Slide 37

© ABB Group November 28, 2016 | Slide 38