hec company presentation (3032) · 2016 acquired optima ltd., 60% stock in april acquired lfe...
TRANSCRIPT

P.1
HEC Company Presentation(3032)
• 2017.11.20
• HEC Group

P.2
This power point provide information include the estimated and estimated data, because of it has uncertain reasons, it possible cause the different between reality and PPT date.
Statement
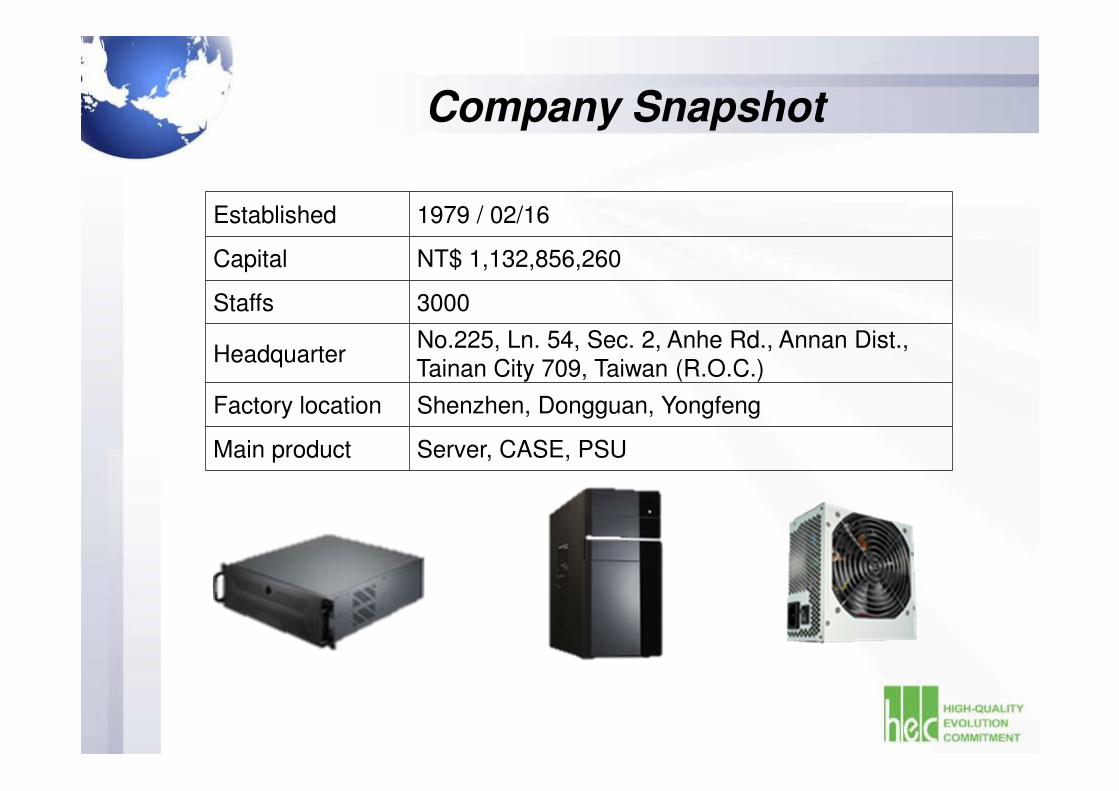
Company Snapshot
Established 1979 / 02/16
Capital NT$ 1,132,856,260
Staffs 3000
HeadquarterNo.225, Ln. 54, Sec. 2, Anhe Rd., Annan Dist., Tainan City 709, Taiwan (R.O.C.)
Factory location Shenzhen, Dongguan, Yongfeng
Main product Server, CASE, PSU

HEC Milestone1979 Established
1989 Import computer case design and development technology
1996 To Establishe professional case manufactory in Shenzhen
obtained ISO9002 certification
1997 Import PSU design and development technology
1999 obtained ISO9001 certification
2001 listed company at OTC
2002 public traded company
2010 To Establishe professional transformer manufactory in Jiangxi
obtained ISO14001 certification
2012 obtained OHSAS18001 certification
2015 To Establishe second professional PSU manufactory in Dongguan
2016 Acquired Optima Ltd., 60% stock in April
Acquired LFE Ltd.,50.48% stock in June

P.5
Optima
Storage
Server
NCT
POS
PC Chassis
Server
LED Driver & Lighting
Power Supply
Medical Bed
Adjustable Bed
Medical Chair
Medical Accessories
HEC GROUP

P.6
OptimaOptimaOptima
Group Synergy
OptimaOptimaOptima
1. Home bed PSU+PLC control
2. Consumer Electronics
1. White box Server
2. Gaming resource
3. Power Supply
1. Hammock
2. Function Table
GroupSynergy

P.7
NT$K
1 2 3 4 5 6 7 8 9 10 11 12
2017 352,229 257,625 325,002 287,867 282,343 298,146 347,958 357,517 462,612
2016 402,150 228,152 420,460 316,959 264,645 262,987 267,743 324,136 411,100 322,958 314,198 398,007
0
50,000
100,000
150,000
200,000
250,000
300,000
350,000
400,000
450,000
500,000
HEC Monthly Sales

P.8
1 2 3 4 5 6 7 8 9 10 11 12
2017 597,128 480,012 628,498 536,013 531,404 565,302 597,383 619,763 715,652
2016 402,150 228,152 420,460 316,959 402,102 413,530 551,018 628,661 676,255 581,125 576,635 704,271
0
100,000
200,000
300,000
400,000
500,000
600,000
700,000
800,000
HEC GROUP Monthly SalesNT$K

HEC NT$K
2017 1~3Q 2016 1~3Q YoY%
Net Revenue 2,845,082 2,609,163 9.0%
COGS 2,377,433 2,306,574 3.1%
Gross Profit 467,649 302,589 54.5%
Operating Expenses 188,842 169,650 11.3%
Operating Profit 278,807 132,939 109.7%
Net Income 205,943 270,768 -23.9%
After Tax EPS (NT$) 1.82 2.62
GPM 16% 12%
OPM 7% 7%
Profit ratio 7% 10%

P.10
HEC GROUP NT$K
2017 1~3Q 2016 1~3Q YoY%
Net Revenue 5,283,535 4,091,183 29.1%
COGS 4,303,166 3,356,658 28.2%
Gross Profit 980,369 734,525 33.5%
Operating Expenses 633,462 452,800 39.9%
Operating Profit 346,907 281,725 23.1%
Net Income 248,184 275,420 -9.9%
Net Income Attributable to:
Shareholders of the Parent 205,943 270,768 -23.9%
After Tax EPS (NT$) 1.82 2.62
GPM 18% 18%
OPM 12% 11%
Profit ratio 5% 7%

P.11
Group Revenue Share by Products
Products %
PC Chassis 22%
Server Chassis 17%
Power Supply 23%
Medical Equipment 21%
Others 17%

Dividend Policy
Year EPS Cash div Div payout Ratio
2016 3.81 2.2 58%
2015 2.62 2 76%
2014 2.06 2 97%
2013 0.48 0.5 104%

P.13
Thank you.
Q&A