heavy vehicle suspensions - testing and analysis....
TRANSCRIPT

Heavy Vehicle Suspensions - Testing and Analysis.
Phase 3 - Eigenfrequency peak loads: measuring suspension health
from wheel loads.
Preliminary test report
Author: Lloyd Davis Department of Main Roads Co-Author: Dr. Jonathan Bunker Queensland University of Technology

Heavy vehicle suspensions - testing and analysis. Phase 3: preliminary test report
ii
© State of Queensland (Department of Transport & Main Roads) & Queensland University of Technology 2009
Reproduction of this publication by any means except for purposes permitted under the Copyright Act is prohibited without the prior written permission of the Copyright owners.
Disclaimer
This publication has been created for the purposes of road transport research, development, design, operations and maintenance by or on behalf of the State of Queensland (Department of Main Roads) and the Queensland University of Technology.
The State of Queensland (Department of Main Roads) and the Queensland University of Technology give no warranties regarding the completeness, accuracy or adequacy of anything contained in or omitted from this publication and accept no responsibility or liability on any basis whatsoever for anything contained in or omitted from this publication or for any consequences arising from the use or misuse of this publication or any parts of it.
Prepared by Lloyd Davis & Dr. Jon Bunker
Version no. Mk VI
Revision date April 2009
Status final, save for dynamometer results (to follow)
DMS ref. no. 890/00037
File/Doc no. 890/00037
File string: C:\in-service testing project\suspension tester report preliminary Mk VI.doc
Corresponding author contact:
Lloyd Davis BEng(Elec) GDipl(Control) Cert(QMgt) CEng RPEQ Fellow, Institution of Engineering & Technology Principal Electrical Engineer ITS & Electrical Technology Corridor Management and Operations Division Transport & Main Roads GPO Box 1412 Brisbane, Qld, 4001 P 61 (0) 7 3834 2226 M 61 (0) 417 620 582 E [email protected]

Heavy vehicle suspensions - testing and analysis. Phase 3: preliminary test report
iii
Table of Contents
1. Introduction..................................................................................... 8
1.1. Aims and objectives.......................................................................... 9
1.2. Rationale........................................................................................ 10
2. Background ................................................................................... 11
2.1. “Friendliness” of “road-friendly” suspensions.................................. 11
2.2. Summary ....................................................................................... 14
3. Experimental procedure ................................................................. 15
3.1. General .......................................................................................... 15
3.2. HV brake tester modifications ........................................................ 15
3.3. Roller-bed installation .................................................................... 18
3.4. Positioning the trailer on the roller-tester ....................................... 21
3.5. Instrumentation............................................................................. 21
3.5.1. Sampling frequency........................................................................ 23
3.6. Final operation............................................................................... 24
3.7. Tested conditions ........................................................................... 25
4. Results........................................................................................... 27
4.1. General .......................................................................................... 27
4.2. Time series of wheel force signals ................................................... 27

Heavy vehicle suspensions - testing and analysis. Phase 3: preliminary test report
iv
4.3. Dynamic range of signal ................................................................. 28
5. Discussion ..................................................................................... 30
5.1. General .......................................................................................... 30
5.2. Difference in wheel-forces for shock absorber health ...................... 30
5.3. Wheel-forces as an indicator of shock absorber health.................... 32
5.4. Test rig and the future ................................................................... 32
6. Conclusion..................................................................................... 33
Table of Figures
Figure 1. End view of modified roller brake tester.......................................................... 16
Figure 2. Roller with 4mm flats. ......................................................................................... 16
Figure 3. 12 kW motor coupled to hydraulic pump........................................................ 17
Figure 4. Hydraulic motor and coupling to roller shaft. ................................................ 17
Figure 5. Hydraulic motor with roller and coupling removed. .................................... 18
Figure 6. Pit used for test rig............................................................................................... 19
Figure 7. Manoeuvring the test rig. ................................................................................... 19
Figure 8. The test rig in the pit. Arrow shows hydraulic safety cut off switch. ......... 20
Figure 9. The test rig in the pit............................................................................................ 20
Figure 10. The final position of the roller in relation to the HV wheel under test...... 21

Heavy vehicle suspensions - testing and analysis. Phase 3: preliminary test report
v
Figure 11. Load cell under roller LHS bearing................................................................. 22
Figure 12. Load cell under roller RHS bearing. ............................................................... 22
Figure 13. Data recording and capture system. ............................................................... 24
Figure 14. Computer used for data capture management. ............................................ 24
Figure 15. Test HV wheel rotating at speed. .................................................................... 25
Figure 16. Time series of the wheel forces for new shock absorbers. ........................... 27
Figure 17. Time series of the wheel forces for worn shock absorbers. ......................... 28
Figure 18. Time series of the wheel forces for no shock absorbers. .............................. 28
Figure 19. Example of dynamic range (peak-to-peak) of the wheel forces.................. 29

Heavy vehicle suspensions - testing and analysis. Phase 3: preliminary test report
6
Executive Summary One response to requests from the transport industry to allow more “freight efficient” heavy
vehicles (HVs) onto the road network has been that road authorities have allowed higher axle
loads in return for HVs being equipped with “road-friendly” suspensions. These suspensions
(particularly those with air springs) are critically dependant on shock absorber health for
proper operation. These suspensions are only certified, however, as “road-friendly” at the
time of manufacture and this via a type-test. Once in service, the “road-friendliness” is
determined solely by the maintenance regime of the transport operator.
One of the triggers for shock absorber replacement in the road transport industry is tyre wear.
Blanksby et al., (2006) showed that this was not a good determinant of damper wear as over
54% of a statistically significant sample of "road-friendly" HVs did not meet at least one of
the criteria in the Australian standard for "road-friendly" HV suspensions (Blanksby et al.,
2006). Previous reports on the prevalence of, and increased damage done by HVs with worn,
out-of-specification or defective suspension dampers have been commissioned and published
(Blanksby et al., 2006; Cebon, 2004; Costanzi & Cebon, 2005, 2006). The results in this
report align with the conclusions of that work and indicate that Qld Main Roads could save
approximately $76M/annum were HV operators to maintain their shock absorbers to
manufacturers' specifications.
There is no in-service test for HV suspensions in Australia yet. In-service testing for “road-
friendliness would advantage the transport industry and road asset owners. The former
because worn dampers could be replaced before vehicle and payload damage occurs; high-
mileage but still serviceable shock absorbers need not be replaced (saving labour and
equipment costs). The latter through reductions in road and bridge asset rehabilitation costs
through less wear-and tear from HVs with out-of-specification or deficient shock absorbers.
That a test would be advantageous has been recognised by the Australian Government, the
States of New South Wales and Queensland. These organisations are funding a programme to
develop an in-service suspension test for HVs. The expansion of higher mass limits (HML)
routes across Queensland and New South Wales was made conditional on such a test being
developed (Australia Department of Transport and Regional Services, 2005a, 2005b). The
National Transport Commission (NTC) is the project manager for the development of this test.
This report examines a test methodology involving a moderate-cost test bed that provides a
low-cost-per-test methodology for an in-service HV suspension test. The results are presented

Heavy vehicle suspensions - testing and analysis. Phase 3: preliminary test report
7
within the context of a “proof-of-concept” test programme. The preliminary results indicate
that low-cost-per-test suspension testing is possible with a moderate-cost testing rig.
Under the joint QUT/MR project Heavy vehicle suspensions – testing and analysis a test bed
has been developed by modifying the roller from a HV brake tester. This test bed was
designed to impart a known vibration to the wheel of a HV under test. This by having flat
portions machined into the roller that, when the roller was spun, imparted a cyclic vibration to
the wheel of the HV under test. The modified brake-testing machine was instrumented with
load cells at the bearings of the roller. No instrumentation was installed, nor required, on the
HV. A wheel load approximating full load was used. Damping on the wheel of the test HV
was varied in three stages:
� none (no shock absorbers);
� worn to the point of tyre wear; and
� meeting the manufacturer's specification (i.e. new shock absorber).
The preliminary results from this test programme show that:
• the dynamic signals from the load cells may be used to determine the threshold beyond
which HV suspensions cause tyre wear and road damage compared with when they are
new; and
• a moderate-cost testing machine to perform bulk, low-cost HV suspension testing is
possible at the “proof-of-concept” level.
This is a preliminary report covering only one test load and three different shock absorber
conditions. The timing of the NTC project, the delivery schedule of the NTC's consultant's
report and the timetable for the tests outlined herein has necessitated that this report has had to
be truncated with respect to the level of detail that should be supplied in an ideal situation.
This report and other reports (available as analysis continues) will be sent to the National
Transport Commission (NTC) as a contribution to the in-service suspension test project and
will also form part of the final output in the QUT/Main Roads project Heavy vehicle
suspensions – testing and analysis.

Heavy vehicle suspensions - testing and analysis. Phase 3: preliminary test report
8
1. Introduction
The conclusions from DIVINE project (OECD, 1998) were used in Australia to justify
the introduction of air-suspended heavy vehicles (HVs) carrying more mass. DIVINE
(OECD, 1998), amongst others (de Pont, Thakur, & Costache, 1995; Woodroofe,
1996), noted the results of suspension testing using a shaker bed imparting sinusoidal
inputs to determine suspension characteristics. These shaker beds, whilst valuable
tools for experimental and other laboratory-level testing, are expensive items to deploy
for mass testing programmes (Cebon, 1999).
Under the joint QUT/MR project Heavy vehicle suspensions – testing and analysis it
was proposed to develop a low-cost test bed made from a modified heavy vehicle
(HV) brake tester (Davis & Bunker, 2008a). This by making one of the rollers
eccentric. It was hypothesised that, by rotating the wheels of a HV under test using an
eccentric roller, a known vibration could be imparted to the wheel under test. It was
proposed that measurement of the forces at the bearings of the roller should provide an
indication of the HV wheel-forces and, were the level of serviceability of the shock
absorbers varied; any differences in wheel-load should provide a quality indicator
corresponding to a change of damper characteristic.
The testing has been carried out. Preliminary results are presented in this report.
Conclusions regarding:
• the levels of damper maintenance beyond which HV suspensions cause road
damage; and
• dynamic wheel forces at the threshold of tyre wear at which HV shock
absorbers are normally replaced
are presented.
The Australian Government and the States of New South Wales and Queensland are
funding a programme to develop an in-service suspension test for HVs. The
expansion of higher mass limits (HML) routes across Queensland and New South

Heavy vehicle suspensions - testing and analysis. Phase 3: preliminary test report
9
Wales was made conditional on such a test being developed (Australia Department of
Transport and Regional Services, 2005a, 2005b). The National Transport
Commission (NTC) is the project manager for that development. This is a preliminary
report covering only one test load and three different shock absorber conditions. The
timing of the NTC project, the delivery schedule of the NTC's consultant's report,
other commitments within the QUT/Main Roads project Heavy vehicle suspensions –
testing and analysis and the timetable for the tests outlined herein has necessitated that
this report has been truncated from the level of detail that might have been supplied in
an ideal situation. This report and other reports (available as analysis continues) will
be sent to the National Transport Commission (NTC) as a contribution to the in-
service suspension test project and will also form part of the final output in the
QUT/Main Roads project Heavy vehicle suspensions – testing and analysis.
1.1. Aims and objectives The results from this test programme are proffered to inform the issue of the threshold
at which HV shock absorbers should be replaced compared with when they are usually
replaced due to tyre wear. The aim of this approach is to assist the National Transport
Commission (NTC) as a contribution to the in-service suspension test project
(Australia Department of Transport and Regional Services, 2005a, 2005b).
Accordingly, a heavy vehicle brake-test roller machine was instrumented and
modified. It was used to provide a cyclic loading into a HV suspension under test
using eccentricity in a roller.
In addition, the use of the modified roller-brake machine yielded:
• a “proof-of-concept” of moderate-cost testing machine to perform low-cost
HV suspension testing; and
• conclusions on levels of maintenance beyond which HV suspensions move
outside the envelope of “road friendliness”.
Heavy vehicle suspensions - testing and analysis. Phase 3: preliminary test report
10
For the purposes of this report, the results for a wheel load of approximately full load
have been used. Results for other wheel loads will be reported as time and resources
for analysis permit.
Three shock absorber condition-states were tested:
� no shock absorber (i.e. simulating the presence of a shock absorber
worn to the point where its damping function had become totally
ineffective);
� a shock absorber worn to the point where it was taken off a donor
vehicle because tyre wear had become apparent and was therefore due
for replacement under the conventional approach of the road transport
industry. This shock absorber was the reference for the "used to the
point of tyre wear" condition state in our testing; and
� a fully-functional shock absorber (i.e. within specification) for the
suspension being measured.
This document sets out the equipment, procedures and preliminary results from
modification of the HV brake test unit and the experimental methodology to determine
HV wheel-forces therefrom, particularly for the different damping values used.
1.2. Rationale By placing a HV’s wheel on a roller, a known vibration can be imparted to that HV
wheel as a test. Sweatman used a modified drum on a roller-dynamometer to create an
input signal to a HV suspension (Sweatman, 1983). This for purposes of cross
calibration of instrumentation and to characterise the input function on that
suspension. One of the proposed methods that Gyenes et al., (1992) summarised for
determining axle hop and damped fundamental frequency of body-bounce was by
performing a low-amplitude (1mm) sinusoidal sweep excitation (that is, a frequency
scan). It was postulated that the eigenfrequencies of the sprung (body) and unsprung
(axle hop) components could be found by the highest amplitude wheel-forces
measured after such a sweep.

Heavy vehicle suspensions - testing and analysis. Phase 3: preliminary test report
11
Cyclic inputs to test HV suspensions using simulators have been well documented
(Hoogvelt, van Asseldonk, & Henny, 2004; Woodroofe, 1996). Prem et al.,
concluded that constant amplitude sinusoidal sweeps and increasing-force frequency
sweeps were of use in characterising suspensions for road-friendliness and in-service
testing provided the latter was used in conjunction with type-test data (Prem, George,
& McLean, 1998). Ahmadian (2003) noted that using this method on complete HVs
in a reaction frame allowed the resonant frequencies of individual HV components to
be found, particularly suspension components and the beams of the chassis.
The DIVINE (OECD, 1998) project showed the results of ineffective shock absorbers
on HV wheel loadings. Woodrooffe (1996) reported on dynamic loading tests where
the wheels of a loaded HV were subject to a 1mm sinusoidal sweep frequency input.
The control case for dampers in good condition then was compared with two test cases
of ineffective shock absorbers.
The methodology used for the testing in this report allowed the recording of wheel-
force data for varying levels of shock absorber maintenance and differing loads.
Analysis of this data indicates that the wheel-forces vary proportionally with damper
performance.
2. Background
2.1. “Friendliness” of “road-friendly” suspensions Road authorities and transport regulators are under continuous pressure, internally and
externally, from the transport industry to allow “freight efficient” vehicles onto the
road network. Outputs from the final report of the DIVINE project (OECD, 1998)
were used in Australia to support the argument that air-sprung heavy vehicles (HVs)
should carry greater mass under the micro-economic reform popular in the 1980s and
1990s in Australia. One of these reforms was the mass limits review (MLR) project as
implemented under the 2nd heavy vehicle reform package (National Transport
Commission, 2003). It was concluded that HVs operating at higher mass limits
(HML) and equipped with “road friendly” suspensions (RFS) would be no more
damaging than conventional heavy vehicles (HVs) operating at statutory masses with

Heavy vehicle suspensions - testing and analysis. Phase 3: preliminary test report
12
conventional steel springs (Pearson & Mass Limits Steering Committee, 1996). This
resulted in the implementation of higher mass limits (HML) schemes in various guises
in all Australian States. HML allows HVs to carry greater mass in return for, amongst
other requirements, being equipped with “road friendly” suspensions (RFS). The
documents leading to the introduction of HML noted that suspension damper (shock
absorber) health was crucial to RFS being no more damaging to pavements at HML
loadings than conventional steel-suspended HVs at statutory mass.
If transport operators were maintaining their vehicles to specification and regulation
then there would be no need for concern on the part of road authorities and transport
regulators. However, work in NSW has indicated (Blanksby et al., 2006) that 54% of
HVs in a statistically valid survey did not meet at least one of the requirements of
VSB 11, the Australian standard for heavy vehicle suspension "road-friendliness”.
The possible scenario of non-standard MCVs with more than statutory mass (at or
higher than HML loadings) on axles or axle groups with worn or out-of specification
suspension dampers has now become a better than even-money probability. This is of
concern to Australian road authorities and transport regulators.
The anecdotal HV transport industry view of worn shock absorbers and the attendant
issue of air suspension health is that the resultant tyre wear is detected quickly. This is
then rectified to prevent further increased tyre wear and the associated costs of
premature tyre replacement. Despite this view, the Marulan survey (Blanksby et al.,
2006) showed that more than half the HVs equipped with "road-friendly" suspensions
sampled on the Hume Highway did not meet at least one VSB 11 suspension
parameter. This result was somewhat expected since Sweatman et al., (2000) found
that:
• quantitative evaluation of shock absorbers did not usually take place in most
fleets; and
• the trigger for replacement of shock absorbers was visible leakage or lack of
heat after a trip.
From this empirical evidence, it may be inferred that the industry indicators of using
tyre wear, leakage or temperature to detect out-of-specification or deficient shock
absorbers is too late in the maintenance cycle to be effective at meeting the Australian

Heavy vehicle suspensions - testing and analysis. Phase 3: preliminary test report
13
requirements for “road-friendly” HV suspensions. Compounding this issue is the fact
that there are no recognised low-cost in-service HV suspension tests in Australia. This
has been discussed previously (Starrs et al., 2000, Sweatman et al., 2000) without
decisive action by regulators until recently. That action is now occurring on this issue
is due to agreement between two Australian States and the Commonwealth (Australia
Department of Transport and Regional Services, 2005a, 2005b).
Within the framework described above and its indeterminacy with respect to RFS
health, regulators and road authorities have not been able to be certain that air-sprung
heavy vehicles (HVs) with RFS are having their “road friendliness” maintained as the
suspension dampers wear from normal service.
Costanzi & Cebon (2005) modelled a fleet of HVs with 50% ineffective dampers.
That report concluded that, at Higher Mass Limits loadings, pavement and surfacing
damage would be 20 - 30% greater than for a comparable freight task with a fleet
equipped with dampers in good condition. The Costanzi & Cebon study was for HVs
on the Newell Highway. The Newell has considerably thicker pavements than those
found in Queensland (Queensland Department of Main Roads, 2007). If the figure of
50% poorly maintained suspensions modelled by Costanzi et al., is equated to the
actual status found at Marulan then a HV fleet with 100% functional shock absorbers
would save Queensland Main Roads’ maintenance budget $76M/annum in 2008
dollars (Queensland Department of Main Roads, 2008); a saving going forward every
year. This is essentially “free money” to government since HV suspensions should be
maintained as a matter of course.
The order of magnitude of these savings indicates that the previously estimated benefit
to pavement rehabilitation costs of $14M in 2000 dollars across Australia (Starrs Pty
Ltd, Ian Wright and Associates, & ARRB Transport Research Ltd, 2000) was low,
even allowing for cost escalation and inflation with the effluxion of time.
Further, the consideration of well-maintained dampers does not include the road
safety, Local Government asset impact or workplace health and safety aspects of a HV
fleet with in excess of 50% sub-optimal shock absorbers.

Heavy vehicle suspensions - testing and analysis. Phase 3: preliminary test report
14
2.2. Summary Shock absorber wear in HVs is not detected quickly nor in a timely manner (Blanksby
et al., 2006). Transport industry indicators of tyre wear, shock absorber oil leakage or
lack of heat arise too late to be effective in keeping a RFS suspension within the
Australian “road friendly” suspension specification. In-service testing has not been
explored in Australia with a definitive way forward until the bilateral infrastructure
funding agreements between two Australian States and the Commonwealth (Australia
Department of Transport and Regional Services, 2005a, 2005b). Such testing could
save Queensland approximately $76M/annum.
The testing outlined in this report and the preliminary results therefrom address these
issues in part by:
� testing a typical HV suspension with shock absorbers at different levels
of utility; and
� developing a “proof-of-concept” for a moderate-capital-cost, high-
volume, low-cost-per-test HV suspension testing methodology and
associated equipment.

Heavy vehicle suspensions - testing and analysis. Phase 3: preliminary test report
15
3. Experimental procedure
3.1. General The following section outlines a portion of the test programme. Other tests were
carried out and will be detailed in future papers and reports. The HV under test was a
semi-trailer equipped with standard Meritor 9000 axles without modification, save for
changing the shock absorbers as mentioned.
3.2. HV brake tester modifications HV brake testing machines are generally configured as two or four rollers in a rigid
frame. The wheels of the vehicle under test are placed between the rollers (Davis &
Bunker, 2008a). For normal operation to test the brakes on a vehicle, the vehicle’s
wheels are spun under the power of the tester. The brakes of the test vehicle are
applied. A dynamometer then measures whether the retardation force present from the
braking effect of the test vehicle’s wheels is adequate.
The brake testing functions of the roller brake tester were not used for this test
programme. The only features of the roller brake tester used were two rollers and the
frame.
The test rig used was modified from the original roller-brake tester in that the wheel
under test sat on top of one roller only. A general view of the test rig used is shown in
Figure 1. In this figure, the power unit is in the foreground and the roller is mounted
at the end of the frame furthermost from the viewer.
The roller used had two diametrically opposed flats 4 mm deep (Figure 2). The
amount of material removed to create the flats was chosen to provide sufficient depth
of eccentricity so that results could be compared with similar research (Woodroofe,
1996). The eccentricity created provided repetitive input to the test vehicle’s wheel.

Heavy vehicle suspensions - testing and analysis. Phase 3: preliminary test report
16
Figure 1. End view of modified roller brake tester.
The brake tester's original drive motors and ancillary devices such as the arm on the
idler roller and the testing control console were discarded. A 22 kW capacity electric
motor driving a hydraulic pump (Figure 3) which, in turn, drove a hydraulic motor
(Figure 5) was used as the power unit for the testing. The hydraulic motor was
connected to the roller via a coupling (Figure 4). To eliminate any effect of motor
torque altering the readings on the load cells, the motor was mounted on a plate
attached to a torque arm. This torque arm and arrangement to allow the motor to float
is shown in Figure 5. In this way, we ensured that vertical loads presented to (and
measured by) the load cells were from the wheel without influence from motor torque.
Figure 2. Roller with 4mm flats.

Heavy vehicle suspensions - testing and analysis. Phase 3: preliminary test report
17
Figure 3. 22 kW motor (blue fins), coupled to hydraulic pump in the hydraulic fluid reservoir.
Figure 4. Hydraulic motor (right) and coupling to roller shaft (left).

Heavy vehicle suspensions - testing and analysis. Phase 3: preliminary test report
18
Figure 5. Hydraulic motor with roller and coupling removed. Note torque arm, slightly obscured (arrow A) was connected to hydraulic motor mounting plate, B. Locating frame (C) allowed motor mount to float.
The hydraulic motor was controlled via valves and a safety switch. The safety switch
is shown (Arrow "A") in Figure 8. The speed of the roller was controlled via a
coupling to the hydraulic bypass valve shown (arrow "C") in Figure 9.
3.3. Roller-bed installation The modified test rig retained the overall frame dimensions of the original tester from
which it was made. Brake testers are designed to be installed in roadside pits during
HV interceptions by regulatory authorities or in pits as part of a HV service facility. A
pit was constructed according to the manufacturer of the roller tester (FKI Crypton
Ltd, 1990). It is shown in Figure 6.
A
B
C

Heavy vehicle suspensions - testing and analysis. Phase 3: preliminary test report
19
Figure 6. Pit used for test rig.
The test rig was manoeuvred as shown in Figure 7. It was positioned and installed as
shown in Figure 8 and Figure 9.
Figure 7. Manoeuvring the test rig.
Heavy vehicle suspensions - testing and analysis. Phase 3: preliminary test report
20
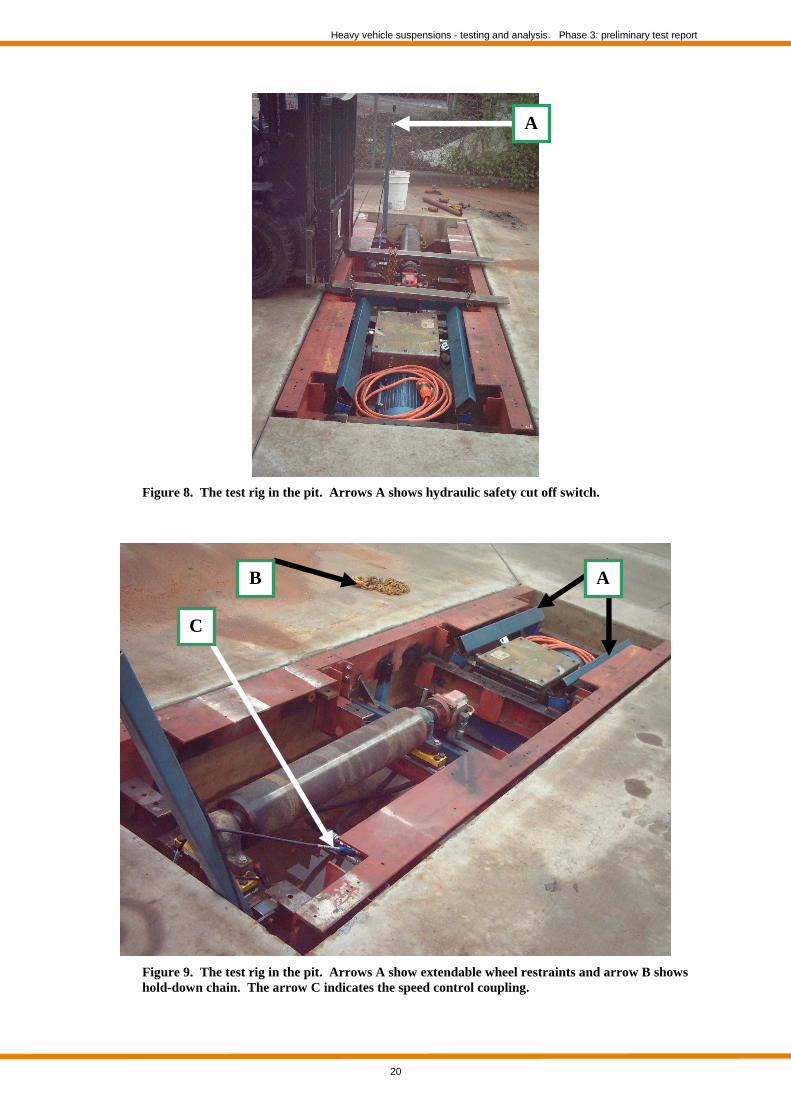
Figure 8. The test rig in the pit. Arrows A shows hydraulic safety cut off switch.
Figure 9. The test rig in the pit. Arrows A show extendable wheel restraints and arrow B shows hold-down chain. The arrow C indicates the speed control coupling.
C
A B
A

Heavy vehicle suspensions - testing and analysis. Phase 3: preliminary test report
21
3.4. Positioning the trailer on the roller-tester The test HV (a semi-trailer) was positioned such that the RHS middle wheel of the tri-
axle group was on the roller. The LHS wheel of the middle axle was constrained
using extendable retaining frames (indicated by arrows "A", Figure 9) and chained
down (arrow "B", Figure 9) as an added precaution. The brakes on the trailer were
applied except for the brake on the wheel under test. These measures were a safety
precaution due to the uncertain nature of any testing. It is expected that this level of
restraint would not be necessary should this test procedure be implemented
commercially.
The final arrangement of the wheel and its relationship with the drive roller is shown
in Figure 10.
Figure 10. The final position of the roller in relation to the HV wheel under test.
3.5. Instrumentation Commercial load cells (strain gauges attached to a steel block) were installed under
the bearings at each end of the roller. Figure 11 and Figure 12 show this detail. The

Heavy vehicle suspensions - testing and analysis. Phase 3: preliminary test report
22
dynamic wheel force was found from the sum of the forces on the load cells. This was
then calibrated as wheel force in kilograms.
Figure 11. Load cell (indicated A) under roller LHS bearing.
Figure 12. Load cell (indicated B) under roller RHS bearing.
A
B

Heavy vehicle suspensions - testing and analysis. Phase 3: preliminary test report
23
An advanced version of the TRAMANCO P/L on-board CHEK-WAY® telemetry
system was used to measure and record the dynamic signals from the outputs of the
strain gauges. Figure 13 shows the CHEK-WAY® recording system and Figure 14
shows the system management computers. The data sets were recorded in the memory
of the CHEK-WAY® units (boxes indicated "A" in Figure 13). The data sets were
recorded in 10 s blocks. A system management computer, Figure 14, was used to
manage the data capture timing and post-test data downloads.
The CHEK-WAY® system is subject to Australian Patent number 200426997 and
numerous international application numbers and patents that vary by country.
3.5.1. Sampling frequency
The telemetry system-sampling rate was 1 kHz giving a sample interval of 1.0 ms.
Note that the natural frequency of a typical heavy vehicle axle is 10 - 15 Hz (Cebon,
1999) compared with a relatively low 1 - 4 Hz for sprung mass frequency (de Pont,
1999). Any attempt to measure relatively higher frequencies (such as axle-hop) using
time-based recording will necessarily involve a greater sampling rate than when
relatively lower frequencies (such as the body-bounce frequency) are to be determined
(Houpis & Lamont, 1985). Since axle-hop was the highest frequency of interest for
the analysis undertaken, the sampling frequency used by the CHEK-WAY® system
was more than adequate to capture the test signal data since its signal sample rate was
much greater than twice any axle-hop frequency. Should this test be implemented
commercially, a data logger with sampling frequency of (say) 100 Hz would suffice.
Accordingly, and to check the validity of the choice of sampling frequency, the
Nyquist sampling criterion (Shannon’s theorem) was met (Houpis & Lamont, 1985)
for our testing.

Heavy vehicle suspensions - testing and analysis. Phase 3: preliminary test report
24
Figure 13. Data recording and capture system.
Figure 14. Computer used for data capture management.
3.6. Final operation Figure 15 shows the test HV wheel run up on the roller with a roller rotational speed
of 360 revolutions per minute. This resulted in a cyclic loading from the two flats on
the roller.
A

Heavy vehicle suspensions - testing and analysis. Phase 3: preliminary test report
25
Figure 15. Test HV wheel rotating at speed.
3.7. Tested conditions The following section outlines a portion of the test programme. The test cases
detailed in this report are shown in Table 1.
Table 1. Shock absorber condition and test loading for the tests as documented herein.
Condition 4mm flats on roller
Full Load
No shock absorbers
√
Worn shock absorbers (see section 1.1)
√
New shock absorbers √
For the three condition states of:
� no shock absorber;
� a shock absorber that had worn to the point where it removed from its
donor vehicle because tyre wear had become apparent; and

Heavy vehicle suspensions - testing and analysis. Phase 3: preliminary test report
26
� a fully-functional shock absorber (i.e. within specification) for the
suspension being measured
at a load approximating full load (3 t) on the wheel, the test HV wheel was spun up
using the powered roller of the test rig.
The worn shock absorber used for the testing will be dynamometer tested and the
results of that testing, when available, will be published in augmented versions of this
report in future.
For the data presented in this report, the hydraulic valves of the test rig were set so that
the final speed of the roller reached 360 revolutions per minute. This meant that, with
two flats per revolution, the frequency of the forcing function from the flats of the
roller was 12 Hz. This was at or above the highest axle-hop frequency measured for
this trailer and suspension (Davis & Bunker, 2008b). Other speeds were used and data
recorded for these. The results of that analysis will be reported in future papers and at
other fora.

Heavy vehicle suspensions - testing and analysis. Phase 3: preliminary test report
27
4. Results
4.1. General The signals from the load cells under the roller bearings were conditioned and filtered
with a 25 Hz low-pass filter to remove noise. Time-series and peak-to peak values are
shown in the following section.
4.2. Time series of wheel force signals Portions (and representative samples) of the time series of the wheel-force signals for
the three states of shock absorber health are shown in Figure 16 to Figure 18. As
reported by other researchers such as Woodrooffe (1996), resonance occurred during
the transients from starting the roller compared with the steady-state running dynamic
forces. This may be seen in the starting transients for the worn and no shock absorber
cases in the 0.5-1.0 s or so before the signal settled down to fairly even excursions.
time series of wheel force at roller - new shock ab sorbers
2800
2850
2900
2950
3000
3050
3100
3150
0 0.2 0.4 0.6 0.8 1 1.2 1.4 1.6 1.8 2time (s)
whe
el fo
rce
(kg)
wheel force at roller
Figure 16. Time series of the wheel forces for new shock absorbers.

Heavy vehicle suspensions - testing and analysis. Phase 3: preliminary test report
28
time series of wheel force at roller - worn shock a bsorbers
27002750280028502900295030003050310031503200
0 0.2 0.4 0.6 0.8 1 1.2 1.4 1.6 1.8 2time (s)
whe
el fo
rce
(kg)
wheel force at roller
Figure 17. Time series of the wheel forces for worn shock absorbers.
time series of wheel force at roller - no shock abs orbers
2500
2600
2700
2800
2900
3000
3100
3200
3300
0 0.2 0.4 0.6 0.8 1 1.2 1.4 1.6 1.8 2
time (s)
whe
el fo
rce
(kg)
wheel force at roller
Figure 18. Time series of the wheel forces for no shock absorbers.
4.3. Dynamic range of signal The peak-to-peak value (i.e. the dynamic range) of the wheel-force signal was derived
for the three cases of shock absorber health. This concept is illustrated in Figure 19.

Heavy vehicle suspensions - testing and analysis. Phase 3: preliminary test report
29
Figure 19. Example of dynamic range (peak-to-peak value) of the wheel forces.
The values of dynamic range1 for wheel forces with the three conditions of shock
absorber health are shown in Table 2. These values were derived from the dynamic
data shown in graphical form in Figure 16 to Figure 18.
Table 2. Shock absorber condition for the tests as documented herein.
Condition at 3t
static wheel loading
Peak-to-peak value
of wheel force (kg)
for flats with 4 mm
excitation
Difference
compared with new
shock absorber case
(%)
No shock absorbers
415 97.6
Worn shock absorbers (see section 1.1)
280 33.3
New shock absorbers 210 n/a
1 Calibration data to translate the load cell signals into wheel force had not been finalised when developing earlier drafts of
this report. Revised, updated and final calibration values have been used to develop the data presented here.
Heavy vehicle suspensions - testing and analysis. Phase 3: preliminary test report
30
5. Discussion
5.1. General The delivery schedule of the NTC's project to find and/or develop an in-service
suspension test for HVs has, unfortunately, clashed with other commitments within
the joint QUT/Main Roads project Heavy vehicle suspensions – testing and analysis.
This tension has necessitated that a preliminary set of results be issued in the format of
this preliminary report. Nonetheless, the programme of analysis and further results
from the testing outlined in this report will continue and further reports will be issued.
5.2. Difference in wheel-forces for shock absorber health With 4 mm flats on the roller, the dynamic wheel forces above static were
approximately doubled when comparing the case of new shock absorbers vs. no shock
absorbers. Further, dampers worn to the point where they would be replaced because
the tyres were starting to wear provided approximately 33% more dynamic loading to
the pavement compared with dampers in the new condition when the wheel was
excited by 4 mm excursions. It will be for future research to determine what level of
increase in dynamic wheel forces occurs when wheels damped with worn, ineffective
or out-of-specification shock absorbers encounter pavement and bridge irregularities
with magnitudes greater than the excursions used for these tests. Even so, the figures
herein and their orders-of-magnitude are indicative, at least, of the increases to the
road and asset damage from HVs with worn, ineffective or out-of-specification
dampers.
Previous research (Davis & Bunker, 2008b) has shown that HV wheel loads at
highway speeds resonate continuously at axle hop frequencies in the range 10 Hz to 12
Hz. For the exercise described in this report, a 4mm excitation was used to induce
axle-hop in a HV wheel. For the case of worn shock absorbers, this resulted in an
increased peak wheel-load of 70 kg more than for the case for new shock absorbers.
The axle-hop excitation for the case no shock absorbers resulted in a peak wheel load
of 205 kg more than for the case for new shock absorbers.

Heavy vehicle suspensions - testing and analysis. Phase 3: preliminary test report
31
Let us estimate that, conservatively, road excitation has a 4mm range (in reality, a low
estimate). Even so, these results indicate that HVs with worn shock absorbers, with
condition-states somewhere between tyre wear being apparent to totally ineffective,
are imposing peak loadings on the pavement and bridges between 2.3% and 6.8%
higher than for the case of well-maintained shock absorbers. Applying a conservative
4th-power rule for the relationship between pavement loading and pavement damage,
this result indicates that instantaneous loading from worn, out-of specification or
defective shock absorbers on HVs is creating instantaneous loading damage increases
in the range of 9.7% to 30.2% when compared with well-maintained dampers. This
exercise does not account for the 12th-power rule for concrete pavements where the
increase in damage would be proportionally worse; nor does it account for excitation
due to road irregularities of greater than 4mm. From the work of Costanzi & Cebon
(2005) who modelled a fleet of HVs with 50% ineffective dampers, the conclusion
arose that, at Higher Mass Limits loadings, pavement and surfacing damage would be
20 - 30% greater than for a comparable freight task with a fleet equipped with
dampers in good condition. We see here a confluence of figures with respect to
rectification costs from the approach developed above and that of Costanzi & Cebon
(2005).
Main Roads' budget for maintenance in the 2007-2008 financial year was $253M
(Queensland Department of Main Roads, 2008) or 11% of total expenditure of $2.3B
spent on maintenance. It is not unreasonable to propose that road asset damage is due
to heavy vehicles compared with the damage from any other form of road traffic.
From the indicative exercise on increased instantaneous pavement loadings above, a
potential saving of up to 30.2% of the maintenance portion of Main Roads' budget, or
$76.4M/annum could be gained from the simple expedient of road transport operators
testing their HVs and replacing worn shock absorbers. This would then obviate the
situation (Blanksby et al., 2006) where over 54% of the heavy vehicle fleet does not
meet the provisions of VSB 11, the Australian standard for HV suspension "road-
friendliness”.

Heavy vehicle suspensions - testing and analysis. Phase 3: preliminary test report
32
5.3. Wheel-forces as an indicator of shock absorber health The generally accepted practice and anecdotal evidence in the road transport industry
is for tyre wear to be used as an indicator that suspension dampers are worn.
Blanksby et al., (2006) showed that this is not a good determinant of damper wear.
The testing as outlined in this report has gathered data on wheel-forces present when a
shock absorber was worn to the point that tyre wear was evident. When compared
with the forces for the case where the shock absorber was in good condition, there was
a clear distinction both in shape of dynamic signal at the roller and the range of that
signal. For the case where the shock absorber was removed entirely, the comparison
was even more striking.
5.4. Test rig and the future The use of the modified roller-brake machine has shown, at the “proof-of-concept”
stage, that wheel-forces can be used to determine damper health. Should additional
analysis of the test data from this test programme further validate the methodology
described herein, the next step is to consider the cost of such testing. The modified
test rig used for these tests cost approximately $AUD10,000 for the initial purchase of
a second-hand roller brake tester and the modifications to it. The instrumentation used
cost approximately $AUD5,000 but this could be lower if a simple 100 Hz data logger
were used. The analysis would, on the commercial market, cost approximately $100
per axle group. The brake testing machine from which our test rig was made was a
standard unit that was not altered with respect to its original overall dimensions. A
commercial variant of it should therefore be able to fit into existing infrastructure at
roadside interception sites or vehicle maintenance facilities where brake testers were
designed to fit. Accordingly, a moderate-cost testing machine could perform low-
cost-per-test HV suspension testing in a high-volume application.

Heavy vehicle suspensions - testing and analysis. Phase 3: preliminary test report
33
6. Conclusion
Using tyre wear as an indicator that suspension dampers are worn is not an indicator
that results in timely shock absorber replacement. This report shows that wheel forces
from a suspension with worn shock absorbers at the point where tyre wear was
apparent were clearly distinguishable from the forces present when new or no dampers
were present. The dynamic component of these forces ranged from 33% to
approximately double those of the dynamic forces present in a HV suspension in good
condition. Other research, such as that by Blanksby et al., (2006) has shown that the
philosophy of damper replacement predicated on tyre wear is unreliable. This since
over 54% of the HVs surveyed in that work had worn, ineffective or out-of-
specification dampers without noticeable tyre wear. Deployment of regular damper
testing and resultant replacement of worn, out-of-specification or defective shock
absorbers has the potential to save Main Roads up to $76M/annum. This figure aligns
well with the figure derived from earlier work by Costanzi & Cebon (2005). This
saving could then go forward every year to fund other programmes instead of
rectifying road asset damage from heavy vehicles that should be maintained as a
matter of course. This approach does not account for any safety benefits of heavy
vehicles with well-maintained suspensions, nor does it consider, except for noting and
future research, the benefits to Local Governments in potential savings to their works
budgets.
The testing as outlined in this test plan has gathered data on dynamic wheel-forces
present with varying shock absorber health levels. The results in this preliminary
report indicate that, for a very small (4 mm) excitation signal, the dynamic range (over
and above the steady-state) of the wheel forces for the case where the shock absorbers
were totally inoperable was higher, by about twice, than that for the case of new shock
absorbers. The results also showed that, for a 4mm excitation and damper condition
starting to wear the tyres, the dynamic pavement forces were 33% higher than for new
shock absorbers.
The results indicate that a “proof-of-concept” for a moderate-cost testing machine to
perform low-cost-per-test heavy vehicle suspension testing has been achieved with the

Heavy vehicle suspensions - testing and analysis. Phase 3: preliminary test report
34
use of a modified roller-brake tester. Further work will now be undertaken on the data
recorded during the test programme including frequency-domain analysis to determine
further insights into eigenfrequency phenomena other than reported here. These
results will be reported in future.

Heavy vehicle suspensions - testing and analysis. Phase 3: preliminary test report
35
Appendix 1.
Dynamometer results of dampers to be inserted when available.
References
Ahmadian, M. (2003). Laboratory evaluation of heavy truck dynamics: are the test results useful? Paper presented at the International Truck & Bus Meeting & Exposition Fort Worth Texas.
Australia Department of Transport and Regional Services. (2005a). Bilateral agreement between the Commonwealth of Australia and the State of New South Wales 2004 - 2009. Retrieved 7 Sept, 2007, from http://www.auslink.gov.au/publications/policies/pdf/NSW_Bilateral.pdf
Australia Department of Transport and Regional Services. (2005b). Bilateral agreement between the Commonwealth of Australia and the State of Queensland 2004-05 – 2008-09. Retrieved 7 Sept, 2007, from http://www.auslink.gov.au/publications/policies/pdf/Qld_bilateral.pdf
Blanksby, C., George, R., Germanchev, A., Patrick, S., & Marsh, F. (2006). In-service survey of heavy vehicle suspensions (Report No. VC71235-01-01 08/2006). Sydney: ARRB group, Roads and Traffic Authority of NSW.
Cebon, D. (2004). Impacts of vehicles with higher mass limits on NSW roads. Sydney.: NSW Roads and Traffic Authority.
Cebon, D. (Ed.). (1999). Handbook of vehicle-road interaction. Lisse, South Holland, Netherlands: Swets & Zeitlinger.
Costanzi, M., & Cebon, D. (2005). Simulation of damage evolution in a spray sealed road (Technical report No. CUED/C-MECH/TR.90). Sydney: Cambridge University Engineering Department, Roads and Traffic Authority NSW.
Costanzi, M., & Cebon, D. (2006). Simulation of damage evolution in a spray sealed road. Paper presented at the International Symposium on Heavy Vehicle Weights and Dimensions, 9th, 2006, State College, Pennsylvania, USA.
Davis, L., & Bunker, J. (2008a). Heavy vehicle suspensions - testing and analysis: Phase 3 - eigenfrequency peak loads. Test plan. Brisbane, Queensland: Queensland University of Technology.
Davis, L., & Bunker, J. (2008b). Suspension testing of 3 heavy vehicles – methodology and preliminary frequency analysis. Brisbane, Queensland: Queensland Department of Main Roads; Queensland University of Technology.
de Pont, J. J. (1999). Suspensions or whole vehicles? Rating road-friendliness. International Journal of vehicle design, 6(1-4), 23.

Heavy vehicle suspensions - testing and analysis. Phase 3: preliminary test report
36
de Pont, J. J., Thakur, K., & Costache, M. (1995). Simulating in-service heavy vehicle suspension dynamics. Paper presented at the International Symposium on Heavy Vehicle Weights and Dimensions, 4th, 1995, Ann Arbor, Michigan, USA.
FKI Crypton Ltd. (1990). FKI Crypton 630 commercial vehicle brake tester installation instructions. Bristol Rd, Bridgewater, Somerset, UK.
Gyenes, L., Mitchell, C. G. B., & Phillips, S. D. (1992). Dynamic pavement loads and tests of road-friendliness for heavy vehicle suspensions. In Cebon & Mitchell (Eds.), Heavy vehicles and roads: technology, safety and policy (pp. 243-251). London, United Kingdom: Thomas Telford.
Hoogvelt, B., van Asseldonk, N., & Henny, R. (2004). Measurement technology for a calibrating vehicle for multiple sensor weigh- in-motion system. Paper presented at the International Symposium on Heavy Vehicle Weights and Dimensions, 8th, 2004, Muldersdrift, South Africa.
Houpis, C. H., & Lamont, G. B. (1985). Digital control systems theory, hardware, software. New York, New York, USA: McGraw-Hill.
National Transport Commission. (2003). Transport reforms higher mass limits (second heavy vehicle reform package). Retrieved 6 Sept 2007, from http://www.ntc.gov.au/Project.aspx?page=A0240030550000002000325
OECD. (1998). Dynamic interaction between vehicles and infrastructure experiment (DIVINE) (Technical report No. DSTI/DOT/RTR/IR6(98)1/FINAL). Paris, France: Organisation for Economic Co-operation and Development (OECD).
Pearson, B., & Mass Limits Steering Committee. (1996). Mass limits review: a study of the feasibility and net benefits of increasing mass limits for vehicles fitted with road friendly suspension systems: technical supplement no 4: operational, financial and charging impacts. Melbourne, Victoria, Australia: National Road Transport Commission (NRTC).
Prem, H., George, R., & McLean, J. (1998). Methods for evaluating the dynamic-wheel-loading performance of heavy commercial vehicle suspensions. Paper presented at the International Symposium on Heavy Vehicle Weights and Dimensions, 5th, 1998, Maroochydore, Queensland, Australia.
Queensland Department of Main Roads. (2007). Higher mass limits - stage 2 (Implementation plan). Brisbane, Queensland, Australia: Queensland Department of Main Roads.
Queensland Department of Main Roads. (2008). Annual report (Annual report). Brisbane, Queensland, Australia: Queensland Main Roads.
Starrs Pty Ltd, M. M., Ian Wright and Associates, & ARRB Transport Research Ltd. (2000). Evaluation of in-service compliance of road friendly suspensions (Report No. 0642544670). Melbourne, Victoria, Australia: National Road Transport Commission (NRTC).
Sweatman, P. F. (1983). A study of dynamic wheel forces in axle group suspensions of heavy vehicles (Special report No. 27). Vermont South, Victoria, Australia: Australian Road Research Board (ARRB).

Heavy vehicle suspensions - testing and analysis. Phase 3: preliminary test report
37
Sweatman, P. F., McFarlane, S., Komadina, J., & Cebon, D. (2000). In-service assessment of road-friendly suspensions: for information (Report No. 0642544522). Melbourne, Victoria, Australia: National Road Transport Commission (NRTC).
Woodroofe, J. H. F. (1996). Heavy truck suspension dynamics: methods for evaluating suspension road-friendliness and ride quality. In Society of Automotive Engineers (SAE) (Ed.), Commercial vehicles and highway dynamics SP-1201 (pp. 68). Warrendale, Pennsylvania, USA: Society of Automotive Engineers (SAE).
© State of Queensland (Department of Main Roads) & Queensland University of Technology 2009