heatwaves: hotter, longer, more often - …€¦ · other extreme weather events, ... this is the...
TRANSCRIPT

HEATWAVES: HOTTER, LONGER, MORE OFTEN
The Climate Council is an independent, crowd-funded organisation providing quality information
on climate change to the Australian public.
CLIMATECOUNCIL.ORG.AU

Written by Professor Will Steffen, Professor Lesley Hughes and Dr. Sarah Perkins
Published by the Climate Council of Australia Limited.
ISBN: 978-0-9924142-2-1 (print) 978-0-9924142-3-8 (web)
© Climate Council of Australian Ltd 2014.
This work is copyright the Climate Council of Australia Ltd. All material contained in this work is copyright the Climate Council of Australia Ltd except where a third party source is indicated.
Climate Council of Australia Ltd copyright material is licensed under the Creative Commons Attribution 3.0 Australia License. To view a copy of this license visit http://creativecommons.org.au
You are free to copy, communicate and adapt the Climate Council of Australia Ltd copyright material so long as you attribute the Climate Council of Australia Ltd and the authors in the following manner:
Heatwaves: Hotter, Longer, More Often by Professor Will Steffen, Professor Lesley Hughes and Dr. Sarah Perkins.
© Climate Council of Australia Limited 2014.
Permission to use third party copyright content in this publication can be sought from the relevant third party copyright owner/s.
WARNING: This report may contain the images of Aboriginal and Torres Strait Islander people now deceased.
This report is printed on 100% recycled paper.
HEATWAVES: HOTTER, LONGER, MORE OFTEN
CLIMATECOUNCIL.ORG.AU

global trends in heatwaves is clear and
compelling. The impacts of heatwaves
are often under-the-radar compared to
other extreme weather events, but they
are widespread and serious, damaging
human health, infrastructure and
natural ecosystems; and decreasing
workplace performance and agricultural
productivity. The report concludes by
outlining what needs to be done to
slow, and eventually stabilize, the trend
towards more severe and more frequent
heatwaves. The report draws directly on
the peer-reviewed scientific literature
as well as on authoritative assessments,
such as those of the Intergovernmental
Panel on Climate Change (IPCC). A
reference list is provided at the end of
the report for those who would like more
information.
We are very grateful to our team of expert
reviewers and community readers,
whose comments and suggestions
improved the report. The expert
reviewers were: Dr Lisa Alexander
(University of New South Wales), Prof
Helen Berry (University of Canberra),
Prof David Karoly (University of
Melbourne), Prof Tord Kjellstrom (Health
and Environment International Trust,
Mapua, New Zealand), and Dr Sophie
Lewis (University of Melbourne). We also
thank the Bureau of Meteorology and
Preface
For the second year in a row, heatwaves
and extreme hot weather have plagued
much of Australia. Preliminary accounts
of the January 2014 heatwave in Victoria
point to significant health impacts—203
heat-related deaths, a 20-fold increase in
ambulance call-outs, a four-fold increase
in calls to nurses-on-call, and a four-fold
increase to locum doctors. Severe heat
also afflicted areas further north: for the
week ending 4 January 2014, average
maximum temperatures were 8°C or
more above normal in southern inland
Queensland. By 9 February Canberra
had recorded 16 days above 35°C this
summer, compared to the long-term
average of 5.2 days. Australia’s extreme
heat drew international attention
when play in the 2014 Australian Open
tennis tournament was suspended for
the afternoon of 16 January because
of the heat. Off-court ambulances
treated almost 1000 tennis fans for heat
exhaustion in the first few days of the
tournament.
This report sets out the facts about
heatwaves and hot weather. We explore
the observed changes to heatwaves in
Australia—their severity, duration and
timing—and place this in the context
of increasing extreme heat around
the world. The contribution of climate
change to the Australia-wide and
This is the second major report of the Climate Council. The Council is an independent, non-profit organisation, funded by donations from the public. Our mission is to provide authoritative, expert information to the Australian public on climate change.
CLIMATECOUNCIL.ORG.AU

CSIRO, which reviewed the accuracy and
relevance of the science underpinning
the report. Their reviews are not an
endorsement of the conclusions drawn.
We are also grateful for Ron Collins,
Jill Dumsday and Michael Kirkpatrick’s
feedback as community readers.
We are also grateful to Climate Council
staff for their many contributions to the
production of this report.
The authors retain sole responsibility for
the content of the report.
Professor Will Steffen
Climate Councillor
Professor Lesley Hughes
Climate Councillor
Dr Sarah Perkins
HEATWAVES: HOTTER, LONGER, MORE OFTEN
CLIMATECOUNCIL.ORG.AU

ContentsPreface Key findings
Introduction 1
1. Heatwaves are becoming longer and more intense .................................................... 2 1.1 The nature of changing heatwaves 3
In Detail 1: Variability in heatwave characteristics 10
1.2 Severe heatwaves in other parts of the world 15
1.3 The influence of climate change on heatwaves 17
2. Impacts of heatwaves .........................................................................................................20 2.1 Human health
Direct impacts on health 21
Indirect impacts 27
Workplace safety and productivity 29
2.2 Infrastructure 32
2.3 Agriculture 34
2.4 Natural Ecosystems 36
3. Interaction of heatwaves with other extreme events and environmental stresses ...............................................................................38 3.1 Droughts 39
3.2 Bushfires 40
3.3 Multiple interacting stresses on coral reefs 42
In Detail 2: Multiple interacting stresses on coral reefs 43
4. Heatwaves in the future ...................................................................................................45 4.1 Projections for extreme heat globally 46
4.2 Projections of future hot weather for Australia 49
4.3 Implications of more severe heatwaves and hot weather 51
4.4 This is the critical decade 53
References 56
What to do in a heatwave
CLIMATECOUNCIL.ORG.AU

1. Climate change is already increasing the intensity and frequency of heatwaves in Australia. Heatwaves are becoming hotter, lasting longer and occurring more often.
› Over the period 1971–2008, both
the duration and frequency of
heatwaves increased, and the
hottest days during heatwaves
became even hotter.
› Hot days have doubled in Australia
in the last 50 years. In the last
decade, hot weather records have
occurred three times more often
than cold weather records.
› Several of our capital cities—
Adelaide, Melbourne and
Canberra—are experiencing more
intense hot weather than expected.
The increase in hot weather
observed in the 2000–2009 decade
has already reached the best
estimate projected for 2030.
› The southeast of Australia, which
includes many of our largest
population centres, stands out as
being at increased risk from many
extreme weather events, including
heatwaves, drought and bushfires.
› The trend toward more frequent and
more severe heatwaves in Australia
is part of a larger global trend. Very
severe heatwaves have occurred
elsewhere, including Europe in 2003,
Russia in 2010 and several regions in
the south and central US in 2011 and
2012.
2. Climate change is making heatwaves worse in terms of their impacts on people, property, communities and the environment. Heatwaves have widespread impacts, ranging from direct impacts on our health to damage to ecosystems, agriculture and infrastructure.
› Heatwaves pose a widespread
risk for Australians as they affect
people in all capital cities and
most regional areas. Over the past
100 years, heatwaves have caused
more deaths than any other natural
hazard. Heatwaves also restrict
work capacity and decrease the
productivity of exposed workers.
› Extreme heat can damage
infrastructure such as electricity
distribution and transport systems,
causing flow-on effects. Heatwaves
experienced in Melbourne in
recent years have disrupted the
railway system and electricity grid.
› Hot, dry conditions have a major
influence on bushfires—these
conditions are driving up the
likelihood of very high fire danger
weather. Heatwaves exacerbate
drought, which in turn can also
increase bushfire risk.
Key findings
HEATWAVES: HOTTER, LONGER, MORE OFTEN
CLIMATECOUNCIL.ORG.AU

Key findings › Heatwaves affect marine
ecosystems, particularly vulnerable
reefs. The 2011 marine heatwave
in Western Australia caused the
first-ever reported bleaching of
Ningaloo reef. Bleaching events
on the Great Barrier Reef have
occurred repeatedly since the late
1970s.
› Heatwaves can reduce crop yields,
decrease livestock productivity
and trigger mass deaths of heat-
sensitive species such as flying
foxes and birds.
› It is crucial that communities;
emergency services; health, medical
and social services; and other
authorities prepare for the increases
that are already occurring in the
severity and frequency of hot weather.
3. The climate system has shifted, and is continuing to shift, increasing the likelihood of more extreme hot weather.
› As greenhouse gases continue to
accumulate in the atmosphere,
primarily from the burning of fossil
fuels, more heat is trapped in the
lower atmosphere. This increases
the likelihood of more frequent and
more severe heatwaves.
› Small increases in average
temperature lead to much larger
increases in the frequency and
intensity of extreme heat.
› Since 1950, increases in extreme daily
temperatures have been reported over
most regions of the globe.
4. Record hot days and heatwaves are expected to increase in the future
› The number of hot days, warm
nights and heatwaves are all
expected to increase through the
21st century across the globe.
› Record hot days and warm nights
are also expected to increase across
Australia over the coming decades.
For both northern and southern
Australia, 1-in-20 year extreme hot
days are expected to occur every
two to five years by the middle of
the century.
› If the current trend in greenhouse
gas emissions continues through
the rest of this century, today’s
record-breaking hot weather will
become commonplace, occurring
almost every summer across the
country.
5. Limiting the increase in heatwave activity requires urgent and deep reductions in the emissions of greenhouse gases.
› The choices we make over this
decade will largely determine the
severity of the extreme heat that
our children and grandchildren will
experience.
› To stabilize the climate, action on
reducing emissions is required
now. This is the critical decade.
CLIMATECOUNCIL.ORG.AU

IntroductionHeatwaves are one of the most important climate-related risks for Australians.
The extreme heat in Melbourne that
plagued the 2014 Australian Open Tennis
Tournament and the record-breaking
heat in large areas of Queensland this
summer reminded us of the risks that
heatwaves pose. Coming on the heels of
a record-breaking summer of 2012/2013,
this summer’s heat is part of a longer-
term trend towards hotter weather
(Climate Commission 2013a). The link
between climate change and more
extreme heatwaves is clear.
This report begins by exploring the
long-term observations of hot weather
to show how the nature of heatwaves is
changing—their length, their frequency,
their intensity and when they are
occurring. We then describe what these
trends mean for Australians—their
impacts on our health and well-being,
infrastructure, agriculture, biodiversity,
and natural ecosystems. But heatwaves
don’t occur in isolation from other
factors and their interactions with events
such as droughts can exacerbate the
effects of extreme heat. Finally, we take
a look at the future—how the risks of
extreme heat change as the Earth warms
further, and what we need to do to
stabilize the climate and avoid the more
severe projections for future heatwaves.
Page 1
HEATWAVES: HOTTER, LONGER, MORE OFTEN
CLIMATECOUNCIL.ORG.AU

1.HEATWAVES ARE BECOMING LONGER AND MORE INTENSE
Page 2
As greenhouse gases continue to accumulate in the atmosphere from the burning of fossil fuels, more heat is trapped in the lower atmosphere. This increases the likelihood that hot weather will occur and that heatwaves will become longer and more intense. Observations over the past half-century confirm this physical process.
In this section we first describe the observational evidence of how the nature of heatwaves is changing in Australia. We then look at how heatwaves are changing around the rest of the world. Finally, we show the role of climate change in influencing the trends that we are observing.
Hot days, hot nights and extended periods of hot weather—heatwaves—are one of the most direct consequences of climate change.
Page 2

Since 1950 the annual number of record hot days across Australia has more than doubled (CSIRO and BoM 2012) and the mean temperature has increased by about 0.9°C (BoM 2012).
Over the past decade, the frequency of
record hot days has been more than three
times the frequency of record cold days
(Trewin and Smalley 2013). The hottest
ever area-averaged Australian maximum
temperature occurred on 7 January 2013,
reaching 40.3°C. This means that the
maximum temperature averaged over
the whole continent on that day was
over 40°C. Extreme temperature records
were broken in every state and territory
throughout the course of the 2012/2013
summer.
While hot weather is a pre-requisite for
heatwaves, it is important to remember
that heatwaves are more than just
stand-alone hot days. At least three
excessively hot days must occur in a
row for a heatwave to form, according
to the Australian definition (BoM 2012;
Nairn and Fawcett 2013). Furthermore,
heatwaves have several significant
characteristics. These include (i)
frequency characteristics, such as the
number of heatwave days and the annual
number of summer heatwave events;
(ii) duration characteristics, such as
the length of the longest heatwave in
a season; (iii) intensity characteristics,
such as the average excess temperature
expected during a heatwave and the
hottest day of a heatwave; and (iv) timing
characteristics, including the occurrence
of the first heatwave event in a season.
Each heatwave characteristic shows
different rates and patterns of
change across Australia. Numerous
characteristics of heatwaves have
increased across many regions of
Australia since the middle of the 20th
century (Alexander and Arblaster 2009),
with trends for some characteristics
accelerating in the most recent decades.
Over the period 1971–2008, both the
duration and frequency of heatwaves
1.1 The nature of changing heatwaves
Over the period 1971–2008, both the duration and frequency of heatwaves increased, and in several parts of the country the hottest days during heatwaves became even hotter.
Page 3
HEATWAVES: HOTTER, LONGER, MORE OFTEN
CLIMATECOUNCIL.ORG.AU
increased, and in several parts of
the country the hottest days during
heatwaves became even hotter (Perkins
and Alexander 2013). This is consistent
with trends in heatwaves for other global
regions, such as Central Asia and Europe
(See section 1.3; Perkins et al. 2012).
Using the heatwave definition of the
Australian Bureau of Meteorology (Nairn
and Fawcett 2013), Figure 1 depicts
changes in five heatwave characteristics
across the continent from 1950–2013.
Figure 1(A) clearly shows that the number
of heatwave days has increased over
much of Australia (see also Figure 2),
particularly the eastern half. An increase
in the number of heatwave days in turn
influences the number of heatwave
events and/or their duration. Although
smaller, the areas of increasing trends
in heatwave frequency (Figure 1(B)) and
duration of the longest annual event
(Figure 1(C)) are consistent with the
increase in heatwave days. Increases in
the number of heatwave events and in
their duration will generally lag behind
increases in the number of heatwave
days. While an increase in the number of
days is required to increase the duration
and the frequency, both cannot occur
at the same time. That is, for each extra
heatwave day, the new heatwave day can
contribute to either heatwave duration
or heatwave frequency, but not to both
characteristics.
Since 1950, despite considerable year-
to-year variability, almost all of Australia
has experienced a lengthening of the
heatwave season (Figure 1(D)), with
the first event occurring much earlier
(Table 1). The intensity of heatwaves,
as measured by the temperature of the
hottest day (the peak of the heatwave),
is also increasing. Figure 1(E) shows that
the temperature of the hottest day of a
heatwave has increased over almost all of
Australia below the tropics. Such trends
are consistent with, and extend, the
trends reported by Perkins and Alexander
(2013) since they include the latest
complete data for Australian summers.
In Australia, a heatwave is defined operationally as a period of at least three days where the
combined effect of high temperatures and excess heat is unusual within the local climate (BoM
2012; Nairn and Fawcett 2013). Two aspects of this definition are important. First, a heatwave is
defined relative to the local climate. That is, a heatwave for Hobart will occur at lower temperatures
than one for Alice Springs. Second, the concept of excess heat is also important. Excess heat occurs
when unusually high overnight temperatures do not provide relief from the daytime heat.
WHAT IS A HEATWAVE?
Page 4CLIMATECOUNCIL.ORG.AU
01 HEATWAVES ARE BECOMING LONGER AND MORE INTENSE

Red indicates an increase in the number of heatwave events per summer.
An increase in the number of heatwave days in turn influences the number of heatwave events and/or their duration, and although smaller, areas of increasing trends in heatwave frequency (Figure B) and duration of the longest yearly event (Figure C) are consistent with that of heatwave days. Note that changes in heatwave events and duration will generally lag behind that of heatwave days—while an increase in the number of days is required to increase the duration and frequency, both cannot occur at the same time. That is, for each extra heatwave day that is gained, the new day can only contribute to heatwave duration or frequency.
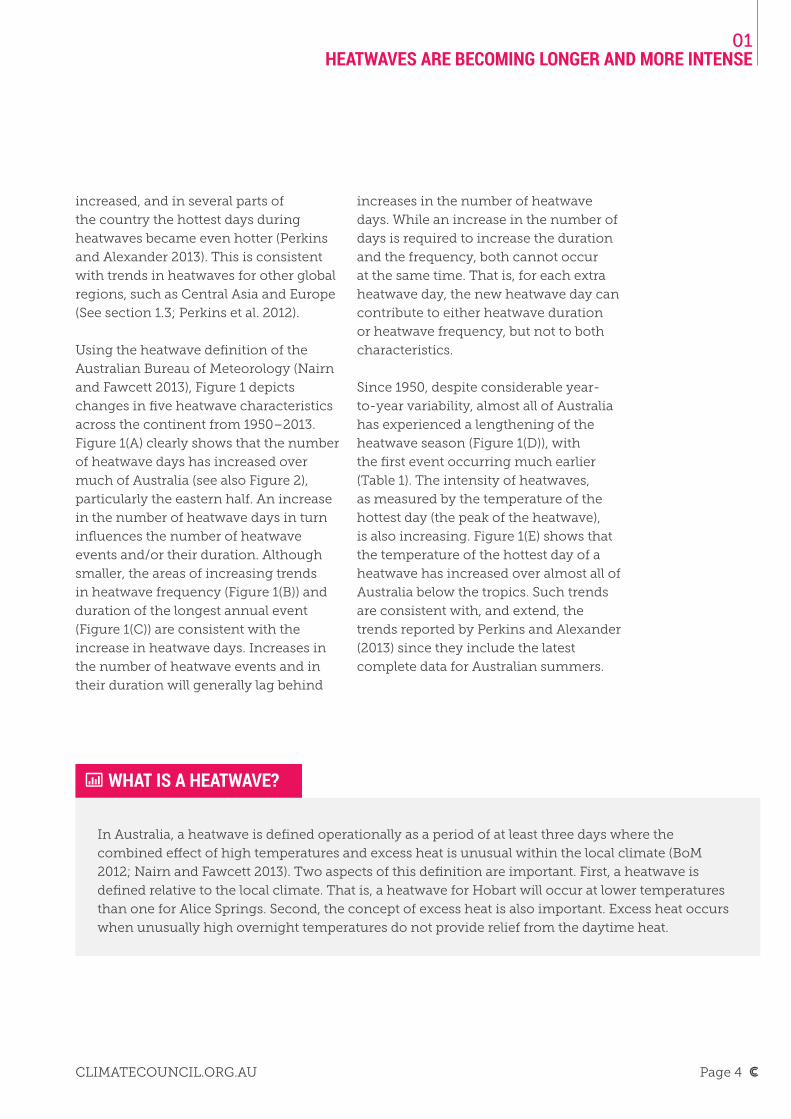
Figure 1: Heatwaves in Australia are becoming hotter, longer, more frequent, and occurring earlier. Figures A through E depict changes in five heatwave characteristics across the continent from 1950–2013. All heatwave metrics are calculated relative to a 1961–1990 base period, using the heatwave definition from the Australian Bureau of Meteorology (Nairn and Fawcett 2013). Source: Modified from Perkins and Alexander (2013) using AWAP (Australian Water Availability Project) data from the Bureau of Meteorology.
How are heatwaves changing in Australia?
B HEATWAVES ARE OCCURING MORE FREQUENTLY
10°S
15°S
20°S
25°S
30°S
35°S
40°S
45°S120°E 130°E 140°E 150°E
-1 -0.6 -0.2 0.2 0.6 1
Number of heatwave events per summer
Red shows an increase in the number of heatwave days. Figure A clearly shows that the number of heatwave days has increased over much of Australia, particularly the eastern half.
A THE NUMBER OF HEATWAVE DAYS IS INCREASING
10°S
15°S
20°S
25°S
30°S
35°S
40°S
45°S120°E 130°E 140°E 150°E
-2 -1.2 -0.4 0.4 1.2 2
Heatwave days expressed as a percentage of all summer days per summer.
Page 5
HEATWAVES: HOTTER, LONGER, MORE OFTEN
CLIMATECOUNCIL.ORG.AU
-1 -0.6 -0.2 0.2 0.6 1
Red shows increasing temperatures. Figure E shows that the hottest day of a heatwave, i.e. its peak, has a detectable increase for almost all of Australia below the Tropics. Such trends are consistent with, and continue on from those reported by (Perkins et al. 2012), since they include the latest complete Australian summer data.
E THE HOTTEST DAY OF A HEATWAVE IS BECOMING HOTTER
10°S
15°S
20°S
25°S
30°S
35°S
40°S
45°S120°E 130°E 140°E 150°E
-5 -4 -3 -2 -1 0 1 2 3 4 5
Extreme Heat Factor units (°C2)
Red indicates a heatwave occurring earlier relative to the long-term average. Since 1950, almost all of Australia has experienced a lengthening of the heatwave season, where the first event is occurring much earlier (Figure D).
D THE FIRST HEATWAVE OF THE SEASON IS OCCURING EARLIER
10°S
15°S
20°S
25°S
30°S
35°S
40°S
45°S120°E 130°E 140°E 150°E
-10 -8 -6 -4 -2 0 2 4 6 8 10
Start day of the first event per summer
Red indicates an increase in the number of days of the longest heatwave of a summer.
C THE DURATION OF THE LONGEST YEARLY HEATWAVE IS INCREASING
10°S
15°S
20°S
25°S
30°S
35°S
40°S
45°S120°E 130°E 140°E 150°E
The length in days of the longest event per summer
Page 6CLIMATECOUNCIL.ORG.AU
01 HEATWAVES ARE BECOMING LONGER AND MORE INTENSE
Heatwaves: State of the Nation
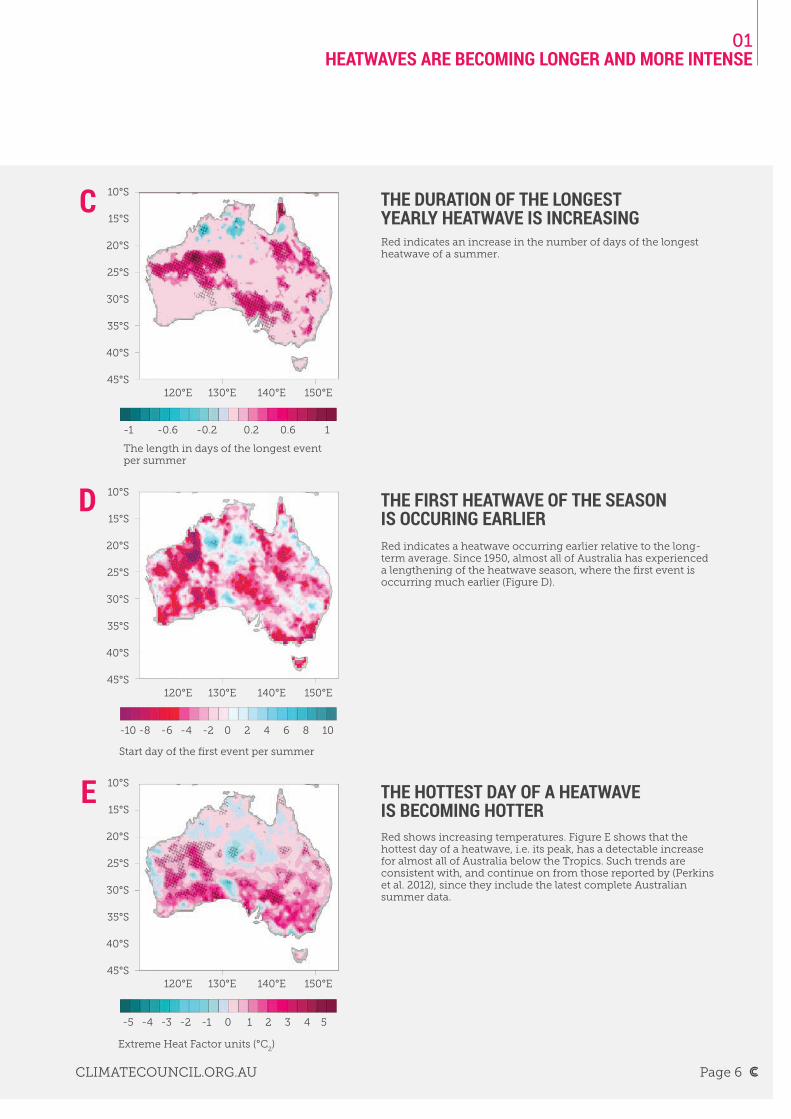
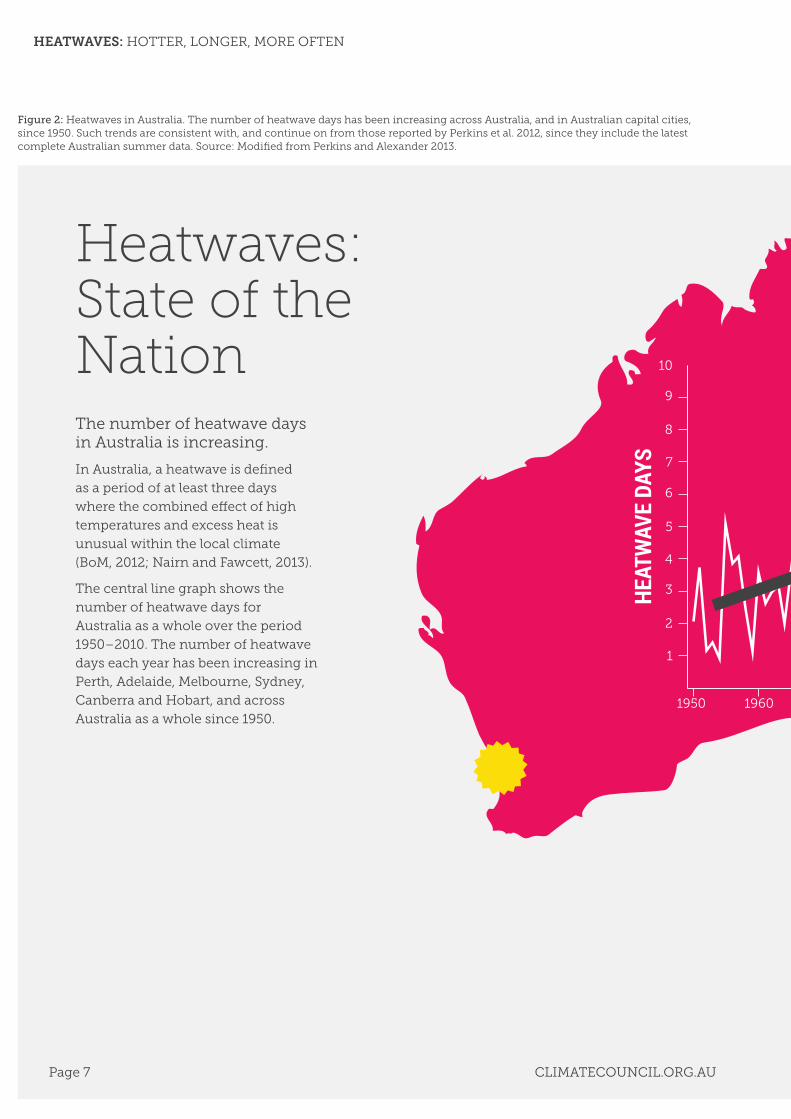
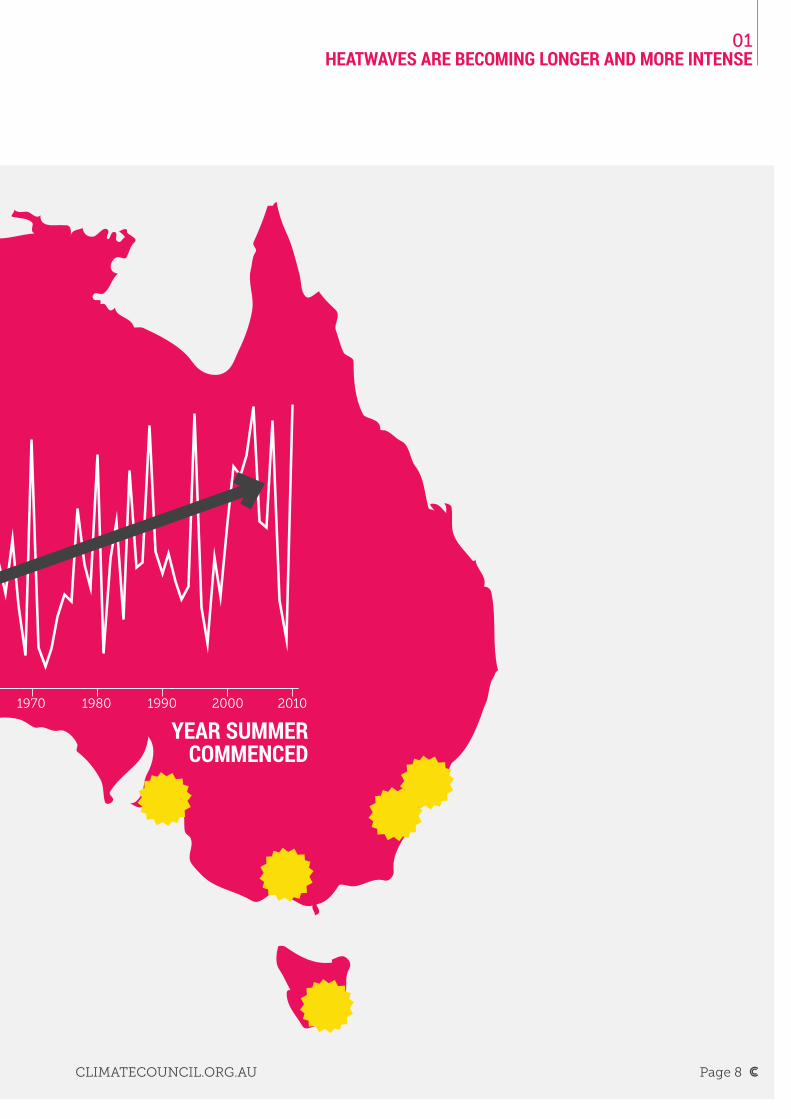
Figure 2: Heatwaves in Australia. The number of heatwave days has been increasing across Australia, and in Australian capital cities, since 1950. Such trends are consistent with, and continue on from those reported by Perkins et al. 2012, since they include the latest complete Australian summer data. Source: Modified from Perkins and Alexander 2013.
The number of heatwave days in Australia is increasing.
In Australia, a heatwave is defined
as a period of at least three days
where the combined effect of high
temperatures and excess heat is
unusual within the local climate
(BoM, 2012; Nairn and Fawcett, 2013).
The central line graph shows the
number of heatwave days for
Australia as a whole over the period
1950–2010. The number of heatwave
days each year has been increasing in
Perth, Adelaide, Melbourne, Sydney,
Canberra and Hobart, and across
Australia as a whole since 1950.1950
1
4
7
2
5
8
3
6
9
10
1960
YEAR SUMMER COMMENCED
HEAT
WAV
E DA
YS
Page 7
HEATWAVES: HOTTER, LONGER, MORE OFTEN
CLIMATECOUNCIL.ORG.AU
20102000199019801970
YEAR SUMMER COMMENCED
Page 8CLIMATECOUNCIL.ORG.AU
01 HEATWAVES ARE BECOMING LONGER AND MORE INTENSE

City
Number of
heatwave
days
Number of
heatwaves
(events)
Length of
longest event
Changes in
average
intensity
of the
heatwave
(°C)
Changes in
average
intensity of
the peak day
(°C)
Changes
in
timing of
first event
(days)
1950–
1980
1981–
2011
1950–
1980
1981–
2011
1950-
1980
1981–
2011
Sydney 6 9 1-2 2-3 4 5 1.5 1.5 -19
Melbourne 5 6 1-2 1-2 4 4 1.5 2 -17
Brisbane 10 10 2-3 2-3 6 6 1 1.5 -8
Perth 6 9 1-2 2-3 4 5 1.5 1.5 +3
Adelaide 5 9 1-2 1-2 4 6 2.5 4.3 -2
Hobart 4 5 1 1-2 4 4 -1.5 1.7 -12
Darwin 3 7 1 1-2 4 5 0 1 -7
Canberra 6 13 1-2 2-3 5 7 0 1.5 -3
Table 1: The average number of heatwave days, number of events, length of the longest event, average heatwave intensity, average intensity of the peak heatwave day, and change in the timing of the first summer heatwave for Australia’s capital cities (Perkins and Alexander 2013). Statistics were calculated from the high-quality ACORN-SAT temperature dataset for the period 1951-2011 (Trewin 2012), using the Excess Heat Factor heatwave definition (Nairn and Fawcett 2013; Perkins and Alexander 2013). All statistics are rounded to the nearest integer. The first column for each characteristic is for the 1950–1980 period and the second is for the 1981–2011 period. Changes in average intensity and peak intensity are calculated by subtracting the respective average from 1950–1980 and 1981–2011. Changes in timing are calculated by subtracting the average start date during 1981–2011 from that of 1950–1980.
Using the definition of a heatwave,
Table 1 presents the average number of
heatwave days, events, and duration,
a well as the average intensity over all
heatwaves and the average of the hottest
(peak) day for Australia’s capital cities,
over the period 1950–2011. Note that
the frequency, intensity and duration of
heatwaves differ across these locations,
and that these characteristics are
influenced by local factors, such as
synoptic conditions (meteorological
conditions over a wide area at a given
time), rainfall, location, and the overall
climate classification.
Page 9
HEATWAVES: HOTTER, LONGER, MORE OFTEN
CLIMATECOUNCIL.ORG.AU

The occurrence, duration and intensity of
extreme Australian temperatures varies from
year to year, due to the influences of climate
variability (Kenyon and Hegerl 2008; Alexander
et al. 2009). Heatwaves, therefore, are also
affected. During El Niño years, for example,
much of Australia is prone to below average
rainfall and above average temperatures. This
increases the chance of stand-alone hot days
(Kenyon and Hegerl 2008; Alexander et al. 2009;
Arblaster and Alexander 2012; Min et al. 2013),
and possibly also the chance of heatwaves.
During La Niña years, when much of Australia
generally receives higher than average rainfall,
average temperatures are lower and therefore
heatwaves are less common in many places.
The occurrence of heatwaves is also governed
by meteorological conditions (see Engel et
al. 2012), which are influenced by climate
variability, as described above. The most
important weather system for Australian
heatwaves is the persistent anticyclone, where
a high-pressure system remains stationary
adjacent to the area affected for a prolonged
time (Hudson et al. 2011; Pezza et al. 2012;
Marshall et al. 2013). The high-pressure
system brings warm air from the interior
of the continent to the area experiencing
the heatwave, which sustains excessively
hot temperatures for a number of days. For
southeastern Australia heatwaves, this high is
generally centred over the Tasman Sea and is
in line with the subtropical ridge (an east-west
zone of high pressure that often lies over the
southern part of the continent) (Hudson et al.
2011; Marshall et al. 2013), and for southwestern
Australia, it is centred over the Great Australian
Bight (Pezza et al. 2012). Other regional features
can also influence the occurrence and intensity
of Australian hot days and heatwaves, including
intra-seasonal drivers of variability (Marshall et
al. 2013), rainfall deficits (Nicholls 2004), local
sea surface temperatures (Pezza et al. 2012),
the Australian monsoon, and tropical cyclones
(Parker et al. 2013).
See section 1.3 for the influence of climate
change on heatwaves.
Variability in heatwave characteristics
IN DETAIL 1
Page 10CLIMATECOUNCIL.ORG.AU
01 HEATWAVES ARE BECOMING LONGER AND MORE INTENSE

While a fine balance of climate variability
and synoptic systems governs year-to-
year occurrences of Australian heatwaves
(see In Detail 1), such conditions cannot
explain longer-term changes (Lewis
and Karoly 2013). Although highly
variable over a small number of years,
the number, duration and intensity
of heatwaves should not change over
decades in a stable climate. The changes
in Australian heatwaves as described
above are part of a long-term global
trend towards more heatwaves and hot
weather in many regions, a trend that is
very likely influenced by human-driven
climate change (IPCC 2013), as explained
in more detail in section 1.3.
The trend towards more frequent and
more intense heatwaves is reflected
in recent observations of individual
heatwave events. Over the past decade
a remarkably large number of record-
breaking and devastating heatwaves
have occurred in Australia and in many
other parts of the world (Coumou and
Rahmstorf 2012). The extent of the
heatwave that affected eastern to central
Australia in 2004, from 9–22 February,
was greater than any other February
heatwave on record. All-time records
for consecutive days of heat include 17
days over 30°C at Adelaide, 16 days over
35°C at Snowtown, 16 days over 40°C
at Wilcannia, seven days over 35°C at
Bathurst, and 12 days over 35°C at Wagga
Wagga (BoM 2005).
Figure 3: Highest maximum temperature reported in the period 1 January 2013—18 January 2013. Source: (BoM 2013a)
AWAP HIGHEST MAX TEMPERATURE (°C)
45°C
42°C
39°C
36°C
33°C
30°C
27°C
24°C
Page 11
HEATWAVES: HOTTER, LONGER, MORE OFTEN
CLIMATECOUNCIL.ORG.AU

South and southeast Australia
experienced an extreme heatwave in
2009, with two significant periods of
exceptionally high temperatures, from
28–31 January and 6–8 February (BoM
2009; McEvoy et al. 2012; see section
3.2 for the link to the Black Saturday
bushfires). On 30 January, Tasmania
experienced its hottest day on record
when the temperature soared to 42.2°C.
Overnight minimum temperatures were
also very high in many places during
the heat wave. Adelaide experienced
its warmest night on record when the
temperature dropped to only 33.9°C on
29 January. The most extreme heat of the
whole episode occurred on 7 February
with record highs throughout much of
Victoria (BoM 2009). An all-time state
record was broken at Hopetoun when
the temperature reached 48.8°C, which
is considered the highest ever recorded
in the southern hemisphere so far from
the equator. Records stretching over
154 years were broken in Melbourne,
where the temperature reached 46.4°C.
South Australia also experienced its
hottest February day on record (48.2°C) at
Renmark (BoM 2009).
The heatwave that occurred during the
2012–2013 summer was unusual for
its size and duration. A massive pool of
hot air became established over 70% of
the continent at the end of December
2012 and persisted until the middle of
January (Figure 3). Through the 2–8
January period, the country experienced
seven consecutive days of area-averaged
maximum temperature over 39 °C. In
102 years of weather records, Australia
has experienced only 21 such days, and
eight of them occurred in 2013. January
2013 was Australia’s hottest January on
record. Temperature records were set
in every state and territory during the
summer, and all-time high maximum
temperatures were set at 44 weather
stations, including Sydney, Hobart
and Newcastle (BoM 2013a; Climate
Commission 2013a). Extreme heat played
a role in several of the extreme weather
events that occurred during the 2012–
2013 summer (Figure 4).
Section 1.3 describes the link between
climate change and heatwaves and is
supported by the observational data of
heatwaves in Australia.
A major heatwave affected central and eastern Australia in late 2013/early 2014. The most significant
records were set on 3 January, when Queensland experienced its area-averaged hottest day on record.
For the week ending 4 January, average maximum temperatures were 8°C or more above normal
in southern inland Queensland. Overall, record high maximum temperatures occurred over 8.8% of
Australia from 1 to 4 January, including 16.8% of New South Wales, 16.8% of the Northern Territory,
15.2% of Queensland and 7.9% of South Australia (BoM 2014).
RECORD TEMPERATURES ACROSS THE COUNTRY
Page 12CLIMATECOUNCIL.ORG.AU
01 HEATWAVES ARE BECOMING LONGER AND MORE INTENSE

Figure 4: A snapshot of the “angry summer” 2012–2013. Source: Modified from Climate Commission 2013a
RAIN › 26 daily rainfall records across
Australia were broken at weather stations with over 80 years of data including 11 all-time daily rainfall records during late January even in eastern Australia.
› There were also 9 December records, 23 January records and 2 February records broken across Australia.
› Gladstone, Queensland set records for its highest 4-day rainfall (819.8mm)—higher than Gladestone’s previous record for a whole calendar month.
HEAT › Australia’s hottest summer on
record.
› January 2013 was the hottest month on record for Australia.
› Hottest day ever recorded for Australia as a whole—40.3°C on 7 January.
› 7 days in a row with a temperature above 39°C for Australia as a whole.
› Heatwave and temperature records were broken across Australia including:
› 44 weather stations set hottest maximum temperatures.
› 2 weather stations also set December record maximum temperatures.
› 13 weather stations also set January record maximum temperatures.
› 4 weather stations also set February record maximum temperatures.
› 29 warmest night records (highest minimum temperature) including 7 all-time records.
FLOODS › 5 river height records broken.
› Major flooding through southeast Queensland and northern New South Wales.
“Angry Summer” 2012–2013: Events Snapshot
Page 13
HEATWAVES: HOTTER, LONGER, MORE OFTEN
CLIMATECOUNCIL.ORG.AU
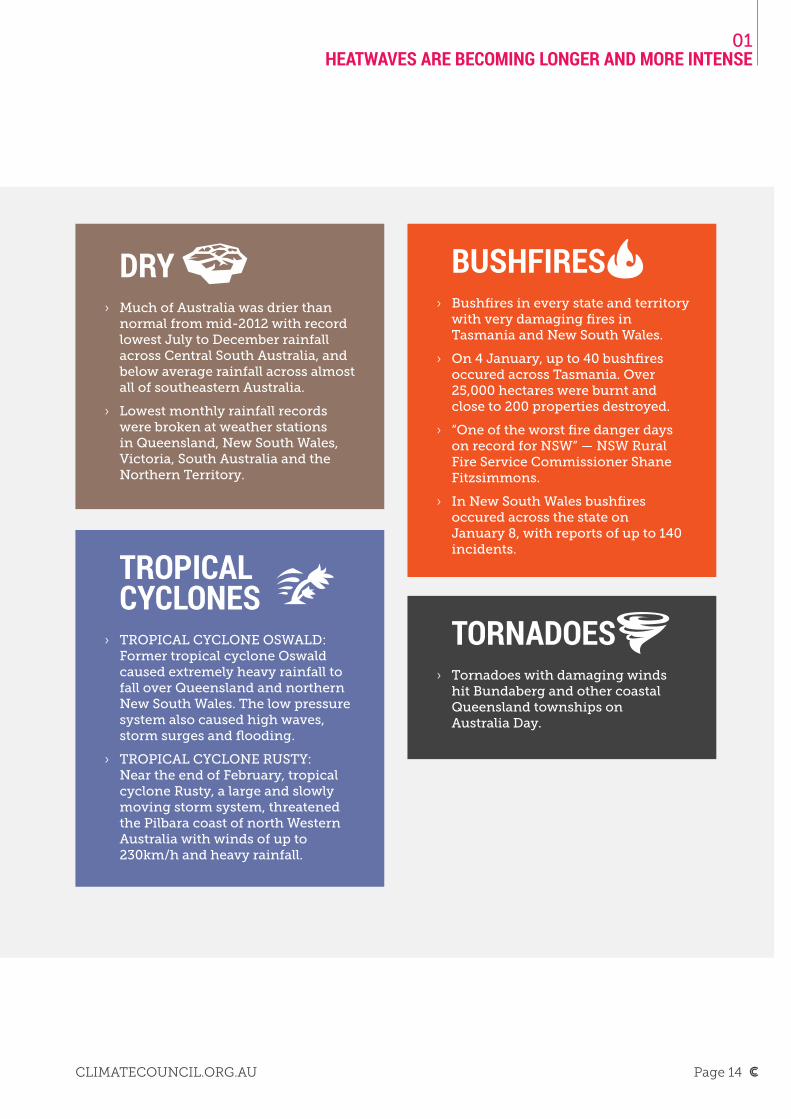
BUSHFIRES › Bushfires in every state and territory
with very damaging fires in Tasmania and New South Wales.
› On 4 January, up to 40 bushfires occured across Tasmania. Over 25,000 hectares were burnt and close to 200 properties destroyed.
› “One of the worst fire danger days on record for NSW” — NSW Rural Fire Service Commissioner Shane Fitzsimmons.
› In New South Wales bushfires occured across the state on January 8, with reports of up to 140 incidents.
TORNADOES › Tornadoes with damaging winds
hit Bundaberg and other coastal Queensland townships on Australia Day.
TROPICAL CYCLONES
› TROPICAL CYCLONE OSWALD: Former tropical cyclone Oswald caused extremely heavy rainfall to fall over Queensland and northern New South Wales. The low pressure system also caused high waves, storm surges and flooding.
› TROPICAL CYCLONE RUSTY: Near the end of February, tropical cyclone Rusty, a large and slowly moving storm system, threatened the Pilbara coast of north Western Australia with winds of up to 230km/h and heavy rainfall.
DRY › Much of Australia was drier than
normal from mid-2012 with record lowest July to December rainfall across Central South Australia, and below average rainfall across almost all of southeastern Australia.
› Lowest monthly rainfall records were broken at weather stations in Queensland, New South Wales, Victoria, South Australia and the Northern Territory.
Page 14CLIMATECOUNCIL.ORG.AU
01 HEATWAVES ARE BECOMING LONGER AND MORE INTENSE

In the last 10–15 years, many severe heatwaves have occurred in other parts of the world. One of the most severe was the European heatwave of July and August 2003, which occurred during an unusually dry summer (Black et al. 2004).
It was likely the hottest period that
Europe has experienced since at least
1500 AD (Stott et al. 2004). From May to
August, Europe experienced anticyclonic
(high atmospheric pressure) conditions,
which contributed to the low rainfall and
high temperatures, leading to a reduction
in soil moisture (Black et al. 2004).
Low soil moisture content has been
an important factor in the increasing
number of days of extreme heat in
many regions of the world (Mueller
and Seneviratne 2012; see section 3.1).
Average monthly temperatures across
Europe were significantly higher than
usual, and mean June temperatures over
central Europe were 4.2°C hotter than the
long-term (1958–2002) average (Black et
al. 2004).
While most of Western and much of
Eastern Europe sweltered, France and
Switzerland were particularly affected,
with the mean summer temperature
averaged across four weather stations in
Switzerland a remarkable 5.1°C higher
than the 1864–2000 average (Black et al.
2004). During July and August, nighttime
temperatures also climbed dramatically,
and were higher even than long-term
mean daily temperatures (Black et
al. 2004). The 2003 heatwave closely
resembled the projections of maximum
summer temperatures from regional
climate models for the second half of
the 21st century (Beniston 2004; Schär et
al. 2004), and, under a high greenhouse
gas emissions scenario (the IPCC SRES
A2 scenario), summers such as this are
expected to be common occurrences
in Europe by the end of this century
(Beniston 2004; Schär et al. 2004).
The 2003 European heatwave was
followed in 2010 by an even more
intense and widespread heatwave,
which scorched enormous areas across
Eastern Europe (Barriopedro et al. 2011),
including western Russia, Belarus,
Estonia, Latvia, and Lithuania (Dole et
al. 2011). By May 2010, record high sea
surface temperatures had developed in
the Indian and Atlantic Oceans, with a
number of consequences for weather
patterns. One of the most important
consequences was the unusually strong
and persistent anticyclonic condition
that settled over Russia during the
summer, and was responsible for the
1.2 Severe heatwaves in other parts of the world (Europe, Russia, USA)
Page 15
HEATWAVES: HOTTER, LONGER, MORE OFTEN
CLIMATECOUNCIL.ORG.AU

extreme heat. The most intense period
of the heatwave occurred from June to
mid-August (Trenberth and Fasullo 2012),
including the hottest July on record in
western Russia since at least 1880 (Dole
et al. 2011). During July, temperatures
soared to over 40°C, breaking
numerous records, and daily maximum
temperatures persisted around record
levels (Dole et al. 2011). As with the 2003
European heatwave, the 2010 summer
in Russia matched climate projections
for the latter half of the 21st century,
based on a scenario of no emission
reductions until mid-century (IPCC SRES
A1B; Barriopedro et al. 2011). Rahmstorf
and Coumou (2011) calculated with a
likelihood of around 80% that the Russian
2010 heatwave would not have occurred
without the influence of human-caused
climate change (see next section).
North America has also experienced a
number of heatwaves in recent years,
with a major heatwave and devastating
drought affecting the state of Texas in
July 2011 (NOAA 2011; Luo and Zhang
2012; Peterson et al. 2012) and a larger
heatwave covering a greater area of the
country in 2012 (NOAA 2012). The 2011
summer (June to August) was the 4th
hottest summer on record for the US
(NOAA 2012), and broke many heat-
related records around the country
(NOAA 2011). Texas experienced the
hottest and driest summer the state
has seen since records began in 1895
(Peterson et al. 2012). 2011 was a La
Niña year, an effect that typically brings
warmer winters and decreased rainfall
to southern parts of the US (Luo and
Zhang 2012), and by July, around 75%
of Texas was experiencing a drought
described as “exceptional” (NOAA 2012).
Soil moisture content had been reduced
because of decreased rainfall (Mueller
and Seneviratne 2012; Winguth and
Kelp 2013), predisposing the region to
prolonged extreme temperatures (Mueller
and Seneviratne 2012, section 3.1) that
culminated in a heatwave across the state
in July. The June to August three-month
average temperature was 2.9°C above the
long-term (1981–2010) average, at 30.4°C.
While the reduced rainfall has been
largely attributed to natural variability
(Hoerling et al. 2013), climate models
have shown a shift to warmer and drier
conditions over the period 1964 to 2008
(Peterson et al. 2012). The circumstances
that led up to the Texas 2011 drought,
which in turn set the scene for a record
heatwave, are much more likely now
than they were 40–50 years ago and
climate change has increased the
likelihood of setting a hot temperature
record by 6% in 2011 in comparison to the
1981–2010 period (Peterson et al. 2012).
“‘Mega-heatwaves’ such as the 2003 and 2010 events likely broke the 500-year-long seasonal temperature records over approximately 50% of Europe” Barriopedro
et al. 2011
Page 16CLIMATECOUNCIL.ORG.AU
01 HEATWAVES ARE BECOMING LONGER AND MORE INTENSE

Human-driven climate change has contributed to the increase in hot days and heatwaves.
The increase in greenhouse gases in
the atmosphere, primarily caused by
the burning of fossil fuels, is trapping
more heat in the lower atmosphere
(IPCC 2013), that in turn increases the
likelihood of heatwaves and hot days and
decreases the likelihood of cold weather.
The influence of climate change on
heatwaves is more significant than the
increase in global average temperature,
about 0.85°C since 1880 (IPCC 2013),
might suggest. Figure 5 shows how
small changes in average temperature
can have a significant influence on
extremes (IPCC 2012). The figure shows
the distribution of temperatures, say,
daily maximum temperature, around the
average. On most days, the temperature
1.3 The influence of climate change on heatwaves
NEW CLIMATE
PREVIOUS CLIMATE
COLD AVERAGE HOT
More hot weather
Less cold weather
Pro
bab
ilit
y o
f o
ccu
ran
ce
Increase of average temperature
More record hot weather
New recordPrevious record
Figure 5: Relationship between average and extremes, showing the connection between a shifting average and the proportion of extreme events. Source: Climate Commission 2013b, modified from IPCC 2007
Page 17
HEATWAVES: HOTTER, LONGER, MORE OFTEN
CLIMATECOUNCIL.ORG.AU

is not too far from the average, but
occasionally some very hot or very cold
days can occur. But when the average
temperature warms by even a small
amount towards a higher level, the
temperatures at the “tails”—the ends of
the temperature distribution—also shift.
The result is a much greater likelihood
of very hot weather and a much lower
likelihood of very cold weather.
Long-term observations demonstrate
the effect of warming on temperature
extremes shown in Figure 5. Globally,
since 1950 it is very likely (greater than
90% probability) that there has been
an overall increase in the number of
warm days and nights, and an overall
decrease in the number of cold days
and nights (IPCC 2013). It is also likely
(greater than 66% probability) that there
has been an increase in the frequency,
intensity and duration of heatwaves
and warm spells over that period across
many global regions (IPCC 2013; Perkins
et al. 2012). An increase in heatwave
frequency has been observed in China
(Ding et al. 2010), and increases in the
frequency, duration and intensity of
heatwaves have been observed in the
Mediterranean region since the 1960s
(Kuglitsch et al. 2009). A doubling in the
length of European heatwaves between
1880–2005 has also been found (Della
Marta et al. 2007). Other areas of the
world, particularly Africa, Antarctica,
India, and parts of South America, do
not yet have enough high quality data to
undertake comprehensive investigations
of changes in heatwave activity.
For regions where adequate and
consistent data exist, increases in
extreme daily temperatures have been
reported over most global regions since
1950 (Brown et al. 2008) (see Figure 6 for
the Northern Hemisphere). The number
of heatwave days has increased each
decade between 1950–2010 for much of
Northern America, Europe, Central and
East Asia, and, consistent with Figure 1
above, eastern and southern Australia
(Figure 7; Perkins et al. 2012).
Global changes in warm spells have
also been found since 1950 (Alexander
et al. 2006; Perkins et al. 2012; Donat et
al. 2013). Unlike heatwaves, warm spells
Figure 6: Summer temperature shifts in the Northern Hemisphere over the period 1951–2011. During the 1951–1980 period, the Northern Hemisphere experienced an equal number of hotter-than-average (red) as colder-than-average days (blue). Since that time, average summer temperatures have shifted towards warmer days, and the Northern Hemisphere now experiences many more hotter-than-average days than it does colder-than-average. Source: NASA/GISS 2012
-5 -4 -3 -2 -1 0 1 2 3 4 5
0.5
0.4
0.3
0.2
0.1
0-4 -3 -2 -1 0 1 2 3 4 5 -4 -3 -2 -1 0 1 2 3 4 5 -4 -3 -2 -1 0 1 2 3 4 5
1951–1980
FREQ
UENC
Y
1981–1991 1991–2001 2001–2011
Page 18CLIMATECOUNCIL.ORG.AU
01 HEATWAVES ARE BECOMING LONGER AND MORE INTENSE

include excessively warm events (relative
to time of year) that occur outside of
summer. Trends in these non-summer
events are increasing faster than
heatwaves during the summer seasons
only, as measured by the number of
heatwave/warm spell days and events,
and their duration and peak intensity
(Perkins et al. 2012). There is considerable
evidence that nighttime temperature
extremes are increasing faster than
daytime temperature extremes (IPCC
2013), a trend that is important for the
impacts of heatwaves (section 2 below).
Recently scientists have used model-
based approaches to estimate the
increase in the likelihood that a
particular heatwave will occur due to the
human-driven increase in atmospheric
greenhouse gas concentrations. Using
such methods, Lewis and Karoly (2013)
concluded that the odds of the Australian
2013 Angry Summer occurring when
it did increased more than five times
due to the human-driven increase in
atmospheric greenhouse gases. Using
similar methods, a study by Rahmstorf
and Coumou (2011) estimated that
there is a likelihood of around 80% that
the Russian 2010 heatwave would not
have occurred without the influence of
human-caused climate change.
Figure 7: Global trends in the number of heatwave days per decade, from 1950–2011. Hatching represents statistically significant trends at the 5% level, calculated by non-parametric methods. Grey regions did not have adequate data for heatwave calculation. There has been an increase in occurrence of heatwaves over many other regions in addition to Australia, as a results of the long-term rise in global average temperatures. Source: Adapted from Figure 1 of (Perkins et al. 2012), calculated using the Excess Heat Factor index (Perkins et al. 2012, Nairn and Fawcett 2013) from the HadGHCND gridded daily temperature dataset (Caesar et al. 2006)
-0.6 0.6-3
180°
90°S
90°N
45°S
0°
45°N
180°90°W 0° 90°E
3-1.8 1.8
Page 19
HEATWAVES: HOTTER, LONGER, MORE OFTEN
CLIMATECOUNCIL.ORG.AU

2.IMPACTS OF HEATWAVES Heatwaves have been dubbed “the most under-rated weather hazard in Australia” (BoM, cited in PwC 2011). While heatwaves and hot weather do not result in obvious violent effects on the landscape, unlike the effects of many other weather-related disasters such as high-intensity storms and bushfires, the impacts of heatwaves on health, infrastructure, agriculture, and the environment can nonetheless be serious, costly and long-lasting.
In Australia, heatwaves and hot weather are responsible for the greatest number of deaths from any type of natural disaster, and contribute significantly to morbidity, particularly among the elderly. The economic burden of heatwaves is large, through the decrease in labour productivity during the hottest periods (Kjellstrom and McMichael 2013), the demand placed on emergency services, infrastructure stress and breakdown, and agricultural losses.
Page 20
The increasing frequency, intensity and duration of heatwaves are increasing the burden on Australia’s people and health services.
Those most at risk include the very old,
the very young, Aboriginal and Torres
Strait Islander communities, and those
who work outdoors or whose physical
and mental wellbeing are compromised.
Consequently, as Australia’s population
grows and ages, the proportion and
absolute number of people most at risk
from heatwaves will continue to rise,
increasing the pressure on emergency
and health services.
Heatwaves are a particularly important
risk for people living in cities because
metropolitan areas can be significantly
warmer than neighbouring countryside
areas (Stone et al. 2010). Dense urban
areas, such as inner city environments,
may be 1 to 3°C hotter than surrounding
areas (Climate Commission 2011; Figure
8). This phenomenon is known as the
‘Urban Heat Island’ and occurs because
of a decreased amount of vegetation and
increased areas of dark surfaces in urban
environments, in addition to the heat
produced from vehicles and generators
(Luber and McGeehin 2008; Stone et al.
2010). The Urban Heat Island effect is
generally more prominent during the
night than the day, so its major impact
is to increase the likelihood of extreme
high minimum temperatures.
2.1 Human health: Direct impacts on health
“Heatwaves kill more Australians than any other natural disaster. They have received far less public attention than cyclones, floods or bushfires—they are private, silent deaths which only hit the media when morgues reach capacity or infrastructure fails.” Price-Waterhouse Cooper, “Extreme Heat Events”
Page 21
HEATWAVES: HOTTER, LONGER, MORE OFTEN
CLIMATECOUNCIL.ORG.AU

As even more Australians move into urban
areas, they are increasingly moving into
the inner city, and thus into areas where
the urban heat island effect is more likely.
Similarly, much of our infrastructure—
roads, rail, and medical facilities—is
concentrated in inner city areas, where
a disruption to this infrastructure can
affect a large number of people. This was
shown by the breakdown of the electricity
grid and metropolitan railway system in
Melbourne during the 2009 heatwave (see
section 2.2 below), when many areas in
Melbourne were left without electricity,
and thousands of commuters were
stranded on the way home from work in
the CBD (McEvoy et al. 2012). For most
people this would have caused no more
than inconvenience. But for those needing
medical help it would have been much
more serious—an example of the indirect
effects heatwaves have on health.
Extreme and prolonged heat can directly
affect our health by causing heat stress
and, under very severe conditions,
even death. Our bodies operate at a
core temperature of 37°C and must
maintain that temperature within a very
narrow range (Parsons 2003; Hanna
et al. 2011). As we produce heat during
our daily activities (especially if we
exert ourselves), we need to release that
heat to the air around us to maintain a
steady core body temperature. We do
this by direct transfer to air when the air
around our bodies is at a temperature
below 37°C or by sweating, which is a
type of evaporative cooling. At very high
temperatures—around 37°C or higher—
Figure 8: A stylised view of the urban heat island effect. The average annual air temperature in sprawling urban areas, and inner-city environments, is higher than surrounding areas, although the exact temperature profile can vary from city to city. Source: Climate Commission 2011, modified from US EPA 2008 and NASA 1999
CB
D
UR
BA
N
RE
SID
EN
TIA
L
WA
RE
HO
US
E O
R
IND
US
TR
IAL
PA
RK
SU
BU
RB
AN
SU
BU
RB
AN
RU
RA
L
RU
RA
L
30°C
33°C
TEM
PERA
TURE
Late afternoon temperatures °C
Page 22CLIMATECOUNCIL.ORG.AU
02 IMPACTS OF HEATWAVES

this cooling can become difficult,
especially if humidity is high, and core
body temperature can rise.
If core body temperature rises to 38°C
for several hours, heat exhaustion
occurs, and mental and physical capacity
becomes impaired (Parsons 2003; Berry et
al. 2010). If core temperature goes above
42°C, even for just a few hours, heat stroke
and death can result (Parsons 2003) (see
Figure 9).
People living in dense urban
environments, the very old and the
very young, those with pre-existing
medical conditions and heat-exposed
workers are the most vulnerable when
the temperature soars. Even so, most
people can survive one extremely hot
day. However, heatwaves lasting even a
few days, especially if coupled with high
nighttime temperatures (e.g. upper 20s
or low 30s °C), can cause serious health
impacts. The warm nights are particularly
important because our bodies don’t get
the chance to recover (Banwell et al.
2012). It is the cumulative effects over a
few days of an intense heatwave that lead
to serious health impacts and deaths—
and we tend to see these after the worst
of the heatwave has passed.
The heatwave in Melbourne in late
January 2009 exemplifies such
conditions. On 27 January the maximum
temperature rose to 36.4°C from a high of
25.5°C the previous day. The maximum
temperatures during the next three
days were 43.4°C, 44.3°C and 45.1°C,
before dropping to 30.5°C on 31 January.
Nighttime minimum temperatures were
also very much above average. There
were 374 excess deaths recorded during
this period. The death rate peaked on 30
and 31 January, towards the end of the
heatwave, lagging behind the extreme
temperatures by a few days (DHS 2009;
Figure 10).
Similar impacts have been observed
in other parts of Australia. Deaths in
Brisbane increased by 23% during the
7–26 February 2004 period (especially
during the 21–22 February weekend),
when the temperature increased from
26°C to 42°C (Tong et al. 2010). From 1993
to 2006, Adelaide recorded a 7% increase
in total hospital admissions during
periods of heatwaves compared with
non-heatwave periods and the number
of people requiring ambulance transport
increased 4% during heatwaves (Nitschke
et al. 2007). During the heatwave of
January 1994, Sydney recorded 110
excess heat-related deaths (Gosling et al.
2007). Mortality during heatwave events
also occurs in other countries (Figure 11).
There have been newspaper reports of
the health impacts of the January 2014
heatwave in Victoria—203 heat-related
deaths, a 20-fold increase in ambulance
call-outs, a four-fold increase in calls to
nurses-on-call, and a four-fold increase to
locum doctors (The Age, 23 January 2014)—
but these figures will need to be verified by
more thorough, peer-reviewed analyses.
Figure 9: Temperature effects on the human body. Source: Climate Commission 2011
CORE BODY TEMPERATURE
38ºC+ 39ºC+ 42ºC+37ºC
Page 23
HEATWAVES: HOTTER, LONGER, MORE OFTEN
CLIMATECOUNCIL.ORG.AU

With Australia’s population growing
and ageing, the proportion and absolute
number of older adults is rising.
Projections indicate that by 2031 almost
one in four Australians will be aged
over 65 (Booth and Tickle 2003). These
Australians are particularly vulnerable to
the effects of heatwaves (van Iersel and
Bi 2009), partly because general physical
frailty increases with advancing age, as
does the incidence of falls, illnesses and
disease. In these circumstances, people’s
ability to do the things they need to do
to keep their bodies cool diminishes, for
example drinking, and remembering
to drink, enough. Dehydration is an
important cause of heat-related deaths
among older adults (Rikkert et al. 2009).
Figure 10: Mortality and temperature during the 2009 Melbourne heatwave. This graph shows the relationship between prolonged periods of higher temperature and death rates over the same period. Source: Climate Commission 2013c, modified from DHS 2009
“Older people who live in big cities that are not prepared for heatwaves or in areas with clear “heat island” effects… have the highest risk of heat-related morbidity.” Rikkert et al. 2009
26 Jan
5
15
25
35
45
25.5
36.4
43.4 44.3 45.1
30.5
33.8
250
50
100
150
200
27 Jan 28 Jan 29 Jan 30 Jan 31 Jan 1 Feb
2004–08 average deaths
2009 deaths
2009 max temp (ºC)
DEAT
HS
ºC
Page 24CLIMATECOUNCIL.ORG.AU
02 IMPACTS OF HEATWAVES

Europe 70,000, summer of 2003
(France hardest hit)
(Robine et al. 2008)
SE Australia 300, February 2009
(DHS 2009)
Brisbane 75 excess deaths
in Brisbane
heatwave in
2004, of which
41 were due to
cardiovascular
causes
USA 600, Chicago July 1995
(Dematte et al. 1998)
Russia 56,000, July and August
2010 (Munich RE 2011)
Impacts (mortality) of recent heatwaves
Figure 11: Global mortality during recent heatwave events.
Page 25
HEATWAVES: HOTTER, LONGER, MORE OFTEN
CLIMATECOUNCIL.ORG.AU

Despite heat being felt more intensely
in urban areas compared to the
surrounding countryside, older adults are
also at risk of extreme heat in regional
Australia, where community and medical
services are less accessible. Poor access
to services is largely responsible for
the relatively poorer health of rural
Australians compared to city-dwellers
(Smith et al. 2008) and older adults face
more challenges than most in reaching
services. Older Australians, who rely
entirely on income support, particularly
where they do not own their own homes,
typically live under financial hardship.
This means they are likely to struggle
to cope with the economic burden
associated with hot days and heatwaves,
for example, larger electricity bills for
air conditioning (if they have it), with
consequent risks for their health (Luber
and McGeehin 2008).
In any single year, one in five Australians
suffer from some type of mental
disorder and these illnesses account
for by far the largest proportion of
Australia’s burden of disease (Slade 2009).
Because these illnesses are so common
and so disabling, mental health is a
National Health Priority Area. People
experiencing mental health problems
are sometimes at increased risk during
heatwaves. Nitschke et al. (2007) found
that during heatwaves in Adelaide,
hospital admissions due to mental health
problems increased by 7%. A similar study
conducted in Adelaide from 1993 to 2006
found that, once the air temperature
climbed above 26.7°C, hospital admission
numbers due to mental health and
behavioral disorders rose (Hansen et al.
2008). There was an almost 10% increase
in admissions due to mood (affective)
anxiety, stress-related and somatoform
disorders (disorders characterized by
symptoms that suggest physical illness
or injury), and an increase of around
17% in admissions among people with
dementia. A study of heatwaves in New
South Wales also found that people with
an underlying mental health problem
were more vulnerable to extreme heat
(Khalaj et al. 2010).
Page 26CLIMATECOUNCIL.ORG.AU
02 IMPACTS OF HEATWAVES

There are a number of indirect effects that extreme heat has on our health. People with pre-existing medical conditions such as cardiac, respiratory or renal disease (also more common in the elderly) are particularly vulnerable.
For example, hospital admissions in
Adelaide for acute renal failure and
kidney disease rose during heatwave
compared to non-heatwave periods
(Nitschke et al. 2007; Hansen et al. 2008;
Khalaj et al. 2010). The relative increase in
kidney-related effects was greater than
for any other effect, and was particularly
large in middle-aged adults. Hospital
admissions for ischemic heart disease
among people aged 65–74 also increased
during heatwaves (Nitschke et al. 2007).
Over the period 1999–2004, hospital
admissions in Melbourne for heart
attacks rose by 10% on days over 30°C
and by 40% during heatwaves (Loughnan
et al. 2010).
Heatwaves can also affect health because
they can interfere with electricity
distribution leading to mass impacts,
such as on public transport or hospital
air conditioning (see section 2.2 on
infrastructure). Extreme heat can lead
to power outages, which in turn can
lead to a loss of air-conditioning. This
removes one major coping strategy for
heatwaves, and greatly increases the risks
of health impacts for the most vulnerable
population groups.
Power outages can also lead to a
loss of refrigeration and cooling,
affecting homes and food outlets. Cool
temperatures slow or prevent the growth
of potentially harmful bacteria in food.
If cooling systems fail, outbreaks of
gastrointestinal infections can occur.
Within two hours, many bacterial
pathogens can grow to numbers
sufficient to cause gastrointestinal illness
in food chilled to 5°C, and some can
produce harmful poisons that, when
ingested, can cause serious illness (Marx
et al. 2006).
The consequences of power outages for
health were shown by a non-heatwave-
related incident in Japan. In 2000,
the country suffered its worst case of
food poisoning after the operations
of a milk products manufacturer were
interrupted by a power outage (Wrigley
et al. 2006). During the power outage
untreated milk was left on a production
line for three hours, long enough for
the bacterium Staphylococcus aureus to
proliferate. The derived milk products
were contaminated with a bacterial toxin
and led to around 13,000 cases of food
poisoning (Wrigley et al. 2006).
The impacts of extreme heat and
power outages on perishable food can
2.1 Human health: Indirect impacts
Page 27
HEATWAVES: HOTTER, LONGER, MORE OFTEN
CLIMATECOUNCIL.ORG.AU

have flow-on effects, for example, on
pest control (Beatty et al. 2006). In the
northeast US, in August 2003, the intense
heat and increased demand on electricity
transmission systems led to widespread
power outages in New York City that
affected around nine million people
(White et al. 2003). Large populations
were without electricity for periods from
a few hours to over two days (Marx et al.
2006). A study that also investigated the
2003 New York Blackout concluded that
there was a likely link between people
reporting diarrheal symptoms and the
consumption of spoilt meat or fish after
the power outage (Marx et al. 2006).
Page 28CLIMATECOUNCIL.ORG.AU
02 IMPACTS OF HEATWAVES

Increased mortality and use of health services are the most reported impacts of extreme heat on human health (Kjellstrom and McMichael 2013), but the effect of extreme heat in slowing down daily activities and in reducing work productivity may be of significant economic importance (Kjellstrom et al. 2009a).
Extreme heat can pose serious health
risks for outdoor workers and for those
working in enclosed indoor spaces
without adequate ventilation. Under
extreme conditions, heat stress or even
death can occur (Kjellstrom et al. 2011;
Kjellstrom et al. 2013). Those most at risk
include construction workers, farmers,
emergency and essential service workers,
and those working outside in the mining
industry (Singh et al. 2013). Risks increase
for those whose work is “externally
paced” by machine speed or because
they are paid per unit output (Hanna et
al. 2011).
As noted above, during physical exertion
in periods of extreme heat, the body
can have difficulty removing the heat
generated and core body temperature
can rise to dangerous levels (Parsons
2003), leading to heat stress or death.
Extreme heat can also lead to mental
health problems in workers, such as
aggression, confusion, psychological
distress and other behavioural changes
(Berry et al. 2010; Tawatsupa et al. 2010)
that affect workers and their productivity.
One measure of the risk to workers of
extreme heat is the “dangerous day”
concept. A dangerous day occurs when
sweating cannot cool the body and core
body temperature rises by 2.5°C over
less than two hours (Maloney and Forbes
2.1 Human health: Workplace safety and productivity
“The reduction in work ability can be considered a form of “disability” that should be taken into account when assessing the “burden of disease or ill health” caused by global warming.”Kjellstrom 2000
Page 29
HEATWAVES: HOTTER, LONGER, MORE OFTEN
CLIMATECOUNCIL.ORG.AU

2011). Applying this measure to Perth for
those workers accustomed to working in
hot climates, the number of dangerous
days is projected to rise from the current
value of one per year to as much as 21
days per year by 2070, depending on
the emissions scenario used (Maloney
and Forbes 2011). Spatial and temporal
analysis of heat stress can be a useful tool
for analysing such impacts (Hyatt et al.
2010). This type of analysis uses the Wet
Bulb Globe Temperature (WBGT) index,
which is a composite meteorological
indicator derived from temperature,
humidity, direct and diffuse heat
radiation, and wind speed and thus can
be estimated from weather station data
(Lemke and Kjellstrom 2012; Kjellstrom et
al. 2009a).
The impacts of extreme heat on worker
wellbeing and productivity can also be
measured in economic terms (Kjellstrom
and McMichael 2013), the underlying
cause being a general slowing down of
work or the complete stopping of work
on very hot days. For example, Fisk
(2000) estimated the cost of suboptimal
workplace temperatures in the US to be
in the billions of dollars. In Australia,
workers at the Port of Melbourne
are permitted to stop work when the
temperature reaches 38°C. During
an extended heatwave, this slows the
loading and unloading process, which in
turn delays vessels and disrupts shipping
schedules. Labour costs, of course,
are significantly increased in such
conditions (QUT 2010).
Reduced labor productivity from future
heatwaves will not only be costly, but
will force changes in the workplace.
Measures such as introducing air-
conditioning to workplaces to enhance
worker productivity may be costly and
unreliable. Similarly, workers may need
to take more frequent breaks, or work at
a slower pace (Kjellstrom et al. 2009a). As
a result, to maintain current productivity
levels, it will be necessary to either
engage greater numbers of workers or
to increase working hours for existing
workers. Changing working hours to
night shifts to avoid the heat of the day
is also a common, but costly, response,
as in the case of the Melbourne 2009
heatwave during which railway repair
workers were sent in at night to cool
the buckled railways, incurring extra
maintenance costs (McEvoy et al. 2012).
The combination of more extreme heat
and an increase in absolute humidity
is expected to place severe limitations
on human activity in tropical and mid-
latitude regions, including Northern
Australia, during peak months of heat
stress. Dunne et al. (2013) estimated that
Kjellstrom et al. 2009b
“Global climate change…may impair health and productivity for millions of working people.”
Page 30CLIMATECOUNCIL.ORG.AU
02 IMPACTS OF HEATWAVES

environmental heat stress has already
reduced labour capacity by 10% over the
past few decades. They project a further
10% reduction during the hottest months
by 2050. Under the warmest projections,
they project a 60% reduction in labour
capacity (compared to 2010) by the
end of the century with most tropical
and mid-latitude regions experiencing
extreme climatological heat stress. Under
a high emissions scenario, projections
indicate that those countries most
affected by declining labor productivity
could see GDP fall by up to 20% by 2080
(Kjellstrom et al. 2009b).
Sport is also feeling the heat. During the
2014 Australian Open tennis tournament,
play was suspended for the afternoon
of 16 January after the temperature
exceeded 43°C and the WBGT index
exceeded regulation limits (Figure 12).
Aside from the general effects of heat
stress, playing tennis in extreme heat
can also cause muscle twitches, cramps,
and painful spasms due to the loss of
large amounts of electrolytes through
sweating (Bergeron 2003). While players
sweltered in extreme temperatures, off-
court ambulances treated almost 1000
tennis fans in the first few days of the
tournament for heat exhaustion (SMH 16
January 2014).
Figure 12: Temperatures soared during the heatwave in Melbourne in January 2014 and the Australian Open tennis tournament was suspended on 16 January due to increased risk of heat stress for players.
Page 31
HEATWAVES: HOTTER, LONGER, MORE OFTEN
CLIMATECOUNCIL.ORG.AU
Extreme heat can have significant impacts on infrastructure and essential services, especially electricity transmission and transport systems. Financial losses from the 2009 heatwave in southeast Australia, for example, have been estimated at $800 million, mainly due to power outages and disruptions to the transport system (Chhetri et al. 2012).
Heatwaves place electricity
generation and transmission systems
under considerable stress, greatly
testing their ability to withstand
the pressures of increased energy
demand (predominately from use of
air conditioners). Insulator capacity
is reduced, and in coal-fired power
stations water kept for cooling the steam
turbines warms and is consequently
less effective (McEvoy et al. 2012).
Electricity transmission is also affected,
and transmission lines may become
so hot that they expand and can hang
dangerously low. If this occurs, the
electricity flow is decreased to allow the
transmission line to cool, and contract.
Ceramic insulators on power lines that
are affected by smoke, moisture, or ash
from heatwave-associated bushfires,
become less effective and lines affected
may have their electricity supply
stopped (McEvoy et al. 2012). Similarly,
transformers—responsible for regulating
electricity voltage and current—may also
break down. Under these circumstances
load shedding (or rolling blackouts) may
be instituted. Blackouts further enhance
the risk to vulnerable groups and can
hinder emergency services.
Increased demand for electricity during
the 2009 heatwave in Victoria broke
previous records by approximately
7% (QUT 2010). During this heatwave
the Basslink electricity cable between
Tasmania and Victoria reached
maximum operating temperature
and was automatically shut down
for safety reasons (QUT 2010). This
shutdown, combined with faults at
a number of transformers, caused
widespread blackouts across Melbourne;
on the evening of 30 January 2009,
an estimated 500,000 residents were
without power (QUT, 2010). In January
2014, Victorian electricity consumption
topped 10,300 megawatts (MW), with the
highest level of electricity use occurring
during the heatwave. Installation of 3 GW
of solar power in Australia has assisted
with meeting the demand—according
to the Australian Renewable Energy
Agency, solar PV contributed more than
11% of South Australia’s power needs on
some of the hottest days in the January
2014 event (SMH 18 January 2014).
2.2 Infrastructure
Page 32CLIMATECOUNCIL.ORG.AU
02 IMPACTS OF HEATWAVES

The 2009 heatwave saw Melbourne’s
train and tram networks suffering
widespread failures caused by faults
to air conditioning systems and the
buckling of tracks (QUT 2010; Figure
13). The January 2014 heatwave also
disrupted some public transport services
in Melbourne, with trains operating 10
km per hour slower than normal as a
precaution during this event, with flow-
on disruptions to rail services (Mullett
and McEvoy 2014). Heatwaves can also
cause “bleeding” of bitumen on roads
and traffic signal failure (QUT 2010).
Figure 13: Anatomy of a heatwave—Infrastructure breakdown during the Melbourne 2009 heatwave.
The heatwave creates
an increase in electricity
demand
29 cases of rail tracks buckling
Electricity demand in
Victoria spikes
Train air conditioner failure.
More than 50% of the trains were
old style and air-conditioning
not designed to work at
temperatures over 34.5°C
To avoid a city-
wide blackout, load
shedding, or ‘rolling
blackouts’ introduced
On 30 Jan 500,000
residents in western
and central Melbourne
experienced a blackout
lasting from one hour
up to two daysElectrical faults causing
technical failures in rail
signaling
City loop trains cancelled
during the evening leaving
many commuters stranded
RAILWAYSELECTRICITY
11
3
3
2 2
44
INFRASTRUCTURE UNDER STRESS
Anatomy of a Heatwave: Melbourne, January 2009
Page 33
HEATWAVES: HOTTER, LONGER, MORE OFTEN
CLIMATECOUNCIL.ORG.AU
Extreme heat can also affect yield and
quality of crops (van der Velde et al.
2012). The 2009 heatwave in southeast
Australia, in conjunction with a shortage
of irrigation water, caused significant
heat-stress related crop losses in many
vineyards (Webb et al. 2010). For example,
wine grape production in 2008–09
is estimated to have been 1.7 million
tonnes, around 7% (119,000 tonnes) lower
than the 2007–08 harvest (Gunning-
Trant 2010).
High temperatures, especially when
combined with high humidity and low
air movement, can exceed the ability
of livestock to cope, resulting in a loss
of appetite, productivity, reproductive
vigor and sometimes death (Lefcourt
and Adams 1996). Provision of shade can
reduce heat stress, but not completely
eliminate risk, especially in feedlots
where cattle are crowded (Gaughan et
al. 2010). Dairy cattle are particularly
susceptible to heat stress, which can
reduce appetite, milk production and
milk quality (QFF 2008; DEEDI 2010).
Projected increases in heatwaves could
result in changes in the types of animals
and genotypes that are used, changes
in facilities and housing utilized for
care and management of livestock, and
eventually a potential redistribution
of livestock and livestock species in a
region (Henry et al. 2012).
Despite the complexity of global food supply, there are well-established linkages between growing season temperatures, precipitation and crop performance. Global studies such as those by Lobell and Field (2007) show that 30% or more of year-to-year variations in global average yields for the world’s six most widely grown crops can be linked back to these two variables.
For wheat, maize and barley, there is a
clear negative response of global yields to
increased temperatures. Based on these
sensitivities and observed climate trends,
the study estimates that the warming
since 1981 has resulted in annual
combined losses of these three crops
of approximately 40 Mt or $5 billion per
year, as of 2002.
Heatwaves can have significant impacts
on agricultural crops and livestock.
High temperatures over several days
can reduce the crop yield substantially,
through both direct and indirect effects.
The direct effect is through damage to
the crop’s reproductive parts, responsible
for producing grain, and thus reducing
productive potential. Indirectly, extreme
temperatures increase plant water stress,
which if not addressed will result in
cessation of photosynthesis and possibly
death (Schlenker and Roberts 2009).
2.3 Agriculture
Page 34CLIMATECOUNCIL.ORG.AU
02 IMPACTS OF HEATWAVES

There have been relatively few economic
estimates of agricultural losses due to
heat waves. Losses in the 2003 European
severe heat event, during which there
were dramatic reductions in maize and
wheat production, were estimated at
€ 4 billion (COPA COGECA 2003; van
der Velde et al. 2012). A heatwave in
July 2006 was the second most costly
event ($492 million insured losses) for
Californian agriculture in the period
1993–2007, the event being especially
damaging for livestock (Lobell et al.
2011). Crop and livestock losses arising
from the 2011 heatwave in Texas were
estimated at $5.2 billion (Raloff 2012).
Page 35
HEATWAVES: HOTTER, LONGER, MORE OFTEN
CLIMATECOUNCIL.ORG.AU

Plants and animals, like humans, are susceptible to extreme heat events. In periods of extreme heat, birds may lose up to 5% of their body mass per hour and rapidly reach their limit of dehydration tolerance (McKechnie and Wolf 2010).
The January 2009 heatwave, when air
temperatures were above 45°C for several
consecutive days, caused the deaths of
thousands of birds, mostly zebra finches
and budgerigars, in Western Australia
(McKechnie et al. 2012). Another event
in January 2010, where temperatures
up to 48°C were combined with very
low humidity and a hot northerly wind,
had similar impacts, with the deaths of
over 200 of the endangered Carnaby’s
Black Cockatoo recorded near Hopetoun,
Western Australia (Saunders et al. 2011).
Flying foxes are also particularly
susceptible to extreme heat events.
Exposure to air temperatures over 40°C
can lead to heat stress and death from
dehydration, especially when very hot
conditions are accompanied by dry
weather. Lactating females and their
young are the most at risk. Since 1994,
more than 30,000 flying foxes have
died in heatwaves at sites along the
east coast of Australia (Figure 14). On 12
January 2002, for example, over 3,500
flying foxes were killed in nine colonies
along the New South Wales coast when
temperatures exceeded 42°C (Welbergen
et al. 2008). In January and February
2009, nearly 5,000 flying fox deaths were
recorded at a single site—Yarra Bend Park
in Victoria (DSE 2009).
Some of Australia’s most iconic
marsupials are also at risk during
extended periods of hot weather. The
green ringtail possum (Figure 15),
for example, which is restricted to
rainforests above 300 m in Queensland’s
Wet Tropics, is unable to control its
body temperature if subjected to
air temperatures greater than 30°C
for 5 hours per day, over 4–6 days
(Krockenberger et al. 2012). Hotter,
drier conditions in the future are
predicted to put this and many other
rainforest marsupials at increased risk
of population decline and eventual
extinction (Williams et al. 2003).
Heatwaves, combined with extended
droughts, have also been observed to
cause mass mortality in koalas (Gordon et
al. 1988), and to affect forest productivity
(Ciais et al. 2005), frog reproduction
(Neveu 2009), cyanobacterial blooms in
lakes (Huber et al. 2012), and increase the
success of invasive species (Daufresne et
al. 2007).
Marine organisms are also affected by the
impacts of severe heat. Heatwaves can
occur in the surface waters of the ocean,
sometimes leading to dramatic impacts
on marine ecosystems. When coral reefs
are subject to sea surface temperatures
more than 1–2°C above average summer
maximum temperatures, the corals can
bleach and die (Figure 16).
2.4 Natural Ecosystems
Page 36CLIMATECOUNCIL.ORG.AU
02 IMPACTS OF HEATWAVES

extreme heat. Mortality and reduced
reproduction have also been observed
in intertidal and estuarine species
during heatwaves (e.g., Cardoso et al.
2008; Garrabou et al. 2009). In some
ecosystems, the species composition
can be so dramatically affected by a
single event, such as occurred in the
2003 European heatwave or major
bleaching events, that ecosystems may
never return to their original state. Mass
mortality of the habitat-forming seaweed
Scytothelia dorycarpa off the coast of
Western Australia in 20ll, for example,
was followed by a rapid increase in turf-
forming algae and declines in cover of
sponges and encrusting algae, resulting
in a substantial change in the nature of
the marine community in the region
(Smale and Wernberg 2013).
Bleaching events on the Great Barrier
Reef have occurred repeatedly since
the late 1970s, and none were observed
before the 1970s. Bleaching events
have contributed to the decline in
coral cover observed from 1985 to 2002
(De’ath et al. 2012). The 2011 marine
heat wave in Western Australia caused
the first-ever reported bleaching at
Ningaloo Reef (Wernberg et al. 2012),
with temperatures peaking at 28.7°C
off the Houtman Abrolhos Islands, 5°C
above the long-term average (Smale and
Wernberg 2012). The ability to recover
from bleaching events varies among
coral species and among regions, but
there is only limited evidence so far that
corals can adapt to rising temperatures
and to ocean acidification (Hoegh-
Guldberg et al. 2007). Corals are not the
only marine systems to be affected by
Figure 14: Flying foxes are particularly vulnerable to heatwaves. Since 1994, more than 30,000 flying foxes have died in heatwaves at sites along the east coast of Australia.
Figure 15: The green ringtail possum is unable to control its body temperature when exposed to temperatures above 30°C for long periods, making it at risk during heatwaves.
Figure 16: Anticipated reef states under varying carbon dioxide concentrations.
!"#$%"&"%'()*"'+,*"*'*"(),-*'()*.*'/,'0-*/(#%)#1*'2,#*/#%'
*/,(3'*-(4"*'#56'7)47'/)6"*'8 !"#$%&'(9:';7"'2,3<)5"6'&#%-"',='2,33"(2)#%>'%)47/')56-*/()#%>'/(#5*+,(/'#56'("*)6"5/)#%'<-)%6)54*'#/'()*.'=(,3'#'*"#$%"&"%'()*"',=' '?:?'3'@#*'&#%-"6'#/'#++(,A)3#/"%B'CDDE'<)%%),5''8DFFG'("+%#2"3"5/'&#%-"9>'@)/7'"A+,*-("'7)47"*/')5'H-""5*%#56')5'/"(3*',='<,/7'("+%#2"3"5/'&#%-"'#56'/,/#%'5-3<"(',='+(,+"(/)"*'#56')5=(#*/(-2/-(":
0-*/(#%)#1*'#4()2-%/-(#%'+(,6-2"(*'#%("#6B'7#&"'/,'6"#%'@)/7'#'7)47%B'&#()#<%"'2%)3#/">'#56'2%)3#/"'27#54"'@)%%'+,*"'*,3"'#66)/),5#%'*"(),-*'27#%%"54"*:'I,('"A#3+%">'()*)54'/"3+"(#/-("*'#("'%)."%B'/,'7#&"'#6&"(*"'"=="2/*'=,('2#//%"'<B')52("#*)54'/7"'=("J-"52B',='7"#/'*/("**>'"*+"2)#%%B'=,('/7,*"'2#//%"')5'=""6%,/*>'#56'("6-2"',&"(#%%'+(,6-2/)&)/B')5'/7"'<""=>'*7""+'#56'@,,%'*"2/,(:'K7#54)54'(#)5=#%%'+#//"(5*'3#B'#=="2/'2(,+'+(,6-2/)&)/B>'=,('"A#3+%"')5')(()4#/),5'#("#*',='/7"'L-((#B$M#(%)54'N#*)5:'
0-*/(#%)#')*',5"',='/7"'3,*/'<),%,4)2#%%B'6)&"(*"'2,-5/()"*')5'/7"'@,(%6>'#56'3#5B',=')/*'5#/-(#%'"2,*B*/"3*'#("'#/'()*.'=(,3'#'27#54)54'2%)3#/">',=/"5'#2/)54')5'2,3<)5#/),5'@)/7',/7"('*/("**"*:'O"#/@#&"*',5'<,/7'%#56'#56')5'/7"'*"#'7#&"'#%("#6B'7#6'*"&"("')3+#2/*:'I,(')5*/#52">',5'#'*)54%"'6#B')5'DFFD>'#)('/"3+"(#/-("*'"A2""6"6'PDQK')5'#("#*',='*,-/7"#*/'
7"#/@#&"*'#=="2/'3#5B'*+"2)"*>'"*+"2)#%%B',5'2,(#%'(""=*'8!"#$%&')9>'@7"("'/7"B'2#5'%"#6'/,'2,(#%'<%"#27)54:';7"'R("#/'N#(()"('S""='7#*'"A+"()"52"6'#/'%"#*/'*"&"5'<%"#27)54'"&"5/*'*)52"'?TUT:';7"'3,*/'*"(),-*',='/7"*">')5'?TTG'#56'DFFD>'#=="2/"6'-+'/,'EFV',=')56)&)6-#%'(""=*:'
!"#$%&$'()*%+,&#$)%-.&(/0&1"2%)%3& &*4&4*++)-&4"0-+,&$20&50+($1)-)+)%3&&(/0&'-)#$(06&
7)%'0&(/0&8%5"+(2)$-&90:*-"()*%,&$%5&0+;0')$--.&*:02&(/0&;$+(&<=&.0$2+,&/"#$%&$'():)()0+&/$:0&10'*#0&+*&+)3%)4)'$%(&(/$(&(/0.&$20&'/$%3)%3& &(/0&'-)#$(0&*%&$&3-*1$-&+'$-06&>/0&;2)#$2.&'$"+0&)+&(/0&1"2%)%3&*4&4*++)-&4"0-+&+"'/&$+&'*$-,&3$+&$%5&*)-&(*&30%02$(0&0%023.&4*2&0-0'(2)')(.,&(2$%+;*2(,&/0$()%3&$%5&'**?)%36&>/0&@$+(0&3$+0+&;2*5"'05&42*#&4*++)-&4"0-&'*#1"+()*%,&#$)%-.&'$21*%&5)*A)50&BCDEF,&$20&50+($1)-)+)%3&(/0&'-)#$(0&+.+(0#6&>/0+0&3$+0+&$20&$-(02)%3&(/0&0%023.&1$-$%'0&$(&(/0&G$2(/H+&+"24$'0&1.&0%/$%')%3&(/0&3200%/*"+0&0440'(6&&
;7"'4(""57,-*"'"=="2/')*',5"',='/7"'3,*/')3+,(/#5/'5#/-(#%'="#/-("*',='/7"'2%)3#/"'*B*/"3:' !"#$%&'*'*7,@*'7,@')/'@,(.*:'W52,3)54'*,%#('(#6)#/),5'+"5"/(#/"*'/7(,-47'/7"'X#(/71*'#/3,*+7"(">'@)/7'*,3"',='/7)*'
<()47/'*-(=#2"*>'*-27'#*'/7"'@7)/"'+,%#(')2"'*7""/*:'N-/'3-27',='/7)*')52,3)54'"5"(4B')*'#<*,(<"6'<B'%#56'#56'@#/"('#/'/7"'X#(/71*'*-(=#2":
;,'3#)5/#)5')/*'"5"(4B'<#%#52">'/7"'X#(/7'"3)/*'/7"'*#3"'#3,-5/',='"5"(4B'<#2.')5/,'*+#2"'#*'/7"'#3,-5/'/7#/')*'#<*,(<"6:'N-/'/7)*'"5"(4B')*'"3)//"6')5'#'6)=="("5/'=,(3'/,'7,@')/'#(()&"6'=(,3'/7"'*-5>'#*'7"#/>'5,/'%)47/:';7)*')*'@7"("'/7"'4(""57,-*"'4#*"*'2,3"')5:'0%/7,-47'/7"B'#("'3,*/%B'/(#5*+#("5/'/,'/7"')52,3)54'*,%#('(#6)#/),5>'/7"B'/(#+'*,3"',='/7"',-/4,)54'7"#/>'.""+)54'/7"'X#(/71*'#/3,*+7"(">'#56'7"52"'/7"'*-(=#2"'#%*,>'@#(3"('/7#5'/7"B'@,-%6',/7"(@)*"'<":';7"'3,*/')3+,(/#5/'%,54$%)&"6'4(""57,-*"'4#*"*'#("'KY D>'3"/7#5"'#56'5)/(,-*',A)6":
I&J==&;;#&&&&&&&I&KL&MC
I)4-("'DZ'05/)2)+#/"6'(""='*/#/"*'-56"('&#(B)54'2#(<,5'6),A)6"'2,52"5/(#/),5*
L
16
14 15
375ppm +1°C 450–500ppm +2°C > 500ppm > +3°C
Page 37
HEATWAVES: HOTTER, LONGER, MORE OFTEN
CLIMATECOUNCIL.ORG.AU

In addition to the direct impacts caused by heatwaves, intense heat often interacts with other stressors to increase the risks for human health, infrastructure, agriculture and ecosystems. Three of the most important interactions are those associated with the combination of heat and drought, the role that heat plays in the risk
3. INTERACTION OF HEATWAVES WITH OTHER EXTREME EVENTS AND ENVIRONMENTAL STRESSES
of bushfires, and the interaction of ocean heatwaves with ocean acidification and other marine stresses. The contribution of human-driven climate change to the increase in hot days and heatwaves is increasing many risks through these interactive effects as well as through the direct effects described earlier.
Page 38

Drought and heat are interrelated. Drought can exacerbate hot conditions, while hot conditions can exacerbate drought.
In moisture-limited regions, when soil
moisture is reduced (i.e. the Earth’s
surface is dry), the air temperature rises,
and this can result in longer and more
intense heatwaves (Seneviratne et al.
2010; Mueller and Seneviratne 2012).
In fact, in these regions, the level of
soil moisture can determine whether
an embryonic heatwave grows and
intensifies, or whether it collapses. If
there is enough water remaining in
the soil, cooling associated with its
evaporation could slow or dampen the
severity of an oncoming heatwave,
preventing the occurrence of very
extreme heatwaves (Hirschi et al.
2010). If soil moisture is too low, there
is no buffering capacity and extreme
temperatures can be exacerbated.
This effect can even occur in moister
climates if the heatwave is preceded by
a severe and prolonged dry period that
significantly reduces the water content of
normally moist soils.
This phenomenon has been observed in
heatwaves over the United States (Durre
et al. 2009; Hoerling et al. 2013), Europe
(Fischer et al. 2007; Hirschi et al. 2010)
and Australia (Mueller and Seneviratne
2012). Linkages between drought
conditions and extreme heatwaves are
also reported for some specific regions,
with drought conditions increasing the
intensity of the 2003 European and 2009
southeast Australian heatwaves (BoM
2009; Nicholls and Larsen 2011).
On the other hand, extended periods
of heat can increase evaporation rates,
leading to increased loss of soil moisture
and an intensification of droughts.
Thus, when droughts occur, the long-
term increase in heat in the atmosphere
from increasing greenhouse gas
concentrations can further intensify
the heat that usually co-occurs with
drought—one reinforces the other as
conditions become hotter and drier. This
effect is important for southern Australia,
where droughts are projected to occur
more frequently with the ongoing
increase in greenhouse gas emissions
(Hennessey et al. 2008; Kirono et al. 2011).
3.1 Droughts
Page 39
HEATWAVES: HOTTER, LONGER, MORE OFTEN
CLIMATECOUNCIL.ORG.AU

The most direct link between bushfire activity and climate change is the increasing trend in hot days and heatwaves. More hot weather has led to increases in the Forest Fire Danger Index (FFDI), an indicator of extreme fire weather, measured at 16 of 38 weather stations across Australia over the 1973–2010 period; none of the stations recorded a significant decrease (Clarke et al. 2012).
Most of the stations showing an increase
are located in the populous regions
of southwest and southeast Australia
(Figure 17). The effect of extreme heat
(see section 1.1 above) was an important
factor in the 2009 Black Saturday
bushfires in Victoria, with the FFDI
ranging from 120 to 190, the highest
values ever recorded (Karoly 2009).
Increased temperatures can also increase
the incidence of lightning, causing more
ignitions (Price and Rind 1994). With the
projected increase in hot weather and
heatwaves, high fire risk weather is also
likely to increase further in Australia in
future decades (Lucas et al. 2007; Climate
Council of Australia 2013).
Heat can also affect bushfires via its
impact on fuel availability, but in quite
complex ways (Figure 18; Climate
Council of Australia 2013). High
temperatures and heatwaves in the
weeks and months prior to a bushfire
can dry out fuel and make it more prone
to ignition. However, periods of extreme
temperatures can also stunt vegetation
growth and thus reduce the amount of
fuel available. More moderate temperatures
can stimulate growth in temperature-
limited ecosystems, such as the high altitude
mountain ash forests in the southeast, thus
increasing the fuel load.
Overall, increasing heatwaves are
likely contributing to greater bushfire
activity. Around the world, regions with
increasing numbers of heatwave days are
also experiencing more bushfire activity.
Alaska, Canada, western USA, Spain,
Russia and southeast Australia all show
increased bushfire activity and have also
recorded increases in the number of
heatwave days.
3.2 Bushfires
Figure 17: Fire fighters protecting property in southern Western Australia in 2011. In addition to the obvious dangers that the bushfires themselves pose, fire fighters are also subject to the impacts on their health and productivity of the extreme heat that often accompanies bushfires (Budd 2001).
Page 40CLIMATECOUNCIL.ORG.AU
03 INTERACTION OF HEATWAVES WITH OTHER EXTREME
EVENTS AND ENVIRONMENTAL STRESSES

Ignitions Fuel Load Fuel Condition Weather
Increased incidence of lightning as climate warms
Increased atmos- pheric CO2
Increased temperature
(either increases or decreases vegetation productivity)
Increased rainfall
(impacts on fuel load and fuel condition)
Decreased rainfall
(impacts on fuel load and fuel condition)
Increased temperature
Increased rainfall
Decreased rainfall
Temperature increase, more extreme hot days
Fire activity
Dec
reas
e I
ncr
ease
Figure 18: Potential impacts of atmospheric and climatic change on factors that affect fire. Increased temperatures may increase the incidence of lightning and thus increase the probability of ignitions. Increased temperatures may either increase or decrease vegetation productivity, and thus fuel availability, depending on the region. Changes in rainfall may also have complex impacts via changes in fuel load and fuel condition. Increasing atmospheric CO2 concentration may also increase the fuel load through enhancement of vegetation growth. Increases in extreme hot days will increase the probability that fires, once started, will spread and become more intense. Source: Climate Council of Australia 2013
Page 41
HEATWAVES: HOTTER, LONGER, MORE OFTEN
CLIMATECOUNCIL.ORG.AU

Ocean heatwaves are a well-known cause of bleaching in corals (section 2.4 above). If there is enough time between extreme heat events, coral reefs can recover.
However, as extreme temperature
events become more frequent due to
the accumulation of extra heat in the
lower atmosphere and upper ocean, the
composition and structure of coral reefs
may be irreversibly changed. Degree
Heating Week (DHW) is a measure of
this accumulation of stress; it is defined
as the sum of weekly sea-surface
temperature (SST) anomalies above the
thermal stress threshold accumulated
over 12 weeks (Donner 2009). DHW
values above eight mean that the risk of
bleaching is considered severe. If severe
bleaching events occur more often
than once every five years, the viability
of coral reef ecosystems becomes
threatened.
Heatwaves also interact with a wide
range of climate and non-climate
stressors to threaten the health of coral
reef ecosystems (See In Detail 2).
3.3 Multiple interacting stresses on coral reefs
Page 42CLIMATECOUNCIL.ORG.AU
03 INTERACTION OF HEATWAVES WITH OTHER EXTREME
EVENTS AND ENVIRONMENTAL STRESSES

The risk to coral reef ecosystems from ocean heatwaves is increased by the interactions among a number of stressors that simultaneously and synergistically affect the ability of coral reef ecosystems to cope.
Climate-related stressors include:
› Ocean acidity: Increasing dissolution of
atmospheric CO2 into the ocean increases the
concentration of carbonic acid in seawater,
which in turn reduces the concentration of
carbonate ions (Friedrich et al. 2012). The
hard shells of corals, and of many other
marine organisms, are formed from calcium
carbonate. Increasing ocean acidity reduces
calcification rates, making it more difficult for
corals to recover from other stressors (De’ath
et al. 2009). If ocean acidity rises beyond a
threshold level, seawater can actually become
corrosive to corals.
› Sea-level rise: Coral reef ecosystems also
include atolls, which are important nesting
sites for many sea turtles. The sea-level rise
that has already occurred, 19 cm over the
period 1901–2010, and the additional 26–98
cm projected for the end of this century (IPCC
2013), are increasing the risk of inundation
of important turtle nesting sites. A high rate
of sea-level rise will also pose challenges for
many species over corals to keep pace.
› Tropical cyclones: Most tropical cyclones
along Australia’s east coast cut across the
Great Barrier Reef (GBR) in an east-west
IN DETAIL 2
direction, and thus damage only a relatively
small area of the reef. However, an intense,
very large cyclone with a large north-south
extent can cause extensive physical damage.
This situation occurred in 2011 when severe
tropical Cyclone Yasi crossed the central
GBR. This storm was one of the largest,
most intense tropical storms ever recorded
in Queensland (Callaghan and Power 2011).
Cyclone Yasi stretched for over 1000 km,
produced waves over 9 m in height, and
sustained wind speeds of over 200 km per
hr, with some gusts reaching 285 km per hr
(Lukoschek et al. 2013). The cyclone caused
extensive damage, with impacts reported
over an area of nearly 90,000 km2 of the Great
Barrier Reef Marine Park. An estimated 15% of
the total reef area in the park suffered damage,
with 6% severely affected (GBRMPA 2011).
In addition to climate-related stressors, there are a number of human-related stressors that also reduce the resilience of coral reefs:
› Sedimentation and eutrophication (algal
blooms): Fluxes of sediments and nutrients
from adjacent land areas, often from
agricultural or mining activities, can damage
coral reefs by sediment deposition on the
surface of the reef, attenuation of light
through the water column, eutrophication of
coastal waters and stimulation of algal growth
by excess nutrients. These effects, which can
reduce the resilience of the reefs, make it
more difficult for them to cope with climate-
related stressors. Near-shore reefs are most
affected by sedimentation and eutrophication.
Multiple interacting stresses on coral reefs
Page 43
HEATWAVES: HOTTER, LONGER, MORE OFTEN
CLIMATECOUNCIL.ORG.AU

› Fishing: Overfishing can reduce or remove
large fish from reef ecosystems, with potential
knock-on effects down the food web and
consequent impacts on the structure and
functioning of these ecosystems. For example,
the combination of a reduction or loss of
fish that graze on algae and an increase in
nutrients in the water can lead to outbreaks of
algae that can smother corals.
› Tourism: Large volumes of tourists can lead
to stress on reefs through physical damage
as well as impacts on small coral atolls, for
example, on seabird breeding areas.
› Shipping: Spillages and shipping accidents
can threaten the reef through release of
massive amounts of pollutants. Also, the
volume of shipping traffic through and near
reefs can affect large marine mammals (e.g.
whales) that use the same areas.
Many of the human-related stressors can, and
are, being managed to improve the resilience
of the reef. This is important for reducing the
impact of ocean heatwaves when they occur,
and will become increasingly important through
this century as the GBR struggles to cope with
escalating climate-related stressors. A good
overall indicator of the integrated effects of these
multiple, interacting stressors, is overall coral
cover in the GBR. The trend is not encouraging.
Despite some significant management
improvements, the GBR has lost 50% of its coral
cover in the last 30 years (De’arth et al. 2012).
Underwater heatwaves have made a contribution
to that trend, and are likely to make an increasing
contribution in future.
Figure 19: The chemistry of ocean acidification. Source: Climate Commission 2013b
Carbon dioxide readily dissolves in seawater forming carbonic acid, which releases a hydrogen and a bicarbonate ion.
The additional hydrogen ions make the ocean more acidic and some react with carbonate ions to produce more bicarbonate ions. This reaction reduces the amount of carbonate ions.
A reduction in carbonate ions is a major threat to marine organisms that build shells and exoskelelons out of calcium carbonate.
Dissolved CO2 + Water Carbonic Acid Hydrogen
ions
Carbonate ions
Bicarbonate ions
The GBR has lost 50% of its coral cover in the last 30 years De’ath et al. 2012
Page 44CLIMATECOUNCIL.ORG.AU
03 INTERACTION OF HEATWAVES WITH OTHER EXTREME
EVENTS AND ENVIRONMENTAL STRESSES

4. HEATWAVES IN THE FUTURE
Page 45

With greenhouse gas concentrations in the atmosphere continuing to rise, extreme hot weather will become even more severe.
The IPCC Special Report on Extremes
(2012) and the IPCC Fifth Assessment
Report (2013) projected that it is virtually
certain (greater than 99% probability)
that hot extremes will increase and cold
extremes will decrease through the
century compared to the current climate.
It is also very likely (greater than 90%
probability) that the length, frequency and/
or intensity of heatwaves will increase over
most land areas around the globe.
Figure 20 (see next page) shows the
projected changes in hot weather
through the rest of this century.
Climate models consistently project
more frequent hot days through the
century, particularly towards its end. The
projections are expressed as the time
interval between “1-in-20 year” hot days,
that is, hot days that occurred on average
only once in 20 years in the climate of
1981–2000.
In many regions around the world the
time between these very hot days will
decrease significantly. By mid century
(the 2046–2065 period in the figure)
unusually hot days will occur every two-
five years in many regions (IPCC 2012).
The variation among the three emissions
scenarios used in the analysis is not large
for this time period, reflecting the fact that
the momentum of the climate system
means increasing hot weather is already
locked in for the next several decades.
By the end of the century, the 2081–2100
period in the figure (see next page),
the projections for the three emissions
scenarios show more divergence, a
reflection that human responses—
our ability to reduce greenhouse gas
emissions rapidly and deeply—will
strongly influence the extent to which
extreme hot weather will worsen towards
the end of the century (section 4.4).
Under a scenario of continuing high
emissions—the track that we are currently
on—the type of extreme hot weather we
now regard as unusual will become a
normal pattern in many regions, occurring
every year or two.
4.1 Projections for extreme heat globally
The type of extreme hot weather we now regard as unusual will become a normal pattern in many regions, occurring every year or two.
Page 46CLIMATECOUNCIL.ORG.AU
04 HEATWAVES IN THE FUTURE

Figure 20: Projected return periods for the maximum daily temperature that was exceeded on average once during a 20-year period in the late-20th-century (1981–2000). A decrease in return period implies more frequent extreme temperature events (i.e., less time between events on average). The box plots show results for regionally averaged projections for two time horizons, 2046 to 2065 and 2081 to 2100, as compared to the late-20th-century, and for three different SRES emissions scenarios (B1, A1B, A2) (see legend). Results are based on 12 Global Climate Models (GCMs) contributing to the third phase of the Coupled Model Intercomparison Project (CMIP3). The level of agreement among the models is indicated by the size of the colored boxes (in which 50% of the model projections are contained), and the length of the whiskers (indicating the maximum and minimum projections from all models). See legend for defined extent of regions. Values are computed for land points only. The “Globe” inset box displays the values computed using all land grid points. Source: IPCC 2012
Projections for extreme heat globallyExtreme hot weather is projected to become more frequent throughout the century
Page 47
HEATWAVES: HOTTER, LONGER, MORE OFTEN
CLIMATECOUNCIL.ORG.AU

Page 48CLIMATECOUNCIL.ORG.AU
04 HEATWAVES IN THE FUTURE

The projections for increasing hot days in Australia are consistent with the projected global trends (Figure 20). For both northern and southern Australia, 1-in-20 year extreme hot days are expected to occur every two–five years by the middle of the century (Figure 20; IPCC 2012).
By the end of the century, the frequency
of extreme hot weather we experience
will depend on our success in reducing
global emissions of greenhouse gases
in the next one or two decades. With
deep emission cuts over that period, the
projected frequency of today’s unusually
hot days (1-in-20 year events) will be
stabilized at about one every two years
for northern Australia and about one
every three–four years for southern
Australia (Figure 20, lowest emission
scenario). However, if greenhouse gas
emissions continue to rise through the
rest of this century, today’s unusually
hot weather will become commonplace,
occurring every summer across the
country (Figure 20, highest emission
scenario).
4.2 Projections of future hot weather for Australia
City Long term
average
(1961-1990)
2000-2009
average
2030 projected 2070 projected
(low emissions
scenario)
2070 projected
(high emissions
scenario)
Melbourne 9.9 12.6 12 (11–13) 14 (12–17) 20 (15–26)
Sydney 3.4 3.3 4.4 (4.1–5.1) 5.3 (4.5–6.6) 8 (6–12)
Adelaide 17.5 25.1 23 (21–26) 26 (24–31) 36 (29–47)
Canberra 5.2 9.4 8 (7–10) 10 (8–14) 18 (12–26)
Darwin 8.5 15.7 44 (28–69) 89 (49–153) 227 (141–308)
Hobart 1.2 1.4 1.7 (1.6–1.8) 1.8 (1.7–2.0) 2.4 (2.0–3.4)
Table 2: The long-term annual average number of hot days (above 35°C) compared to the 2000 – 2009 average and the projected average number for 2030 and 2070 for some Australian capital cities. Most cities have experienced an increase in the average number of hot days in the decade 2000–2009 compared to the long-term average, and are on track to reach the 2030 projections. Both 2030 and 2070 projections feature the median and, in brackets, the range of projections for the number of hot days based on the results from 23 climate models. The lowest number in the range is the 10th percentile and the highest number is the 90th percentile. The median is the 50th percentile. The 2070 projections are divided into low and high emissions scenarios. Brisbane and Perth are not included because the locations of observations for these cities differ from the locations on which projections are based. Source: BoM 2013b; CSIRO and BoM 2007
Page 49
HEATWAVES: HOTTER, LONGER, MORE OFTEN
CLIMATECOUNCIL.ORG.AU

Increasing extreme heat can already be
observed in many of Australia’s capital
cities, as measured by the annual number
of hot days (over 35°C), and is expected
to continue to increase further through
this century, the amount of increase
depending on whether or not we can
stabilize the climate system (Table 2). For
several of our capital cities—Adelaide,
Melbourne and Canberra—the increase
in hot weather that was observed in the
2000–2009 decade had already reached
the level previously projected for 2030.
The severe drought that affected these
three cities during the 2000–2009 period
is likely to have also contributed to the
extreme heat observed during the period,
as described in section 3.1.
The projections for the future
demonstrate the importance of
greenhouse gas emission reductions and
stabilization of the climate this century.
Only one set of projections is given for
2030, as the level of climate change that
we experience then is already locked
into the system and is thus largely
independent of the emission scenario.
Hence, adaptation to further increases
in heatwaves is necessary. However,
the number of hot days we experience
towards the end of this century is
strongly dependent on the emissions
trajectory that actually occurs. A low
emissions trajectory, implying deep
and ongoing reductions in emissions,
could stabilize the climate system this
century so that the number of hot days
projected for 2070 is not much greater
than the number projected for 2030, and
indeed for the number already observed
in Melbourne, Adelaide and Canberra.
However, continuing on the current high
emissions trajectory would result in large
increases in hot weather in all capital
cities by 2070 compared to the current
climate or to 2030 projections.
Page 50CLIMATECOUNCIL.ORG.AU
04 HEATWAVES IN THE FUTURE

The prospect of increasing extreme heat events and heatwaves has important implications for our health and health services, our economy, our infrastructure and our environment.
With older adults forming an increasingly
large proportion of Australia’s growing
population in future, population health
policy, public health programs and
emergency services will need to be
sufficiently supported to keep pace.
This challenges the capacity of our
infrastructure, emergency services,
and social planning systems (Luber
and McGeehin 2008). Increasing peak
electrical demand as people become more
reliant on air conditioning will also increase
household costs (Saman et al. 2013).
Without adaptation, it has been estimated
that heatwaves could cause an additional
6214 deaths (or 402 deaths annually)
by 2050 in Victoria alone (Keating and
Handmer 2013). This translates to an
additional $6.4 billion loss or $218 million
per year (based on the CSIRO3.5 climate
model, a 5% discount rate and 2011 $AUD)
(Keating and Handmer 2013; see also
Jones et al. 2013).
The impacts on work capacity, labour
productivity and the local economy
in places affected by heatwaves will
be increasingly important (Kjellstrom
et al. 2009a). The reduction of labour
productivity globally due to heat
is projected to be as large as USD
one trillion by 2030 (Kjellstrom and
McMichael 2013). Although Australians
are better adapted than workers in
many northern hemisphere temperate
countries to deal with extreme heat, our
economy will not be spared the impacts
of heat on productivity. Considering that
the number of full working days in a year
is often estimated at 200, a loss of only
four working days due to a heat wave
means that 2% of the annual work time
is lost. In terms of the consequences for
the annual economic output, even small
increases of heatwave days can cause
significant losses.
Some government agencies and
community services are increasing their
efforts and resources to manage some
of the risks associated with extreme
heat. The Bureau of Meteorology, for
example, has developed a pilot heatwave
forecasting system (www.bom.gov.au/
australia/heatwave). Following the 2009
heatwave, the Victorian government
4.3 Implications of more severe heatwaves and hot weather
Page 51
HEATWAVES: HOTTER, LONGER, MORE OFTEN
CLIMATECOUNCIL.ORG.AU

developed the Heat Health Alert System
to notify local governments, hospitals
and community services about
conditions that could affect human
health (see State of Victoria 2011),
and Brisbane also provides heatwave
emergency management guidance
(www.emergency.qld.gov.au/emq/css/
heatwave.asp).
While some adaptation is occurring in
human systems, there are barriers and
limits to this adaptation (CSIRO 2011). Our
biodiversity and natural environment
face even more immense challenges.
While human management to reduce
the impact of other stresses may increase
resilience, the rate of climatic change is
generally considered to be occurring too
quickly for many species to adapt “under
their own steam” (Steffen et al. 2009). Loss
of species will have flow-on effects to
ecological communities and the services
that ecosystems provide. Loss of the Great
Barrier Reef due to bleaching from heat
stress, for example, has been estimated to
cost over $37 billion, with more than 50% of
tourists who would normally visit the Reef
staying away from Queensland if beaching
was permanent (Oxford Economics 2009).
More importantly, many forms of life, such
as coral reefs, ultimately face threats to
their very survival.
It has been estimated that heatwaves could cause an additional 6214 deaths by 2050 in Victoria alone.
Page 52CLIMATECOUNCIL.ORG.AU
04 HEATWAVES IN THE FUTURE

Nearly all countries of the world have
agreed to limit climate change to a rise
in global average temperature of 2°C
above pre-industrial levels, the so-called
2°C guardrail. Even a 2°C world will not
be easy to cope with, as heatwaves and
many other extreme events will become
more frequent and intense than today
(IPCC 2012), and other climate-related
risks, such as coastal flooding, will
increase as sea level continues to rise
through the century (IPCC 2013). But, on
current emission rates, we are heading
towards a 4°C world. The risks that a 4°C
world would pose for Australia—up to 7°C
warmer in summer on average in inland
areas; droughts five times more frequent
in the south and west; sea-level rise of up
to 1.1 m, and more than 7 m in the long
term—are so stark (Christoff 2013) that
no rational person would consider those
risks acceptable. The need to reduce
emissions and stabilize the climate has
never been more urgent.
Scientists have developed a carbon
budget approach to simplify the
challenge we face to stabilize the climate
at no more than a 2°C rise (Figure 21).
The question is simple: How much more
carbon dioxide can societies globally
emit into the atmosphere to stabilize the
climate within the 2°C guardrail?
The choices we make over this decade will largely determine the severity of the extreme heat that our children and grandchildren will experience.
As numerous model projections have
made clear, we are already committed to
an increasing frequency and intensity
of heatwaves over the coming decades
owing to the inertia in the climate
system. Many other extreme events are
expected to become more frequent and
more severe in the future (IPCC 2012),
with serious consequences for Australia
(Climate Commission 2013c). The reason
that many extreme events are worsening
is well known—the increasing human
emission of greenhouse gases (IPCC
2012, 2013).
We cannot wait to make greenhouse
gas emission reductions later, when
extreme events have already become
unmanageable. That will be too late. The
climate system is much like a battleship—
it has too much momentum to change
course quickly and so the ship’s wheel
must be turned well before the ship
needs to complete its turn. To stabilize
the climate in a state that humans,
our societies and natural ecosystems
can cope with, decisive, coherent and
significant action is required now. The
timing and magnitude of the emission
reduction challenge are crystal clear.
4.4 This is the critical decade
Page 53
HEATWAVES: HOTTER, LONGER, MORE OFTEN
CLIMATECOUNCIL.ORG.AU

To have a two-out-of-three chance
(67%) of staying within the 2°C guardrail,
humanity can emit no more than 1,000
billion tonnes of CO2 from 2012 until the
world’s economies must be completely
decarbonized (IPCC 2013). A similar
budget approach, but increasing our
chances to a three-in-four (75%) chance
of staying within the guardrail, calculated
a limit of 600–900 billion tonnes of CO2
emissions, depending on assumptions
made about the emissions of other
greenhouse gases such as nitrous oxide
and methane (Meinshausen et al. 2009;
Carbon Tracker and the Grantham
Research Institute 2013; Climate
Commission 2013b).
Whatever budget approach is used,
the bottom line is the same—most of
the world’s known fossil fuel reserves,
currently estimated to be the equivalent
of 2,860 billion tonnes of CO2 if all were
burnt (IEA 2012), must be left in the
ground. Under even the most optimistic
assumptions, only about one-third of the
fossil fuel reserves can be exploited to
have a reasonable change of meeting the
2°C guardrail.
Turning the global emissions trend
sharply downward this decade is an
urgent priority if the cost of meeting the
2°C guardrail is to be minimized. The
year at which global emissions peak is
Figure 21: Three emission trajectories based on the budget approach and giving a 67% probability of meeting the 2°C guardrail. Source: WBGU 2009; Climate Commission 2013b
2005
0
15
35
5
20
40
2011
2020
2015
Peak year
3.7% per year
Maximum reduction rate
5.3% per year
9.0% per year
10
30
25
2015 2025 20352010 2020 2030 2040 20502045
GLOB
AL E
MIS
SION
S Gt
CO 2
Page 54CLIMATECOUNCIL.ORG.AU
04 HEATWAVES IN THE FUTURE
thus a key indicator. If global emissions
can peak in 2015, the maximum rate
of emission reductions along the
subsequent pathway to decarbonisation
is 5.3% per year. If the peak emissions
year is delayed just five years to 2020,
the subsequent maximum emission
reduction rate rises to 9.0%, a much
more difficult and costly goal than a 5%
reduction rate, itself a daunting enough
challenge.
There are some glimmers of hope as
the world’s two largest emitters, the USA
and China, ramp up action to reduce
their emissions. Renewable energy
technologies, particularly solar and
wind, are being deployed at increasing
rates in many countries around the
world. Technologies and management
approaches for achieving energy
efficiencies across the economy are
multiplying rapidly. The rate of increase
of global fossil fuel emissions for 2012
and 2013 (estimated) was lower than
the 2003–2012 average but absolute
emissions continue to rise at the highest
of the IPCC emission trajectories (Global
Carbon Project 2013).
This is the critical decade for action.
We are now in 2014 and approaching
the halfway point in the decade.
Global emissions are still rising and
Australian emissions have yet to make
a decisive turn downwards. Despite the
promising developments in low carbon
technologies and energy efficiency
measures, Australians have not yet
reached a consensus on the need to
decarbonize our economy and on the
development of policies that will turn
investment towards a decarbonized
future. This challenge must be met if we
are to minimize the risk of worsening
heatwaves and other extreme events for
our children and grandchildren. It’s time
to get on with the job.
Page 55
HEATWAVES: HOTTER, LONGER, MORE OFTEN
CLIMATECOUNCIL.ORG.AU

ReferencesAlexander L, Zhang X, Peterson T, Caesar J, Gleason B, Klein A, Haylock M, Collins D, Trewin B, Rahimzadeh F, Tagipour A, Rupa Kumar K, Revadekar J, Griffiths G, Vincent D, Stephenson B, Burn J, Aguilar E, Brunet M, Taylor M, New M, Zhai P, Rusticucci M and Vazquez-Aguirre J. (2006) Global observed changes in daily climate extremes of temperature and precipitation. Journal of Geophysical Research: Atmospheres (1984–2012) 111.
Alexander LV and Arblaster JM (2009) Assessing trends in observed and modelled climate extremes over Australia in relation to future projections. International Journal of Climatology 29:417-435.
Alexander L, Uotila P and Nicholls N (2009) Influence of sea surface temperature variability on global temperature and precipitation extremes. Journal of Geophysical Research: Atmospheres (1984–2012), 114(D18).
Arblaster JM and Alexander LV (2012) The impact of the El Niño-Southern Oscillation on maximum temperature extremes. Geophysical Research Letters 39:L20702.
Banwell C, Dixon J, Bambrick H, Edwards F, Kjellstrom T (2012) Socio-cultural reflections on heat in Australia with implications for health and climate change adaptation. Global Health Action 5, doi: 10.3402/gha.v5i0.19277.
Barriopedro D, Fischer EM, Luterbacher J, Trigo RM and García-Herrera R (2011) The hot summer of 2010: redrawing the temperature record map of Europe. Science 332:220-224.
Beatty ME, Phelps S, Rohner C and Weisfuse I (2006) Blackout of 2003: public health effects and emergency response. Public Health Reports 121:36.
Beniston M (2004) The 2003 heat wave in Europe: A shape of things to come? An analysis based on Swiss climatological data and model simulations. Geophysical Research Letters 31.
Bergeron M (2003) Heat cramps: fluid and electrolyte challenges during tennis in the heat. Journal of science and medicine in sport 6:19-27.
Berry HL, Bowen K and Kjellstrom T (2010) Climate change and mental health: a causal pathways framework. International Journal of Public Health 55:123-132.
Black E, Blackburn M, Harrison G, Hoskins B and Methven J (2004) Factors contributing to the summer 2003 European heatwave. Weather 59:217-223.
BoM (Bureau of Meteorology) (2005) Annual Climate Summary – 2004, Significant Events. Bureau of Meteorology. Accessed at http://www.bom.gov.au/climate/annual_sum/2004/page13-15.pdf.
BoM (2009) The exceptional January-February 2009 heatwave in south-eastern Australia, National Climate Centre, Bureau of Meteorology, Special Climate Statement 17. Accessed at http://www.bom.gov.au/climate/current/statements/scs17d.pdf.
BoM (2012) Annual Climate Summary 2012. Bureau of Meteorology. Accessed at http://www.bom.gov.au/climate/annual_sum/2012/index.shtml.
BoM (2013a) Special climate statement 43 – extreme heat in January 2013. Accessed at http://www.bom.gov.au/climate/current/statements/scs43e.pdf.
BoM (2013b) ACORN-SAT station data and network maximum temperature data. Accessed 11.01.14 at http://www.bom.gov.au/climate/change/acorn-sat/#TABS=1.
BoM (2014) Special Climate Statement 47 – an intense heatwave in central and eastern Australia. Bureau of Meteorology. Accessed at http://www.bom.gov.au/climate/current/statements/scs47.pdf.
Booth H and Tickle L (2003) The future aged: new projections of Australia‘s elderly population. Australasian Journal on Ageing 22:196-202.
Brown S, Caesar J and Ferro C (2008) Global changes in extreme daily temperature since 1950. Journal of Geophysical Research: Atmospheres (1984–2012) 113.
Budd GM (2001) How do wildland firefighters cope? Physiological and behavioural temperature regulation in men suppressing Australian summer bushfires with hand tools. Journal of Thermal Biology 26:381-386.
Caesar J, Alexander L and Vose R (2006) Large-scale changes in observed daily maximum and minimum temperatures: Creation and analysis of a new gridded data set, Journal Geophysical Research 111: D05101, doi:10.1029/2005JD006280.
Callaghan J and Power SB (2011) Variability and decline in the number of severe tropical cyclones making land-fall over eastern Australia since the late nineteenth century. Climate Dynamics 37:647-662.
Carbon Tracker and the Grantham Research Institute (2013) Unburnable carbon 2013: Wasted capital and stranded assets. Accessed at http://www2.lse.ac.uk/GranthamInstitute/publications/Policy/docs/PB-unburnable-carbon-2013-wasted-capital-stranded-assets.pdf.
Cardoso P, Raffaelli D and Pardal M (2008) The impact of extreme weather events on the seagrass Zostera noltii and related Hydrobia ulvae population. Marine Pollution Bulletin 56:483-492.
Chhetri P, Hashemi A, Basic F, Manzoni A and Jayatilleke G (2012) Bushfire, Heat Wave and Flooding Case Studies from Australia. Report from the International Panel of the Weather project funded by the European Commission’s 7th framework programme. Melbourne, March 2012.
Christoff P (2013) Four Degrees of Warming: Australia in a Hot World. London: Routledge/Earthscan.
Ciais P, Reichstein M, Viovy N, Granier A, Ogée J, Allard V, Aubinet M, Buchmann N, Bernhofer C and Carrara A (2005) Europe-wide reduction in primary productivity caused by the heat and drought in 2003. Nature 437:529-533.
Page 56CLIMATECOUNCIL.ORG.AU
REFERENCES

Clarke H, Lucas C and Smith P (2012) Changes in Australian fire weather between 1973 and 2010. International Journal of Climatology 33(4): 931-944.
Climate Commission (2011) The Critical Deacde: Climate Change and Health. Hughes L and McMichael AJ.
Climate Commission (2013a) The Angry Summer. Steffen W.
Climate Commission (2013b) Critical Decade Update: Climate Change Science, Risks and Responses. Steffen W and Hughes L.
Climate Commission (2013c) The Critical Decade: Extreme Weather. Steffen W, Hughes W and Karoly D.
Climate Council of Australia (2013) Be Prepared: Climate Change and the Australian Bushfire Threat. Hughes L and Steffen W.
COPA COGECA (2003) Assessment of the impact of the heat wave and drought of the summer 2003 on agriculture and forestry. Committee of Agricultural Organisations in the European Union General Committee for Agricultural Cooperation in the European Union, Brussels, 15 pp.
Coumou D and Rahmstorf S (2012) A decade of weather extremes. Nature Climate Change 2:491-496.
CSIRO and BoM (2007) Climate change in Australia: technical report 2007. CSIRO, Australian Bureau of Meteorology. 148 pp.
CSIRO (2011) Climate Change: Science and solutions for Australia, Cleugh H, Stafford Smith M, Battaglia M and Graham P (eds.). Accessed at http://www.csiro.au/Outcomes/Climate/Climate-Change-Book.aspx.
CSIRO and BoM (2012) State of the Climate 2012. CSIRO and Bureau of Meteorology, Melbourne. Accessed at http://www.csiro.au/Outcomes/Climate/Understanding/State-of-the-Climate-2012.aspx.
Daufresne M, Bady P and Fruget J-F (2007) Impacts of global changes and extreme hydroclimatic events on macroinvertebrate community structures in the French Rhône River. Oecologia 151:544-559.
De’ath G, Fabricius KE, Sweatman H and Puotinen M (2012) The 27-year decline of coral cover on the Great Barrier Reef and its causes. Proceedings of the National Academy of Sciences 109:17995-17999.
De’ath G, Lough JM and Fabricius KE (2009) Declining coral calcification on the Great Barrier Reef. Science 323:116-119.
DEEDI (Department of Employment, Economic Development & Innovation) (2010) The Queensland beef industry: Current trends and future projections. Accessed at http://www.futurebeef.com.au/wp-content/uploads/2011/09/Beef-situationanalysis-2010.pdf.
Dematte JE, O’Mara K, Buescher J, Whitney CG, Forsythe S, McNamee T, Adiga RB and Ndukwu IM (1998) Near-fatal heat stroke during the 1995 heat wave in Chicago. Annals of Internal Medicine, 129, 173-181.
Della Marta PM, Haylock MR, Luterbacher J and Wanner H (2007) Doubled length of western European summer heat waves since 1880. Journal of Geophysical Research: Atmospheres (1984–2012) 112.
DHS (Department of Human Services) (2009) January 2009 Heatwave in Victoria: an Assessment of Health Impacts. Melbourne: Victorian Government Department of Human Services. Accessed at http://docs.health.vic.gov.au/docs/doc/January-2009-Heatwave-in-Victoria:-an-Assessment-of-Health-Impacts.
Ding T, Qian W and Yan Z (2010) Changes in hot days and heat waves in China during 1961–2007. International Journal of Climatology 30:1452-1462.
Dole R, Hoerling M, Perlwitz J, Eischeid J, Pegion P, Zhang T, Quan XÄ, Xu T and Murray D (2011) Was there a basis for anticipating the 2010 Russian heat wave? Geophysical Research Letters 38.
Donat MG, Alexander LV, Yang H, Durre I, Vose R, Dunn R, Willett K, Aguilar E, Brunet M, Caesar J, Hewitson B, Jacks C, Klein Tank AMG, Kruger A, Marengo J, Peterson TC, Renom M, Oria Rojas C, Rusticucci M, Salinger J, Sekele S, Srivastava A, Trewin B, Villarroel C, Vincent L, Zhai P, Zhang X and Kitching S (2013) Updated analyses of temperature and precipitation extreme indices since the beginning of the twentieth century: The HadEX2 dataset. Journal of Geophysical Research-Atmospheres, 118 (5), pp. 2098-2118.
Donner SD (2009) Coping with commitment: projected thermal stress on coral reefs under different future scenarios. PLoS One, 4(6), e5712.
DSE (Department of Sustainability and Environment) (2009) Yarra Bend Park Flying Fox Campsite: review of the scientific research. Victorian Department of Sustainability and Environment. Accessed at http://www.dse.vic.gov.au/__data/ assets/pdf_file/0003/102999/Flying_Fox_Scientific_ Research.pdf.
Dunne JP, Stouffer RJ and John JG (2013) Reductions in labour capacity from heat stress under climate warming. Nature Climate Change.
Durre I, Williams CN, Yin X and Vose RS (2009) Radiosonde-based trends in precipitable water over the Northern Hemisphere: An update. Journal of Geophysical Research: Atmospheres (1984–2012) 114.
Engel CE, Lane TP, Reeder MJ, Rezny M (2012) The meteorology of Black Saturday. Quarterly Journal of the Royal Meteorological Society 139: 585-599.
Fawcett R, Thurston W, Kepert J and Tory K (2012) Modelling the fire weather of Black Saturday. In: Proceedings of Bushfire CRC & AFAC 2012 Conference Research Forum, vol. 28.
Fischer EM, Seneviratne S, Vidale P, Lüthi D and Schär C (2007) Soil moisture-atmosphere interactions during the 2003 European summer heat wave. Journal of Climate 20:5081-5099.
Fisk WJ (2000) Health and productivity gains from better indoor environments and their relationship with building energy efficiency. Annual Review of Energy and the Environment 25:537-566.
Friedrich T, Timmermann A, Abe-Ouchi A, Bates N, Chikamoto M, Church M, Dore J, Gledhill D, González-Dávila M and Heinemann M (2012) Detecting regional anthropogenic trends in ocean acidification against natural variability. Nature Climate Change 2:167-171.
Page 57
HEATWAVES: HOTTER, LONGER, MORE OFTEN
CLIMATECOUNCIL.ORG.AU

Garrabou J, Coma R, Bensoussan N, Bally M, Chevaldonné P, Cigliano M, Díaz D, Harmelin JG, Gambi M and Kersting D (2009) Mass mortality in Northwestern Mediterranean rocky benthic communities: effects of the 2003 heat wave. Global Change Biology 15:1090-1103.
Gaughan J, Bonner S, Loxton I, Mader T, Lisle A and Lawrence R (2010) Effect of shade on body temperature and performance of feedlot steers. Journal of animal science 88:4056-4067.
GBRMPA (Great Barrier Reef Marine Park Authority) (2011) Impacts of tropical cyclone Yasi on the Great Barrier Reef: A report on the findings of a rapid ecological impact assessment, July 2011. Townsville: Great Barrier Reef Marine Park Authority. 21 p.
Global Carbon Project (2013) The Global Carbon Budget Update 2013. Accessed at http://www.globalcarbonproject.org/carbonbudget/index.htm.
Gordon G, Brown A and Pulsford T (1988) A koala (Phascolarctos cinereus Goldfuss) population crash during drought and heatwave conditions in south-western Queensland. Australian Journal of Ecology 13:451-461.
Gosling SN, McGregor GR and Páldy A (2007) Climate change and heat-related mortality in six cities Part 1: model construction and validation. International journal of biometeorology 51:525-540.
Gunning-Trant C (2010) Australian Wine Grape Production Projections to 2011-12, ABARE research report 10.4 for the Grape and Wine Research and Development Corporation, Canberra.
Hanna EG, Kjellstrom T, Bennett C and Dear K (2011) Climate change and rising heat: population health implications for working people in Australia. Asia-Pacific Journal of Public Health 23:14S-26S.
Hansen A, Bi P, Nitschke M, Ryan P, Pisaniello D and Tucker G (2008) The effect of heat waves on mental health in a temperate Australian city. Environmental health perspectives 116:1369.
Hennessy K, Fawcett R, Kirono D, Mpelasoka F, Jones D, Bathols J, Whetton P, Stafford Smith M, Howden M, Mitchell C, and Plummer N (2008) An assessment of the impact of climate change on the nature and frequency of exceptional climatic events. BoM – CSIRO Report. Accessed at http://www.daff.gov.au/__data/assets/pdf_file/0007/721285/csiro-bom-report-future-droughts.pdf.
Henry B, Eckard R, Gaughan JB and Hegarty R (2012) Livestock production in a changing climate: adaptation and mitigation research in Australia. Crop and Pasture Science 63:191-202.
Hirschi M, Seneviratne SI, Alexandrov V, Boberg F, Boroneant C, Christensen OB, Formayer H, Orlowsky B and Stepanek P (2010) Observational evidence for soil-moisture impact on hot extremes in southeastern Europe. Nature Geoscience 4:17-21.
Hoegh-Guldberg O, Mumby P, Hooten A, Steneck R, Greenfield P, Gomez E, Harvell C, Sale P, Edwards A and Caldeira K (2007) Coral reefs under rapid climate change and ocean acidification. Science 318:1737-1742.
Hoerling M, Kumar A, Dole R, Nielsen-Gammon JW, Eischeid J, Perlwitz J, Quan X-W, Zhang T, Pegion P and Chen M (2013) Anatomy of an extreme event. Journal of Climate 26:2811-2832.
Huber V, Wagner C, Gerten D and Adrian R (2012) To bloom or not to bloom: contrasting responses of cyanobacteria to recent heat waves explained by critical thresholds of abiotic drivers. Oecologia 169:245-256.
Hudson D, Marshall A and Alves O (2011) Intraseasonal forecasting of the 2009 summer and winter Australian heat waves using POAMA. Weather and Forecasting 26:257-279.
Hyatt OM, Lemke B, Kjellstrom T (2010) Regional maps of occupational heat exposure: past, present and potential future. Global Heath Action 3, doi: 10.3402/gha.v3i0.5715.
IEA (International Energy Agency) (2012) World Energy Outlook 2012. Paris: France.
IPCC (Intergovernmental Panel on Climate Change) (2007) Climate Change 2007: The Physical Science Basis. Contribution of Working Group I to the Fourth Assessment Report of the Intergovernmental Panel on Climate Change. Solomon S, Qin D, Manning M, Chen Z, Marquis M, Averyt K, Tignor MMB, Miller HL Jr and Chen Z (eds). Cambridge, UK and New York, NY, USA: Cambridge University Press.
IPCC (2012) Managing the Risks of Extreme Events and Disasters to Advance Climate Change Adaptation. A Special Report of Working Groups I and II of the Intergovernmental Panel on Climate Change. Field CB, Barros V, Stocker TF, Qin D, Dokken D, Ebi KL, Mastrandrea MD, Mach KJ, Plattner G-K, Allen SK, Tignor M and PM Midgley (eds.), Cambridge University Press, Cambridge and New York, 582 pp.
IPCC (2013) Climate Change 2013: The Physical Science Basis. Working Grup I Contribution to the IPCC 5th Assessment Report- Changes to the underlying Scientific/Technical Assessment. Accessed at http://www.ipcc.ch/report/ar5/wg1.
Jones R, Young C, Handmer J, Keating A, Mekala G and Sheehan P (2013) Valuing adaptation under rapid change, National Climate Change Adaptation Research Facility, Gold Coast, 184 pp.
Karoly D (2009) The recent bushfires and extreme heat wave in southeast Australia. Bulletin of the Australian Meteorological and Oceanographic Society 22:10-13.
Keating A and Handmer J (2013) Future potential losses from extremes under climate change: the case of Victoria, Australia. VCCCAR Project: Framing Adaptation in the Victorian Context, Working Paper Victorian Centre for Climate Change Adaptation Research, Melbourne.
Kenyon J and Hegerl GC (2008) Influence of modes of climate variability on global temperature extremes. Journal of Climate 21:3872-3889.
Khalaj B, Lloyd G, Sheppeard V and Dear K (2010) The health impacts of heat waves in five regions of New South Wales, Australia: a case-only analysis. International archives of occupational and environmental health 83:833-842.
Page 58CLIMATECOUNCIL.ORG.AU
REFERENCES

Kirono D, Kent D, Hennessy K, and Mpelasoka F (2011). Characteristics of Australian droughts under enhanced greenhouse conditions: Results from 14 global climate models. Journal of arid environments, 75(6), 566-575.
Kjellstrom T (2000) Climate change, heat exposure and labour productivity. Epidemiology 11(4): S144.
Kjellstrom T, Gabrysch S, Lemke B and Dear K (2009a) The ‘Hothaps’ programme for assessing climate change impacts on occupational health and productivity: an invitation to carry out field studies. Global Health Action 2.
Kjellstrom T, Kovats RS, Lloyd SJ, Holt T and Tol RS (2009b) The direct impact of climate change on regional labor productivity. Archives of Environmental & Occupational Health 64:217-227.
Kjellstrom T, Lemke B and Hyatt O (2011) Increased workplace heat exposure due to climate change: a potential threat to occupational health, worker productivity and local economic development in Asia and the Pacific region. Asian-Pacific Newsletter on Occupational Health and Safety 18.
Kjellstrom T, Lemke B, Venugopal V (2013) Occupational health and safety impacts of climate conditions. In: Pielke R. Climate Vulnerability. New York, Elsevier Publ Co. pp. 145-156.
Kjellstrom T and McMichael AJ (2013) Climate change threats to population health and well-being: the imperative of protective solutions that will last. Global Health Action 6, doi: 10.3402/gha.v6i0.20816.
Krockenberger AK, Edwards W and Kanowski J (2012) The limit to the distribution of a rainforest marsupial folivore is consistent with the thermal intolerance hypothesis. Oecologia 168:889-899.
Kuglitsch FG, Toreti A, Xoplaki E, Della-Marta PM, Luterbacher J and Wanner H (2009) Homogenization of daily maximum temperature series in the Mediterranean. Journal of Geophysical Research: Atmospheres (1984–2012) 114.
Lefcourt AM and Adams W (1996) Radiotelemetry measurement of body temperatures of feedlot steers during summer. Journal of animal science 74:2633-2640.
Lemke B and Kjellstrom T (2012) Calculating workplace WBGT from meteorological data: a tool for climate change assessment. Industrial Health 50: 267-278.
Lewis SC and Karoly DJ (2013) Anthropogenic contributions to Australia’s record summer temperatures of 2013. Geophysical Research Letters 40:3705-3709.
Lobell D and Field C (2007) Global scale climate–crop yield relationships and the impacts of recent warming. Public Health Resources, paper 152. Accessed at http://digitalcommons.unl.edu/publichealthresources/152.
Lobell DB, Torney A and Field CB (2011) Climate extremes in California agriculture. Climatic change 109:355-363.
Loughnan ME, Nicholls N and Tapper NJ (2010) The effects of summer temperature, age and socioeconomic circumstance on acute myocardial infarction admissions in Melbourne. Australia. International journal of health geographics 9(1): 41.
Luber G and McGeehin M (2008) Climate change and extreme heat events. American journal of preventive medicine 35:429-435.
Lucas C, Hennessy K, Mills G, Bathols J (2007) Bushfire weather in southeast Australia: recent trends and projected climate change impacts. Bushfire CRC and Bureau of Meteorology September 2007, Consultancy report prepared for the Climate Institute of Australia. Accessed at http://www.royalcommission.vic.gov.au/getdoc/c71b6858-c387-41c0-8a89-b351460eba68/TEN.056.001.0001.pdf.
Lukoschek V, Cross P, Torda G, Zimmerman R and Willis BL (2013) The Importance of Coral Larval Recruitment for the Recovery of Reefs Impacted by Cyclone Yasi in the Central Great Barrier Reef. PLoS One 8:e65363.
Luo L and Zhang Y (2012) Did we see the 2011 summer heat wave coming? Geophysical Research Letters 39.
Maloney SK and Forbes CF (2011) What effect will a few degrees of climate change have on human heat balance? Implications for human activity. International journal of biometeorology 55:147-160.
Marshall A, Hudson D, Wheeler M, Alves O, Hendon H, Pook M and Risbey J (2013) Intra-seasonal drivers of extreme heat over Australia in observations and POAMA-2. Climate Dynamics 1-23.
Marx MA, Rodriguez CV, Greenko J, Das D, Heffernan R, Karpati AM, Mostashari F, Balter S, Layton M and Weiss D (2006) Diarrheal illness detected through syndromic surveillance after a massive power outage: New York City, August 2003. American Journal of Public Health 96:547-553.
McEvoy D, Ahmed I and Mullett J (2012) The impact of the 2009 heat wave on Melbourne’s critical infrastructure. Local Environment 17:783-796.
McKechnie A and Wolf B (2010) Climate change increases the likelihood of catastrophic avian mortality events during extreme heat waves. Biology Letters 6:253-256.
McKechnie AE, Hockey PA and Wolf BO (2012) Feeling the heat: Australian landbirds and climate change. Emu 112:i-vii.
Meinshausen M, Meinshausen N, Hare W, Raper SC, Frieler K, Knutti R, Frame DJ and Allen MR (2009) Greenhouse-gas emission targets for limiting global warming to 2 C. Nature 458:1158-1162.
Min S-K, Cai W and Whetton P (2013) Influence of climate variability on seasonal extremes over Australia. Journal of Geophysical Research: Atmospheres 118:643-654.
Mueller B and Seneviratne SI (2012) Hot days induced by precipitation deficits at the global scale. Proceedings of the National Academy of Sciences 109:12398-12403.
Mullet J and McEvoy D (2014) With more heatwaves to come, how will our cities hold up? The Conversation, 17 January 2014. Accessed at https://theconversation.com/with-more-heatwaves-to-come-how-will-our-cities-hold-up-22079.
Munich RE (2011) Heat wave, drought, wildfires in Russia (Summer 2010) MR Touch Natural hazards – Event report. Accessed at http://www.munichre.com/app_pages/www/@res/pdf/natcatservice/catastrophe_portraits/event_report_hw_dr_wf_russia_touch_en.pdf. Geo Risks Research, NatCatSERVICE.
Page 59
HEATWAVES: HOTTER, LONGER, MORE OFTEN
CLIMATECOUNCIL.ORG.AU

Nairn J and Fawcett R (2013) Defining Heatwaves: Heatwave defined as a heat-impact even servicing all community and business sectors in Australia. CAWCR Technical Report, No. 060. CSIRO and Australian Bureau of Meteorology, p 96.
NASA (National Aeronautics Space Administration) (1999) NASA/GHCC Project Atland: Heat Island. Accessed at http://weather.msfc.nasa.gov/urban/urban_heat_island.html.
NASA/GISS (2012) The New Climate Dice: Public Perception of Climate Change. Accessed at http://www.giss.nasa.gov/research/briefs/hansen_17/.
Neveu A (2009) Incidence of climate on common frog breeding: Long-term and short-term changes. Acta Oecologica 35:671-678.
Nicholls N (2004) The changing nature of Australian droughts. Climatic change 63:323-336.
Nicholls N and Larsen S (2011) Impact of drought on temperature extremes in Melbourne,
Australia, Australian Meteorological & Oceanographic Journal, vol 61, issue 2, Australian Bureau of Meteorology, Melbourne Australia, pp. 113-116.
Nitschke M, Tucker GR and Bi P (2007) Morbidity and mortality during heatwaves in metropolitan Adelaide. Med J Aust 187:662-665.
NOAA (National Oceanic and Atmospheric Administration) (2011) State of the Climate: Global Analysis for Annual 2011, NOAA National Climatic Data Center. Accessed at http://www.ncdc.noaa.gov/sotc/global/2011/13.
NOAA (2012) State of the Climate: Global Analysis for Annual 2012, NOAA National Climatic Data Center. Accessed at http://www.ncdc.noaa.gov/sotc/global/2012/13.
Oxford Economics (2009) Valuing the effects of Great Barrier Reef Bleaching. Great Barrier Reef Foundation.
Parker TJ, Berry GJ and Reeder MJ (2013) The influence of tropical cyclones on heat waves in Southeastern Australia. Geophysical Research Letters 40:6264-6270.
Parsons KC (2003) Human thermal environments: the effect of hot, moderate and cold environments on human health, comfort and performance. Taylor & Francis, New York.
Perkins S and Alexander L (2013) On the measurement of heat waves. Journal of Climate 26:4500-4517.
Perkins S, Alexander L and Nairn J (2012) Increasing frequency, intensity and duration of observed global heatwaves and warm spells. Geophysical Research Letters 39.
Peterson TC, Stott PA and Herring S (2012) Explaining extreme events of 2011 from a climate perspective. Bulletin of the American Meteorological Society 93:1041-1067.
Pezza AB, Van Rensch P and Cai W (2012) Severe heat waves in Southern Australia: synoptic climatology and large scale connections. Climate Dynamics 38:209-224.
Price C and Rind D (1994) Possible implications of global climate change on global lightning distributions and frequencies. Journal of Geophysical Research 99:10823-10810,10831.
PwC (PriceWaterhouseCoopers) (2011) Protecting human health and safety during severe and extreme heat events: A national framework. Report by PriceWaterhouseCoopers Australia for the Commonwealth Government, November 2011. Accessed at http://www.pwc.com.au/industry/government/assets/extreme-heat-events-nov11.pdf.
QFF (Queensland Farmers’ Federation) (2008) A farmer’s guide to climate change in Queensland. Accessed at http://qff.org.au/wp-content/uploads/2011/10/ClimateChangeReport_lowres1.pdf.
QUT (Queensland University of Technology) (2010) Impacts and adaptation response of infrastructure and communities to heatwaves: The southern Australian experience of 2009. Report for the National Climate Change Adaptation Research Facility, Gold Coast, Australia, 152 pp.
Rahmstorf S and Coumou D (2011) Increase of extreme events in a warming world. Proceedings of the National Academy of Sciences 108:17905-17909.
Raloff J (2012) Extremely bad weather: Studies start linking climate change to current events. Science News 182:22-26.
Rikkert MG, Melis RJ and Claassen JA (2009) Heat waves and dehydration in the elderly. BMJ 339.
Robine J-M, Cheung SLK, Le Roy S, van Oyen H, Griffiths C, Michel J-P and Herrmann FOR (2008) Death toll exceeded 70,000 in Europe during the summer of 2003. Comptes rendus biologies, 331, 171-178.
Saman W, Boland J, Pullen S, de Dear R, Soebarto V, Miller W, Pocock B, Belusko M, Bruno F, Whaley D, Pockett J, Bennetts H, Ridley B, Palmer J, Zuo J, Ma T, Chileshe N, Skinner N, Chapman J, Vujinovic N, Walsh M, Candido C and Deuble MA (2013) A framework for adaptation of Australian households to heat waves, National Climate Change Adaptation Research Facility, Gold Coast, 242 pp.
Saunders DA, Mawson P and Dawson R (2011) The impact of two extreme weather events and other causes of death on Carnaby’s Black Cockatoo: a promise of things to come for a threatened species? Pacific Conservation Biology 17:141.
Schär C, Vidale PL, Lüthi D, Frei C, Häberli C, Liniger MA and Appenzeller C (2004) The role of increasing temperature variability in European summer heatwaves. Nature 427:332-336.
Schlenker W and Roberts MJ (2009) Nonlinear temperature effects indicate severe damages to U.S. crop yields under climate change. Proceedings of the National Academy of Sciences of the United States of America, 106:15594–15598.
Seneviratne SI, Corti T, Davin EL, Hirschi M, Jaeger EB, Lehner I, Orlowsky B and Teuling AJ (2010) Investigating soil moisture–climate interactions in a changing climate: a review. Earth-Science Reviews 99:125-161.
Singh S, Hanna EG, Kjellstrom T (2013) Working in Australia’s heat: health promotion concerns for health and productivity. Health Prom International, doi: 10.1093/heapro/dat027.
Slade T, Johnston A, Oakley Browne MA, Andrews G, and Whiteford H (2009) 2007 National Survey of Mental Health and Wellbeing: Methods and key findings. Australasian Psychiatry 43(7): 594-605.
Page 60CLIMATECOUNCIL.ORG.AU
REFERENCES

Smale DA and Wernberg T (2012) Ecological observations associated with an anomalous warming event at the Houtman Abrolhos Islands, Western Australia. Coral Reefs 31:441-441.
Smale DA and Wernberg T (2013). Extreme climatic event drives range contraction of a habitat-forming species. Proceedings of the Royal Society B: Biological Sciences, 280(1754).
SMH (The Sydney Morning Herald) (16 January 2014) Australian Open tournament referee implements extreme heat policy by Michael Chammas and Beau Donelly. The Sydney Morning Herald. Accessed at http://www.smh.com.au/sport/tennis/australian-open-tournament-referee-implements-extreme-heat-policy-20140116-30wl6.html#ixzz2sOop44J6.
SMH (The Sydney Morning Herald) (18 January 2014) Scorchers: the reality of a sunburnt country by Peter Hannam. The Sydney Morning Herald. Accessed at http://www.smh.com.au/environment/climate-change/scorchers-the-reality-of-a-sunburnt-country-20140117-3105t.html.
Smith KB and Humphreys JS and Wilson, MG (2008) Addressing the health disadvantage of rural populations: how does epidemiological evidence inform rural health policies and research?. Australian Journal of Rural Health, 16(2): 56-66.
State of Victoria (2011) Heatwave plan for Victoria: Protecting health and reducing harm from heatwaves. Department of Health, State of Victoria. Accessed at http://www.health.vic.gov.au/environment/heatwaves-plan.htm.
Steffen W, Burbidge AA, Hughes L, Kitching R, Lindenmayer D, Musgrave W, Stafford Smith M and Werner PA (2009) Australia’s biodiversity and climate change: a strategic assessment of the vulnerability of Australia’s biodiversity to climate change. A report to the Natural Resource Management Ministerial Council commissioned by the Australian Government. CSIRO Publishing.
Stone B, Hess JJ and Frumkin H (2010) Urban form and extreme heat events: are sprawling cities more vulnerable to climate change than compact cities? Environmental health perspectives 118:1425.
Stott PA and Stone DA and Allen MR (2004) Human contribution to the European heatwave of 2003. Nature 432:610-614.
Tawatsupa B, Lim LL, Kjellstrom T, Seubsman S-A and Sleigh A (2010) The association between overall health, psychological distress, and occupational heat stress among a large national cohort of 40,913 Thai workers. Global Health Action 3.
The Age (23 January 2014) Deaths spark call to review state’s heatwave plan by Julia Medew. Accessed at http://www.theage.com.au/victoria/deaths-spark-call-to-review-states-heatwave-plan-20140122-3196i.html#ixzz2tHJyGhlO.
Tong S, Wang XY and Barnett AG (2010) Assessment of heat-related health impacts in Brisbane, Australia: comparison of different heatwave definitions. PLoS One 5:e12155.
Trenberth KE and Fasullo JT (2012) Climate extremes and climate change: The Russian heat wave and other climate extremes of 2010. Journal of Geophysical Research: Atmospheres 117:D17103.
Trewin B (2013) A daily homogenized temperature data set for Australia. International Journal of Climatology 33:1510-1529, doi: 10.1002/joc.3530.
Trewin B and Smalley R (2013) Changes in extreme temperatures in Australia, 1910 to 2011. In: 19th AMOS National Conference, Melbourne, pp 11-13.
US EPA (United States Environmental Protection Agency) (2008) Reducing Urban Heat Islands: Compendium of Strategies. Accessed at http://www.epa.gov/hiri/resources/compendium.htm.
van der Velde M, Tubiello FN, Vrieling A and Bouraoui F (2012) Impacts of extreme weather on wheat and maize in France: evaluating regional crop simulations against observed data. Climatic change 113:751-765.
van Iersel R and Bi P (2009) The impact of heat waves on the elderly living in Australia: how should a heat health warning system be developed to protect them? The Rangeland Journal 31:277-281.
WBGU (German Advisory Council on Global Change) (2009) Solving the climate dilemma: The budget approach. Special Report. Berlin: WBGU Secretariat.
Webb L, Whiting J, Watt A, Hill T, Wigg F, Dunn G, Needs S and Barlow E (2010) Managing grapevines through severe heat: A survey of growers after the 2009 summer heatwave in south-eastern Australia. Journal of Wine Research 21:147-165.
Welbergen JA, Klose SM, Markus N and Eby P (2008) Climate change and the effects of temperature extremes on Australian flying-foxes. Proceedings of the Royal Society B: Biological Sciences 275:419-425.
Wernberg T, Smale DA, Tuya F, Thomsen MS, Langlois TJ, de Bettignies T, Bennett S and Rousseaux CS (2012) An extreme climatic event alters marine ecosystem structure in a global biodiversity hotspot. Nature Climate Change.
White D, Roschelle A, Peterson P, Schlissel D, Biewald B and Steinhurst W (2003) The 2003 blackout: solutions that won’t cost a fortune. The Electricity Journal 16:43-53.
Williams SE, Bolitho EE and Fox S (2003) Climate change in Australian tropical rainforests: an impending environmental catastrophe. Proceedings of the Royal Society of London Series B: Biological Sciences 270:1887-1892.
Winguth A and Kelp B (2013) The Urban Heat Island of the North-Central Texas Region and Its Relation to the 2011 Severe Texas Drought. Journal of Applied Meteorology & Climatology 52.
Wrigley BJ, Ota S and Kikuchi A (2006) Lightning strikes twice: Lessons learned from two food poisoning incidents in Japan. Public Relations Review 32:349-357.
Page 61
HEATWAVES: HOTTER, LONGER, MORE OFTEN
CLIMATECOUNCIL.ORG.AU

IMAGES CREDITS:Cover photo “Extreme heatwave Jacana Electricity transmission as stormclouds gather” by Flickr user Takver is licensed under CC BY 2.0.
Section 1 cover photo “Sun and trees” by Flickr user bartek.wu is licensed under CC BY 2.0.
Section 2 cover photo “Dry river #90845642” by Flickr user Coda is licensed under CC BY 2.0.
Section 3 cover photo “Dry creek bed, Murchison River Gorge” by Flickr user Derek A Young is licensed under CC BY 2.0.
Section 4 cover photo “Galah drinking” by Flickr user heatherw is licensed under CC BY 2.0.
—
Page 31: Figure 12 by Carlos Flores.
Page 37: Figure 14 by Daniel Vianna/Wikicommons. Figure 15 by Ian Montgomery. Figure 16 by Climate Commission 2013b, modified from Hoegh-Guldberg et al. 2007.
Page 40: Figure 17 by Sean Blocksidge.
Page 42: ‘Scuba Diving the Great Barrier Reef with “Crush”’ by University of Denver/Flickr.
Page 62CLIMATECOUNCIL.ORG.AU
REFERENCES

AT HOME › Spend time in cooled, well air-conditioned places. If you do not have air-
conditioning at home, spend time in places that do, such as public libraries,
cinemas, etc
› Avoid using an indoor fan in indoor areas without air-conditioning where the
temperature is higher than 37°C
› The elderly should be reminded to remain in cool environments, and to wear cool,
comfortable clothes
› Check with your local council to hear their heatwave response plan
AT THE WORKPLACE › Limit trips outside air-conditioned buildings; rearrange work meetings if necessary
› Drink plenty of water
FOOD › Ensure that food is refrigerated properly and immediately
› Dispose of spoilt food, and dispose responsibly
TRANSPORT/INFRASTRUCTURE › Stay informed and up-to-date about planned blackouts
› Have a backup plan in case electricity or transport (road/rail) infrastructure fails
WILDLIFE › Leave out shallow containers of water for birds, possums, and other animals,
placing small stones in the bottom of the container and ensuring that the water
is left in a shady, protected environment (out of view from birds of prey and high
enough to be safe from cats)
› If you find injured or heat-stressed wildlife, bring them into cooler environments
and lightly mist with water
› If you are concerned about an animal, call a wildlife rescue centre near to you
PETS › If dogs or cats appear heat stressed, panting or restless, bath in cool water; call your
vet if you are concerned about a pet
What to do in a heatwaveIN AN EMERGENCY, CALL TRIPLE ZERO (106 FOR PEOPLE WITH A HEARING OR SPEECH IMPAIRMENT) › Take care of yourself
› Stay hydrated
› Stay cool
› Keep out of the sun
› Keep in touch with family, friends and neighbours
› Stay informed
CLIMATECOUNCIL.ORG.AU