heat treatment of natural diatomite - … · heat treatment of natural diatomite 415 bridges...
TRANSCRIPT

http://dx.doi.org/10.5277/ppmp120208
Physicochem. Probl. Miner. Process. 48(2), 2012, 413−424 Physicochemical Problems
of Mineral Processing
w w w . m i n p r o c . p w r . w r o c . p l / j o u r n a l / ISSN 1643-1049 (print)
ISSN 2084-4735 (online)
Received January 5, 2012; reviewed; accepted March 1, 2012
HEAT TREATMENT OF NATURAL DIATOMITE
Suzan S. IBRAHIM*, Ali Q. SELIM**
*Central Metallurgical R&D Institute CMRDI, P.O. Box 87, Helwan, Egypt, [email protected]
** Geology Dept., Faculty of Science, Beni Suif Univ., Egypt
Abstract. Heat treatment of an Egyptian natural diatomite was performed at different
temperatures (600, 900, 1000, 1100, and 1200ºC). The samples were heated from room
temperature 23±1ºC to the appointed temperature at a rate of 20oC/ min, and kept at that
temperature for 5 hour. The heat treated samples were examined by X-ray diffraction, scan-
electro-microscopy, and other physical characters like sample color, texture, and weight
reduction. Results showed that heat treatment of natural diatomite caused different forms of
mineral modification and transformation to another mineral. At 1200ºC a new nano-metric
silicate material was formed. These changes were mainly depending upon the treated
temperature, diatomite genera, and the accompanied gangue minerals as well.
keywords: natural diatomite, heat treatment, porous structure
1. Introduction
Diatoms are belonging to the diploid eukaryotic unicellular algae (Bacillariophyta)
with wide ranges of structures and shapes. Each of these has its own distinct shape and
size (Sterrenburg et al., 2007). The outstanding feature of diatoms is their siliceous
“shell” or frustule, which can be preserved for millions of years. In this manner, fossil
deposits of microscopic diatom shells were built up as thick layers of “diatomaceous
earth” or diatomite which could be extending over several miles (Sterrenburg et al.,
2007).
Diatomite is formed by the closest packing of hydrous SiO2 spheres and is
classified as opal-A. Opaline minerals have been categorized into three general
groups, including Opal-A, Opal-C, and Opal-CT, according to crystallinity and crystal
structure (Jones and Segnit, 1971). Opal-A is predominantly amorphous. Opal-CT is
semi-crystalline comprising of crystalline regions of cristobalite and tridymite, where
opal-C is a well-ordered form of the silicate predominantly in the cristobalite form
(Jones and Segnit, 1971). Diatomaceous silica, the amorphous silica with opal-A
structure, exists in the form of frustule in the natural mineral assemblage of diatomite.
Since the diatomaceous silica has properties such as high porosity with strong
absorbability and excellent thermal resistance, diatomite has been widely used as filter
aid, catalytic support, biological support, functional filler, and adsorbent, etc.
414 S.S. Ibrahim, A.Q. Selim
(Erdogan et al., 1996; Ibrahim and Selim, 2011; Li et al., 2003; Powers and Ibrahim,
2007; Vasconclos et al., 2000).
As is well known, the silica surface consists of siloxane bridges and different types
of hydroxyl groups (i.e. silanols), which are key reactive sites for various surface
reactions: wetting, dispersion in solutions, adsorption and surface modification (e.g.
silylation) etc. (Ek et al., 2001; Takei et al., 1999). The distribution and evolution of
different types of silanols and siloxanes largely depend on thermal treatment
condition, as well as on ambient humidity and storage time (Bronnimann et al., 1988).
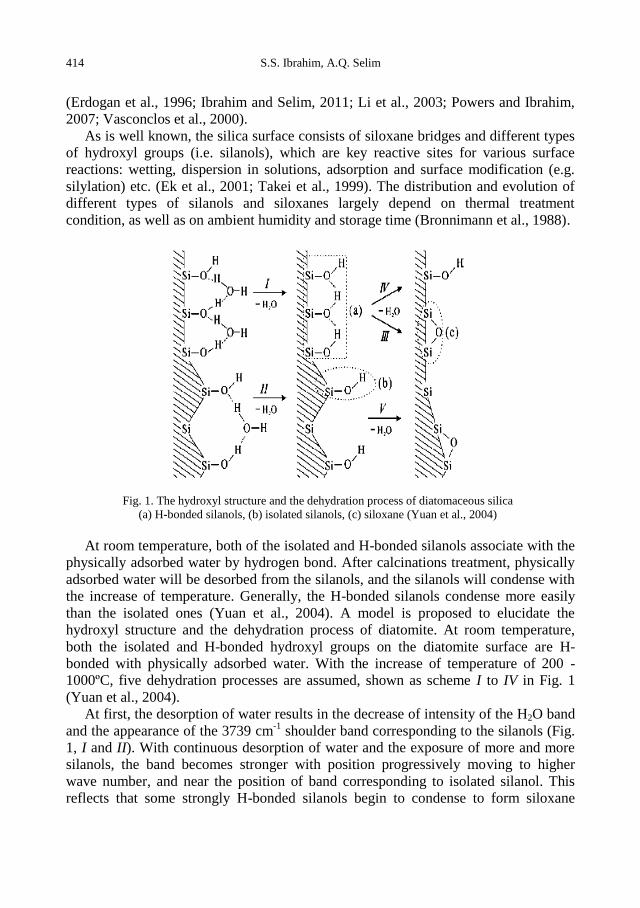
Fig. 1. The hydroxyl structure and the dehydration process of diatomaceous silica
(a) H-bonded silanols, (b) isolated silanols, (c) siloxane (Yuan et al., 2004)
At room temperature, both of the isolated and H-bonded silanols associate with the
physically adsorbed water by hydrogen bond. After calcinations treatment, physically
adsorbed water will be desorbed from the silanols, and the silanols will condense with
the increase of temperature. Generally, the H-bonded silanols condense more easily
than the isolated ones (Yuan et al., 2004). A model is proposed to elucidate the
hydroxyl structure and the dehydration process of diatomite. At room temperature,
both the isolated and H-bonded hydroxyl groups on the diatomite surface are H-
bonded with physically adsorbed water. With the increase of temperature of 200 -
1000ºC, five dehydration processes are assumed, shown as scheme I to IV in Fig. 1
(Yuan et al., 2004).
At first, the desorption of water results in the decrease of intensity of the H2O band
and the appearance of the 3739 cm-1
shoulder band corresponding to the silanols (Fig.
1, I and II). With continuous desorption of water and the exposure of more and more
silanols, the band becomes stronger with position progressively moving to higher
wave number, and near the position of band corresponding to isolated silanol. This
reflects that some strongly H-bonded silanols begin to condense to form siloxane
Heat treatment of natural diatomite 415
bridges (Fig.1, scheme III and IV) while most of the isolated silanols have not
condensed. This shows that for the H-bonded silanol in diatomaceous silica, the
weaker the hydrogen bond is, the closer its band nears that of isolated silanol, and
more difficult the occurrence of condensation is. At 1000ºC, the intensity of 3745 cm-1
band reached its maximum, indicating the amount of isolated silanols reached the
maximum. The asymmetry of this band toward the lower wave number reflects that
there are some weakly H-bonded silanols remain on the surface (Yuan et al., 2004).
2. Experimental
A natural diatomite sample from Kom Osheem deposit, Egypt was subjected to
heat treatment at temperatures from 600 to 900, 1000, 1100, and 1200ºC. Soaking time
was kept constant at 5 hours through all experiments. The tests were carried out in
programmable furnace, with a heating rate from a room temperature to the appointed
temperature of 20oC/min. Natural diatomite means that the crude ore was subjected to
size disintegration and classified to remove extraneous matter coarser than 45 micron.
Phase analysis of the treated samples was applied using X-ray diffractmeter model
“pw 1010” with CuKα radiation under target voltage 40kV and current 30 mA in a
scanning rate of 5º 2θ/min. Elemental chemical analysis was conducted using “Perkin-
Elmer Analyst 200” atomic absorption. Thermal analysis of the sample was carried out
using “Netzsch STA 409 C/CD” unit. Particle size analysis of the sample was carried
out using the ‘Warman” cyclosizer. Structure skeleton of different samples have been
microscopically viewed using scanning electron microscope (SEM) of the type JEM-
1230, JEOL.
3. Results and discussion
3.1. Sample characterization
Phase analysis of the sample is illustrated in Fig. 2. Semi quantitative analysis of
the sample showed that calcite [C], montmorillonite [M], and quartz [Q] were the
main gangue minerals. They were found approximately at the ratio 4.45: 1.13:1,
respectively (Table 1). Chemical analysis of the sample is shown in Table 2. From the
Tables it could be concluded that diatomite mineral constituted about 80% of the
sample. Particle size distribution showed that 100% of the sample was below 35
micron, whereas 94% was below 11 micron (Table 3).
Thermal analysis of the sample was depicted in Fig. 3. Figure 3 showed an
endothermic pattern due to the release of diatomite absorbed water at the temperature
range 100–200ºC, with a loss in sample weight reaching 0.7%. At temperature range
250- 600ºC, another endothermic reaction due to the release of the combined water of
the clay mineral (300- 600°C) was recorded (Fig. 3). This endothermic reaction caused
a loss in weight reaching 5.55%. An intense endothermic peak at the temperature
range 600 to 750ºC due to calcite mineral break down, with a loss in weight reaching
8.95%, was depicted (Fig. 3). A loss in the sample weight reaching 1.75% was noticed

416 S.S. Ibrahim, A.Q. Selim
at 900-1200ºC that may be attributed to the complete dehydration of diatomite
structure and the formation of a new silicate material.
SEM pictures of the sample showed that the most abundant diatomite genera types
were epithemia argus (long diameter 70 um and short diameter 10 um), actinocyclus
ehrenbergii (diameter 14 μm), and pinnularia brevicostata ((long diameter 20 μm and
short diameter 10 μm) (Fig. 4). The presence of these diatomite genera indicated the
fresh water environment origin of the deposit (Moyle and Dolley, 2003). Microscopic
pictures of the sample revealed the presence of intact diatomite skeletons but not
clearly observed. It was noticed that the skeletons surfaces were partly masked by the
impurities; meanwhile the pores were filled with minute mineral particulates and
organic matter, Fig. 4.
Fig. 2. XRD patterns of diatomite head sample
Table 1. Semi quantitative phase analysis of accompanied gangue minerals after XRD
Mineral Wt.%
Quartz [Q]
Montmorillonite [M]
Calcite [C]
15.20
17.20
67.60
Table 2. Chemical analysis of the head sample
Constituent Wt. % SiO2 83.60 Al2O3 4.24 CaO 6.17
Fe2O3 1.07 LOI 4.86

Heat treatment of natural diatomite 417
Table 3. Particle size distribution of the head sample
Size Fraction, um Cum. Wt. % Retained 44 35 25 0.24 15 1.70 11 5.96 -11 100.00
Fig. 3. Thermal analysis of diatomite sample
a b c
Fig. 4. Different diatomite genera, a: epithemia argus, b: actinocyclus ehrenbergii, c: pinnularia
brevicostata, with complete blocked pore openings
3.2. Thermal behavior of the sample
On heating the sample at 600ºC for 5 hrs, dehydration process of diatomite surface
was continued, where montmorillonite mineral was de-hydroxylated to form the
amorphous meta kaolin according to the reaction (Balek and Murat, 1996):
Al2O3 2SiO2 2H2O = Al2O3 2SiO2 + 2H2O.

418 S.S. Ibrahim, A.Q. Selim
Figure 5 illustrats the XRD pattern of the heated sample at 600ºC for 5 hrs. By
comparing Figs. 2 and 5, it could be noticed that the main peak related to
montmorillonite [M] at d-spacing = 15.0 (2θ=6º) disappeared due to the de-
hydroxylation reaction to form metakaolin that appeared as broad noisy peaks at 2θ=
15º-30º (Balek and Murat, 1996) (Fig. 5). The fired sample at 600ºC for 5hrs showed a
loss in sample weight reaching 6.39% and left behind a pink powder instead of the
grey original color of the sample.
On heating the sample at 900ºC for 3 hrs wollastonite mineral was formed as a sole
crystalline phase as shown in Figure 6. The mineral main peaks were shown at
2θ=30.06, 25.28, 23.20, (Fig. 6). On the other hand thermal decomposition of calcite
was remarked, where complete removal of its main peaks at 2θ= 29.40, 43.14, and
39.40 was recorded (Fig. 6).
Fig. 5. XRD patterns of heated sample at 600ºC for 5hrs
Fig. 6. XRD patterns of heated sample at 900ºC for 3hrs

Heat treatment of natural diatomite 419
The formation of wollastonite mineral [W] was explained after the reaction of the
reactive lime species after calcite dissociation and reactive diatomaceous silica that
was found in abundance in the heated sample (Ibrahim, 2009). A substantial increase
in wollastonite peak intensity from 45% to 52.7% by increasing time of heating was
remarked (Figs. 7 and 8), respectively.
Fig. 7. XRD patterns of heated sample at 900ºC for 5hrs
Fig. 8. XRD patterns of heated sample at 1000ºC for 5hrs
SEM pictures of the heated sample at 900ºC for 3 hrs showed that the pores
openings of the diatomite porous structure became free from any blocking materials
when compared to the original sample (Figs. 9 and 4), respectively. The temperature at
which complete clearance of the porous structure of diatomite, i.e. calcinations
temperature varied slightly from type to type, and presented an essential operation for
diatomite when it was supposed to be directed to filter aid applications (Ibrahim and
Selim, 2010; Ibrahim and Selim, 2011; Powers and Ibrahim, 2007).
420 S.S. Ibrahim, A.Q. Selim
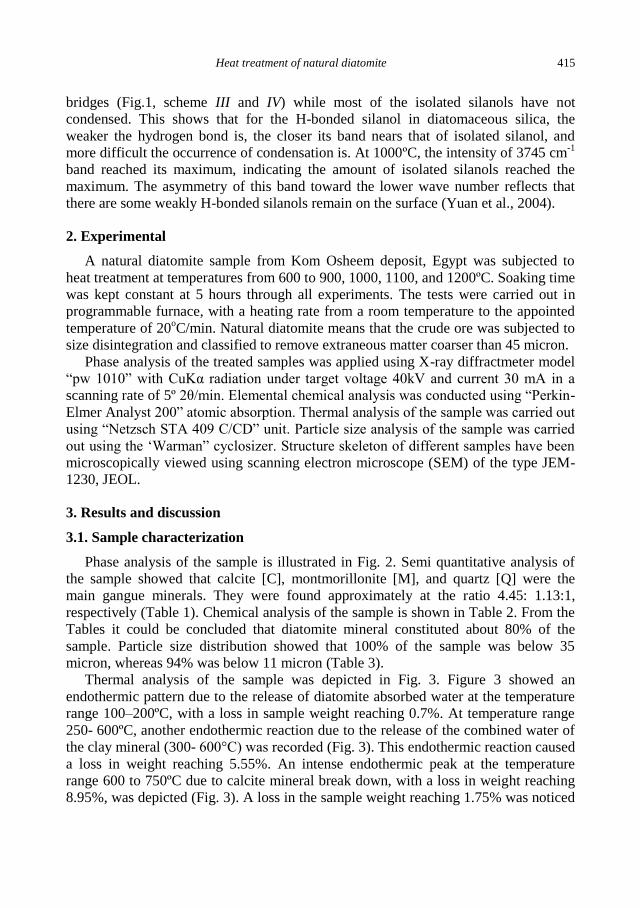
Fig. 9. SEM pictures showing the clean opened pores at 900ºC for 3 hrs
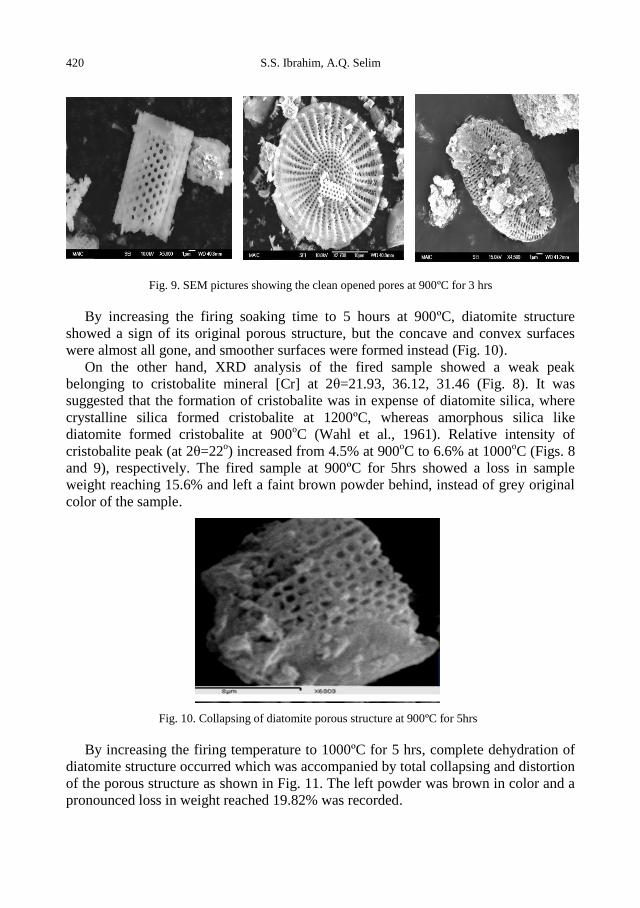
By increasing the firing soaking time to 5 hours at 900ºC, diatomite structure
showed a sign of its original porous structure, but the concave and convex surfaces
were almost all gone, and smoother surfaces were formed instead (Fig. 10).
On the other hand, XRD analysis of the fired sample showed a weak peak
belonging to cristobalite mineral [Cr] at 2θ=21.93, 36.12, 31.46 (Fig. 8). It was
suggested that the formation of cristobalite was in expense of diatomite silica, where
crystalline silica formed cristobalite at 1200ºC, whereas amorphous silica like
diatomite formed cristobalite at 900oC (Wahl et al., 1961). Relative intensity of
cristobalite peak (at 2θ=22o) increased from 4.5% at 900
oC to 6.6% at 1000
oC (Figs. 8
and 9), respectively. The fired sample at 900ºC for 5hrs showed a loss in sample
weight reaching 15.6% and left a faint brown powder behind, instead of grey original
color of the sample.
Fig. 10. Collapsing of diatomite porous structure at 900ºC for 5hrs
By increasing the firing temperature to 1000ºC for 5 hrs, complete dehydration of
diatomite structure occurred which was accompanied by total collapsing and distortion
of the porous structure as shown in Fig. 11. The left powder was brown in color and a
pronounced loss in weight reached 19.82% was recorded.

Heat treatment of natural diatomite 421
By heating the sample at 1100ºC for 5 hrs, an olive green colored material was
formed. The main XRD peaks of the product appeared at 2θ=21.93, 29.85, 35.48, and
30.88, that belonged to calcium alkali silicate mineral called diopside, (Fig. 12).
Diopside is an inosilicate mineral composed of single chains of silica tetrahedra and
belonging to pyroxene group. Pyroxenes have the general formula XY(Si, Al)2O6
(where X represents calcium, sodium, Fe+2
and magnesium and more rarely zinc,
manganese and lithium and Y represents ions of smaller size, such as chromium,
aluminium, iron (III), magnesium, manganese, scandium, titanium, vanadium and
even iron (II). Although aluminium substitutes extensively for silicon in silicates such
as feldspars and amphiboles, the substitution occurs only to a limited extent in most
pyroxenes (Morimoto et al., 1989). The formed product showed loss on sample weight
that reached 23.08% with a hard vitreous texture.
Fig. 11. Complete destroying of diatomite porous structure at 1000ºC
Fig. 12. XRD patterns of heated sample at 1100ºC for 5hrs

422 S.S. Ibrahim, A.Q. Selim
Figure 13 illustrates the XRD pattern of the sample after heating at 1200ºC for 5
hrs. The formed sample was a nano-metric vitreous glassy material (Fig. 14) that
showed remarkable reduction in volume compared to the sample heated at 900ºC for 5
hrs (Fig. 15).
Fig. 13. XRD patterns of heated sample at 1200ºC for 5hrs
Fig. 14. SEM picture of the new material formed at 1200ºC
4. Conclusions
Natural diatomite sample from Kom Osheem Localiy, El-Fayoum Depression,
Egypt was subjected to heat treatment. The main accompanied minerals were calcite,
montmorillonite and quartz. The sample was soaked for 5 hrs at temperatures of 600,
900, 1000, 1100, and 1200ºC. Characterization of the heated samples was followed up

Heat treatment of natural diatomite 423
by using XRD and SEM techniques and other physical characterization like the
detection of sample color, texture, and weight loss. Results showed that by heating the
sample at different temperatures for 5 hrs, various transformation reactions from
mineral to another was occurred. On the other hand, results showed that at 900ºC for 3
hrs the diatomite porous structure was completely calcined and improved. Partial
collapsing of this porous structure started by heating the sample at 900ºC for 5 hrs,
where complete destruction was remarked at 1100ºC with the formation of a nano-
metric garnet like material at 1200ºC.
Fig. 15. Change in colour and volume of heated samples (A) at 900ºC and (B) at 1200ºC
References
BALEK V., MURAT M., 1996, The emanation thermal analysis of kaolinite clay minerals, Thermochim.
Acta, 282–283, 385–397.
BRONNIMANN C.E., ZEIGLER R.C., MACIEL G.E., 1988, Proton NMR study of dehydration of the
silica gel surface, J. Am. Chem. Soc., 110, 2023–2026..
EK S., ROOT A., PEUSSA M., NIINISTO L., 2001, Determination of the hydroxyl group content in
silica by the thermogravimetry and a comparison with HMAS NMR results, Thermochim. Acta, 379,
201–212.
ERDOGAN B., DEMIRCI S., AKAY Y., 1996, Treatment of sugar beet juice with bentonite, sepiolite,
diatomite, and quartamin to remove color and turbidity, Appl. Clay Sci. 11, 55–67.
IBRAHIM S.S., 2007, Preparation of wollastonite mineral from Egyptian crude minerals, Egyptian
Academy of Scientific Research and Technology.
IBRAHIM S.S., SELIM A.Q., 2011, Evaluation of Egyptian diatomite for filter aid applications,
Physicochem. Probl. Miner. Process., 47, 113–122.
IBRAHIM S.S., SELIM A.Q., 2010, Producing a micro-porous diatomite by a simple classification-
calcination process, The Journal of Ore Dressing 2(23), 25–33.
JONES J.B., SEGNIT, E.R., 1971, The nature of opal 1. nomenclature and constituents phases, J. Geol.
Soc., Aust. 18, 57–68.
LI X., BIAN C., CHEN W., HE J., WANG Z, XU N, XUE G, 2003, Polyaniline on surface modification
of diatomite: A novel way to obtain conducting diatomite fillers, Appl. Surf. Sci. 207, 378–383.
MORIMOTO N., FABRIES J., FERGUSON A.K., GINZBURG I.V., ROSS M., SEIFEIT F.A.,
ZUSSMAN J., 1989, Nomenclature of pyroxenes, Canadian Mineralogist 27, 143–156.

424 S.S. Ibrahim, A.Q. Selim
MOYLE P.R., DOLLEY T.P., 2003, A comparison of marine and continental-lacustrine diatomite
deposits, Industrial-Minerals Research.
POWERS K., IBRAHIM S.S., 2009, Preparation of different diatomite concentrates for various
industrial applications, International Science and Engineering, NSF, USA.
STERRENBURG F., GORDON RJ., TIFFANY M.A., NAGY S.S., 2007, Algae and cyan-bacteria in
extreme environments, Springer, 141–172.
TAKEI T., KATO K., MEGURO A., CHIKAZAWA M., 1999, Infrared Spectra of Geminal and Novel
Triple Hydroxyl Groups on Silica Surfaces, Colloids and Surfaces, A: Physicochemical and
Engineering Aspects, Vol. 150, No. 1, 77–84.
VASCONCELOS P.V., LABRINCHA J.A., FERREIRA J.M.F., 2000, Permeability of diatomite layers
processed by different colloidal techniques, J. Eur. Ceram. Soc. 20, 201–207.
WAHL F.M., GRIM R.E., GRAF R.B., 1961, Phase Transformations in Silica as Examined by
Continuous X-ray Diffraction, The American Mineralogist, 46, 1064–1076.
YUAN P., WU D.Q., HE H.P., LIN Z.Y., 2004, The hydroxyl species and acid sites on diatomite surface:
A combined IR and Raman study, Applied Surface Science, 227, 30–39.