heat transfer analysis in the cylinder of reciprocating
TRANSCRIPT

Purdue UniversityPurdue e-Pubs
International Compressor Engineering Conference School of Mechanical Engineering
2016
Heat Transfer Analysis in the Cylinder ofReciprocating CompressorJán TuhovcákBrno University of Technology, Czech Republic, [email protected]
Jí?í Hej?íkBrno University of Technology, Czech Republic, [email protected]
Miroslav JíchaBrno University of Technology, Czech Republic, [email protected]
Follow this and additional works at: https://docs.lib.purdue.edu/icec
This document has been made available through Purdue e-Pubs, a service of the Purdue University Libraries. Please contact [email protected] foradditional information.Complete proceedings may be acquired in print and on CD-ROM directly from the Ray W. Herrick Laboratories at https://engineering.purdue.edu/Herrick/Events/orderlit.html
Tuhovcák, Ján; Hej?ík, Jí?í; and Jícha, Miroslav, "Heat Transfer Analysis in the Cylinder of Reciprocating Compressor" (2016).International Compressor Engineering Conference. Paper 2409.https://docs.lib.purdue.edu/icec/2409

1108, Page 1
23rd International Compressor Engineering Conference at Purdue, July 11-14, 2016
Heat Transfer Analysis in the Cylinder of Reciprocating Compressor
Jan Tuhovcak1*, Jiri HEJCIK1, Miroslav JICHA1
1Brno University of Technology, FME, Energy Institute Brno, Czech Republic [email protected]
* Corresponding Author
ABSTRACT
Heat transfer inside the cylinder of reciprocating compressor causes decrease of volumetric efficiency due to superheating of the working fluid. Understanding heat transfer phenomenon inside the cylinder is necessary to achieve higher efficiency. There are several empirical correlations available in the literature to date, which are employed in simulation tools due to their easy-to-use properties and they provide fast results with solid accuracy compared to more complex numerical models for heat transfer. Nevertheless, there is a problem with validation these empirical correlations. Solution of this problem could be found in CFD simulation tools. This paper presents the CFD analysis of heat transfer in order to compare heat fluxes calculated by numerical tools with those obtained by empirical correlations. Distribution of transferred heat among the main typical surfaces inside the cylinder is described in this paper. The analysis was done on simplified 3D geometry including the movement of valves and remeshing through the simulation to guarantee mesh quality. Based on the results of numerical analysis a proposal to increase the accuracy of heat transfer prediction is suggested.
1. INTRODUCTION Superheating of a gas in reciprocating compressors causes a considerable decrease in the overall efficiency. Increase in the gas temperature is caused by heat transfer from the walls along the suction line and inside the cylinder from surrounding walls – piston, liner and cylinder head. As it was proved by Almbauer et al. (2010) and Morriesen and Pereira (2009), increase of the gas temperature before the beginning of the compression has critical impact on the volumetric efficiency of the compressor. In fact, increase in gas temperature by 1 °C at the beginning of compression causes decrease of efficiency around 0.3%. Moreover, there is a potential risk of ignition of a lubricating oil or rapid material degradation of compressor components. Therefore a good knowledge of heat transfer inside the compressor as well as a development of new materials could prevent the gas superheating and increase the overall compressor efficiency. This paper presents analysis of heat transfer inside the cylinder of reciprocating compressor using two different approaches and the results are used to propose an improvement of heat transfer correlation.
2. HEAT TRANSFER MODELS There are two mathematical approaches used to determine the heat flux. The first and simpler possibility is to use semi-empirical correlation usually based on non-dimensional numbers. The advantage of using this approach is low computational demand. Second option is more advanced numerical simulation. The results are more accurate, however the complexity of the CFD simulation together with high computational demands make it less convenient and useful. In the following chapters there is an overview of both approaches. Many authors used CFD to introduce new correlations, e.g. Disconzi et al.(2012) and Aigner and Steinrück (2007) as they have an important role in the compressor analysis. Many researches use integral correlation to describe heat flux from cylinder in thermal analysis of the whole compressor body. Balduzzi et al. (2014) used Annand (1963) correlation to describe heat flux from a compression chamber in his analysis of cylinder cooling. He employed 0d numerical model to obtain heat transfer coefficient and bulk temperature for compression chamber. Based on these results he carried out a CFD analysis of cooling system. Another thermal analysis was performed by Dutra and Deschamps (2013), who applied the model of Annand (1963) inside the cylinder of hermetic reciprocating compressor.

1108, Page 2
23rd International Compressor Engineering Conference at Purdue, July 11-14, 2016
As it was pointed out by Disconzi et al. (2012) and Tuhovcak et al. (2015), there are significant differences between the results of heat transfer correlations, which can lead to a drop in compressor efficiency. According to Adair (1972), due to the heat transfer correlations accuracy the compressor efficiency could be decreased by as much as three percent. Moreover, the volumetric efficiency could decrease by 10 – 20 percent due to heat transfer regardless on correlation. Some aspects affecting the heat transfer are neglected in this paper, especially oil film on the cylinder walls and heat generation caused by friction between piston and cylinder liner. These aspects are difficult to implement in current heat transfer modelling and will be examined in future works.
2.1 Integral correlations The literature survey shows that most of the heat transfer models for reciprocating compressors were developed for internal combustion engines, which have different operation conditions although the geometry could be similar. First attempts were done by Annand (1963) and Woschni (1967), later by Adair et al. (1972) and most recently by Disconzi et al. (2012) and Aigner and Steinrück (2007). The last two authors focused directly on reciprocating compressors. They used correlations based on non-dimensional Nusselt number and Reynolds number. The main differences between all the correlations are in coefficients a, b and c and also in the expression of characteristic velocity for Reynolds number, see the Table 1. Aigner in his correlation equation uses the Stanton number that can be directly related to the friction coefficient.
Re Prb cNu a= (1)
Reu D
ν= (2)
( )fSt f C= (3)
where D is the cylinder diameter, u is characteristic velocity and ν is kinematic viscosity of the gas.
Table 1: Empirical correlation for heat transfer prediction
Woschni 0.70.035ReNu = Reu D
ν=
6.618 pu u= ⋅ - opened valves
2.28 pu u= ⋅ - closed valves
Annand 0.7 0.70.7Re PrNu = Reu D
ν= pu
Adair 0.8 0.60.053Re PrNu =
Re eu D
ν= ,
6e
Cylinder volumeD
Cylinder area
⋅=
( ) 3 12 1.04 cos 2
2 2u ω α π α π= + < <
( )[ ] 1 31.04 cos 2
2 2u ω α π α π= + < <
Disconzi Compression
0.8 0.60.08Re PrNu = Reu D
ν= pu u=
Disconzi Discharge
0.8 0.60.08Re PrNu = Reu D
ν= ( )
0.8 0.2p p c tu u u u= +
Disconzi Expansion
0.8 0.60.12Re PrNu = Reu D
ν= pu u=
Disconzi Suction
0.9 0.60.08Re PrNu = Reu D
ν= ( )
0.4 1.4p p c tu u u u−= +
Aigner Re Prp
h NuSt
c uρ= =
2/32PrfC
St =
0.250.078Re
fC
−=
0.20.046 Re
fC
−=
where up is the mean piston speed, α is the crank angle and ω is the angular velocity of crankshaft. Adair was one of the first authors, who focused directly on reciprocating compressors. His correlation for heat transfer differs from other correlations mainly in characteristic diameter for Reynolds number and in calculation of

1108, Page 3
23rd International Compressor Engineering Conference at Purdue, July 11-14, 2016
characteristic gas velocity. He uses the variable equivalent diameter De, instead of cylinder diameter and the approximated swirl velocity with angular speed of a crankshaft, ω, which has a larger magnitude than linear speed of the piston. Disconzi et al. (2012) divided the whole process inside the cylinder into the four basic processes: suction, compression, discharge and expansion. For each of them she proposed a new correlation with different constants a, and exponents b and c in the general equation (1) for Nusselt number, see Table 1. Characteristic velocity is formed from the mean piston speed and the velocity of exchanging gas, equation (4).
( )
( )
t
cct
mu
Aρ=
⋅
ɺ
(4)
where ρ(t) is the density of gas in the cylinder and Ac is the cylinder cross-sectional area. The correlation was developed using a CFD simulation of simplified compressor geometry and verified for several working conditions. The approach of Aigner was later excluded from this work as it requires a deeper analysis of friction coefficient. One possibility to calculate Stanton number using skin friction coefficient Cf could be found in Bejan (2013), however even Aigner adjusted Stanton number according to CFD simulations. There are two formulas to calculate friction coefficient in Table 1. First one is for lower Reynolds number, second one for higher Reynolds number, which could be useful when compression/expansion process and suction discharge process are distinguished .
2.2 Numerical modelling of heat transfer Rakopoulos et al. (2010) examined and compared four commonly used heat transfer models in commercial CFD tools concluding that none of these models is capable of predicting heat transfer accurately for combustion engines. He also developed a new model which provided more acceptable results than the four previous ones. Nevertheless, this effort was done on combustion engines, which have different operating conditions compared to reciprocating compressors. Recent investigations in compressor field were done by Pereira et al. (2010), who studied heat transfer inside the cylinder using two dimensional model. The purpose was to compare results from CFD with integral correlation obtained from literature. Author uses RNG k-ε turbulence model and wall function based on Launder-Spalding within commercial CFD code Ansys FLUENT. His work shows that integral correlation predicts lower heat flux than CFD simulation. Later, Disconzi et al. (2011) found out that the use of Launder-Spalding wall function provides lower heat flux at cylinder walls compared to near-wall modelling approaches. In following work of Disconzi et al. (2012), enhanced wall treatment based on Kader (1981) was employed instead of Launder-Spalding. RNG k-ε turbulence model was used on simplified two dimensional geometry again. Based on the results, the author proposed new integral correlations for heat transfer, which have the main improvement in the characteristic velocity of Reynolds number. Most of the authors used only mean piston velocity, but Disconzi et al. (2012) takes into account also the flow through the valves, which considerably influences the flow field inside the cylinder. Most of the aforementioned works were focused either on combustion engines or refrigeration compressors. Literature survey shows only a few publications focused directly on air compressors. Regarding the CFD simulations with particular focus on heat transfer there is a work of Müllner and Bielmeier (2008), however he did not state exactly which type of compressor he used in his analysis. He also used a commercial CFD tool to investigate heat fluxes in the cylinder of compressor for different valve configurations. Another study of heat transfer was done by Aigner and Steinrück (2007), who used commercial CFD tool for a full three dimensional model in order to catch the heat flux inside the cylinder and he reconstructed it using non-dimensional Stanton numbers.
3. COMPRESSOR MODELS AND SIMULATION PROCEDURE
3.1 Matlab model The basis of the Matlab - 0D model is the energy balance over a control volume calculated using the 1st Law of Thermodynamics, equation (5). Both pressure and temperature are considered as uniform in the control volume, which is the whole volume of cylinder. The flow inside the control volume is neglected.
1108, Page 4
23rd International Compressor Engineering Conference at Purdue, July 11-14, 2016
i ii
dW dQ dm h dU+ + ⋅ =∑ (5)
where dQ stands for heat transfer from/to the cylinder, dmihi is inflow or outflow of gas through the valves, dU is the change of internal energy and dW is the piston work. Solution procedure of this equation is similar to the one presented by Farzaneh-Gord et al. (2014). Discrete values of temperature, pressure and the rest of the fluid properties are obtained by solving the differential equation (5) with the finite difference method for a given time-step as follows
( ) ( )1
1t S S D D t tt t
V mu Q m h m h p u
m t t+∆ ∆ = + − − − + ∆ ∆
ɺ ɺ ɺ (6)
Continuity equation is solved similarly
cyl
in out
dmm m
dt= −ɺ ɺ (7)
where min is the mass flow coming into the cylinder, mout is the flow escaping through the discharge valve and dmcyl is the change of mass inside the cylinder over a time step. The rest of the thermodynamic properties are obtained by employing the CoolProp library Bell et al. (2014). Valve behavior is the main factor affecting the mass flow coming into or out of the cylinder. A mathematical description of valve movement was introduced by Costagliola (1950) as a mass-spring system. This description uses the single degree of freedom equation (8) solved using the 4th order Runge-Kutta method. This approach assumes the valve to be a rigid object. i
i
m x d x k x F⋅ + ⋅ + ⋅ =∑ɺɺ ɺ (8)
where m is the mass of the valve, k is the spring stiffness and d is the damping constant. The exact values used in the presented work can be found in Table 2. Valve position, velocity and acceleration are expressed by x and its first and second derivative. A flow area, Sflow, is calculated from the valve geometry and substituted in Fliegner’s equation (9) to evaluate flow through a valve:
1 1
2 1 21
1 1 1
21
1i flow
p p pm S
p p
κκ κκζ ρ
κ ρ
− = ⋅ ⋅ ⋅ − −
ɺ (9)
The loss coefficient ζ is the function of valve position and must be determined experimentally or from the CFD simulations. This is one of the most important steps in the procedure, as this value cannot be subtracted from primary parameters of a compressor. The loss coefficient depends on valve geometry, type of fluid used in analysis and manifold geometry in front of and behind the valve. In this case we used CFD.
3.2 CFD model The majority of the previous studies using commercial CFD tools have been done in FLUENT using k-ε turbulence model. The results of present work were computed in Ansys CFX using SST k-ω turbulence model. The model includes automatic wall function for Near Wall Modelling and it is also recommended by Ansys for resolving details of boundary layer. This function switches automatically from wall-function to a low Reynolds near wall formulation as the mesh is refined. Advantage of this automatic wall function is lower sensitivity to mesh quality and therefore it should be useable for a wide interval of y+ (equation (10)). However, the grid should have y+ value around 1 for highly accurate simulations, such as heat transfer predictions,
fricu ny
v+ ⋅ ∆
= (10)
where Δn is the distance between the first and second grid points off the wall, ufric is the friction velocity and ν is kinematic viscosity.

1108, Page 5
23rd International Compressor Engineering Conference at Purdue, July 11-14, 2016
Thermal boundary layer is solved by Kader (1981) function, where temperature distribution is modeled by blending the viscous sublayer and the logarithmic law of the wall, eq. (11).
( )1
* *Pr 2.12 lnT y e y eβ−
+ −Γ Γ = + + (11)
( ) ( )21/33.85Pr 1.3 2.12ln Prβ = − + (12)
( )4*
3 *
0.01 Pr
1 5Pr
y
yΓ =
+ (13)
where y* is dimensionless coordinate.
3.3 Compressor specification The simplified geometry of compressor was used for simulation purposes. The three dimensional model of compressor was created in ANSYS Workbench 16.1, see the Figure 1.
Figure 1: Overview of compressor geometry
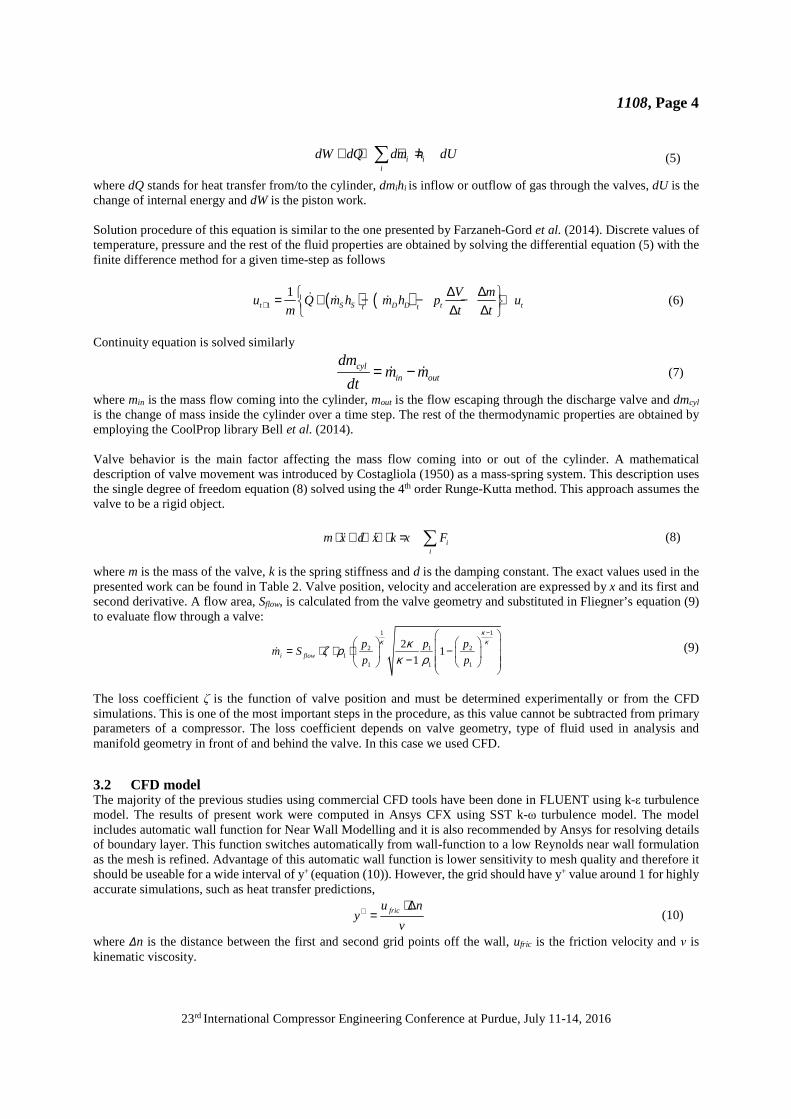
Simplifications were also made in the modelling of valves. They are simulated as rigid bodies without any deformation during the solution process. The valves are allowed to move only in Z axis. CFX has a feature which is used for this kind of a simulation – Rigid Body solver. Another challenging task for reciprocating compressor simulation is the conservation of acceptable mesh during the solution. The movement of piston stretches the cells during the solution, which can be in some cases acceptable deformation with no need to remesh the geometry. However, the valve movement causes strong deformation around the valve geometry, which could result in inaccurate results. Therefore, a remeshing method using ICEM was implemented in this case. After the signal from user expression, the solver stops the solution, sends the geometry with current valve position to ICEM, where the remeshing script is activated. The quality of cells can be seen in Figure 2, where the valve is in a different positions.
1108, Page 6
23rd International Compressor Engineering Conference at Purdue, July 11-14, 2016
Figure 2: Example of remeshing during the solution
Table 2: Compressor specification. Table 3: Boundary conditions used in the simulation tool.
Parameter Value Unit Boundary condition Value Unit
Cylinder bore 20 mm Suction pressure 1.00 bar
Stroke 20 mm Discharge pressure 10.0 bar
Rod length 55 mm Inlet temperature 300 K
Clearance 0.2 mm Wall temperature 363 K
Suction valve mass 1 g
Spring stiff. - suction 250 N
Discharge valve mass 0.1 g
Spring stiff. - discharge 300 N
3.4 Boundary conditions Temperature and pressure were prescribed for inlet and outlet boundary condition according to Table 3. The boundaries were set to an opening condition, which allows flow in both directions instead of simple inlet (or outlet) condition, which would allow no flow in opposite direction. The movement of the piston was prescribed by a user function based on crankshaft mechanism equation. The valves are solved as rigid bodies, as it was mentioned above. In addition, a symmetry condition was used to save the number of cells and the duration of calculation. Non-zero wall velocity component was prescribed for moving boundaries – piston and valves. During the suction and discharge processes the velocity component at wall refers to the movement of valve boundaries. The same applies for piston boundary for the entire simulation. Zero velocity component is defined for the rest of the boundaries. The simulation consisted of three cycles of the piston in order to provide enough time for flow development inside the cylinder. We used air in ideal gas model as a working fluid.
4. RESULTS Heat transfer changes its direction during the cycle of crankshaft depending on the gas temperature inside the cylinder. When the gas temperature is lower than the wall temperature, heat flux is positive, which means that the heat is transferred from the wall into the gas. When the compressed gas reaches the same temperature as the wall, heat flux is zero and after that it changes direction, meaning the heat is transferred from the gas into the wall. This change of direction occurs not just during the compression, but also during expansion process (Figure 3). The negative effect of heat transfer inside the cylinder is the superheating of the sucked gas, resulting in decrease of compressor efficiency. Magnitude of this decrease is mostly determined by the wall temperature, therefore it is desirable to calculate it

1108, Page 7
23rd International Compressor Engineering Conference at Purdue, July 11-14, 2016
correctly, especially when the transient simulation of compressor is the point of interest. Most of the previous models have used one correlation to predict the heat transfer inside the cylinder for all surfaces. A distribution of heat flux depends usually on the actual heat transfer area of the cylinder. The heat transfer area is constant for the piston and the cylinder head, but for cylinder wall it is based on the actual piston position. Another important phenomenon inside the cylinder, which influences the heat flux, is the fluid flow. High velocities close to the wall increase the heat transfer coefficient and consequently the heat flux, however this is included in simplified correlations for heat transfer. Therefore, a more detailed numerical tool was used to study the distribution of heat flux inside the cylinder. The simulation procedure started with the expansion process moving the piston from top dead center towards bottom dead center. When the pressure force acting on suction valve overcomes the spring force, suction process begins. Usually the suction process is ended when the piston is in its bottom dead center followed by the compression and discharge. Movement of the discharge valve is again controlled by pressure and spring force. A special care must be taken when the valves are opening and closing in numerical simulation. Keeping the mesh in the gap between the valve and the seat is fundamental for CFD simulation and therefore it is not possible to close/open valves continuously, but when the gap is less than 0.01 mm, suction or discharge process is terminated. Numerical simulation of heat transfer requires high quality mesh, especially close to the walls, where the heat transfer coefficient is calculated. The value of y+ should be kept around 1, however, when the fluid flow is not static, it is difficult to keep the high mesh quality and not to enormously increase the computational requirements. In this simulation the value of y+ was checked on each surface during the whole simulation and the average value was mostly below ten. Also the convergence of the momentum equations, continuity equation and energy equation did not overcome the 10-4 criteria. The analysis of Müllner and Bielmeier (2008) shows that most of the heat flows between the gas and piston (around 50 %), e.g. it is 35 % for cylinder head and less than 5 % goes into the cylinder wall. The rest of the heat is transferred in out-walls, which are walls around the valve. Similar results were obtained in this paper despite the fact that boundary conditions and settings were not described in Müllner and Bielmeier (2008). The results in Table 4 show the area integrated heat fluxes during one cycle of crankshaft.
Table 4: Percentage distribution of total heat flux from one cycle of crankshaft
piston wall head
full cycle 67 -4 37
If the compressor works in steady conditions, after a certain point the temperature of all walls should reach certain value, which depends on the heat flow inside the cylinder and outside as well. Heat flux distribution shows that these temperatures may not be equal. Nevertheless, the results in Table 4 take into account both positive and negative values of heat flux, which could bring some inaccuracy. The point of direction change is different for different boundary conditions. To overcome this problem, it is essential to divide the heat flux by the points of direction change. This approach makes it possible to understand the heat flux distribution during each phase of crankshaft cycle. Heat flux history through the one cycle of crankshaft for a simplified geometry is displayed in Figure 3. Suction process and discharge process are positive and negative, respectively. There is no change of heat flux direction. Another situation occurs for compression and expansion process, when the direction changes, hence the process was divided in two parts – positive and negative.

1108, Page 8
23rd International Compressor Engineering Conference at Purdue, July 11-14, 2016
Figure 3: Heat flux during one cycle of crankshaft
The results in Table 4 emphasize the importance of the surface of piston and cylinder head at the expense of cylinder wall surface. Yet the surface of cylinder wall is particularly important not just during the suction phase, but also during the compression. The reason of that is the largest heat transfer area. As the flow velocity increases around the valves, it brings more importance to cylinder head as well. When the heat flux direction is changed, the importance of cylinder wall decreases rapidly. The least heat is transferred through the cylinder wall during the expansion, which is expected as a consequence of piston motion. Cylinder head plays a stable part in heat flux distribution as the amount of transferred heat is always around 40 % except for positive compression. Heat flow through the piston wall contributes mostly during the discharge and expansion phase, when the velocities are considerably high in a region close to the piston surface. When the piston is moving towards bottom dead center, it has the biggest distance to the port of incoming gas. Moreover, it moves in the same direction as the incoming gas reducing the velocity of gas in a region close to the surface.
Figure 4: Velocity inside the cylinder (Crank A. 803°) Figure 5: Velocity inside the cylinder (Crank A. 775°) CFD analysis provides with more detailed flow field inside the cylinder including the velocity and temperature distribution, which helps to divide the heat flow more accurately among the surfaces. On the other hand, the computational cost is enormous, which is not convenient during the development process. Due to the complicated use of CFD, the objects of interest are simplified tools, such as the one presented in section 3.1. The results of complex analysis can be used in 0d model, which uses integral correlations to predict heat flux. However, it is distributed just according to the current heat transfer area. As the heat transfer area is the same for all the models, distribution of heat flux is consequently almost the same as well. The values used in Table 5 are the results of Disconzi correlation.
1108, Page 9
23rd International Compressor Engineering Conference at Purdue, July 11-14, 2016
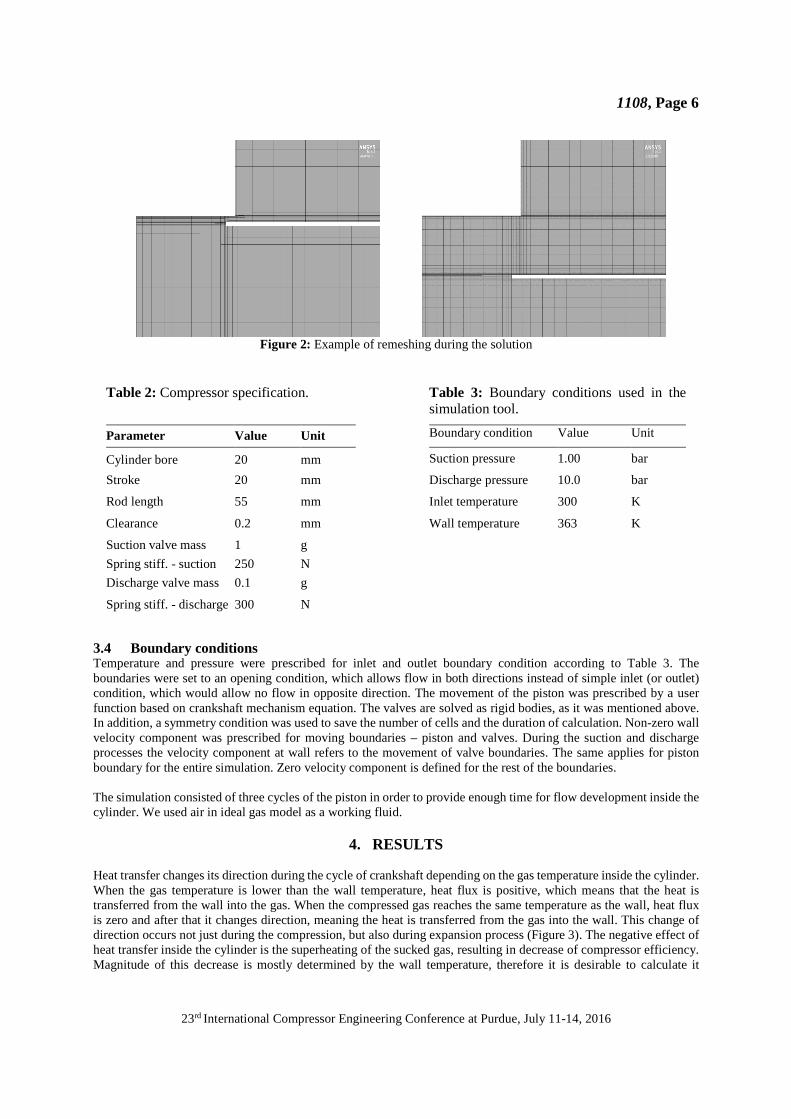
Table 5: Percentage distribution of heat flow among the surfaces from numerical simulation CFD simulation 0d simulation
piston wall head piston wall head
expansion
positive 56 6 38 46 13 41
negative 55 1 45 51 3 46
suction 17 44 40 17 69 15
compression
positive 8 73 19 10 80 9
negative 29 32 39 25 53 22
discharge 53 10 37 40 24 36
TOTAL + 19 43 39 16 69 15
TOTAL - 45 17 38 36 31 33
Good agreement was found for the piston surface, where the same trend can be observed – minor share on total heat flux during suction and compression and higher during discharge and expansion process. The heat flux through the cylinder wall is overestimated. The surface of cylinder wall does not play such an important role as it is predicted by 0d model, especially during the suction process. CFD predicts lower heat flux through the cylinder wall than 0d simulation and vice versa for cylinder head. During discharge process the heat flux from cylinder wall is higher again at the expense of the piston. All of this could be the consequence of high velocities of gas around the cylinder head and piston, which increase the heat flux on these surfaces. The comparison of results from the 0d model and the CFD analysis shows that one integral correlation for all surfaces inside the cylinder is not sufficient to properly describe distribution of heat flux. The same idea of using different correlation for each process of compressor was already applied by Disconzi et al. (2012), therefore it seems reasonable to use different correlation for each surface inside the cylinder as well. Usually there are three main surfaces, as it is displayed in the Figure 1. The surfaces of valves can be neglected as they are much smaller than other surfaces. Models mentioned in section 2.1 show important differences, as it was mentioned in Tuhovcak et al. (2015) and finding correct one is a difficult task. However, some correlations show better agreement with numerical simulations than others for particular surface. Therefore, the combination of well-known correlations could help to achieve higher accuracy in heat flux predictions for simplified models used for compressors. In the pictures below (Table 6), a comparison of particular correlations with CFD results can be found. The comparison is divided according to heat transfer areas – head, piston and wall and shows area integrated heat fluxes. Integral correlations offer only one calculation of heat transfer coefficient for all surfaces, therefore the curve produced by each correlation is the same for head, piston and wall. On the other hand, the results from numerical analysis show area integrated heat fluxes at each surface calculated from local heat transfer coefficient. Discontinuities occurring at curves from CFD are the consequence of remeshing and interpolation results from previous time step on new mesh. Even with more iteration within one time step they did not disappear. Most of the models underestimate the heat fluxes, especially during the suction phase and at cylinder head. The same problem occurs for the piston surface, only the model of Annand predicted results in reasonable agreement with CFD simulation. For the surface of cylinder wall, only the model of Disconzi shows a sufficient accuracy. The model of Adair predicts much lower heat flux for all surfaces, especially during the suction and discharge phase.

1108, Page 10
23rd International Compressor Engineering Conference at Purdue, July 11-14, 2016
Table 6: Comparison of heat flow for particular empirical correlations and numerical simulation
Head Piston Wall
Adair
Annand
Disconzi
Woschni
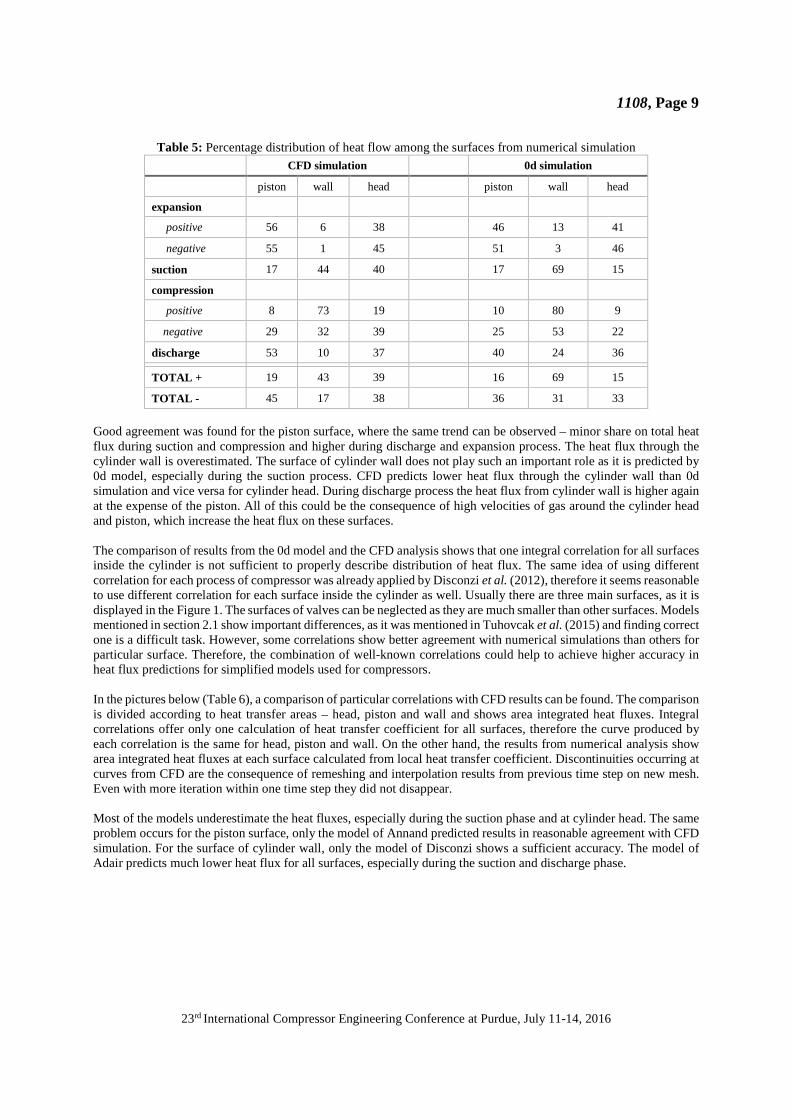
As it was mentioned before a combination of known models could help to increase the accuracy of heat flux prediction in simplified tools. Each process and surface would have its own correlation, based on the comparison with CFD numerical simulation. The combination of models based on presented results can be found in Table 7. On the left side there is a ratio of heat flux predicted by correlations and CFD. On the right side there are models which showed best agreement with CFD simulation. In most of the cases the models of Annand and Disconzi appear, however there is also contribution of Adair and Woschni. The results show a big difference between integral correlations and numerical model for heat transfer prediction in CFD. More investigation is necessary, especially in CFD, to perform simulation with higher accuracy. It must be pointed out, that all of the presented models were developed either for combustion engines (Woschni, Annand) or for refrigeration compressor (Disconzi, Adair). The compressor used in this paper was working with air, which could have influenced the results. Another important thing is the CFD simulation, particularly the simulation of heat transfer, which is very demanding on mesh quality close to heat transfer surface.
Adair Adair
Annand Annand Annand
Woschni Woschni Woschni
Adair
1108, Page 11
23rd International Compressor Engineering Conference at Purdue, July 11-14, 2016
Table 7: Heat flux ratio of empirical correlations and numerical simulation
piston wall head piston wall head
expansion expansion
positive 68 166 90 positive Annand Annand Annand
negative 99 134 110 negative Woschni Adair Woschni
suction 88 110 33 suction Annand Disconzi Annand
compression compression
positive 148 121 69 positive Disconzi Disconzi Woschni
negative 145 90 96 negative Annand Disconzi Annand
discharge 77 134 100 discharge Annand Disconzi Annand
5. CONCLUSION Heat transfer inside the cylinder effects the efficiency of compressor. Most of the simplified simulation tools use integral correlation to predict heat flux. This paper presented a comprehensive comparison of most common models with more complex numerical simulation, which includes also the solution of velocity field inside the cylinder. Velocity close to the heat transfer areas directly affects the heat transfer coefficient and consequently the heat flux. The compressor cylinder was divided into three main surfaces in order to see the distribution of transferred heat among them. The results show, that this distribution based just on the area of particular surface could decrease the accuracy. Solution of this problem can be found in different correlations for each surface in the cylinder and each process of the compressor (expansion, suction, compression and discharge). This would increase the number of equations for heat transfer prediction, however these equations are solved analytically and therefore, their computational costs are very low. More simulations are needed for verifying suggested combination of correlations, especially for different fluids and working conditions.
NOMENCLATURE Ac cross section of the cylinder [m2] Cf friction coefficient [-] D characteristic dimension [m] De equivalent diameter [m] d damping constant [-] F force acting on valve [N] h specific enthalpy [J/kg] k spring stiffness [N/m] m mass [kg] p pressure [Pa] Q heat transfer rate [J] S flow area [m2] u velocity [m/s] u specific internal energy in eq.6 [J/kg] uc velocity through the valve [m/s] ufric friction velocity [m/s] up mean piston velocity [m/s] U internal energy [J] V volume [m3]
1108, Page 12
23rd International Compressor Engineering Conference at Purdue, July 11-14, 2016
x valve position [m] y+ distance from the wall [-] y* dimensionless coordinate [-] w specific work [J/kg] W work [J] α crank angle [°] κ adiabatic exponent [-] ρ density [kg/m3] ζ loss coefficient [-] ν kinematic viscosity [m2/s] Subscript cyl cylinder
REFERENCES Aigner, R., & Steinrück, H. (2007). Modelling Fluid Dynamics , Heat Transfer and Valve Dynamics in a Reciprocating
Compressor. In 5th Conference of the EFRC (pp. 171–180). Almbauer, R., Lang, W., Nagy, D., & Berger, E. (2010). Application of Computational Fluid Dynamics for the
Thermodynamic Development of a New Generation of Hermetic Reciprocating Compressor. In International Compressor Engineering Conference (pp. 1–7).
Bejan, A. (2013). Convection heat transfer (4th ed.). New Jersey: John Wiley & Sons. Bell, I. H., Wronski, J., Quoilin, S., & Lemort, V. (2014). Pure and pseudo-pure fluid thermophysical property
evaluation and the open-source thermophysical property library coolprop. Industrial and Engineering Chemistry Research, 53(6), 2498–2508. doi:10.1021/ie4033999
Costagliola, M. (1950). The theory of spring-Loaded Valve for Reciprocating Compressor. Journal of Applied Mechanics, 17, 415–420.
Disconzi, F. P., Pereira, E. L. L., & Deschamps, C. J. (2012). Development of an In-Cylinder Heat Transfer Correlation for Reciprocating Compressors. In International Compressor Engineering Conference (pp. 1–10).
Farzaneh-Gord, M., Niazmand, A., Deymi-Dashtebayaz, M., & Rahbari, H. R. (2014). Thermodynamic analysis of natural gas reciprocating compressors based on real and ideal gas models. International Journal of Refrigeration. doi:10.1016/j.ijrefrig.2014.11.008
Kader, B. A. (1981). Temperature and concentration profiles in fully turbulen boundary layers. Int.J.Heat Mass Transfer, 24(9), 1541–1544.
Morriesen, A., & Pereira, E. L. L. (2009). Numerical Prediction of Superheating in the Suction. In 20th International Congress of Mechanical Engineering.
Müllner, T., & Bielmeier, O. (2008). Heat transfer in small piston compressors. In International Compressor Engineering Conference (pp. 1–8).
Tuhovcak, J., Hejcik, J., & Jicha, M. (2015). Modelling of fluid flow and heat transfer in a reciprocating compressor. In IOP Conference Series: Material Science and Engineering (Vol. 012018). doi:10.1088/1757-899X/90/1/012018
ACKNOWLEDGEMENT The presented research was supported by the Brno University of Technology project FSI-S-14-2355.