heat super final
TRANSCRIPT

8/3/2019 Heat Super Final
http://slidepdf.com/reader/full/heat-super-final 1/27
ABSTRACT
Generally, heat exchanger is classified according to the flow arrangement and the type of
construction. The simplest heat exchanger is one for which the hot and cold fluids move in
the same or opposite directions in a concentric tube or double- pipe construction. In the parallel- flow arrangement, the hot and cold fluids enter at the same end, flow in the same
direction, and leave at the same end. In the counter flow arrangement, the fluids enter at
opposite ends, flow in opposite directions, and leave at opposite ends.
Regarding to the experiment, the objectives are to determine the differences in
temperature between a parallel flow and a counter flow. Besides, it is also to determine the
most efficient of concentric heat exchanger in terms of flow arrangement which is either
parallel flow or counter-current flow. This experiment is based on transferring a heat at a
different temperature gradient with used concentric heat exchanger. The instrument was
attached with thermometers and flow rate meter in order to control and obtain the
temperatures of THin, THout, THmid, TCmid, TCin, and TCout and also the water flow rate (hot and
cold). The experiment is divided into 3 sections which are parallel and counter flow rate,
temperature varies and, and constant temperature with varies flow rate. Throughout the
experiment, it is found that counter flow is more efficient than parallel flow. For parallel
flow, the efficiency is at 99.81% while the overall heat transfer coefficient, U is 592.04
W/m2K at 60 °C and 704.57 W/m2K at 60 °C for counter flow rate. Meanwhile the efficiency
obtained is 99.83 %. Based on the experiment, the counter flow is more efficient than parallel
flow. Theoretically, the one should be more efficient is counter flow rather than parallel flow.
INTRODUCTION
1

8/3/2019 Heat Super Final
http://slidepdf.com/reader/full/heat-super-final 2/27
In general, heat exchangers are used to transfer heat from one fluid to another. It is important that
to understand the basic principles of the equipment and also know the mechanical components of
a heat exchanger in terms of on how they function and operate. Basically, a heat exchanger is a
component that allows the transfer of heat from one fluid (liquid or gas) to another fluid.
Reasons for heat transfer are to heat a cooler fluid by means of a hotter fluid, to reduce the
temperature of a hot fluid by means of a cooler fluid, to boil a liquid by means of a hotter fluid,
to condense a gaseous fluid by means of a cooler fluid, and to boil a liquid while condensing a
hotter gaseous fluid.
Several factors that must be considered in such to operate the equipment which is in order
to transfer heat, the fluids involved must be at different temperatures and they must come into
thermal contact. This is because heat can flow only from the hotter to the cooler fluid and in heat
exchanger there is no direct contact between the two fluids. Heat is being transferred from the
hot fluid to the metal isolating the two fluids and then to the cooler fluid and furthermore the
equipment has been specifically designed to operate the principles of industrial heat exchangers
in such a proper and most convenient way possible in the laboratory. Cold water supply was the
apparatus only required to operate this device. Single-phase electrical outlet and a bench top to
enable a series of simple measurements to be made by students needing an introduction to heat
exchanger design and operation. This kind of experiment can be done in short period, with
virtually no setting up operations, to accurately show the practical importance of the following
which are temperature profiles, Co-Current and counter-current flow, energy balances, long
mean temperature difference and heat transfer coefficients.
The equipment consists of insulated concentric tube exchanger with the temperature
devise are installed in both the inside and outside tubes in order to measure the fluid temperature
accurately. Hot water is fed through the inner pipe and with the cooling water in the outer
annulus in purposely to minimize losses in the system. To regulate the flow, control valves are
incorporated in each of the two streams and it can be measured using independent flow meter
installed in each line. The hot water system is very self-contained. A hot storage tank is equipped
with an immersion type heater and a adjustable temperature controller, which can maintain a
2

8/3/2019 Heat Super Final
http://slidepdf.com/reader/full/heat-super-final 3/27
temperature to with-in approximately 10°C. Pump was function to provide the circulation and
water returns to the storage tank via a baffle arrangement to ensure adequate mixing. A readily
identifiable valve arrangement allows simple changeover between co-current and counter-current
configurations.
OBJECTIVES
3
8/3/2019 Heat Super Final
http://slidepdf.com/reader/full/heat-super-final 4/27
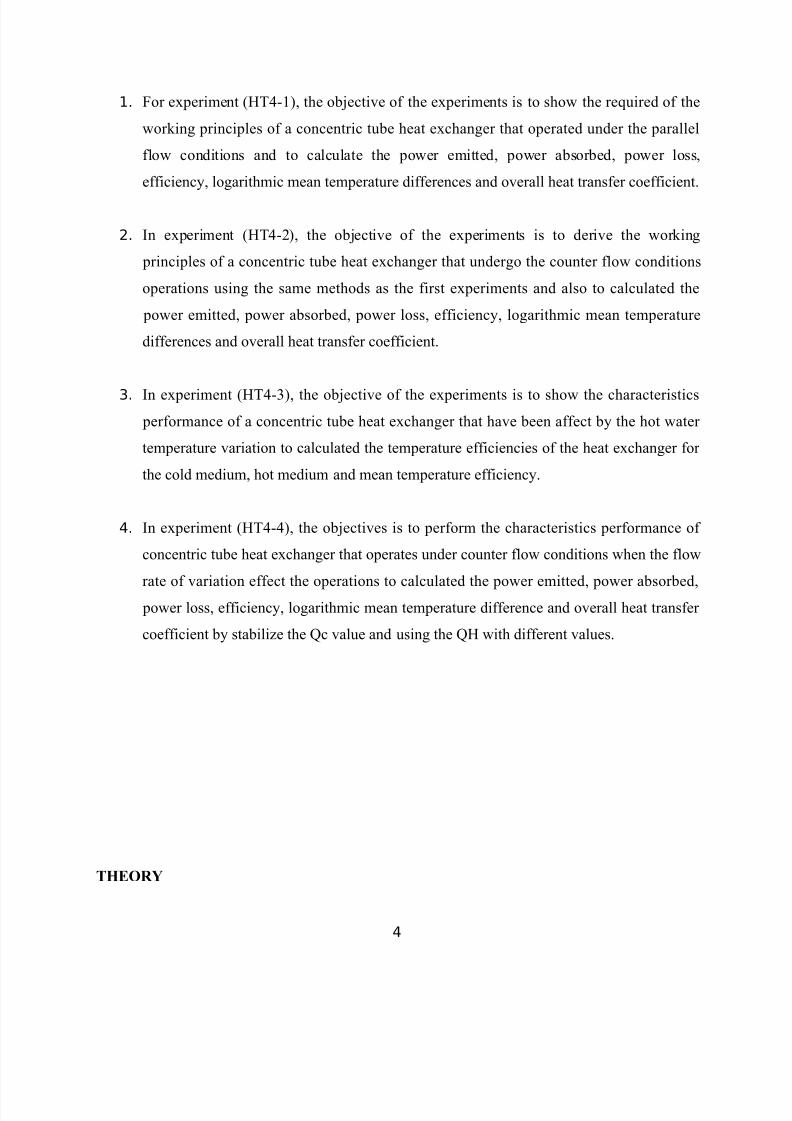
1. For experiment (HT4-1), the objective of the experiments is to show the required of the
working principles of a concentric tube heat exchanger that operated under the parallel
flow conditions and to calculate the power emitted, power absorbed, power loss,
efficiency, logarithmic mean temperature differences and overall heat transfer coefficient.
2. In experiment (HT4-2), the objective of the experiments is to derive the working
principles of a concentric tube heat exchanger that undergo the counter flow conditions
operations using the same methods as the first experiments and also to calculated the
power emitted, power absorbed, power loss, efficiency, logarithmic mean temperature
differences and overall heat transfer coefficient.
3. In experiment (HT4-3), the objective of the experiments is to show the characteristics
performance of a concentric tube heat exchanger that have been affect by the hot water
temperature variation to calculated the temperature efficiencies of the heat exchanger for
the cold medium, hot medium and mean temperature efficiency.
4. In experiment (HT4-4), the objectives is to perform the characteristics performance of
concentric tube heat exchanger that operates under counter flow conditions when the flow
rate of variation effect the operations to calculated the power emitted, power absorbed,
power loss, efficiency, logarithmic mean temperature difference and overall heat transfer
coefficient by stabilize the Qc value and using the QH with different values.
THEORY
4
8/3/2019 Heat Super Final
http://slidepdf.com/reader/full/heat-super-final 5/27
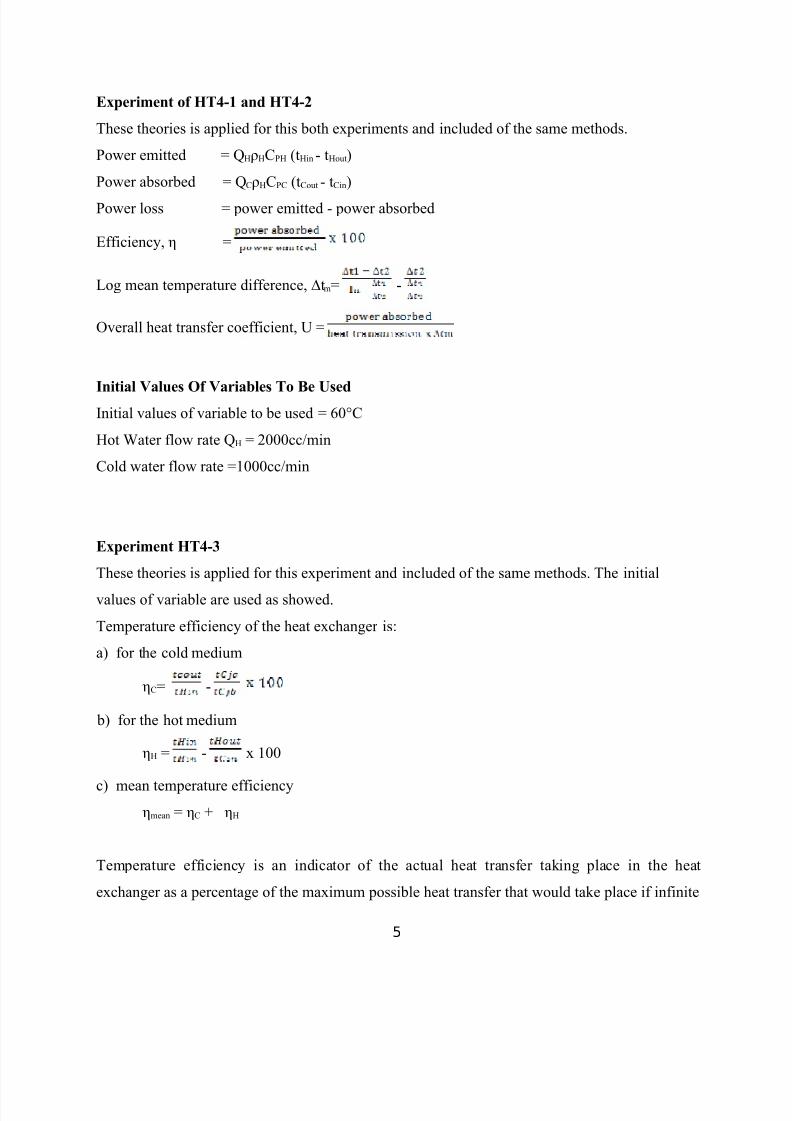
Experiment of HT4-1 and HT4-2
These theories is applied for this both experiments and included of the same methods.
Power emitted = QHρHCPH (tHin - tHout)
Power absorbed = QCρHCPC (tCout - tCin)
Power loss = power emitted - power absorbed
Efficiency, η =
Log mean temperature difference, ∆tm= -
Overall heat transfer coefficient, U =
Initial Values Of Variables To Be UsedInitial values of variable to be used = 60°C
Hot Water flow rate QH = 2000cc/min
Cold water flow rate =1000cc/min
Experiment HT4-3
These theories is applied for this experiment and included of the same methods. The initial
values of variable are used as showed.
Temperature efficiency of the heat exchanger is:
a) for the cold medium
ηC= -
b) for the hot medium
ηH = - x 100
c) mean temperature efficiency
ηmean = ηC + ηH
Temperature efficiency is an indicator of the actual heat transfer taking place in the heat
exchanger as a percentage of the maximum possible heat transfer that would take place if infinite
5

8/3/2019 Heat Super Final
http://slidepdf.com/reader/full/heat-super-final 6/27
surface area were available. When QH ρH CpH > QC ρC CpC.so (Thot- Tcold) + ∆ T will
coverge at the hot inlet end or if QC ρC CpC > QH ρH CpH,then ∆ T will converge at cold inlet
end.
Initial Values Of Of Variable To Be Used For HT4-3
Hot water flow rate QH = 2000cc/min
Cold water flow rate Qc = 2000cc/min
Experiment of HT4-4
These theory is applied for this both experiments and included of the same methods.
Power emitted = QHρHCPH (tHin - tHout)
Power absorbed = QCρHCPC (tCout - tCin)
Power loss = power emitted - power absorbed
Efficiency, η =
Log mean temperature difference, ∆tm= -
Overall heat transfer coefficient, U =
Initial Values Of Of Variable To Be Used For HT4-4
Controlled hot water temperature = 60°C
Cold water flow rate Qc = 2000cc/min
PROCEDURE
EXPERIMENT HT4-1
6
8/3/2019 Heat Super Final
http://slidepdf.com/reader/full/heat-super-final 7/27
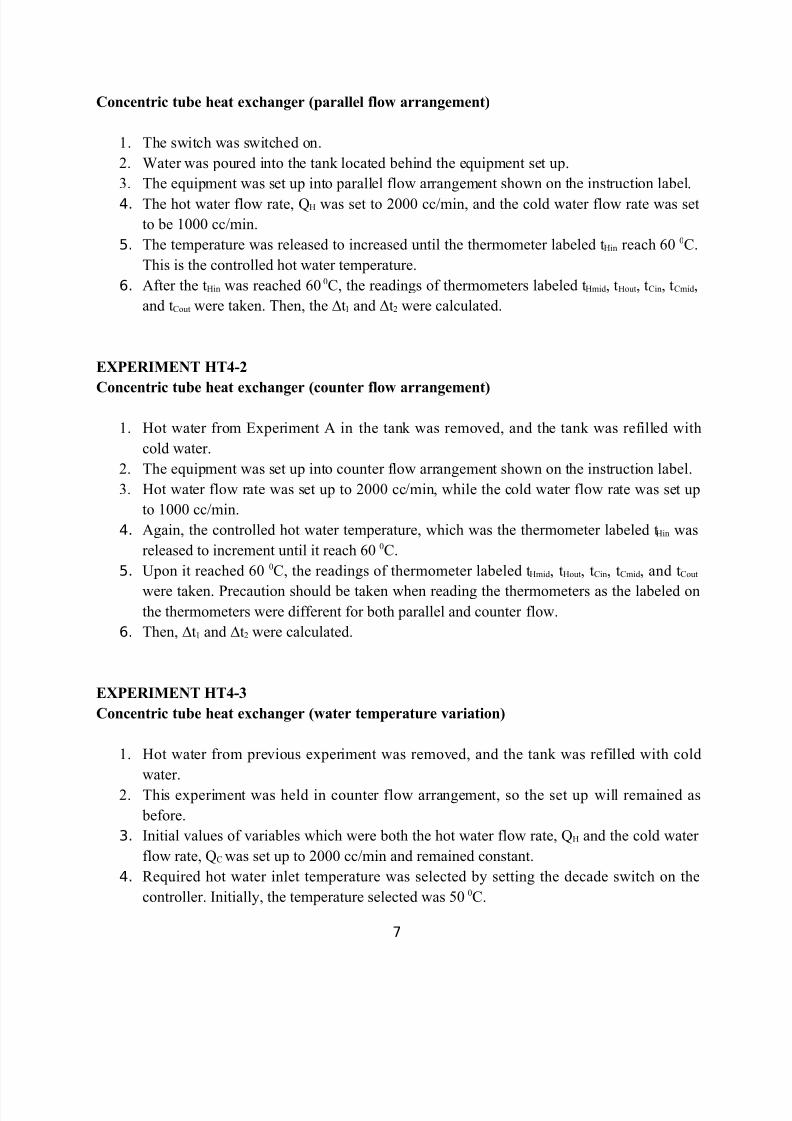
Concentric tube heat exchanger (parallel flow arrangement)
1. The switch was switched on.
2. Water was poured into the tank located behind the equipment set up.
3. The equipment was set up into parallel flow arrangement shown on the instruction label.
4. The hot water flow rate, QH was set to 2000 cc/min, and the cold water flow rate was set
to be 1000 cc/min.
5. The temperature was released to increased until the thermometer labeled t Hin reach 60 0C.
This is the controlled hot water temperature.
6. After the tHin was reached 60 0C, the readings of thermometers labeled tHmid, tHout, tCin, tCmid,
and tCout were taken. Then, the ∆t1 and ∆t2 were calculated.
EXPERIMENT HT4-2
Concentric tube heat exchanger (counter flow arrangement)
1. Hot water from Experiment A in the tank was removed, and the tank was refilled with
cold water.
2. The equipment was set up into counter flow arrangement shown on the instruction label.
3. Hot water flow rate was set up to 2000 cc/min, while the cold water flow rate was set up
to 1000 cc/min.
4. Again, the controlled hot water temperature, which was the thermometer labeled tHin was
released to increment until it reach 60 0C.
5. Upon it reached 60 0C, the readings of thermometer labeled tHmid, tHout, tCin, tCmid, and tCout
were taken. Precaution should be taken when reading the thermometers as the labeled onthe thermometers were different for both parallel and counter flow.
6. Then, ∆t1 and ∆t2 were calculated.
EXPERIMENT HT4-3
Concentric tube heat exchanger (water temperature variation)
1. Hot water from previous experiment was removed, and the tank was refilled with cold
water.
2. This experiment was held in counter flow arrangement, so the set up will remained as
before.
3. Initial values of variables which were both the hot water flow rate, Q H and the cold water
flow rate, QC was set up to 2000 cc/min and remained constant.
4. Required hot water inlet temperature was selected by setting the decade switch on the
controller. Initially, the temperature selected was 50 0C.
7

8/3/2019 Heat Super Final
http://slidepdf.com/reader/full/heat-super-final 8/27
5. The thermometer was observed until it reached 50 0C, and the readings of thermometer
labeled tHmid, tHout, tCin, tCmid, and tCout were taken.
6. Steps 3 until 5 were repeated with the ascending temperature of 10 0C for every readings
taken until it reaches the maximum temperature of 80 0C. Then, ∆t1 and ∆t2 for each set
were calculated.
EXPERIMENT HT4-4
Concentric tube heat exchanger (hot water flow rate variation)
1. The tank that was filled with hot water from the previous experiment was half emptied,
and refilled with cold water so that the temperature of tHin will not exceed the controlled
hot water temperature, which was 60 0C.
2. The set up was remained in counter flow arrangement.
3. The cold water flow rate, QC was set to remain at 2000 cc/min. On the other hand, hotwater flow rate, QH was set up to 1000 cc/min. This was the manipulative variable.
4. After the temperature tHin was released to reach 60 0C, the readings of thermometer
labeled tHmid, tHout, tCin, tCmid, and tCout were taken, and ∆t1 and ∆t2 were calculated.
5. The whole steps were repeated with the ascending of QH of 1000 cc/min for each set
readings until it reach 4000 cc/min.
CALCULATION
Experiment: HT4-1
Power emitted = QHρHCPH (tHin - tHout)
8

8/3/2019 Heat Super Final
http://slidepdf.com/reader/full/heat-super-final 9/27
= (2000 cm3/min) x (1 m3 / 1003 cm3) x (983 kg/m3) x (4.185kJ/Kg .K)
x (333-327) K x (1 min / 60 s)
= 823.0 W
Power absorbed = QCρHCPC (tCout - tCin)
= (1000 cm3/min) x (1 m3 / 1003 cm3) x (983 kg/m3) x (4.179 J/g .K)
x (314-302) K x (1 min / 60 s)
= 821.5 W
Power loss = power emitted - power absorbed
= (823.0-821.5) W
= 1.5 W
Efficiency, η = Power absorbed × 100
Power emitted
= (821.5/823.0) W x 100 %
= 99.81%
Log mean temperature difference, ∆tm = ∆t1 - ∆t2
Ln(∆t1/∆t2)
∆t1 = tHin - tCin
= (333 - 294) K
= 31K
∆t2 = tHout - tCout
= (326 - 313) K
= 13K
Log mean temperature difference, ∆tm = (31 – 13) / ln (31/13)
= 20.71 °C
Overall heat transfer coefficient, U = Power Absorbed
Heat transmission x ∆tm
= 821.5 W / (0.067 m2 x 20.71°C)
= 592.04 W/m2°C
9

8/3/2019 Heat Super Final
http://slidepdf.com/reader/full/heat-super-final 10/27
Experiment: HT4-2
Power emitted = QHρHCPH (tHin - tHout)
= (2000 cm3/min) x (1 m3 / 1003 cm3) x (983 kg/m3) x (4.185 J/g .K)
x (333-326) K x (1 min / 60 s)
= 959.89 W
Power absorbed = QCρHCPC (tCout - tCin)
= (1000 cm3/min) x (1 m3 / 1003 cm3) x (983 kg/m3) x (4.178 J/g .K)
x (316-302) K x (1 min / 60 s)
= 958.29 W
Power loss = power emitted - power absorbed
= (959.89 – 958.29) W
= 1.6 W
Efficiency, η = Power absorbed × 100
Power emitted
= (958.29 / 959.89) W x 100 %
= 99.83 %
Log mean temperature difference, ∆tm = ∆t1 - ∆t2
Ln(∆t1/∆t2)
∆t1 = tHin - tCout
= (333 - 316) K
= 17K
∆t2 = tHout - tCin
= (326-302) K
= 24 K
Log mean temperature difference, ∆tm = (17-24) / ln (17/24)
10

8/3/2019 Heat Super Final
http://slidepdf.com/reader/full/heat-super-final 11/27
= 20.3°C
Overall heat transfer coefficient, U = Power Absorbed
Heat transmission x ∆tm
=958.29 W / (0.067 m2 x 20.3 °C)
= 704.57 W/m2.°C
Experiment: HT4-3
Calculation for 50˚C
Power emitted = QHρHCPH (tHin - tHout)
= (2000 cm3/min) x (1 m3 / 1003 cm3) x (983 kg/m3) x (4.185 J/g .K)
x (323-317) K x (1 min / 60 s)
= 822.2 W
Power absorbed = QCρHCPC (tCout - tCin)
= (2000 cm3/min) x (1 m3 / 1003 cm3) x (983 kg/m3) x (4.177 J/g .K)
x (308-302) K x (1 min / 60 s)
= 821.4 W
Power loss = power emitted - power absorbed
= (822.2-821.4) W
= 0.8 W
Efficiency, η = Power absorbed × 100
Power emitted
= (821.4/822.2) W x 100 %
= 99.90 %
Log mean temperature difference, ∆tm = ∆t1 - ∆t2
Ln(∆t1/∆t2)
11

8/3/2019 Heat Super Final
http://slidepdf.com/reader/full/heat-super-final 12/27
∆t1 = tHin - tCout
= (323 - 308) K
= 14 K
∆t2 = tHout - tCin
= (317 - 30) K
= 15 K
Log mean temperature difference, ∆tm = (14 – 15) / ln (14/15)
= 14.5°C
Overall heat transfer coefficient, U = Power Absorbed
Heat transmission x ∆tm
= 821.4 W / (0.067 m2 x 14.5°C)
= 845.5 W/m2°C
Temperature efficiencies of the heat exchanger are:
a) for the cold medium
ηC = (tCout - tCin / tHin - tCin ) x 100
= 308-302 x 100
323-302
= 28.57
b) for the hot medium
ηH = (tHin - tHout / tHin - tCin) x 100
= 323-317 x 100
323-302
= 28.57
c) mean temperature efficiency
ηmean = ηC + ηH
= 28.57 + 28.57
= 57.14
12
8/3/2019 Heat Super Final
http://slidepdf.com/reader/full/heat-super-final 13/27
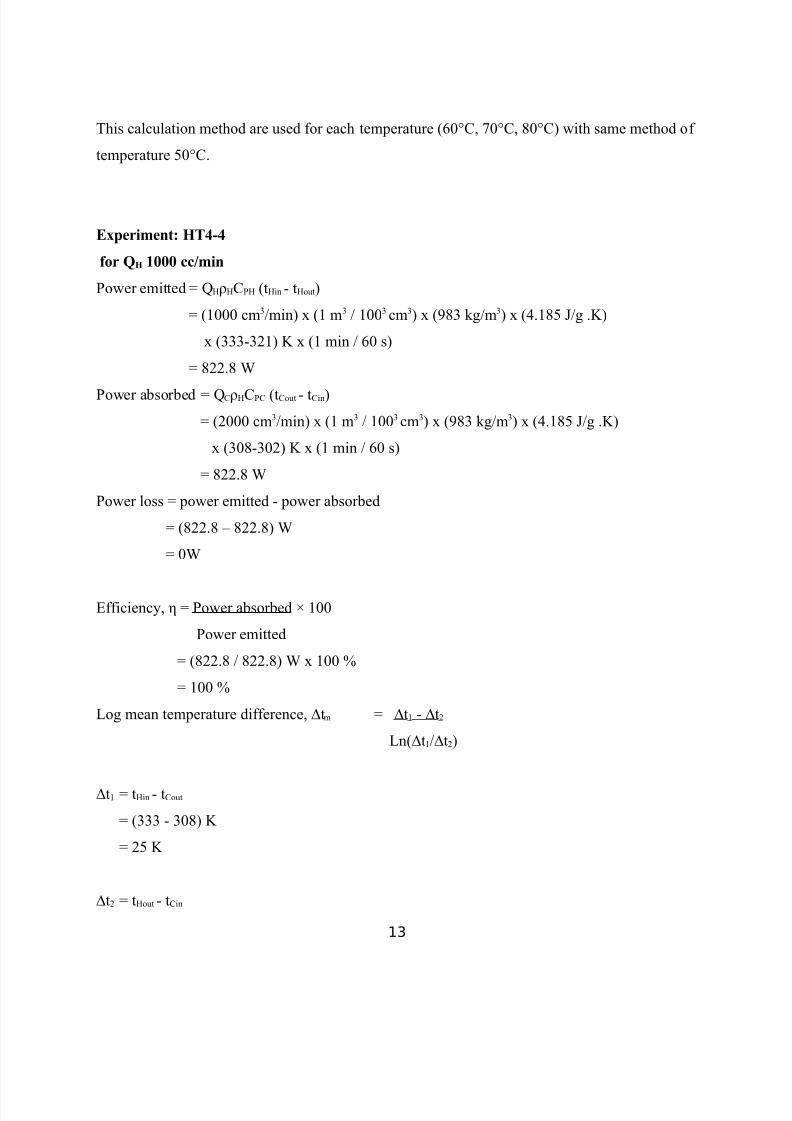
This calculation method are used for each temperature (60°C, 70°C, 80°C) with same method of
temperature 50°C.
Experiment: HT4-4
for QH 1000 cc/min
Power emitted = QHρHCPH (tHin - tHout)
= (1000 cm3/min) x (1 m3 / 1003 cm3) x (983 kg/m3) x (4.185 J/g .K)
x (333-321) K x (1 min / 60 s)
= 822.8 W
Power absorbed = QCρHCPC (tCout - tCin)
= (2000 cm3/min) x (1 m3 / 1003 cm3) x (983 kg/m3) x (4.185 J/g .K)
x (308-302) K x (1 min / 60 s)
= 822.8 W
Power loss = power emitted - power absorbed
= (822.8 – 822.8) W
= 0W
Efficiency, η = Power absorbed × 100
Power emitted
= (822.8 / 822.8) W x 100 %
= 100 %
Log mean temperature difference, ∆tm = ∆t1 - ∆t2
Ln(∆t1/∆t2)
∆t1 = tHin - tCout
= (333 - 308) K
= 25 K
∆t2 = tHout - tCin
13

8/3/2019 Heat Super Final
http://slidepdf.com/reader/full/heat-super-final 14/27
= (321 - 308) K
= 19 K
Log mean temperature difference, ∆tm = (25 - 19) / ln (25/19)
= 21.9 °C
Overall heat transfer coefficient, U = Power Absorbed
Heat transmission x ∆tm
= 822.8 W / (0.067 m2 x 21.9 °C)
= 560.8 W/m2°C
This calculation method are used for each hot water flow rate (2000 cc/min, 3000 cc/min, 4000
cc/min)
RESULTS
Parallel Flow
Controlled Hot water Temperature = 60ºC
Hot Water Flow rate = 2000 cc/minCold Water Flow rate = 1000 cc/min
tH in tHmid (ºC) tHout (ºC) tCin (ºC) tCmid (ºC) tCout (ºC)
60 57 54 29 34 410
39 13
14

8/3/2019 Heat Super Final
http://slidepdf.com/reader/full/heat-super-final 15/27
∆ t1
(31ºC)
∆ t2
(13ºC)
Power
emitted,W
Power
absorbed, W
Power lost, W Efficiency % ∆ tm
(ºC)
U
W/m2
(ºC)
823 821.5 1.5 99.81 20.71 592.04
Figure 1a : Graph of Temperature for Parallel Arrangement
Counter Flow
Controlled Hot water Temperature = 60ºC
Hot Water Flow rate = 2000 cc/min
Cold Water Flow rate = 1000 cc/min
tHin (ºC) tHmid (ºC) tHout (ºC) tCin (ºC) tCmid (ºC) tCout (ºC)
60 57 53 29 33 43
∆ t1
(ºC)
∆ t2
(ºC)
17 24
15
∆ t1
∆ t2

8/3/2019 Heat Super Final
http://slidepdf.com/reader/full/heat-super-final 16/27
Power emitted,
W
Power
absorbed, W
Power lost, W Efficiency % ∆ tm
(ºC)
U
W/m2 (ºC)
959.89 958.29 1.6 99.83 20.3 99.83
Figure 1b: Graph of Temperature for Counter Arrangement
Water Temperature Variation
Hot water flow rate QH = 2000 cc/min
Cold water flow rate QC = 2000 cc/min
Con Set
ºC
tHin
(ºC)
tHmid
(ºC)
tHout
(ºC)
tCin
(ºC)
tCmid
(ºC)
tCout
(ºC)
50 50 47 44 29 30 35
60 60 55 50 29 32 38
70 70 64 57 30 34 41
73 73 72 60 30 34 43
∆ t1
(ºC)
∆ t2
(ºC)
14 15
22 18
29 27
16
∆ t1
∆ t2
8/3/2019 Heat Super Final
http://slidepdf.com/reader/full/heat-super-final 17/27
30 29
Con Set
ºC
Power
emitted,
W
Power
absorbed,
W
Power
lost, W
Efficiency % ∆ tm
(ºC)
U
W/m20 (ºC)
N
C
N
H
ŋmean
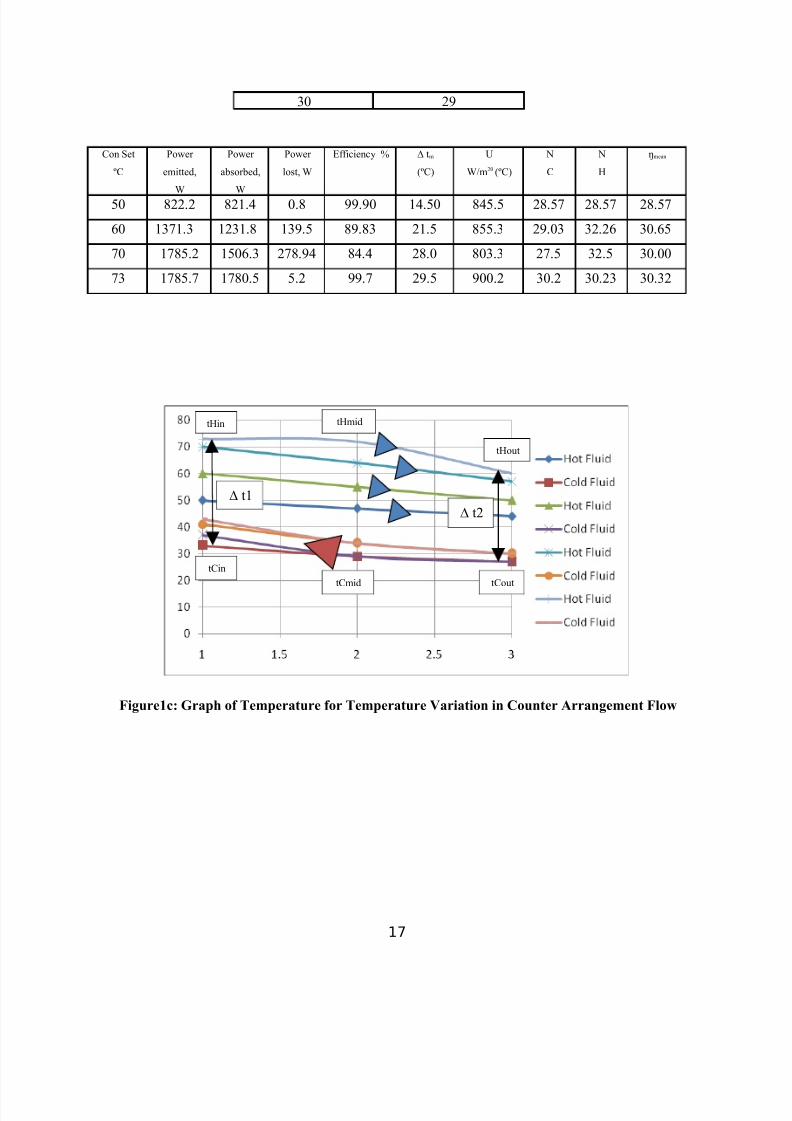
50 822.2 821.4 0.8 99.90 14.50 845.5 28.57 28.57 28.57
60 1371.3 1231.8 139.5 89.83 21.5 855.3 29.03 32.26 30.65
70 1785.2 1506.3 278.94 84.4 28.0 803.3 27.5 32.5 30.00
73 1785.7 1780.5 5.2 99.7 29.5 900.2 30.2 30.23 30.32
Figure1c: Graph of Temperature for Temperature Variation in Counter Arrangement Flow
17
∆ t1
∆ t2
tHin
tCin
tHout
tCout
tHmid
tCmid

8/3/2019 Heat Super Final
http://slidepdf.com/reader/full/heat-super-final 18/27
Flow rate Variation
Controlled hot water temperature = 60ºC
Cold water flow rate QC = 2000 cc/min
QH
Cc/min
tHin
(ºC)
tHmid
(ºC)
tHout
(ºC)
tCin
(ºC)
tCmid
(ºC)
tCout
(ºC)
1000 60 53 48 29 30 35
2000 60 51 50 29 31 38
3000 60 57 53 29 32 394000 60 57 54 29 33 40
∆ t1
(ºC)
∆ t2
(ºC)
31 13
31 12
31 14
31 14
QH
cc/min
Power
emitted,
W
Power
absorbed, W
Power lost,
W
Efficiency % ∆ tm
(ºC)
U
W/m20
(ºC)
1000 822.8 822.8 0.0 100.00 21.9 560.8
2000 1371.3 1234.2 137.1 90.00 20.2 920.2
3000 1439.8 1371.3 68.50 95.20 21.4 957.0
18
8/3/2019 Heat Super Final
http://slidepdf.com/reader/full/heat-super-final 19/27
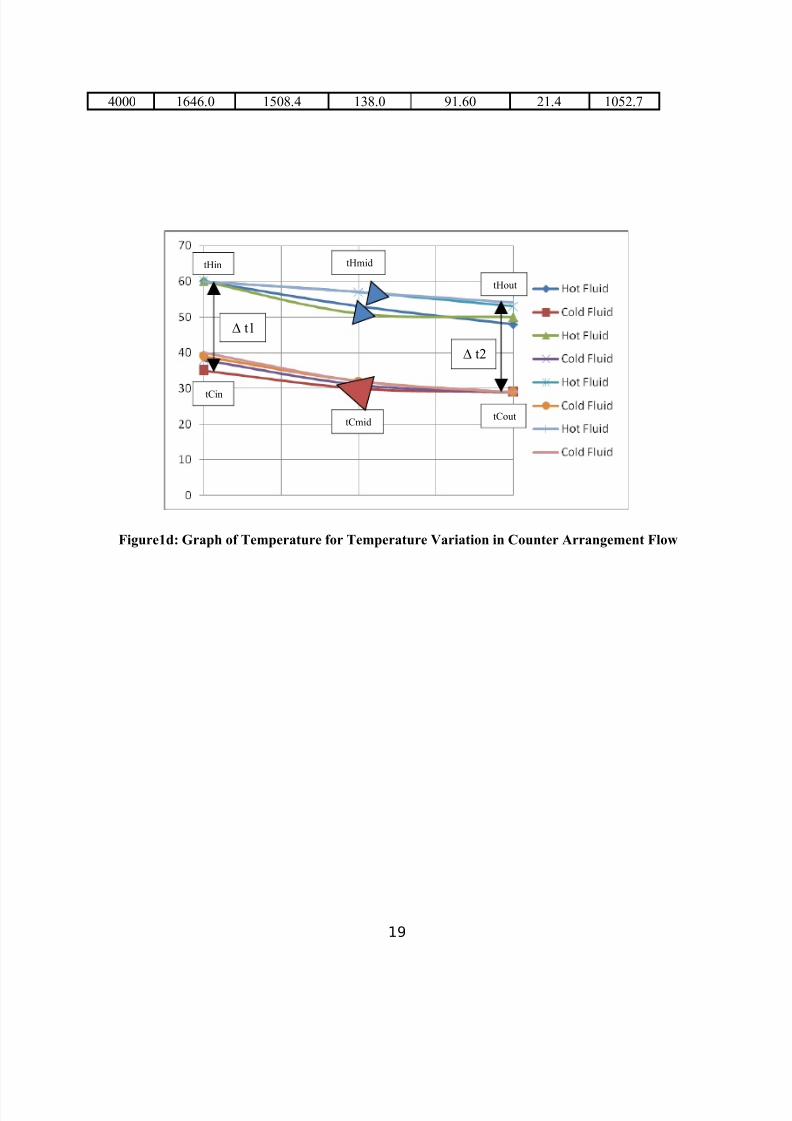
4000 1646.0 1508.4 138.0 91.60 21.4 1052.7
Figure1d: Graph of Temperature for Temperature Variation in Counter Arrangement Flow
19
tHin
tCin
∆ t1
tHmid
tCmid
∆ t2
tHout
tCout

8/3/2019 Heat Super Final
http://slidepdf.com/reader/full/heat-super-final 20/27
DISCUSSION
A heat exchanger is a device that efficiently transfers heat from a warmer fluid to a colder fluid.
A device which is probably all familiar with is the automobile radiator. Other applications for
heat exchanger are found in heating and air conditioning systems. All the equipment of
concentric tube heat exchanger is insulated. The hot water is fed through the inner pipe with the
cooling water in the outer annulus in order to minimize looses in the system.
For Experiment HT4-1, the tH out temperature decrease with time after hot water
temperature enter the tube but cold water out increase after the flow circulated. This happens
because of the parallel flow arrangement, where the cold and hot fluid was flow in the same
direction. The value of power absorbed is positive which means the power is being absorbing
and the efficiency became 99.81%. Efficiency value which obtained was influenced indirectly by
the power emitted from the heat transfer system where the value was higher at power emitted
rather than at power absorbed. Generally, cold water receives heat from hot water, so this
temperature and the values are possible.
A bit different in experiment HT4-2 because hot fluids flows in opposite direction to cold
one. Due to that, data obtained was different in terms of overall heat transfer coefficient same
goes with the value of efficiency. For counter flow, efficiency obtained is 99.83% which higher
than parallel flow with difference at 0.02%. However it is impossible for heat exchanger to work
at greater 100% efficiency because there are other factors that decrease efficiency such as fiction
of water inside the tube. This condition makes the amount of the heat transferred is higher
because in this case the opposite direction turn the outlet temperature of the cold fluid which may
exceed the outlet temperature of the hot fluid. We gained the value of power absorbed is positive
which means the power is being absorbing but not releasing it throughout the heat exchange
process.
20

8/3/2019 Heat Super Final
http://slidepdf.com/reader/full/heat-super-final 21/27
In experiment HT4-3, the objective of experiment is to demonstrate the effect of the hot
water temperature variation on the performance characteristics of a concentric tube heat
exchanger. The experiment being tested by different hot fluid temperatures inlet and using the
counter flow condition and the QC value has changed to 2000 cc/min. This condition will affect
the cold water temperature in inlet to remain the same because less heat transferred between the
two same flow rate of hot and cold water. As the experiment goes along from 70 oC to 80oC, it is
more difficult to see the temperature rises to 80oC because of the low efficiency of the heat
exchanger itself and low power of heating element.
For experiment HT4-4, it is required to control the hot water temperature as 60ºC with
2000 cc/min QC but change the QH value accordingly. Based on the calculated values, values of
power emitted and power absorbed increased with the QH. As the increase of QH it will contribute
the increasing of tHout and tCout because at that point water is absorbing the heat. Therefore,
supposedly the efficiency is declined through the QH variables because at high flow rates will
reduce the contact time for the hot and cold fluid to transfer the heat.
21
8/3/2019 Heat Super Final
http://slidepdf.com/reader/full/heat-super-final 22/27
CONCLUSION
Based on the Experiment HT4-1 and Experiment HT4-2 was conducted in order to
determine the most efficiency either counter or parallel. Parallel flow efficiency is 99.81 %,
power emitted is 823 W and power absorbed value is 821.5 W. The efficiency of counter flow is
99.83 % which is quite higher and more efficient rather than parallel flow. This proven from
theory which stated that counter flow is more efficient compared to parallel flow. For experiment
HT4-3, result obtained shown that when the input temperature rises contribute to rise of output
temperature though. As the temperature was set to 80 oC, it is difficult reach that temperature for
some reasons which are scaling in the pipeline and low efficiency of the heater element.
For experiment HT4-4, various of hot water flow rates being experimented and the results
obtained shown that when the value of hot water flow rate (Q H) is higher than the value of cold
water flow rate (QC), therefore the efficiency of the hot water flow rate is much higher than the
cold water flow rate. High flow rates of hot water inlet resulted of limited contact time with the
cold water. Fluctuate of the efficiency value may cause of unsuccessful result which may cause
by of some reasons which are parallax error while taking the reading of the temperatures, delay
in taking the reading, and also caused by the low power equipment used
22

8/3/2019 Heat Super Final
http://slidepdf.com/reader/full/heat-super-final 23/27
RECOMMENDATION
1. The eye position should be perpendicular to the meniscus and the scale and do a checking
of the heater either it is in good condition and no scaling as it can influence the result.
2. Avoid direct contact with water because it is hot also reducing taking off the cover of the
water tank because water losses might happen due to the water evaporated in the tank and
it will affect the result
3. Avoid of any leakage of the instrument, the instrument should be working properly
4. Monitor the temperature during experiment to make sure it is constant
5. Monitor the flow rates during experiment to make sure that the flow rate remains
constant.
6. Repeat the experiment at least 3 times to get accurate values and to make comparisons
23

8/3/2019 Heat Super Final
http://slidepdf.com/reader/full/heat-super-final 24/27
REFERENCES
1. Heat exchanger theory. (2001).Retrieved March 1,2011,from
http://en.wikipedia.org/wiki/Heat_exchanger
2. History of heat exchanger.(2000).Retrieved Feb 28, 2011,from
http://www.engineeredge.com/heat_exchanger/general.htm
3. Equipment for engineering education,concentric tube heat exchanger.(2004).Retrived
Feb 28 2011 from
http://www.fs.vsb.cz/books/GUNT/html/p3452.htm
4. Abd.Jamil.Lam (2009) Lab Manual. Concentric tube heat exchanger. Retrieved March
3,2011
5. Yunus A.Cengel (2006) Heat and Mass Transfer. Analysis of heat exchanger. Retrieved
March 8,2010.
24

8/3/2019 Heat Super Final
http://slidepdf.com/reader/full/heat-super-final 25/27
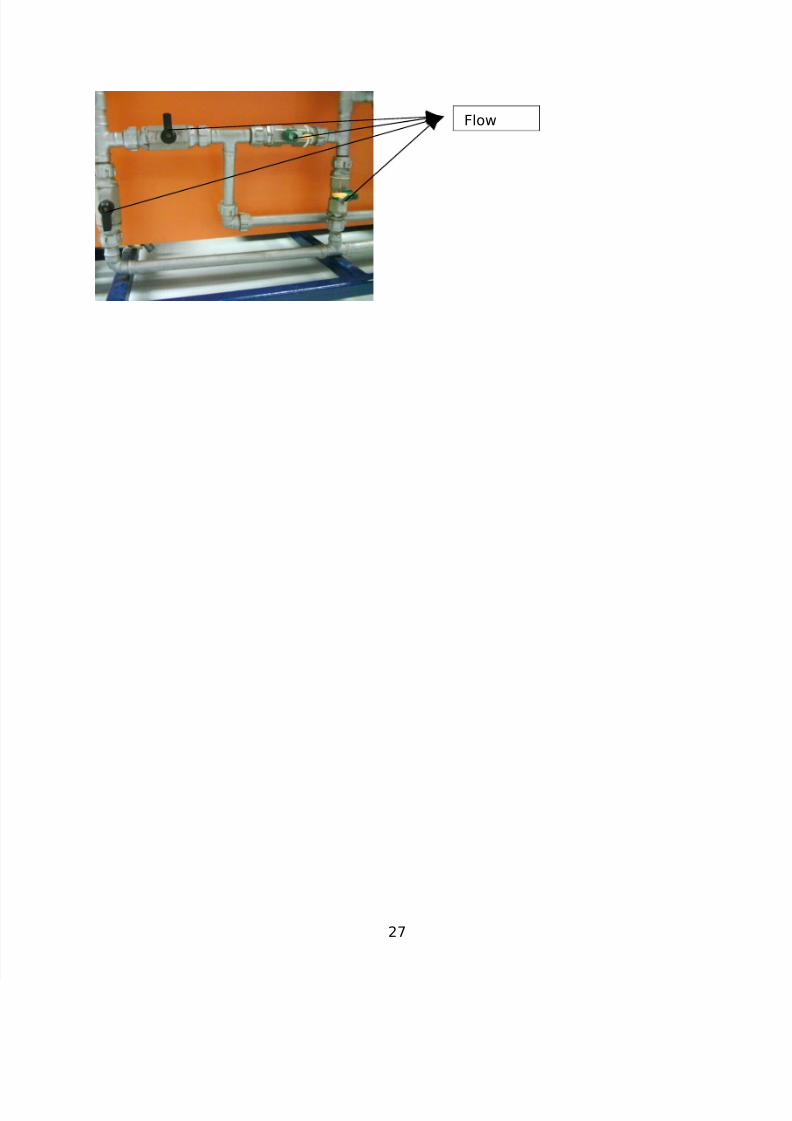
APPENDICES
The Diagram of Heat Exchanger
25
tHin
tCin
tCout
tHout
tHmid
tCmid

8/3/2019 Heat Super Final
http://slidepdf.com/reader/full/heat-super-final 26/27
26
Tan
Pum
Flow
8/3/2019 Heat Super Final
http://slidepdf.com/reader/full/heat-super-final 27/27
27
Flow