heard it through the grapevine: direct and network effects
TRANSCRIPT

NBER WORKING PAPER SERIES
HEARD IT THROUGH THE GRAPEVINE:DIRECT AND NETWORK EFFECTS OF A TAX ENFORCEMENT FIELD EXPERIMENT
William C. BoningJohn Guyton
Ronald H. Hodge, IIJoel SlemrodUgo Troiano
Working Paper 24305http://www.nber.org/papers/w24305
NATIONAL BUREAU OF ECONOMIC RESEARCH1050 Massachusetts Avenue
Cambridge, MA 02138February 2018
We have benefitted from conversations with Zachary Liscow, Michael Lovenheim, Christian Traxler, and Danny Yagan, and, regarding the data and IRS enforcement processes, with Brian Best, Jeff Butler, Patrick Langetieg, Juan Mendez, Stacy Orlett, and Alex Turk. We also thank Barry Johnson, Michael Weber, and Alicia Miller for facilitating this project through the Joint Statistical Research Program of the Statistics of Income Division of the United States Internal Revenue Service. Boning acknowledges support by the National Science Foundation Graduate Research Fellowship Program under Grant No. DGE 1256260. Slemrod is an IRS employee without pay under an agreement made possible by the Intragovernmental Personnel Act of 1970 (5 U.S.C. 3371-3376). Any opinions and conclusions expressed herein are those of the authors and do not necessarily represent the views of the Internal Revenue Service or the National Science Foundation. All results have been reviewed to ensure that no confidential information is disclosed. All data work for this project involving confidential taxpayer information was done at IRS facilities, on IRS computers, by IRS employees, and at no time was confidential taxpayer data ever outside of the IRS computing environment. The views expressed herein are those of the authors and do not necessarily reflect the views of the National Bureau of Economic Research.
NBER working papers are circulated for discussion and comment purposes. They have not been peer-reviewed or been subject to the review by the NBER Board of Directors that accompanies official NBER publications.
© 2018 by William C. Boning, John Guyton, Ronald H. Hodge, II, Joel Slemrod, and Ugo Troiano. All rights reserved. Short sections of text, not to exceed two paragraphs, may be quoted without explicit permission provided that full credit, including © notice, is given to the source.
Heard it Through the Grapevine: Direct and Network Effects of a Tax Enforcement FieldExperimentWilliam C. Boning, John Guyton, Ronald H. Hodge, II, Joel Slemrod, and Ugo TroianoNBER Working Paper No. 24305February 2018JEL No. C93,H26,L14
ABSTRACT
Tax enforcement may affect both the behavior of those directly treated and of some taxpayers not directly treated but linked via a network to those who are treated. A large-scale randomized field experiment enables us to examine both the direct and network effects of letters and in-person visits on withheld income and payroll tax remittances by at-risk firms. Visited firms remit substantially more tax. Their tax preparers’ other clients also remit slightly more tax, while their subsidiaries remit slightly less. Letters have a much smaller direct effect and no network effects, yet may improve compliance at lower cost.
William C. BoningUniversity of Michigan Department of Economics611 Tappan AveAnn Arbor, MI 48109 [email protected]
John GuytonInternal Revenue ServiceResearch, Applied Analytics, and Statistics77 K Street, NEWashington, DC [email protected]
Ronald H. Hodge, IIInternal Revenue ServiceResearch, Applied Analytics, and Statistics77 K Street, NEWashington, DC [email protected]
Joel SlemrodUniversity of Michigan701 Tappan StreetRoom R5396Ann Arbor, MI 48109-1234and [email protected]
Ugo TroianoDepartment of EconomicsUniversity of Michigan611 Tappan Street, Lorch Hall 219Ann Arbor, MI 48109and [email protected]
An online appendix is available at http://www.nber.org/data-appendix/w24305

3
In the canonical Allingham and Sandmo (1972) model of tax evasion, increased
enforcement reduces evasion because taxpayers perceive that evasion is more likely
to be detected and punished when enforcement is high. Field experiments in
cooperation with tax authorities, beginning with the audit threat letters discussed in
Blumenthal, Christian, and Slemrod (2001) and Slemrod, Blumenthal, and
Christian (2001), and surveyed in Hallsworth (2014) and Slemrod (2016), have
enabled substantial progress in understanding the effects of tax enforcement
interventions on the treated taxpayers. Yet the focus on targeted taxpayers, usually
letter recipients, largely neglects the effectiveness of enforcement as a deterrent to
evasion by the majority of taxpayers, who are not themselves targeted but may learn
about and react to enforcement changes.
This paper bridges the gap between the responses of targeted taxpayers and the
response of the population at large by examining both the direct effect of
enforcement on targeted taxpayers and the network effects of enforcement.
Specifically, we examine the response of taxpayers who are linked to targeted
taxpayers by a shared tax preparer, common geographic neighborhood, or parent-
subsidiary relationship. The network effects capture word-of-mouth spread of
information about enforcement, one mechanism by which general perceptions
about enforcement can change. Understanding the flow of information through
networks could improve the cost-effectiveness of enforcement policy, for example
treating taxpayers with the most network links increases voluntary compliance in
the agent-based model of Andrei, Comer, and Koehler (2014). Enriching our
understanding of network effects could be valuable beyond tax policy, as the role
of networks in social interactions is a burgeoning area of research in several fields,
surveyed by Jackson (2010).
We study both network and direct effects in a large-scale field experiment
conducted by the IRS, in which 12,172 firms suspected to be noncompliant were
assigned either to one of two treatment arms or to a control group. The experiment

4
was designed to examine employer compliance with the requirement to remit
withheld income taxes and payroll taxes, an area of compliance that has gone
relatively unstudied despite its prominence in modern tax systems – these
remittances by employers amounted to 70 percent of the total tax collected by the
Internal Revenue Service in 2016 (IRS 2017). One treatment was an informational
letter, while the other was a much more dramatic intervention, an in-person visit to
the place of business by an IRS Revenue Officer. The direct effect of the Revenue
Officer visit was a 276 percent increase in tax remitted by visited taxpayers relative
to the control group one quarter after treatment, an effect that remained substantial
one year after treatment. Receiving a letter increased remittances by 34 percent for
a single quarter.
While receiving the letter did not have significant network effects, receiving a
Revenue Officer visit did, increasing tax remitted by 2 percent in the following
quarter among the 24 firms, on average, sharing a tax preparer with each visited
firm. In contrast, subsidiaries of visited firms reduced their tax remittances by 9.3
percent, a network effect that may reflect reallocation of resources within the
enterprise rather than information diffusion.
The few field experiments that test for network effects of tax enforcement focus
primarily on geographic connections between households, as opposed to the inter-
firm links studied in this paper; neither professional preparer nor parent-subsidiary
links have previously been examined. Our paper focuses on tax enforcement aimed
at firms, which is understudied relative to tax enforcement aimed at individuals.
There are two main contributions of the paper. The first is the finding that an in-
person Revenue Officer visit is much more effective in increasing tax compliance
than a soft letter, which nevertheless increased tax compliance relative to a control
group. This finding is consistent with the spillover effects on nearby households of
in-person visits by Austrian TV tax inspectors in Rincke and Traxler (2011),
although in a population of firms rather than households.
5
The second contribution of this paper is building a bridge between the novel
literature focusing on firm tax compliance and that focused on estimating network
effects of tax enforcement. Meiselman (2016) finds no evidence that sending letters
to Detroit city income tax non-filers leads their neighbors to file, while Drago,
Mengel, and Traxler (2015) find neighborhood spillovers from mailings sent to
Austrian households that are potential evaders of the TV tax. Perez-Truglia and
Troiano (2016) find that tax delinquents in three U.S. states react to mailings that
increase the salience of possible shaming in the eyes of their neighbors. Pomeranz
(2015) is an exception to the focus on household ties. In this case, an audit threat
increases the VAT declarations of treated firms’ suppliers, but not treated firms’
clients. This pattern is consistent with the incentives greater VAT enforcement
provides for treated firms to insist that transactions with suppliers are reported, and
for treated firms’ suppliers to match reports with the treated firm, and is not
informative about word-of-mouth diffusion of information. Alstadsaeter, Kopczuk,
and Telle (2015) study how information about a legal tax avoidance scheme
diffuses.
The paper proceeds as follows: In section 2 we describe the experimental setting
and treatments. In section 3 we present the direct effects of our two tax enforcement
interventions, the in-person Revenue Officer visit and the soft letter. In section 4
we describe the network effects. In section 5 we discuss the economic significance
of the estimates. In Section 6 we describe a conceptual framework to think about
the welfare effects of the interventions and the consequences for policy design
Section 7 concludes.
I. Setting and Treatments
Most U.S. employers are required to file Form 941, “Employer’s Quarterly
Federal Tax Return,” to report wages and tips, federal income tax withheld, and
6
both the employer’s and the employee’s share of Social Security and Medicare
taxes. Between the fourth quarter of 2013 and the fourth quarter of 2014, more than
6.5 million firms filed at least one quarterly Form 941, including subchapter C and
S corporations, partnerships, LLCs, and sole proprietorships with employees. The
majority of employers are required to make semi-weekly or monthly Federal Tax
Deposits (FTDs) of the employment taxes reported on Form 941.
By the end of each calendar quarter, IRS uses an algorithm to identify and
prioritize firms at high risk of falling behind on their required deposits into
categories called FTD Alerts. For firms with high priority alerts (Alert A or B
status), the IRS assigns a Revenue Officer to contact the firm within fifteen days of
the alert’s issuance. The experiment we study was carried out on a third group of
firms, designated as having Alert C status. These are firms for which the algorithm
indicates a higher risk of falling behind on their deposits than the general
population, but not as high a risk as firms designated Alert A or B. In some quarters
prior to the experiment, Alert C firms may have received a letter about their
deposits. Some, but by no means all, firms receive the same FTD Alert designation
for more than one consecutive quarter.1 It is especially relevant from a tax
enforcement policy standpoint to understand the behavior of Alert C firms, because
these firms are at the margin of field action from the IRS, and are therefore the most
relevant population when considering whether to expand or contract the set of firms
the IRS contacts.
This paper studies the 12,172 businesses assigned Alert C status by the algorithm
based on payments before and during the fourth quarter of 2014. These firms were
randomly assigned to one of three groups. A control group received no FTD Alert-
related contact. A second group received a letter, referred to henceforth as the “soft
1 Due to high turnover from quarter to quarter (e.g., only 28 percent of control group firms continue to have the Alert C
designation after one quarter), we expect that a few of the firms randomly assigned in the experiment we study would have received an enforcement action prior to the experiment because of an earlier Alert status. Random assignment makes this fact unlikely to bias our results, although it is relevant when considering how our results generalize to other contexts.
7
letter” treatment2, early in the first quarter of 2015. The letter notes that the firm’s
deposits have decreased, discusses the firm’s deposit responsibility and potential
penalties, and provides information and resources about federal tax deposits and
their payment. The third group of firms received an initial in-person contact at the
place of business from an IRS Revenue Officer3. Initial contact procedures
emphasize providing the taxpayer with information about the collection process,
discussing the taxpayer’s deposit compliance status, and gathering basic
information. In some cases, a Revenue Officer may use information from an initial
contact to determine that further investigation or contact is warranted, following
collection procedures.
Compared to the average firm filing a quarterly employment tax return, firms
with Alert C status as of the fourth quarter of 2014 had more employees but remitted
less tax and were more likely to have not remitted any tax at all, as Table 1
illustrates. Prior to treatment, the two treatment groups and control group had the
same median number of employees, and statistically indistinguishable mean
numbers of employees. The pre-treatment mean dollar amounts remitted have large
standard deviations and differ substantially across groups due to a handful of
extremely large firms. Taking the log of payments plus one dollar results in a less
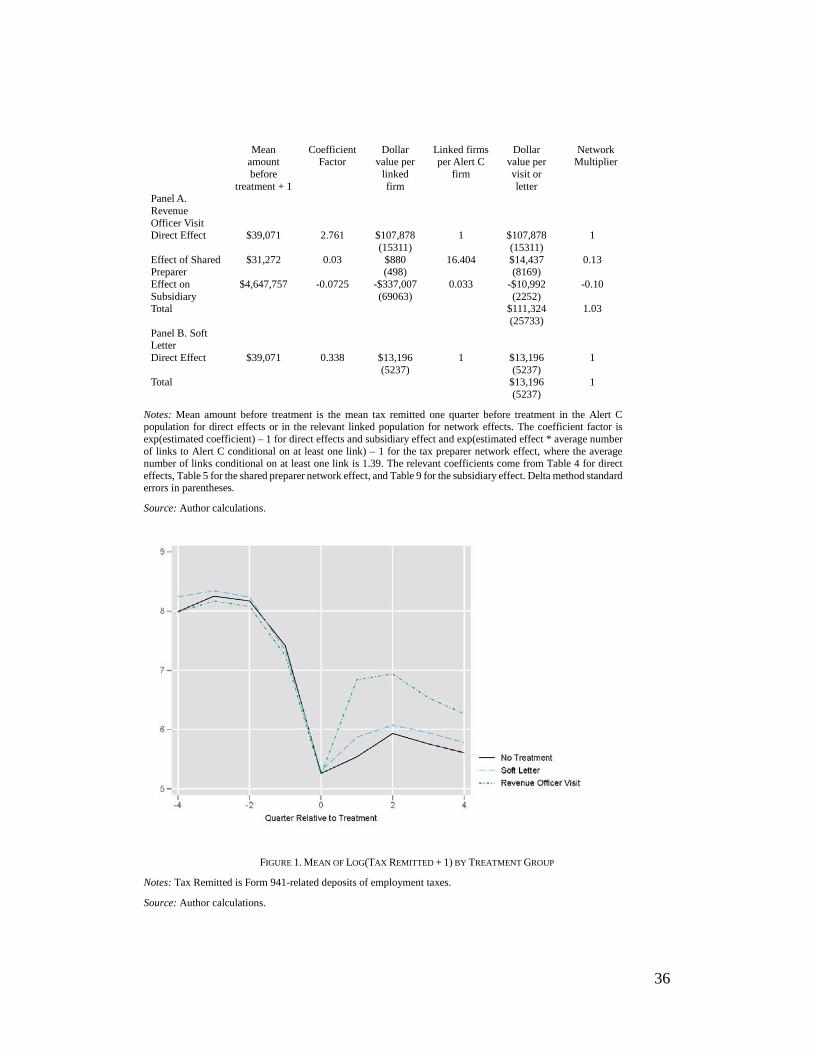
noisy measure that is similar across treatment groups.4 In each of five quarters prior
to treatment, the fraction of firms remitting any tax and the mean of log(tax remitted
+ 1), presented in Figures 1 and 2, are nearly identical across treatment groups.
Absent effect heterogeneity, the outcome log(tax remitted + 1) corresponds to
specifying that the response to treatment is proportional to firm size, rather than a
fixed dollar amount.
2 A copy of the letter is included in the online appendix. If a taxpayer has filed a form giving a representative power of
attorney, the representative also receives a copy of any written correspondence. 3 IRS records indicate that Revenue Officers dedicated time to contacting nearly all assigned firms. 4 Results discussed below are robust to instead using the inverse hyperbolic sine transformation, equal to𝑙𝑙𝑙𝑙𝑙𝑙(𝑦𝑦 +
(𝑦𝑦2 + 1)1/2), or winsorizing 𝑙𝑙𝑙𝑙𝑙𝑙(𝑦𝑦 + 1) at the 99th percentile.
8
For all treatment groups, tax compliance falls sharply over the four quarters prior
to treatment, and even the control group remits more tax one quarter after treatment,
a pattern analogous to the “Ashenfelter dip” discussed by Heckman and Smith
(1999) in the context of labor market interventions, wherein those who qualify for
job training often have temporarily depressed earnings that tend to revert upward
toward their longer-term mean even absent treatment. Without an experimental
control group, it would be difficult to construct a control group from observational
data that would not overestimate the effect of treatment.
A. Follow-up Treatment
Recent work by Bhargava and Manoli (2015) and Guyton et al. (2016) has shown
that enforcement treatments tend to have short-lived effects on taxpayer behavior
and that reminders, essentially follow-up rounds of treatment, can boost the
persistence of the treatment’s effect. This inspired a novel (in the context of tax
administration research) feature of the design of this experiment, drawing on
practice in medicine—where patients who are initially unresponsive to treatment
may receive continued treatment5.
At the end of the quarter during which treatment took place, the algorithm that
determines whether firms are designated high risk (Alert C) ran again, and some of
the 12,172 firms in the experiment were again designated high risk. Firms that were
again designated high risk received a second dose of their assigned treatment in the
following quarter. Thus, each firm assigned, for example, to the Revenue Officer
visit group received one visit early in Q1 2015 and, if the firm remained at high risk
based on its payments through week twelve of Q1 2015, it received a second
Revenue Officer visit in the second quarter of 2015. The same procedure was
followed with the letter treatment. After the second quarter, no firm received further
5 See, for example, Zonder et al. (2003) on leukemia and Diehl et al. (2003) on treatment of refractory Hodgkin’s
lymphoma with a second course of high-dose chemotherapy.
9
experimental treatment, although some businesses in the experiment might have
been assigned to very high risk (Alert A or B) status and thereby been subject to
routine enforcement action. Table 2 presents a chronology of treatment.
Turnover in high risk status, detailed in Table 3, is large – only 28 percent of
control group firms remained in this category one quarter after random assignment.
Among firms assigned to receive a soft letter, 28 percent continued to have high
risk status in the following quarter and received a second letter. Among firms
assigned to receive a Revenue Officer visit, just 19 percent continued to have high
risk status in the next quarter and therefore received a second visit. The lower
fraction of firms assigned to receive a Revenue Officer visit continuing in high risk
status is consistent with the result, detailed below, that the Revenue Officer visit
dramatically increased remittances.
This follow-up treatment allows us to assess the effects of a realistic treatment
protocol in which recalcitrant cases receive a follow-up intervention. If the
treatment interventions we study were to become standard practice, follow-up
treatment of unresponsive firms might well become tax administration procedure.
In our analysis, all firms are included regardless of follow-up treatment, but results
should be interpreted in light of the follow-up treatment administered to firms
whose remittance behavior continued to indicate high risk. Beginning two quarters
after treatment, effects capture both the persistent component of the initial treatment
administered to all firms in the treatment group and the effect of the follow-up
treatment administered one quarter later to a subset of treatment group firms.
II. Direct Effects
A. Event Study Regression Design

10
While cross-sectional comparisons would also be valid because firms are
randomly assigned to treatment6, our preferred specification uses an event-study
regression design to reduce residual variance and allow for a flexible time path of
the treatment response. This design rests on the assumptions that there are no
contemporaneous changes that affect the treatment and control groups
differentially, and that absent treatment the time paths of the outcome variables in
the treated and control groups would evolve in a parallel fashion.7 There were no
contemporaneous IRS policy changes that might affect the treatment groups
differentially. Figures 1 and 2 illustrate that the trends in the outcomes we study are
the same across treatment groups for several quarters prior to treatment, which
supports the assumption that these trends would continue to be parallel absent the
experiment. We estimate models of the form
(1) 𝑌𝑌𝑖𝑖𝑖𝑖 = ∑ ∑ 𝛽𝛽𝑗𝑗𝑗𝑗1(𝑇𝑇𝑖𝑖 = 𝑗𝑗)1(𝑡𝑡 = 𝑞𝑞)𝑗𝑗𝑗𝑗 + µ𝑖𝑖 + 𝜂𝜂𝑖𝑖 + 𝑒𝑒𝑖𝑖𝑖𝑖,
where 𝑌𝑌𝑖𝑖𝑖𝑖 denotes the outcome of interest, e.g. the log amount of employment tax
that firm 𝑖𝑖 remitted with Form 941 in quarter t, 𝛽𝛽𝑗𝑗𝑗𝑗 is the coefficient that indicates
the direct effect of treatment 𝑗𝑗 on the outcome 𝑞𝑞 quarters after treatment, 1(𝑇𝑇𝑖𝑖 =
𝑗𝑗) is an indicator variable equal to one if firm 𝑖𝑖 received treatment 𝑗𝑗, 1(𝑡𝑡 = 𝑞𝑞) is
an indicator equal to one if 𝑡𝑡 is 𝑞𝑞 quarters after treatment, µ𝑖𝑖 is a fixed effect for
firm 𝑖𝑖, 𝜂𝜂𝑖𝑖 is a fixed effect for quarter t, and 𝑒𝑒𝑖𝑖𝑖𝑖 is the regression error term.
Standard errors are clustered at the firm level to account for possible serial
correlation in the error term. The two outcomes we study are log(employment tax
remitted + 1) and the probability of remitting any employment tax, for which we
use a linear probability model.
6 The results of a cross-sectional comparison, which differ little from the event study results, are reported in the online
appendix. 7 In the online appendix we report results including the five quarters prior to treatment as a placebo test, which shows
that neither treatment has a statistically significant effect at the p<0.05 level in any pre-treatment quarter, although the soft letter effect on both outcomes is statistically significant at the p=0.10 level in the period four quarters prior to treatment, perhaps due to chance.
11
B. Direct Effects Results
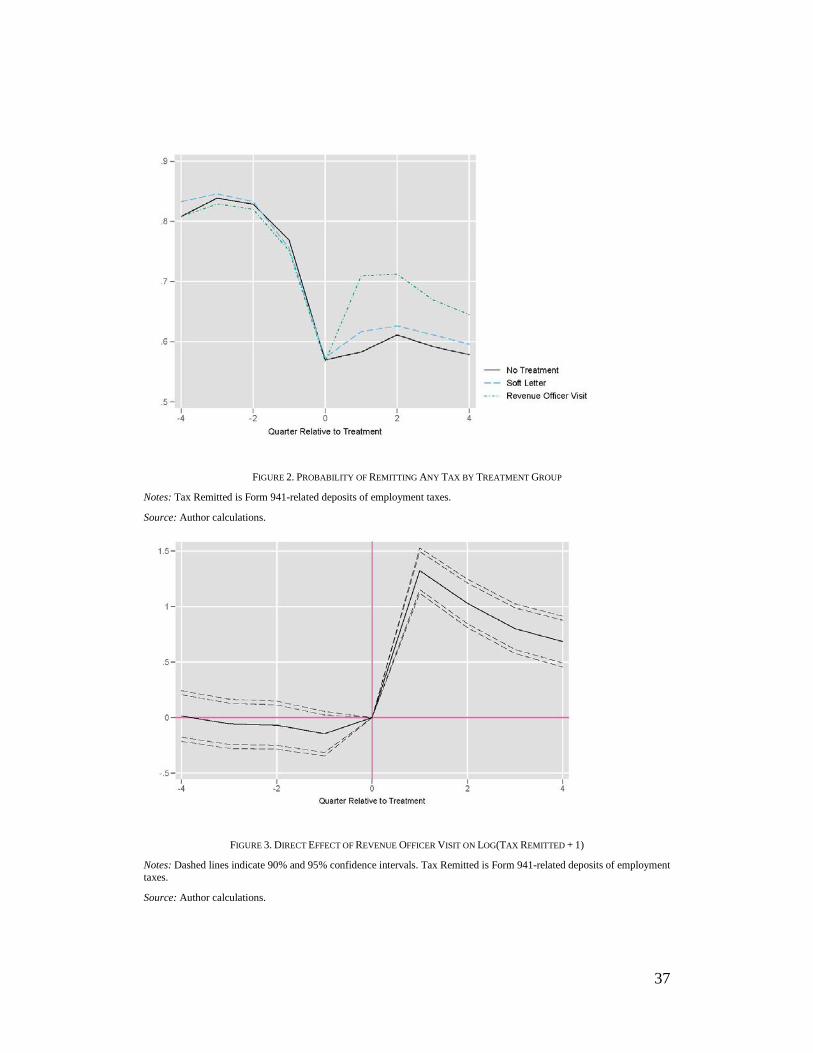
The Revenue Officer visit has large, statistically significant direct effects on both
log(tax remitted + 1) and the probability of remitting any tax throughout the four
post-treatment quarters in our sample period. The estimated effect on log(tax
remitted + 1) one quarter after treatment, shown in Table 4, is 132.5 log points, a
276 percent increase8. Despite the follow-up treatment of 18% of treated firms after
one quarter, the effect diminishes with each successive quarter to 68.5 log points
four quarters after treatment, or a 98 percent increase. The effect of the Revenue
Officer visit on the probability of remitting any tax in a linear probability model is
12.9 percentage points one quarter after treatment, shrinking with each quarter to
6.9 percentage points four quarters after treatment. For reference, 58 percent of
control group firms remitted any tax one quarter after treatment. These effect
estimates demonstrate that visited firms had a dramatically larger rebound in
compliance after treatment than the control firms, although the control firms also
increased compliance slightly after treatment, consistent with mean reversion and
the aforementioned Ashenfelter dip. The rebound experienced by control firms
suggests that observational studies comparing firms receiving a visit or letter to
firms selected from the general population would likely overstate the effects of the
compliance treatments, and further indicates the value of conducting randomized
experiments.
The estimated effects of the soft-letter treatment on both log(tax remitted + 1)
and the probability of remitting any tax are much smaller. The effect of the soft
letter on log(tax remitted + 1) one quarter after treatment is 29.1 log points,
corresponding to a 33.7 percent increase, and is highly statistically significant.
Although the point estimates remain between 10 and 15 log points until four
8 As 𝑒𝑒1,325 − 1 = 2.76.
12
quarters after treatment, this effect is not statistically significant beyond the first
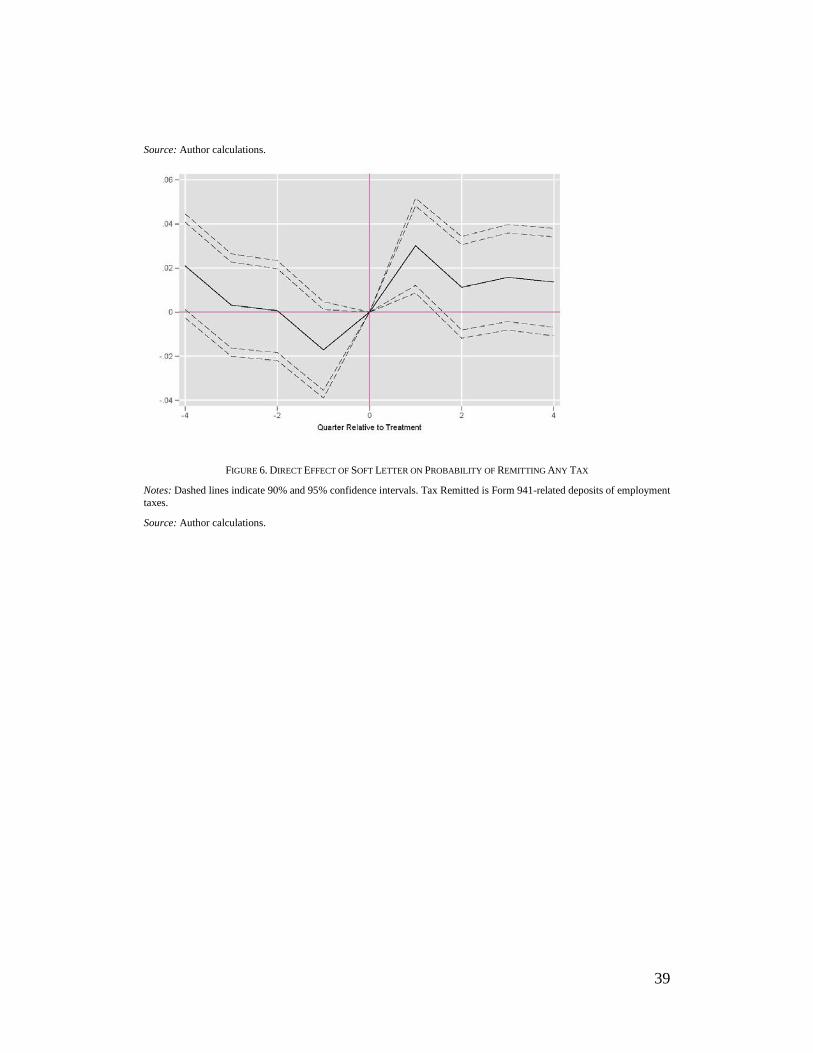
quarter. On the extensive margin of tax compliance, the effect of the soft letter on
the probability of remitting any tax is 3.02 percentage points one quarter after
treatment, which is highly statistically significant. Point estimates in the following
three quarters are between 1 and 1.6 percentage points, and statistically
insignificant.
In sum, an in-person Revenue Officer visit causes taxes remitted to more than
triple immediately, while a soft letter causes taxes remitted to immediately increase
by one-third. The combined effect of the initial visit and a follow-up procedure in
which continually non-compliant firms receive a second visit almost doubles taxes
remitted even four quarters after treatment began. A similar procedure with soft
letters does not significantly increase taxes remitted beyond the first quarter after
treatment began. While we cannot isolate the additional causal effect of receiving
a second follow-up treatment, the effects of both the visit(s) and letter(s) peak in
the first quarter after treatment, prior to the administration of the follow-up
treatment to firms that remained high-risk.
III. Network Effects
We now turn our focus from the direct, or specific, effect on those firms that
themselves receive the enforcement intervention to the network deterrent effect,
which operates through contact with those firms directly receiving the enforcement
intervention.9 As discussed earlier, this analysis could provide insight about how
information regarding enforcement actions diffuses to alter the generally perceived
probability that tax evasion will be detected. Even if the per-linked-firm network
effect is small, a large number of linked firms per treated firm can still result in a
9 While some experimental group firms are linked to one another, raising the concern that network effects could bias
direct effects estimates, our direct effect estimates are substantively unchanged when we control for the presence of network effects. These results are reported in the online appendix.
13
substantial aggregate effect of network connections on total remittance behavior.
Understanding the information network structure could also inform the design of
information campaigns, as models show higher voluntary compliance results from
providing information to taxpayers with the most links (Andrei, Comer, and
Koehler, 2014).
We define two measures of geographic networks, in which firms are linked via
business addresses as reported to the IRS prior to treatment either through a shared
ZIP Code or, at a more fine-grained level, a shared ZIP+4. The 42,000 five-digit
ZIP Codes in the United States indicate a shared postal facility and are assigned to
either geographic areas or post office boxes (USPS, 2016). Firms in our
experimental sample share a ZIP Code with an average of 65910 other employers
filing quarterly employment tax returns. A ZIP+4 is a nine-digit designation for a
small group of blocks or segment of a postal route (USPS, 2016). Each firm in our
experimental sample shares a ZIP+4 with an average of just 3 other firms filing
quarterly employment tax returns.
We also explore linkages via a shared tax preparer or tax preparation firm. Each
individual tax preparer has a unique Preparer Tax Identification Number (PTIN),
which that preparer includes on each return he or she prepares. If the preparer is
part of a tax preparation firm, the firm’s unique Employer Identification Number
(EIN) is also included on each prepared return. These identifiers allow us to identify
when two firms’ returns are prepared by the same individual preparer or by
preparers working at the same tax preparation firm. We consider two firms linked
to a tax preparer or tax preparation firm if that tax preparer or tax preparation firm
prepared at least one Form 941 for that firm in the four quarters prior to treatment;
it is plausible that firms might have contact with a tax preparer or tax preparation
firm they have used in the past year even if they are no longer using that preparer,
10 As some firms are linked to more than one Alert C firm, the sample of firms linked by ZIP code to Alert C firms is
smaller than 659 times the size of the Alert C sample, and similarly for the other network channels we study.

14
if they are concerned about IRS enforcement action related to past filings. Each
firm in our experimental sample shares a tax preparer with an average of 23 other
firms filing Form 941 and a tax preparation firm with an average of 98 other firms
filing Form 941.
Finally, we investigate links between parent corporations and their subsidiaries.
Parent/subsidiary relationships meet one of two sets of criteria in the year prior to
treatment assignment. In the first case, the parent corporation files IRS Form 851,
“Affiliations Schedule,” with a consolidated group annual tax return indicating that
the parent owns stock with 80 percent or more of both the total value and voting
power of the subsidiary directly or indirectly through other corporations in the
consolidated group. In the second case, the parent corporation is a subchapter S
corporation and has filed Form 8869, electing to treat a domestic corporation whose
stock it wholly owns as a qualified subchapter S subsidiary which is deemed
liquidated. This definition implies that firms have at most one parent and that parent
firms cannot themselves have a parent, as parents in our sample are either the
ultimate parent of a consolidated group or S corporations whose owners are
required by law to be individual people. The business operations of the parent and
subsidiary are presumably tightly linked, given the degree of ownership and filing
of a consolidated annual tax return.
The various networks we study capture a diverse range of relationships between
firms. For example, the network effect per link to a firm visited by a Revenue
Officer may be large for one channel but not others, and the network effect per link
to a soft-letter firm need not be large for that channel. One might expect that soft
letters have network effects through ZIP and ZIP+4, as these links capture both
geographic proximity and shared postal delivery, while Revenue Officer visits
might have especially strong effects through shared preparers or tax preparation
firms, as the preparer or firm may interact directly with the Revenue Officer.
Additionally, links to Revenue Officer visited firms through a given channel, for
15
example a shared preparer, may affect firm behavior on only the intensive margin,
captured by our measures of the amount of tax remitted, or only the extensive
margin, captured by the tax remitted > 0 indicator.
A. Controlling for selection bias in estimating network effects
We aim to identify the causal network deterrence effects of the letter and visit
treatments. Specifically, we are interested in the difference between a firm’s
compliance behavior if its network “neighbors” happen to receive a letter or visit
and that firm’s behavior if its network neighbors happen to receive no treatment. It
is important to keep in mind that simply comparing the post-treatment behavior of
firms with network neighbors that received a letter or visit to the post-treatment
behavior of all firms without treated network neighbors would provide a biased
estimate of the network effect. This is because having treated network neighbors
requires having network neighbors with high-risk (Alert C) status, and network
links are not random.
Firms with Alert C status are less likely than other employers to have remitted
any Form 941-related tax, as Table 1 shows, and so it is natural to suppose that the
network neighbors of firms with Alert C status might have systematically different
remittance behavior compared to other firms’ network neighbors. For example, if
adverse local economic shocks make firms in a neighborhood less likely to remit
tax payments, firms in that neighborhood are both more likely to have Alert C status
themselves and more likely to be linked to firms with Alert C status. The same
concern arises for links through preparer networks; within a geographical area, it is
plausible that a certain type of business is attracted to particular preparers, perhaps
because these preparers are known to be more experienced (or more sympathetic,
or more condoning) in dealing with at-risk businesses. Parents and their subsidiaries
are also likely to share similar compliance behavior.
16
We address the selection bias concern by comparing firms with the same number
of Alert C neighbors. Consider the example of two firms, each sharing its own
unique ZIP Code with exactly one Alert C firm in the experimental sample. Prior
to random assignment, the likelihood of each firm sharing its ZIP Code with a firm
that receives a Revenue Officer visit is 1/3. Conditional on the number of links to
Alert C firms, network treatment is randomly assigned and thus independent of
firms’ characteristics and potential compliance outcomes. Comparing firms with
the same number of links to Alert C firms allows us to identify an unbiased causal
effect of being linked to a treated firm.
The regression approach we implement is a generalized version of the event-
study approach used above to study direct effects, where we pool firms with
different numbers of links to Alert C firms to produce a single treatment estimate,
but control for differential patterns of compliance over time between firms based
on their total links to Alert C firms.11 This approach relies on the assumption that,
conditional on the number of total links to Alert C firms, the trends in compliance
would be parallel across firms linked to different treatment groups absent treatment.
Specifically, separately for each network channel 𝑐𝑐 we run regressions of the form:
(2) 𝑌𝑌𝑖𝑖𝑖𝑖 = ∑ ∑ 𝜌𝜌𝑐𝑐𝑗𝑗𝑗𝑗𝐿𝐿𝑐𝑐𝑖𝑖𝑗𝑗1(𝑡𝑡 = 𝑞𝑞)𝑗𝑗𝑗𝑗 + ∑ 𝜃𝜃𝑐𝑐𝑐𝑐𝑖𝑖𝑐𝑐 + µ𝑖𝑖 + 𝑒𝑒𝑖𝑖𝑖𝑖,
where 𝑌𝑌𝑖𝑖𝑖𝑖 is the outcome for firm 𝑖𝑖 in quarter 𝑡𝑡, 𝜌𝜌𝑐𝑐𝑗𝑗𝑗𝑗 is the network effect through
channel 𝑐𝑐 of treatment j, q quarters after treatment, 𝐿𝐿𝑐𝑐𝑖𝑖𝑗𝑗 is the number of links
through network channel c that firm 𝑖𝑖 has to firms that received treatment j, 1(𝑡𝑡 =
𝑞𝑞) is an indicator equal to one if t is q quarters after treatment, 𝜃𝜃𝑐𝑐𝑐𝑐𝑖𝑖 is a fixed effect
common to all firms connected through network channel c to a total of 𝑙𝑙 treated and
control firms in quarter t, µ𝑖𝑖 is a fixed effect for firm 𝑖𝑖, and 𝑒𝑒𝑖𝑖𝑖𝑖 is the regression
11 Drago, Mengel, and Traxler (2015), studying Austrian TV tax letters, control for this bias by regressing their outcome
variable on the fraction of a taxpayer’s network links that are to treated firms and the fraction of a taxpayer’s links that are to experimental group firms. Our results are substantively unchanged in a panel version of their specification.
17
error term. Note that, conditioning on a fixed value of the total number of links to
Alert C firms, this specification is a standard event-study specification with quarter
and firm fixed effects. The specification pools the event-study specifications across
different numbers of total links to Alert C firms and constrains the estimated
network effect to be linear in the number of links to treated firms. We do this in
separate specifications for firms sharing a PTIN, EIN, ZIP Code, or ZIP+4 with an
Alert C firm and for the subsidiaries and parents of Alert C firms. We cluster the
standard errors at the level of the channel used in that specification, e.g. ZIP Code,
PTIN, or parent, which addresses correlation in the error term between firms
sharing, e.g., a preparer or parent as well as serial correlation in the error term.
B. Individual Tax Preparer (PTIN) Network Effects Results
The Revenue Officer visit slightly increased remittances of firms sharing an
individual tax preparer with a visited firm one quarter after treatment, by an
estimated 1.99 log points in the log(tax remitted + 1) specification in Table 5. With
a standard error of 1.11 log points, this effect is statistically significant at the ten
percent level. This corresponds to a two percent increase in taxes remitted. Given
the average number of links to firms receiving a Revenue Officer visit, this is an
economically substantial effect, as discussed in more detail below. The point
estimates in later quarters are also positive and of similar magnitude to the effect
one quarter after treatment, but they are not statistically significant. The point
estimates of the effect on the probability of remitting any tax for all four quarters
after treatment are statistically insignificant, with the largest point estimate, 0.188
percentage points, occurring one quarter after treatment.
Links to a firm receiving a soft letter did not have a statistically significant effect
on either the amount of tax remitted or the probability of remitting any tax in any

18
quarter after treatment. The estimated effect on log(tax remitted + 1) one quarter
after treatment is -1.25 log points with a standard error of 1.32 log points.
C. Tax Preparation Firm (EIN) Network Effects Results
Neither the letter nor the visit has a statistically significant effect on tax
remittances by firms linked to a treated firm through a tax preparation firm. The
estimated effect of a link to a visited firm one quarter after treatment is 0.0147 log
points with a standard error of 0.857 log points, while the one quarter effect of the
soft letter is estimated at -0.814 log points (standard error 0.931 log points).
D. Narrow Geographic (ZIP+4) Network Effects Results
Neither the effect of sharing a ZIP+4 with a firm receiving a Revenue Officer
visit nor the effect of sharing a ZIP+4 with a firm receiving a soft letter is
statistically significant one quarter after treatment. Oddly, the effect of ZIP+4 links
to soft letter firms is statistically significant only three quarters after treatment for
both outcomes, with a negative sign. The effect on log(tax remitted + 1) is estimated
at -11.9 log points (standard error 5.39 log points) and the effect on the probability
of remitting any tax is -1.39 percentage points (standard error 6.28 percentage
points). The effect on both outcomes is statistically significant at the five percent
level. This surprising result can perhaps be explained by the fact that the ZIP+4
specification fails a placebo test in all four quarters prior to treatment, while our
other specifications do not fail a placebo test in any quarter prior to treatment. The
sign of the point estimate of the ZIP+4 soft letter effects is negative in all quarters
prior to and after treatment relative to the omitted quarter immediately prior to
treatment, which suggests that the anomaly is due to an issue with the parallel-
trends assumption for this specification and may be related to the relatively small
sample size of the ZIP+4 links sample.

19
E. Geographic (ZIP Code) Network Effects Results
Sharing a ZIP Code with a firm that receives a soft letter or a Revenue Officer
visit does not affect log(tax remitted + 1) or the probability of remitting any tax one
quarter after tax. These results are estimated with sufficient precision that the 95
percent confidence interval for the effect of a ZIP Code link to a firm that received
a Revenue Officer visit one quarter after treatment spans (-0.00283, 0.00923),
ruling out effects with a magnitude of a single log point. The similar confidence
interval for the soft-letter ZIP Code network effect is (-0.00581,0.00565), ruling out
effects with a magnitude of 0.6 log points. However, even effects small enough to
lie within these confidence intervals would have substantial economic implications
for the aggregate effect of treatment given the large numbers of firms sharing a ZIP
Code with a treated firm, as we discuss in greater detail below.
F. Parent and Subsidiary Network Effects Results
Next, we consider the effects of a Revenue Officer visit or soft letter on the taxes
remitted by the corporate parents and subsidiaries of treated firms. The 12,172 firms
in the treatment and control groups include 49 firms with at least one subsidiary.
Many of these firms have more than one subsidiary, so that there is a total of 397
subsidiaries. Strikingly, we find that subsidiaries of firms receiving a Revenue
Officer visit remit less tax than the subsidiaries of the control firms. The Revenue
Officer visit reduces the employment taxes remitted by subsidiaries by 7.53 log
points one quarter after treatment, a 9.3 percent decrease, as reported in Table 9.
The probability that a subsidiary remits any tax also decreases, by 0.917 percentage
points. Both effects are highly statistically significant. The point estimates of the
effect of the visit remain negative in the four quarters after treatment, but are
statistically insignificant with the exception of the effect on the probability of
20
remitting any tax four quarters after treatment, which declines by 7.16 percentage
points and is statistically significant only at the p<0.1 level.
The observed decline in subsidiaries’ remittances induced by higher enforcement
on the parent, which has not been previously documented, has two possible
explanations. The first is a cash-flow effect; when the parent is induced to remit
more, perhaps in a period of business stress, it relieves the cash strain by reducing
tax remittances of firms it controls. This behavior is also broadly consistent with
behavior that has been documented in other contexts that increased enforcement
attention to one item of taxable income--usually receipts in an income tax--leading
to firms increasing their reported expenses, which are less readily monitored, to
reduce the impact on tax liability.12 We do not find statistically significant effects
of the soft letter on subsidiaries’ remittance behavior.
In contrast to the effects of enforcement on the subsidiaries of treated firms, we
do not find statistically significant effects on the parents of treated firms. Only 33
firms are parents of at least one Alert C firm; in one case, a parent has two
subsidiaries in Alert C. The small size of the parent sample limits the statistical
power with which we can examine parent behavior. The estimated effects of both
treatments on the parent firm’s tax remitted in the quarter after treatment are
positive but statistically insignificant. This evidence is consistent with an
asymmetric relationship between parents and subsidiaries in which subsidiaries are
on average much smaller than parents and as a result more responsive to the
parent’s enforcement status than vice versa, although effects on parents of a similar
magnitude to the effects on subsidiaries are included in a 95% confidence interval
for the effect on parents, so we cannot rule out symmetric effects on parents and
subsidiaries.
12 See Carrillo et al. (2017) and Slemrod et al. (2017).
21
To summarize the network effects results, firms sharing an individual tax preparer
with a firm visited by a Revenue Officer remit two percent more tax one quarter
after treatment, and subsidiaries of firms visited by a Revenue Officer remit 9.3
percent less tax one quarter after treatment.
IV. How Large Are the Aggregate Network Effects Relative to the
Direct Effects?
The aggregate network effect totaled across all linked firms of an intervention on
revenue collected may be non-trivial relative to the direct effect on revenue remitted
by the treated taxpayer even if the per-link network effect is much smaller than the
direct effect, if there are sufficiently many network links. To explore this issue, we
begin by defining the network multiplier to be the aggregate revenue effect of an
intervention via a network divided by the intervention’s direct effect on revenue.
To obtain the network multiplier we must first convert our estimates into dollars
of revenue collected per visit or letter. For the direct effect of the visit, this
calculation (reported in Table 11) takes the average amount remitted by an Alert C
firm one quarter before treatment (plus one for consistency with our regression
specifications), $39,071, and multiplies by𝑒𝑒1.325– 1 = 2.761, where 1.325 is the
estimated effect of the visit reported in Table 4, to obtain $107,878 per visit, with a
delta method standard error of $15,311. A similar calculation for the letter
multiplies $39,071 by𝑒𝑒0.291– 1 = 0.338, again taking the coefficient estimate from
Table 4, to obtain $13,196 per letter, with a delta method standard error of $5,237.
The dollar value of the network effect of the visit through shared preparers begins
with the average tax remitted by a firm sharing a preparer with an Alert C firm one
quarter before treatment plus one, $31,272, and multiplies by 𝑒𝑒0.0199 ∗ 1.39– 1 =
0.03 to obtain $880 per linked firm (standard error $498), where 0.0199 is the
estimated effect of a link to a visited firm through a shared tax preparer reported in
22
Table 5 and 1.39 is the average number of tax preparer links to Alert C firms among
firms with at least one tax preparer link. Multiplying by the average number of
linked firms per visited firm, 16.4, gives $14,437 per visit with a standard error of
$8,169. The network multiplier is then 0.13, indicating that in aggregate the tax
preparer network effect of the visit is 13 percent of the direct effect of the visit.
Performing a similar calculation for the effect on subsidiaries gives a network
multiplier of -0.10. The subsidiaries are on average quite large, remitting
$4,647,756 one quarter before treatment. The multiplication factor applied
is𝑒𝑒−0.0753– 1 = −0.0725, where the coefficient estimate is obtained from Table 9.
This gives -$337,007 per linked subsidiary but only -$10,992 per visit (standard
error $2,252) because there are 0.033 subsidiaries per Alert C firm.
Because the estimated network multiplier of 0.13 for the shared tax preparer
network effect is largely offset by the estimated network multiplier of -0.10 for the
subsidiary effect, the overall network effect is only 1.03 times the direct effect,
$3,446 added to the $107,878 direct effect. These estimates employ several
simplifying assumptions. Using the mean number of tax preparer links per treated
firm, instead of the distribution of links. For simplicity, these calculations do not
account for effect heterogeneity by firm size, the possibility that responses to
multiple links to treated firms are not log-linear, or that some pairs of firms may be
connected by more than one of the networks we define and affected by interactions
between the effects through multiple networks. Despite these assumptions, the
network multiplier calculations demonstrate that network effects may be
economically substantial.
V. Implications for Policy
How do these findings inform resource allocation decisions? Should each
treatment be expanded or cut back? To answer these questions, we need to consider
23
all the costs and benefits of each treatment to reach a conclusion its cost-
effectiveness.
A. Would Net Revenue Rise?
Assessing the effect on net revenue requires comparing the revenue raised by a
treatment to its marginal administrative cost. There are three components to the
revenue raised: the direct effect, the network effect, and the general deterrent effect
in the population at large, denoted as 𝑟𝑟𝐷𝐷𝑖𝑖, 𝑟𝑟𝑁𝑁𝑖𝑖, and 𝑟𝑟𝐺𝐺𝑖𝑖, respectively, where subscript
𝑡𝑡 indicates the treatment and is 𝑉𝑉 for visit or 𝐿𝐿 for letter. In this paper, we have
estimated the first two of these. The revenue raised should be compared to the
marginal administrative cost, denoted𝑎𝑎𝑖𝑖. The calculation for each treatment is
simply whether𝑟𝑟𝐷𝐷𝑖𝑖 + 𝑟𝑟𝑁𝑁𝑖𝑖 + 𝑟𝑟𝐺𝐺𝑖𝑖 ≡ 𝑟𝑟𝑖𝑖 > 𝑎𝑎𝑖𝑖.
To address these questions, we begin by referring to the dollar values calculated
in Table 11, where we show that 𝑟𝑟𝐷𝐷𝑉𝑉 = $107,878 and 𝑟𝑟𝐷𝐷𝐷𝐷 = $13,196. Based on
IRS data, 𝑎𝑎𝑉𝑉 = $220 and 𝑎𝑎𝐷𝐷 = $4. Both treatments clearly increase net revenue
without taking network or general deterrent effects into account. Assuming the
general deterrent effect, which we cannot observe, were negligible, incorporating
the statistically significant network effects of the visit yields 𝑟𝑟𝑁𝑁𝑉𝑉 = $14,437 −
$10,992 = $3,446. Then 𝑟𝑟𝑉𝑉 = $107,878 + $3,446 = $111,324 > $220.
Similarly, we can calculate that 𝑟𝑟𝐷𝐷 = $13,196 > $4. Both treatments easily pass
this simple net-revenue-increasing test.
There are, though, other issues to consider. These calculations ignore compliance
costs, which are likely higher for the Revenue Officer visit. In addition, we have
ignored any difference between the average effect we have estimated and the
marginal effect. Perhaps, most importantly, these calculations should be done on a
discounted present-value basis. Given that current interest rates are near zero,
discounting itself is not a substantively important issue over the course of a single

24
year. What is not known is whether the estimated effects would reverse sign if
carried out past the year we examine. In other words, we will be overstating the
net revenue gain to the extent that the treatments cause payments to accelerate but
not increase in total; we see no sign of this over the course of a year, but cannot be
sure it is not an issue over a longer time horizon.
B. Should Resources Be Re-Allocated?
Should a given amount resources be re-allocated between office visits and letters?
If the objective of the tax authority is to maximize revenue net of cost, then the
answer depends on whether the following inequality holds: if it does, resources
should be shifted from letters to Revenue Officer visits:13
(3) 𝑟𝑟𝐷𝐷𝑉𝑉 + 𝑟𝑟𝑁𝑁𝑉𝑉 + 𝑟𝑟𝐺𝐺𝑉𝑉 > �𝑎𝑎𝑉𝑉𝑎𝑎𝐿𝐿� (𝑟𝑟𝐷𝐷𝐷𝐷 + 𝑟𝑟𝑁𝑁𝐷𝐷 + 𝑟𝑟𝐺𝐺𝐷𝐷).
In expression (3), (𝑎𝑎𝑉𝑉𝑎𝑎𝐿𝐿
)represents the tradeoff in the extent of alternative
treatments: if one less revenue-officer visit is done, (𝑎𝑎𝑉𝑉𝑎𝑎𝐿𝐿
) more letters can be sent
out while staying within the given budget. Now the relative general deterrence
effects of the two treatments can matter. If we are willing to assume that the general
deterrence effects are proportional to the sum of the direct and network effects, then
(3) simplifies to:
(4) 𝑟𝑟𝐷𝐷𝑉𝑉 + 𝑟𝑟𝑁𝑁𝑉𝑉 > (𝑎𝑎𝑉𝑉𝑎𝑎𝐿𝐿
)(𝑟𝑟𝐷𝐷𝐷𝐷 + 𝑟𝑟𝑁𝑁𝐷𝐷).
Using our values from above, the left-hand side of (4) is $107,878 + $3,446 =
$111,324, while the right-hand side is(220/4) ∗ $13,196 = $725,780. Because
letters deliver about one-eighth of the visit’s return for just one 55th of the cost, the
average per-dollar-spent return to the letter is much higher and thus a fiscally-
13 All of the point estimates have associated confidence bands, and the cost-benefit analyses are as a result themselves
subject to error.
25
constrained tax agency would increase revenue by shifting resources from visits to
letters at the margin.14
C. Would Policy Changes Increase Welfare?
The evaluation of whether welfare would rise when a given policy changes is
more complicated. For one thing, such an evaluation should account for marginal
compliance costs (resource costs borne directly by private citizens in the form of
time and expenditure), which are social costs that do not show up in government
budgets. Second, the appropriate criterion is not whether revenue net of cost
increases, because that ignores the fact that any additional tax remittance is a
transfer from private hands, which has social value, to the government that provides
services that are of value to the population. As shown in Keen and Slemrod (2017),
which draws on Slemrod and Yitzhaki (1987) and Mayshar (1991), the welfare
impact of the intervention can be approximated by
(5) ∆𝑊𝑊 ≡ (𝑣𝑣′ − 1)∆𝑅𝑅 − 𝑣𝑣′∆𝑎𝑎 − ∆𝑐𝑐.
In expression (5), 𝑣𝑣′ is the marginal social value of an additional dollar of revenue. If the
question is whether to increase administrative effort, ceteris paribus, then
𝑣𝑣′ represents the marginal social value of raising a dollar of net revenue for public
spending. If the question is whether to increase administrative effort while
reducing, say, the tax rate in a revenue-neutral way, then 𝑣𝑣′ represents the social
cost saved by reducing the tax collected via the tax rate by one dollar, sometimes
referred to as the marginal efficiency cost of raising funds. In either case, the first
term on the right-hand-side of expression (5) is the marginal social value of the
14 Assuming that the average return in our sample equals the marginal return, and that in equilibrium the deterrent effect
of the soft letter treatment does not rely on the threat that failure to change course will incur more serious intervention, for example a Revenue Officer visit. This possibility is not addressed by the experiments we conduct, because we do not vary the operational procedure in which populations judged to be higher-risk than our sample receive Revenue Officer visits.
26
additional net revenue collected when an administrative policy instrument
increases by one unit. Because raising revenue is costly, the value of 𝑣𝑣′ will
exceed one. The other two terms on the right-hand-side of expression (5) are the
marginal social cost of increasing government spending and the marginal
compliance cost; the former is multiplied by 𝑣𝑣′ to reflect that government
spending must be funded by raising distortionary, and therefore socially costly,
taxation.
To see the implications of expression (5), consider the assumptions in Mayshar
(1991), that 𝑣𝑣′ = 1.17 and that the marginal compliance cost is twice the marginal
administrative cost. In addition, assume that the general deterrent effect is zero.
Then (5) becomes the following expressions for letters and for Revenue Officer
visits:
(6) 𝛥𝛥𝑊𝑊𝐷𝐷 = (1.17 − 1) ∗ 13,196 − 1.17 ∗ 4 − 8 = 2,228 ≫ 0.
(7) 𝛥𝛥𝑊𝑊𝑉𝑉 = (1.17 − 1) ∗ 111,324 − 1.17 ∗ 220 − 440 = 18,229 ≫ 0.
In these calculations, both the letter and the visit are welfare-enhancing. To be sure,
these illustrative calculations depend on arbitrary assumptions about the social
value of marginal revenue, the marginal compliance cost, and the general deterrent
effect of expanding enforcement instruments. The calculations do, though, illustrate
the difference between subjecting enforcement initiatives to a net-revenue-
maximizing criterion and subjecting enforcement initiatives to a welfare-
maximizing criterion.
VI. Conclusion
This paper uses a randomized experiment to estimate both the change in
employment taxes remitted caused by receiving a letter or in-person Revenue
Officer visit and the network effect on taxes remitted by firms linked to letter and

27
visit recipients by geography, tax preparers, and parent-subsidiary relationships. To
our knowledge, no previous research has investigated the effects of tax enforcement
on firms sharing a tax preparer with the treated firm or the treated firm’s parent or
subsidiaries.
We find large immediate effects of the Revenue Officer visits on tax remittance
that persist for at least four quarters thereafter and are transmitted through tax-
preparer networks. Strikingly, we find that subsidiaries of treated firms remit less
tax, which is consistent either with a cash-flow effect or substitution of
noncompliance to an apparently less monitored report. The aggregate effect of the
decline in payments by subsidiaries is about one tenth the size of the direct effect.
Although the per-firm-link tax-preparer network effects are much smaller than the
direct effects, their aggregate effect is also about one tenth the size of the direct
effect, so that the overall effect of the visit is roughly the same as the direct effect.
We find a positive, but substantially smaller and less persistent, direct effect of the
soft-letter treatment but no evidence of network effects of this treatment.
Given the empirical results, both treatments pass a net-revenue-increasing
criterion. With a fixed tax authority budget, net revenue from one additional dollar
of resources spent is higher from soft letters than Revenue Officer visits due to the
low relative administrative cost of sending the letters. With some additional
assumptions, both treatments also pass a welfare-increasing criterion.

28
REFERENCES
Allingham, Michael G., and Agnar Sandmo. 1972. "Income Tax Evasion: A
Theoretical Analysis." Journal of Public Economics 1 (3-4): 323-338.
Alstadsæter, Annette, Wojciech Kopczuk, and Kjetil Telle. 2015. “Social
Networks and Dynamics of Tax Avoidance: Evidence from a Well-Defined
Norwegian Tax Shelter.” University of Oslo Working Paper.
Andrei, Amanda L., Kevin Comer, and Matthew Koehler. 2014. “An Agent-
Based Model of Network Effects on Tax Compliance and Evasion.” Journal of
Economic Psychology 40: 119-133.
Bhargava, Saurabh, and Dayanand Manoli. 2015. “Psychological Frictions and
the Incomplete Take-up of Social Benefits: Evidence from an IRS Field
Experiment.” American Economic Review 105 (11): 3489-3529.
Marsha Blumenthal, Charles Christian, and Joel Slemrod. 2001. “Do Normative
Appeals Affect Tax Compliance? Evidence from a Controlled Experiment in
Minnesota.” National Tax Journal 54 (1): 125-138.
Carrillo, Paul, Dina Pomeranz, and Monica Singhal. 2017. “Dodging the Taxman:
Firm Misreporting and Limits to Tax Enforcement.” American Economic Journal:
Applied Economics 9 (2): 144-164.
Diehl, Volker, Harald Stein, Michael Hummel, Raphael Zollinger, and Joseph M.
Connors. 2003. “Hodgkin’s Lymphoma: Biology and Treatment Strategies for
Primary, Refractory, and Relapsed Disease.” ASH Education Program Book 2003
(1): 225-247.
Drago, Francesco, Friederike Mengel, and Christian Traxler. 2015. “Compliance
Behavior in Networks: Evidence from a Field Experiment.” IZA Discussion Paper
No. 9443.
Guyton, John, Dayanand S. Manoli, Brenda Schafer, and Michael Sebastiani.
2016. “Reminders & Recidivism: Evidence from Tax Filing & EITC Participation
29
among Low-Income Nonfilers.” NBER Working Paper No. 21904.
Hallsworth, Michael. 2014. “The Use of Field Experiments to Increase Tax
Compliance.” Oxford Review of Economic Policy 30 (4): 658-679.
Heckman, James J., and Jeffrey A. Smith. "The Pre-programme Earnings Dip and
the Determinants of Participation in a Social Programme. Implications for Simple
Programme Evaluation Strategies." Economic Journal 109 (457): 313-348.
Internal Revenue Service. 2017. Internal Revenue Service Data Book, 2016.
Washington, DC. Publication 55B. https://www.irs.gov/pub/irs-soi/16databk.pdf.
Jackson, Matthew O. 2010. “An Overview of Social Networks and Economic
Applications.” Handbook of Social Economics 1: 511-585.
Keen, Michael, and Joel Slemrod. 2017. “Optimal Tax Administration.” Journal
of Public Economics 152: 133-142.
Mayshar, Joram. 1991. “Taxation with Costly Administration.” Scandinavian
Journal of Economics 93 (1): 75-88.
Meiselman, Ben S. 2016. “Ghostbusting in Detroit: Evidence on Nonfilers from
a Controlled Field Experiment.” University of Michigan Working Paper.
Pérez-Truglia, Ricardo, and Ugo Troiano. 2015. “Shaming Tax Delinquents:
Theory and Evidence from a Field Experiment in the United States.” NBER
Working Paper 21264.
Pomeranz, Dina. 2015. “No Taxation without Information: Deterrence and Self-
Enforcement in the Value Added Tax.” American Economic Review 105 (8): 2539-
2569.
Rincke, Johannes, and Christian Traxler. 2011. “Enforcement
Spillovers.” Review of Economics and Statistics 93 (4): 1224-1234.
Slemrod, Joel. 2016. “Tax Compliance and Enforcement: New Research and Its
Policy Implications.” University of Michigan Working Paper.
Slemrod, Joel, Marsha Blumenthal, and Charles Christian. 2001. “Taxpayer
Response to an increased Probability of Audit: Evidence from a Controlled
30
Experiment in Minnesota.” Journal of Public Economics 79 (3): 455-483.
Slemrod, Joel, Brett Collins, Jeffrey L. Hoopes, Daniel Reck, and Michael
Sebastiani. 2017. “Does Credit-Card Information Reporting Improve Small-
Business Tax Compliance?” Journal of Public Economics 149: 1-19.
Slemrod, Joel, and Shlomo Yitzhaki. 1987. “The Optimal Size of a Tax Collection
Agency.” Scandinavian Journal of Economics 89: 183-192.
USPS. 2016. “USPS FAQ.” Accessed October 30, 2016. https://faq.usps.com/.
Zonder, Jeffrey A., Pamela Pemberton, Helen Brandt, Anwar N. Mohamed, and
Charles A. Schiffer. 2003. “The Effect of Dose Increase of Imatinib Mesylate in
Patients with Chronic or Accelerated Phase Chronic Myelogenous Leukemia with
Inadequate Hematologic or Cytogenetic Response to Initial Treatment.” Clinical
Cancer Research 9 (6): 2092-2097.
31
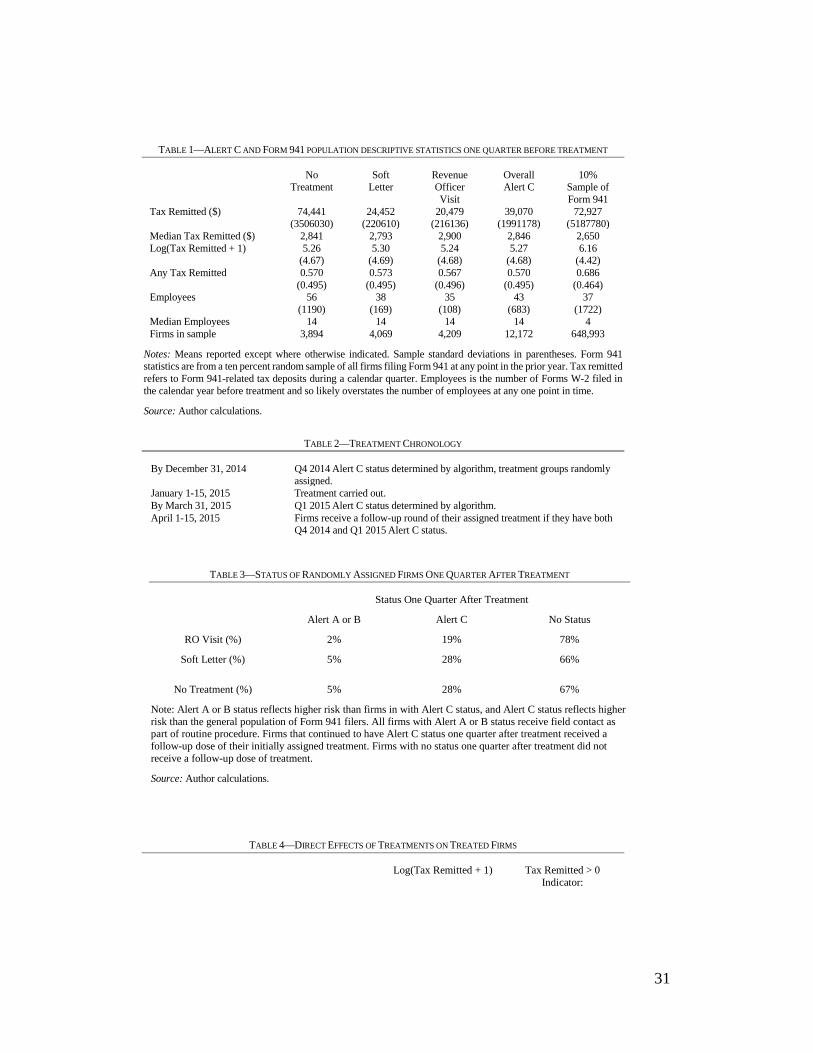
TABLE 1—ALERT C AND FORM 941 POPULATION DESCRIPTIVE STATISTICS ONE QUARTER BEFORE TREATMENT
No Treatment
Soft Letter
Revenue Officer Visit
Overall Alert C
10% Sample of Form 941
Tax Remitted ($) 74,441 (3506030)
24,452 (220610)
20,479 (216136)
39,070 (1991178)
72,927 (5187780)
Median Tax Remitted ($) 2,841 2,793 2,900 2,846 2,650 Log(Tax Remitted + 1) 5.26
(4.67) 5.30
(4.69) 5.24
(4.68) 5.27
(4.68) 6.16
(4.42) Any Tax Remitted 0.570
(0.495) 0.573
(0.495) 0.567
(0.496) 0.570
(0.495) 0.686
(0.464) Employees 56
(1190) 38
(169) 35
(108) 43
(683) 37
(1722) Median Employees 14 14 14 14 4 Firms in sample 3,894 4,069 4,209 12,172 648,993
Notes: Means reported except where otherwise indicated. Sample standard deviations in parentheses. Form 941 statistics are from a ten percent random sample of all firms filing Form 941 at any point in the prior year. Tax remitted refers to Form 941-related tax deposits during a calendar quarter. Employees is the number of Forms W-2 filed in the calendar year before treatment and so likely overstates the number of employees at any one point in time.
Source: Author calculations.
TABLE 2—TREATMENT CHRONOLOGY
By December 31, 2014 Q4 2014 Alert C status determined by algorithm, treatment groups randomly assigned.
January 1-15, 2015 Treatment carried out. By March 31, 2015 Q1 2015 Alert C status determined by algorithm. April 1-15, 2015 Firms receive a follow-up round of their assigned treatment if they have both
Q4 2014 and Q1 2015 Alert C status.
TABLE 3—STATUS OF RANDOMLY ASSIGNED FIRMS ONE QUARTER AFTER TREATMENT
Status One Quarter After Treatment
Alert A or B Alert C No Status
RO Visit (%) 2% 19% 78%
Soft Letter (%) 5% 28% 66%
No Treatment (%) 5% 28% 67%
Note: Alert A or B status reflects higher risk than firms in with Alert C status, and Alert C status reflects higher risk than the general population of Form 941 filers. All firms with Alert A or B status receive field contact as part of routine procedure. Firms that continued to have Alert C status one quarter after treatment received a follow-up dose of their initially assigned treatment. Firms with no status one quarter after treatment did not receive a follow-up dose of treatment.
Source: Author calculations.
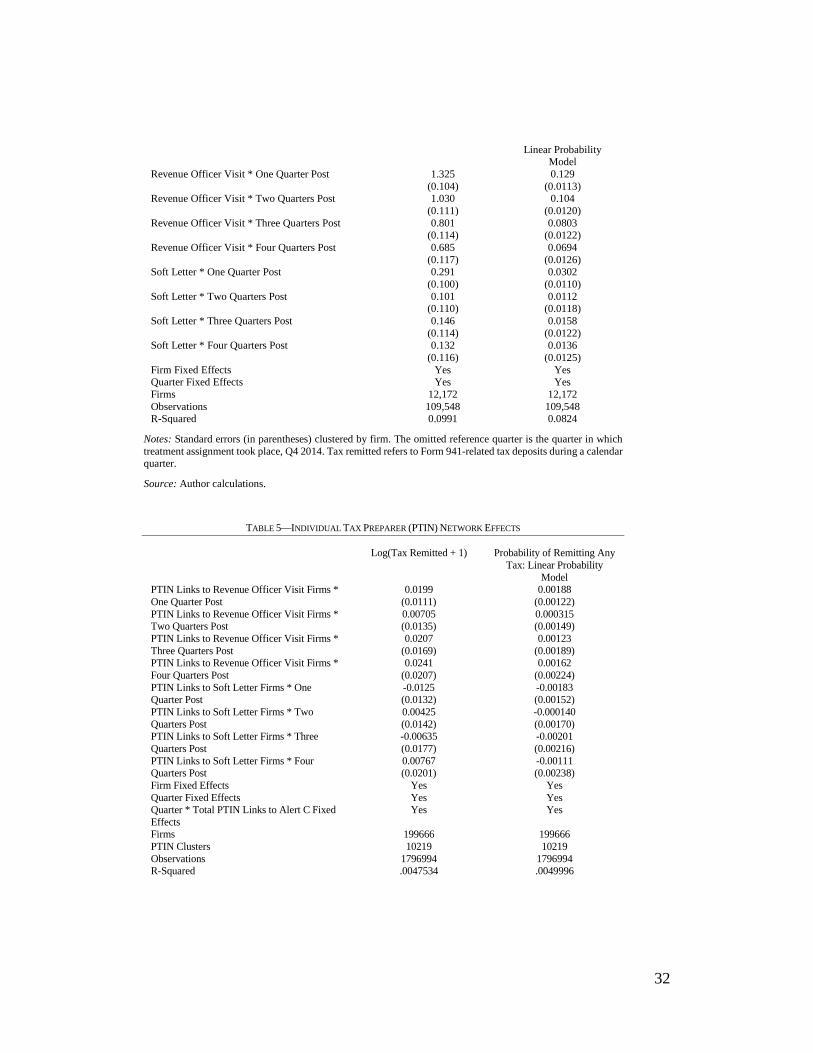
TABLE 4—DIRECT EFFECTS OF TREATMENTS ON TREATED FIRMS
Log(Tax Remitted + 1) Tax Remitted > 0 Indicator:
32
Linear Probability Model
Revenue Officer Visit * One Quarter Post 1.325 (0.104)
0.129 (0.0113)
Revenue Officer Visit * Two Quarters Post 1.030 (0.111)
0.104 (0.0120)
Revenue Officer Visit * Three Quarters Post 0.801 (0.114)
0.0803 (0.0122)
Revenue Officer Visit * Four Quarters Post 0.685 (0.117)
0.0694 (0.0126)
Soft Letter * One Quarter Post 0.291 (0.100)
0.0302 (0.0110)
Soft Letter * Two Quarters Post 0.101 (0.110)
0.0112 (0.0118)
Soft Letter * Three Quarters Post 0.146 (0.114)
0.0158 (0.0122)
Soft Letter * Four Quarters Post 0.132 (0.116)
0.0136 (0.0125)
Firm Fixed Effects Yes Yes Quarter Fixed Effects Yes Yes Firms 12,172 12,172 Observations 109,548 109,548 R-Squared 0.0991 0.0824
Notes: Standard errors (in parentheses) clustered by firm. The omitted reference quarter is the quarter in which treatment assignment took place, Q4 2014. Tax remitted refers to Form 941-related tax deposits during a calendar quarter.
Source: Author calculations.
TABLE 5—INDIVIDUAL TAX PREPARER (PTIN) NETWORK EFFECTS
Log(Tax Remitted + 1) Probability of Remitting Any Tax: Linear Probability
Model PTIN Links to Revenue Officer Visit Firms * One Quarter Post
0.0199 (0.0111)
0.00188 (0.00122)
PTIN Links to Revenue Officer Visit Firms * Two Quarters Post
0.00705 (0.0135)
0.000315 (0.00149)
PTIN Links to Revenue Officer Visit Firms * Three Quarters Post
0.0207 (0.0169)
0.00123 (0.00189)
PTIN Links to Revenue Officer Visit Firms * Four Quarters Post
0.0241 (0.0207)
0.00162 (0.00224)
PTIN Links to Soft Letter Firms * One Quarter Post
-0.0125 (0.0132)
-0.00183 (0.00152)
PTIN Links to Soft Letter Firms * Two Quarters Post
0.00425 (0.0142)
-0.000140 (0.00170)
PTIN Links to Soft Letter Firms * Three Quarters Post
-0.00635 (0.0177)
-0.00201 (0.00216)
PTIN Links to Soft Letter Firms * Four Quarters Post
0.00767 (0.0201)
-0.00111 (0.00238)
Firm Fixed Effects Yes Yes Quarter Fixed Effects Yes Yes Quarter * Total PTIN Links to Alert C Fixed Effects
Yes Yes
Firms 199666 199666 PTIN Clusters 10219 10219 Observations 1796994 1796994 R-Squared .0047534 .0049996

33
Notes: Standard errors (in parentheses) clustered by PTIN. The omitted reference quarter is the quarter in which treatment assignment took place, Q4 2014. Tax remitted refers to Form 941-related tax deposits during a calendar quarter.
TABLE 6—TAX PREPARATION FIRM (EIN) NETWORK EFFECTS
Log(Tax Remitted + 1) Probability of Remitting Any Tax: Linear Probability
Model EIN Links to Revenue Officer Visit Firms * One Quarter Post
0.000147 (0.00857)
-0.000349 (0.000943)
EIN Links to Revenue Officer Visit Firms * Two Quarters Post
-0.00349 (0.00957)
-0.000465 (0.00117)
EIN Links to Revenue Officer Visit Firms * Three Quarters Post
0.00620 (0.0126)
0.000129 (0.00148)
EIN Links to Revenue Officer Visit Firms * Four Quarters Post
0.00826 (0.0165)
0.000206 (0.00185)
EIN Links to Soft Letter Firms * One Quarter Post
-0.00814 (0.00931)
-0.00109 (0.00107)
EIN Links to Soft Letter Firms * Two Quarters Post
-0.00593 (0.0101)
-0.000442 (0.00119)
EIN Links to Soft Letter Firms * Three Quarters Post
-0.00788 (0.0119)
-0.00115 (0.00141)
EIN Links to Soft Letter Firms * Four Quarters Post
-0.0105 (0.0145)
-0.00149 (0.00168)
Firm Fixed Effects Yes Yes Quarter Fixed Effects Yes Yes Quarter * Total EIN Links to Alert C Fixed Effects
Yes Yes
Firms 395929 395929 EIN Clusters 9759 9759 Observations 3563361 3563361 R-Squared .0060991 .0062022
Notes: Standard errors (in parentheses) clustered by EIN. The omitted reference quarter is the quarter in which treatment assignment took place, Q4 2014. Tax remitted refers to Form 941-related tax deposits during a calendar quarter.
Source: Author calculations.
TABLE 7—ZIP+4 NETWORK EFFECTS
Log(Tax Remitted + 1) Probability of Remitting Any Tax: Linear Probability
Model ZIP+4 Links to Revenue Officer Visit Firms * One Quarter Post
0.0489 (0.0526)
0.00158 (0.00540)
ZIP+4 Links to Revenue Officer Visit Firms * Two Quarters Post
0.0346 (0.0525)
0.00225 (0.00554)
ZIP+4 Links to Revenue Officer Visit Firms * Three Quarters Post
-0.0155 (0.0571)
-0.00302 (0.00631)
ZIP+4 Links to Revenue Officer Visit Firms * Four Quarters Post
0.0146 (0.0654)
-0.000572 (0.00734)
ZIP+4 Links to Soft Letter Firms * One Quarter Post
-0.0164 (0.0560)
-0.00469 (0.00619)
ZIP+4 Links to Soft Letter Firms * Two Quarters Post
-0.0510 (0.0474)
-0.00748 (0.00536)
ZIP+4 Links to Soft Letter Firms * Three Quarters Post
-0.119 (0.0539)
-0.0139 (0.00628)

34
ZIP+4 Links to Soft Letter Firms * Four Quarters Post
-0.0847 (0.0629)
-0.0123 (0.00770)
Firm Fixed Effects Yes Yes Quarter Fixed Effects Yes Yes Quarter * Total ZIP+4 Links to Alert C Fixed Effects
Yes Yes
Firms 32305 32305 ZIP+4 Clusters 5916 5916 Observations 290745 290745 R-Squared .0101197 .0104488
Notes: Standard errors (in parentheses) clustered by ZIP+4. The omitted reference quarter is the quarter in which treatment assignment took place, Q4 2014. Tax remitted refers to Form 941-related tax deposits during a calendar quarter.
Source: Author calculations.
TABLE 8—ZIP CODE NETWORK EFFECTS
Log(Tax Remitted + 1) Probability of Remitting Any Tax: Linear Probability
Model ZIP Code Links to Revenue Officer Visit Firms * One Quarter Post
0.00317 (0.00303)
0.000318 (0.000348)
ZIP Code Links to Revenue Officer Visit Firms * Two Quarters Post
0.000639 (0.00318)
-0.0000109 (0.000355)
ZIP Code Links to Revenue Officer Visit Firms * Three Quarters Post
-0.000404 (0.00400)
-0.000154 (0.000419)
ZIP Code Links to Revenue Officer Visit Firms * Four Quarters Post
0.00123 (0.00406)
0.000160 (0.000445)
ZIP Code Links to Soft Letter Firms * One Quarter Post
-0.000109 (0.00288)
-0.0000123 (0.000319)
ZIP Code Links to Soft Letter Firms * Two Quarters Post
-0.00104 (0.00299)
-0.0000987 (0.000329)
ZIP Code Links to Soft Letter Firms * Three Quarters Post
0.000642 (0.00392)
0.000144 (0.000422)
ZIP Code Links to Soft Letter Firms * Four Quarters Post
0.00157 (0.00415)
0.000210 (0.000470)
Firm Fixed Effects Yes Yes Quarter Fixed Effects Yes Yes Quarter * Total ZIP Code Links to Alert C Fixed Effects
Yes Yes
Firms 3535438 3535438 ZIP Code Clusters 7136 7136 Observations 3.18e+07 3.18e+07 R-Squared .0054075 .0061926
Notes: Standard errors (in parentheses) clustered by ZIP Code. The omitted reference quarter is the quarter in which treatment assignment took place, Q4 2014. Tax remitted refers to Form 941-related tax deposits during a calendar quarter.
Source: Author calculations.
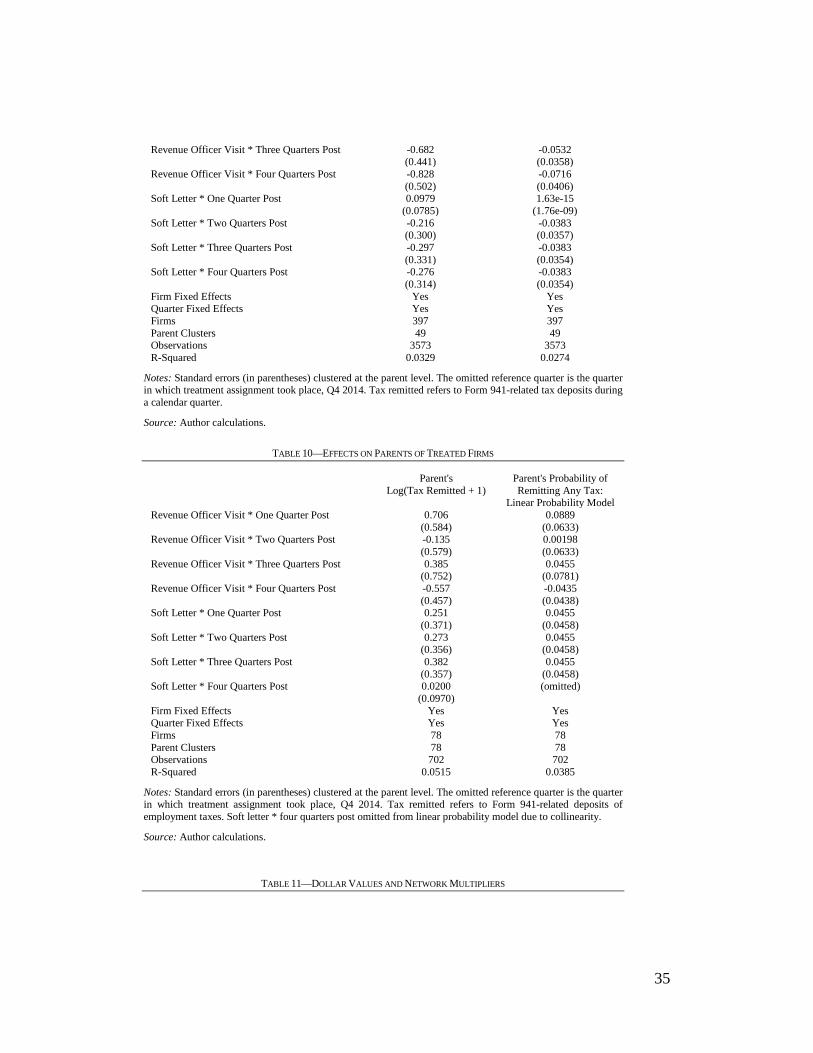
TABLE 9—EFFECTS ON SUBSIDIARIES OF TREATED FIRMS
Subsidiary's Log(Tax Remitted + 1)
Subsidiary’s Probability of Remitting Any Tax:
Linear Probability Model Revenue Officer Visit * One Quarter Post -0.0753
(0.0160) -0.00917 (0.00323)
Revenue Officer Visit * Two Quarters Post -0.532 (0.362)
-0.0441 (0.0309)
35
Revenue Officer Visit * Three Quarters Post -0.682 (0.441)
-0.0532 (0.0358)
Revenue Officer Visit * Four Quarters Post -0.828 (0.502)
-0.0716 (0.0406)
Soft Letter * One Quarter Post 0.0979 (0.0785)
1.63e-15 (1.76e-09)
Soft Letter * Two Quarters Post -0.216 (0.300)
-0.0383 (0.0357)
Soft Letter * Three Quarters Post -0.297 (0.331)
-0.0383 (0.0354)
Soft Letter * Four Quarters Post -0.276 (0.314)
-0.0383 (0.0354)
Firm Fixed Effects Yes Yes Quarter Fixed Effects Yes Yes Firms 397 397 Parent Clusters 49 49 Observations 3573 3573 R-Squared 0.0329 0.0274
Notes: Standard errors (in parentheses) clustered at the parent level. The omitted reference quarter is the quarter in which treatment assignment took place, Q4 2014. Tax remitted refers to Form 941-related tax deposits during a calendar quarter.
Source: Author calculations.
TABLE 10—EFFECTS ON PARENTS OF TREATED FIRMS
Parent's Log(Tax Remitted + 1)
Parent's Probability of Remitting Any Tax:
Linear Probability Model Revenue Officer Visit * One Quarter Post 0.706
(0.584) 0.0889
(0.0633) Revenue Officer Visit * Two Quarters Post -0.135
(0.579) 0.00198 (0.0633)
Revenue Officer Visit * Three Quarters Post 0.385 (0.752)
0.0455 (0.0781)
Revenue Officer Visit * Four Quarters Post -0.557 (0.457)
-0.0435 (0.0438)
Soft Letter * One Quarter Post 0.251 (0.371)
0.0455 (0.0458)
Soft Letter * Two Quarters Post 0.273 (0.356)
0.0455 (0.0458)
Soft Letter * Three Quarters Post 0.382 (0.357)
0.0455 (0.0458)
Soft Letter * Four Quarters Post 0.0200 (0.0970)
(omitted)
Firm Fixed Effects Yes Yes Quarter Fixed Effects Yes Yes Firms 78 78 Parent Clusters 78 78 Observations 702 702 R-Squared 0.0515 0.0385
Notes: Standard errors (in parentheses) clustered at the parent level. The omitted reference quarter is the quarter in which treatment assignment took place, Q4 2014. Tax remitted refers to Form 941-related deposits of employment taxes. Soft letter * four quarters post omitted from linear probability model due to collinearity.
Source: Author calculations.
TABLE 11—DOLLAR VALUES AND NETWORK MULTIPLIERS
36
Mean
amount before
treatment + 1
Coefficient Factor
Dollar value per
linked firm
Linked firms per Alert C
firm
Dollar value per visit or letter
Network Multiplier
Panel A. Revenue Officer Visit
Direct Effect $39,071 2.761 $107,878 (15311)
1 $107,878 (15311)
1
Effect of Shared Preparer
$31,272 0.03 $880 (498)
16.404 $14,437 (8169)
0.13
Effect on Subsidiary
$4,647,757 -0.0725 -$337,007 (69063)
0.033 -$10,992 (2252)
-0.10
Total
$111,324 (25733)
1.03
Panel B. Soft Letter
Direct Effect $39,071 0.338 $13,196 (5237)
1 $13,196 (5237)
1
Total
$13,196 (5237)
1
Notes: Mean amount before treatment is the mean tax remitted one quarter before treatment in the Alert C population for direct effects or in the relevant linked population for network effects. The coefficient factor is exp(estimated coefficient) – 1 for direct effects and subsidiary effect and exp(estimated effect * average number of links to Alert C conditional on at least one link) – 1 for the tax preparer network effect, where the average number of links conditional on at least one link is 1.39. The relevant coefficients come from Table 4 for direct effects, Table 5 for the shared preparer network effect, and Table 9 for the subsidiary effect. Delta method standard errors in parentheses.
Source: Author calculations.
FIGURE 1. MEAN OF LOG(TAX REMITTED + 1) BY TREATMENT GROUP
Notes: Tax Remitted is Form 941-related deposits of employment taxes.
Source: Author calculations.
37
FIGURE 2. PROBABILITY OF REMITTING ANY TAX BY TREATMENT GROUP
Notes: Tax Remitted is Form 941-related deposits of employment taxes.
Source: Author calculations.
FIGURE 3. DIRECT EFFECT OF REVENUE OFFICER VISIT ON LOG(TAX REMITTED + 1)
Notes: Dashed lines indicate 90% and 95% confidence intervals. Tax Remitted is Form 941-related deposits of employment taxes.
Source: Author calculations.

38
FIGURE 4. DIRECT EFFECT OF REVENUE OFFICER VISIT ON PROBABILITY OF REMITTING ANY TAX
Notes: Dashed lines indicate 90% and 95% confidence intervals. Tax Remitted is Form 941-related deposits of employment taxes.
Source: Author calculations.
FIGURE 5. DIRECT EFFECT OF SOFT LETTER ON LOG(TAX REMITTED + 1)
Notes: Dashed lines indicate 90% and 95% confidence intervals. Tax Remitted is Form 941-related deposits of employment taxes.
39
Source: Author calculations.
FIGURE 6. DIRECT EFFECT OF SOFT LETTER ON PROBABILITY OF REMITTING ANY TAX
Notes: Dashed lines indicate 90% and 95% confidence intervals. Tax Remitted is Form 941-related deposits of employment taxes.
Source: Author calculations.