healthy homes for all: improving children’s health in diverse communities university of...
TRANSCRIPT

Healthy Homes for All: Improving Children’s Health in Diverse Communities
University of Massachusetts Lowell UMass Medical SchoolDavid Turcotte, ScD Heather Alker, MD, MPH Emily Chaves, MASusan Woskie, PhD Worcester State UniversityRebecca Gore, PhD Stephanie Chalupka, EdD Fred Youngs, PhDJoann Vaillette, MA Lowell Community Health Center
Carla Caraballo Bophamony Vong
Presenter Disclosures David Turcotte, ScDJoann Vaillette, MAEmily Chaves, MASusan Woskie, PhDRebecca Gore, PhDFred Youngs, PhDHeather Alker, MD, MPH Carla Caraballo Bophamony Vong
“No relationships to disclose”

Funded by the U.S. Department of Housing and Urban Development
Why asthma? Why Lowell?– High asthma rate– Diverse community– Poor housing stock– Community health partners
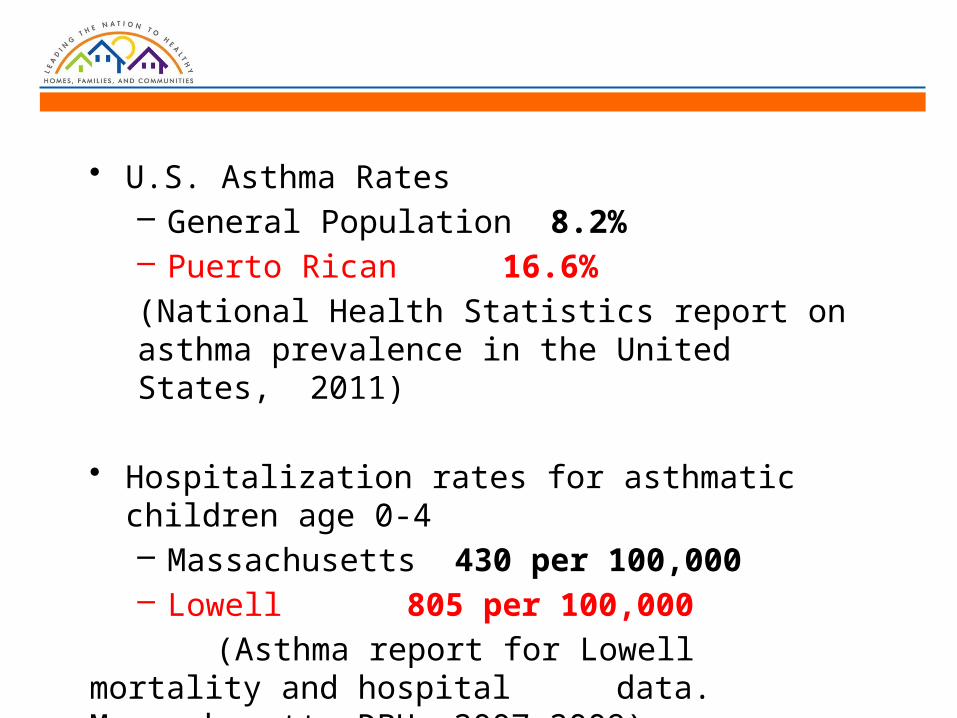
• U.S. Asthma Rates– General Population 8.2%– Puerto Rican 16.6%
(National Health Statistics report on asthma prevalence in the United States, 2011)
• Hospitalization rates for asthmatic children age 0-4– Massachusetts 430 per 100,000– Lowell 805 per 100,000
(Asthma report for Lowell mortality and hospital data. Massachusetts DPH, 2007-2009)

Project Goals:
Families First time home buyers
Home assessments Education
Home interventions
Education
Partners
Education
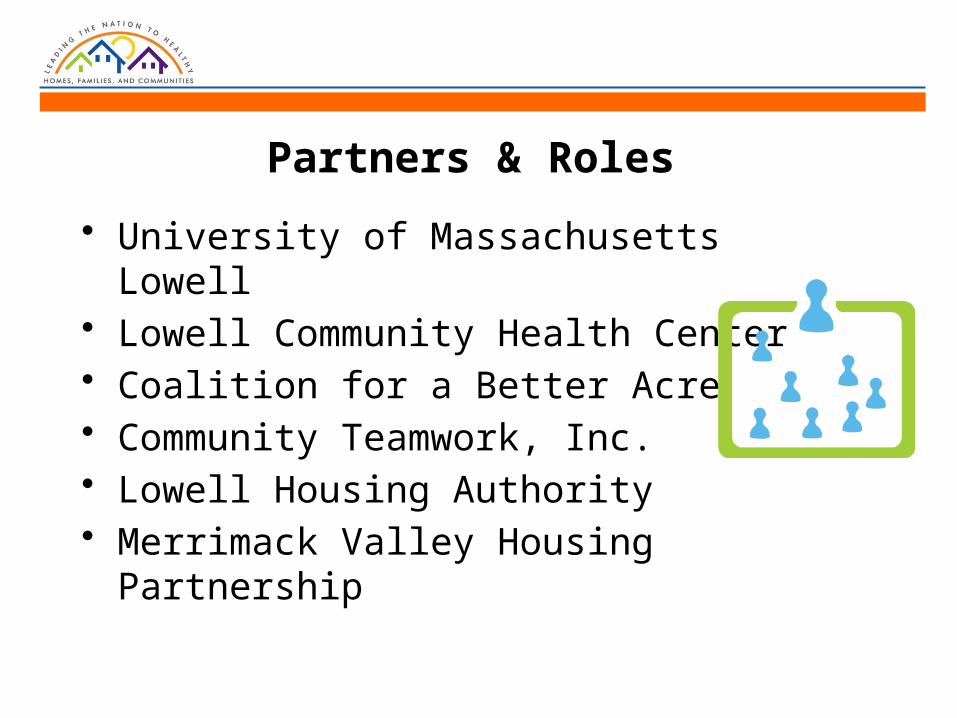
Partners & Roles
• University of Massachusetts Lowell• Lowell Community Health Center• Coalition for a Better Acre• Community Teamwork, Inc.• Lowell Housing Authority• Merrimack Valley Housing Partnership
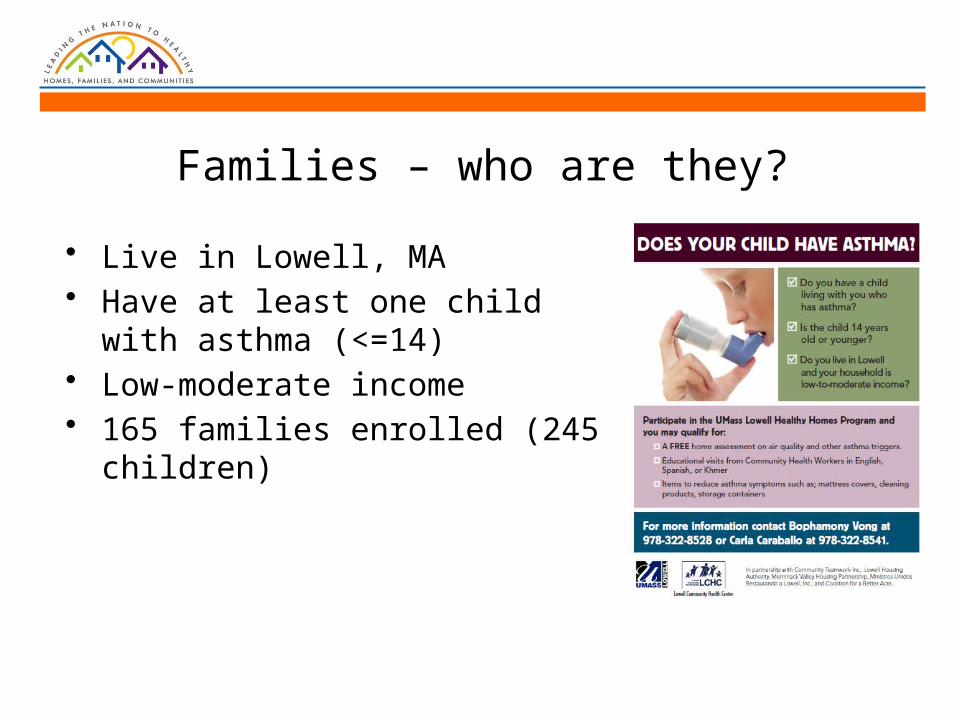
Families – who are they?
• Live in Lowell, MA• Have at least one child with asthma
(<=14)• Low-moderate income • 165 families enrolled (245 children)
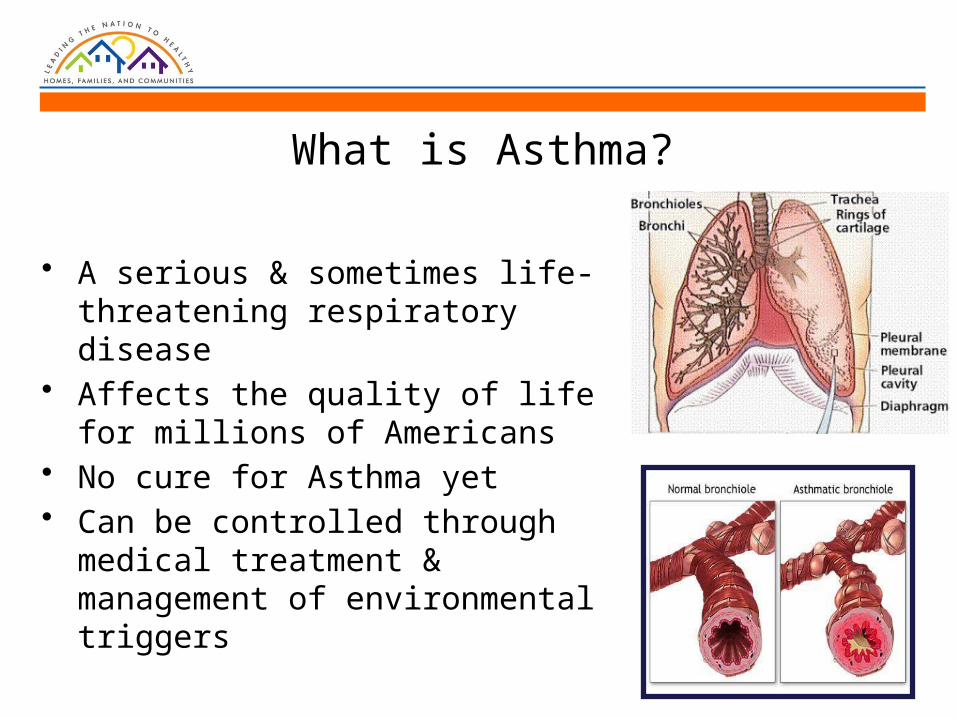
What is Asthma?
• A serious & sometimes life-threatening respiratory disease
• Affects the quality of life for millions of Americans
• No cure for Asthma yet• Can be controlled through medical
treatment & management of environmental triggers
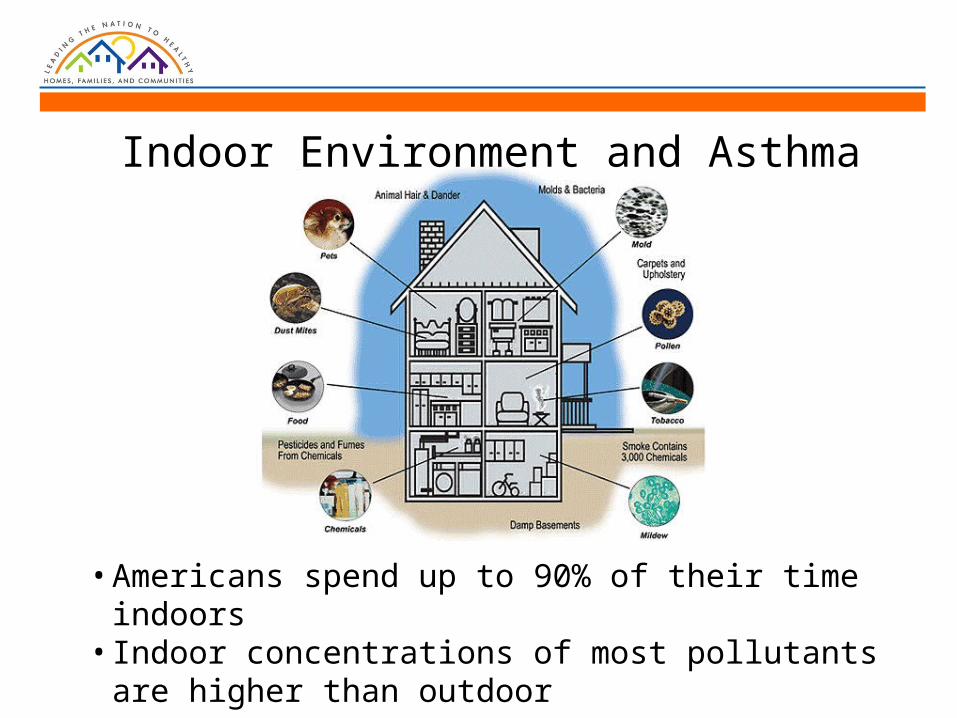
• Americans spend up to 90% of their time indoors• Indoor concentrations of most pollutants are higher
than outdoor
Indoor Environment and Asthma
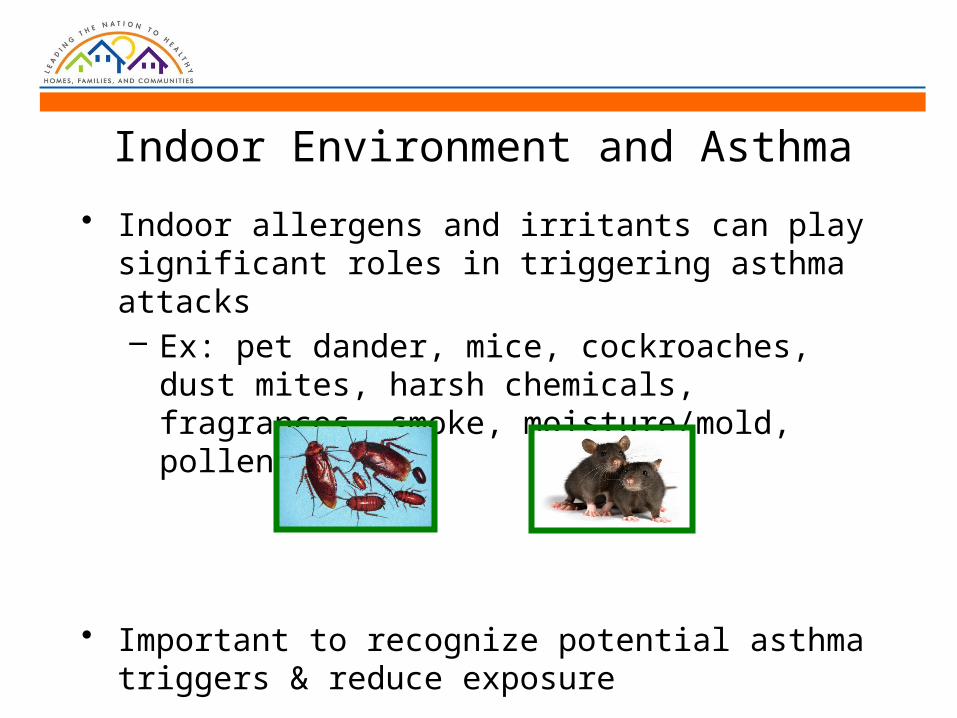
Indoor Environment and Asthma
• Indoor allergens and irritants can play significant roles in triggering asthma attacks– Ex: pet dander, mice, cockroaches, dust mites,
harsh chemicals, fragrances, smoke, moisture/mold, pollen
• Important to recognize potential asthma triggers & reduce exposure
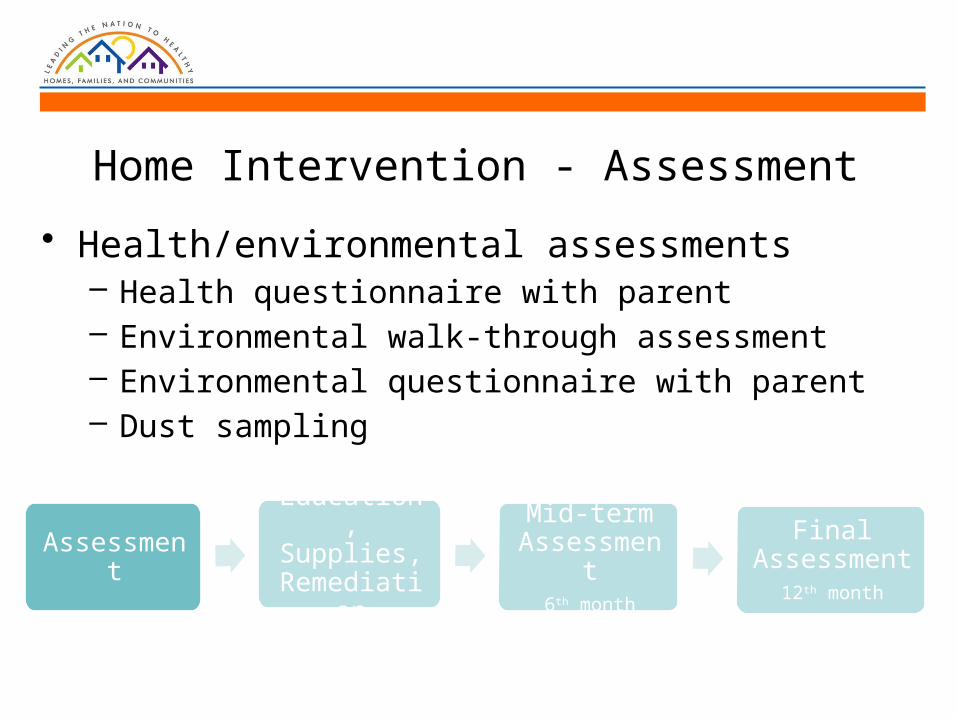
Home Intervention - Assessment
• Health/environmental assessments– Health questionnaire with parent– Environmental walk-through assessment– Environmental questionnaire with parent– Dust sampling
AssessmentEducation, Supplies,
Remediation
Mid-term Assessment
6th month
Final Assessment
12th month
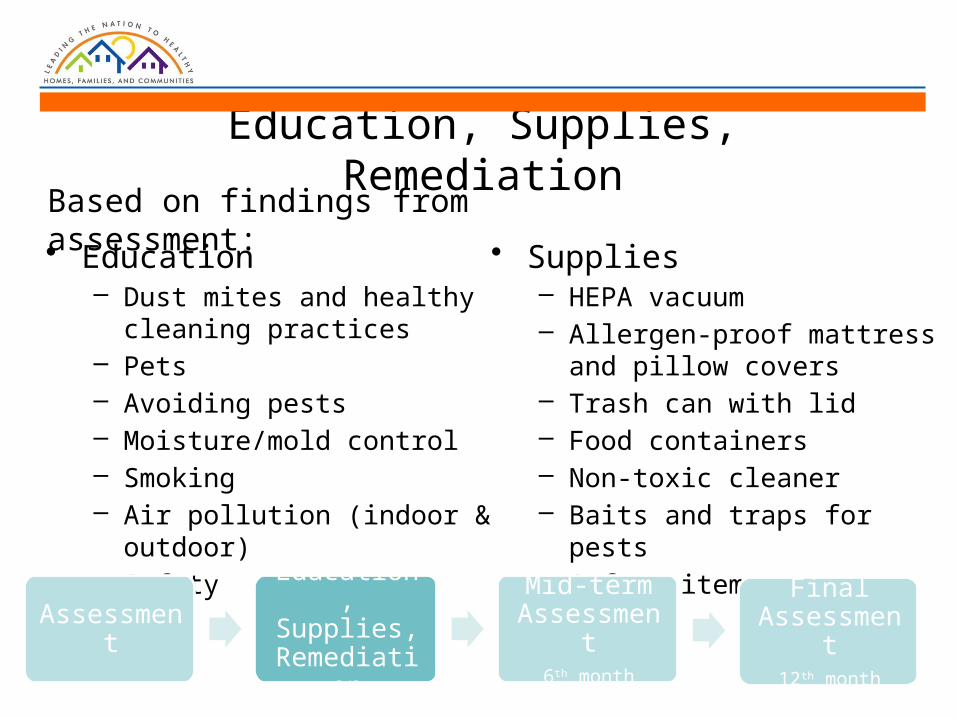
Education, Supplies, Remediation
• Education– Dust mites and healthy
cleaning practices– Pets– Avoiding pests– Moisture/mold control– Smoking– Air pollution (indoor & outdoor)– Safety
• Supplies– HEPA vacuum– Allergen-proof mattress and
pillow covers– Trash can with lid– Food containers– Non-toxic cleaner– Baits and traps for pests– Safety items
AssessmentEducation, Supplies,
Remediation
Mid-term Assessment
6th month
Final Assessment
12th month
Based on findings from assessment:
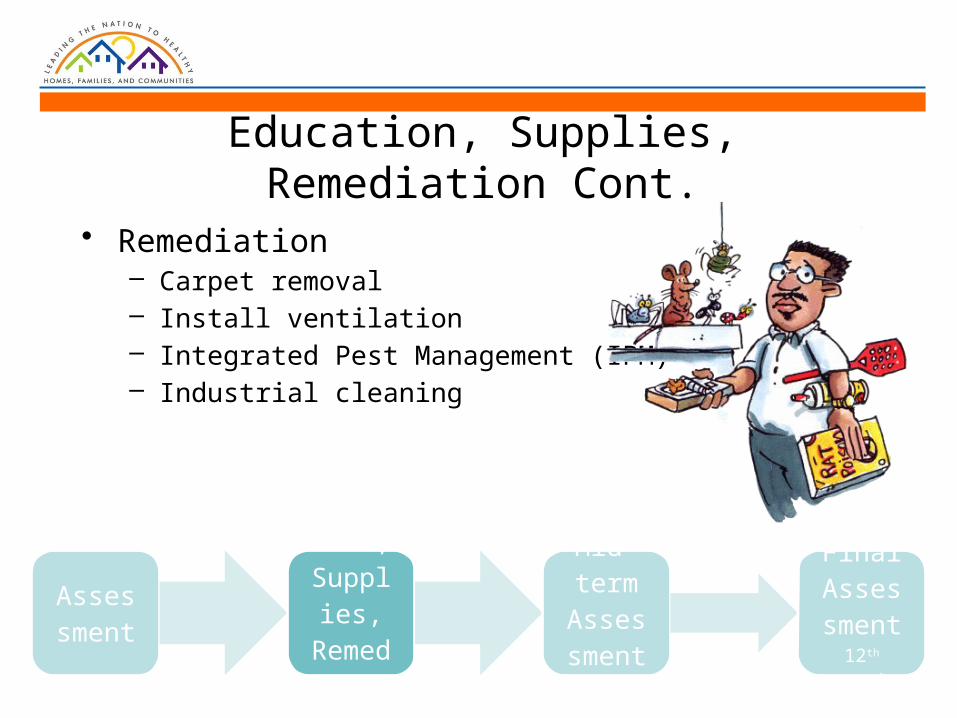
Education, Supplies, Remediation Cont.
• Remediation– Carpet removal– Install ventilation– Integrated Pest Management (IPM)– Industrial cleaning
Assessment
Education,
Supplies,
Remediation
Mid-term
Assessment
6th month
Final Assessment
12th month

Mid-term Assessment• Health questionnaire (abbreviated)• Environmental questionnaire (abbreviated)• More supplies if needed• Reinforce education
Assessment
Education,
Supplies,
Remediation
Mid-term
Assessment
6th month
Final Assessment
12th month

Final Assessment
• Health questionnaire• Environmental questionnaire• Environmental walk-through• Gift certificate
Assessment
Education,
Supplies,
Remediation
Mid-term
Assessment
6th month
Final Assessment
12th month
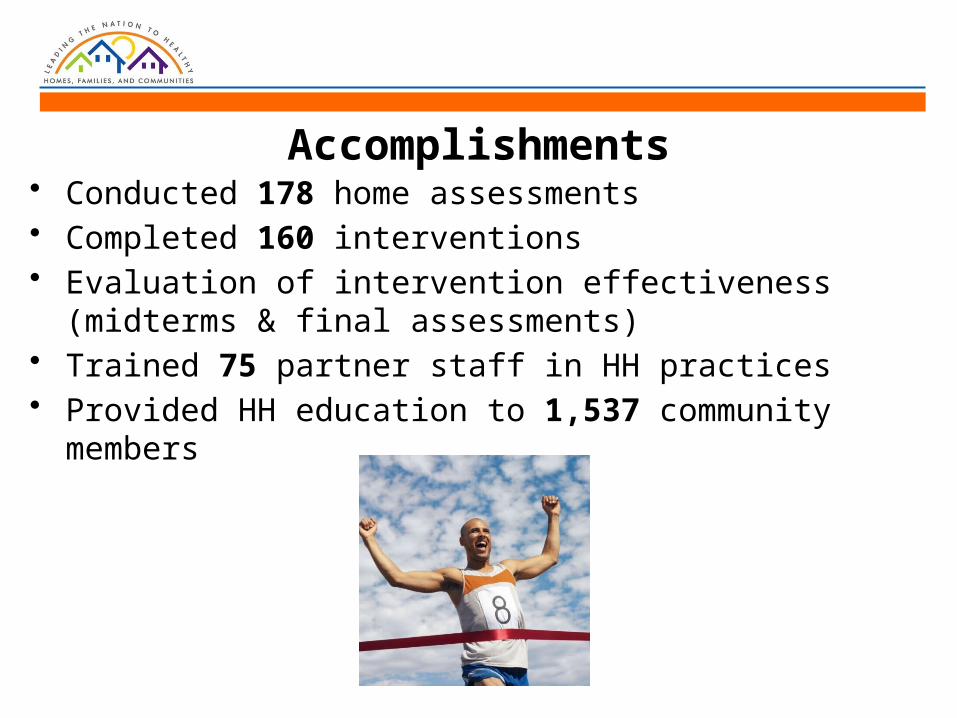
Accomplishments • Conducted 178 home assessments• Completed 160 interventions• Evaluation of intervention effectiveness (midterms & final
assessments)• Trained 75 partner staff in HH practices• Provided HH education to 1,537 community members
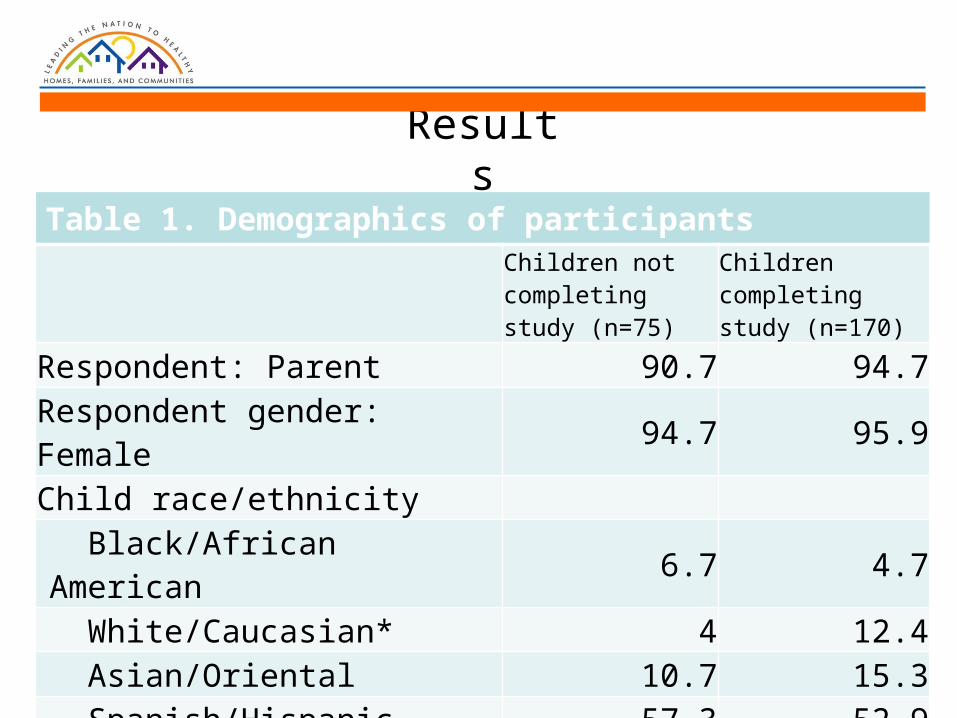
Results
Table 1. Demographics of participantsChildren not completing study (n=75)
Children completing study (n=170)
Respondent: Parent 90.7 94.7Respondent gender: Female 94.7 95.9Child race/ethnicity Black/African American 6.7 4.7 White/Caucasian* 4 12.4 Asian/Oriental 10.7 15.3 Spanish/Hispanic 57.3 52.9 Other 21.3 14.7
Child gender: Male 54.7 59.4
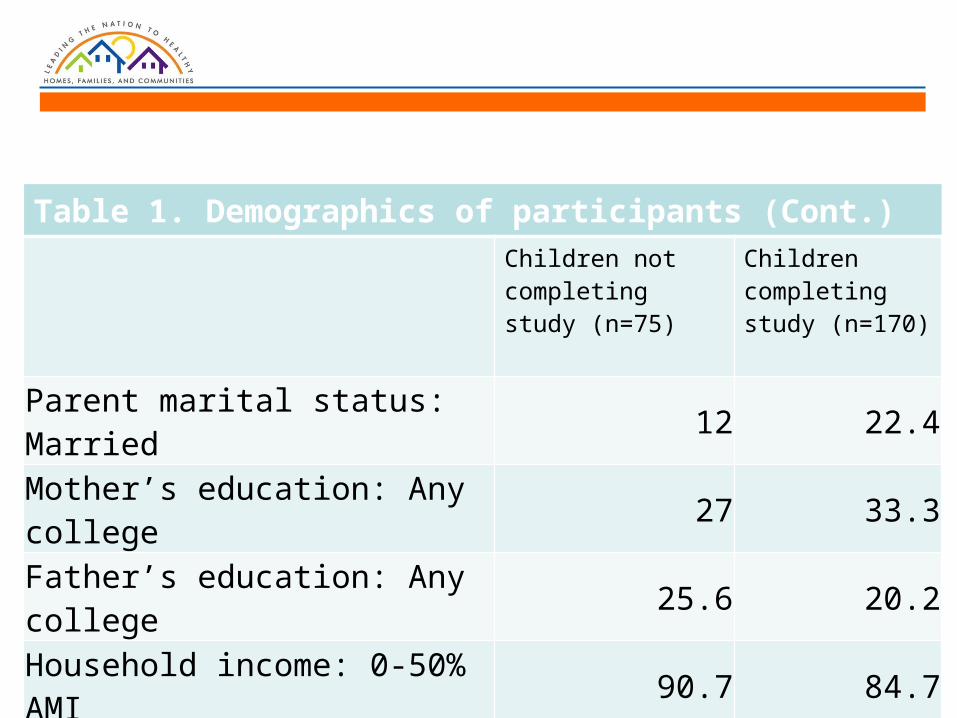
Table 1. Demographics of participants (Cont.)Children not completing study (n=75)
Children completing study (n=170)
Parent marital status: Married 12 22.4Mother’s education: Any college 27 33.3Father’s education: Any college 25.6 20.2Household income: 0-50% AMI 90.7 84.7Smoker in primary home 13.3 16.5High risk asthma group 44 38.2Child age (mean) 5.97 6.08
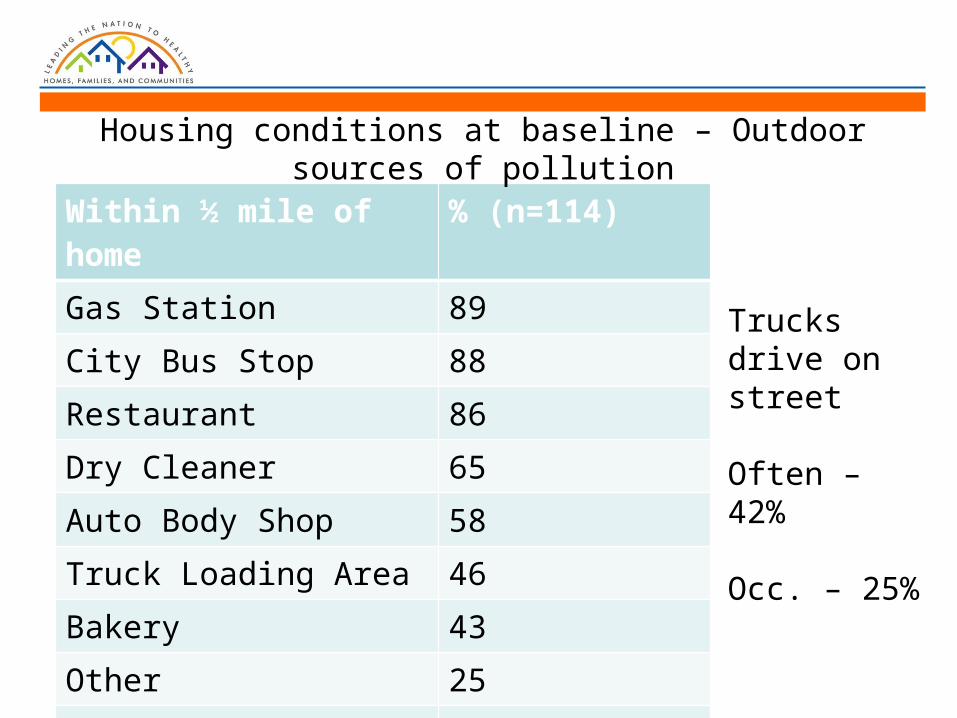
Within ½ mile of home % (n=114)
Gas Station 89
City Bus Stop 88
Restaurant 86
Dry Cleaner 65
Auto Body Shop 58
Truck Loading Area 46
Bakery 43
Other 25
Furniture Refinisher 5
Housing conditions at baseline – Outdoor sources of pollution
Trucks drive on street
Often – 42%
Occ. – 25%
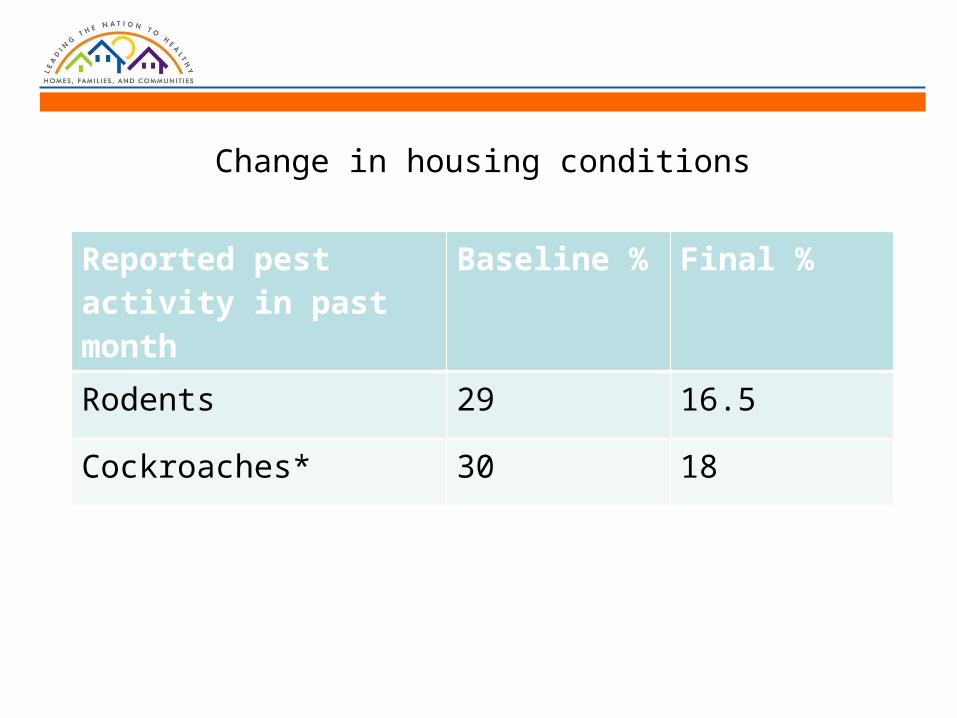
Reported pest activity in past month
Baseline % Final %
Rodents 29 16.5
Cockroaches* 30 18
Change in housing conditions
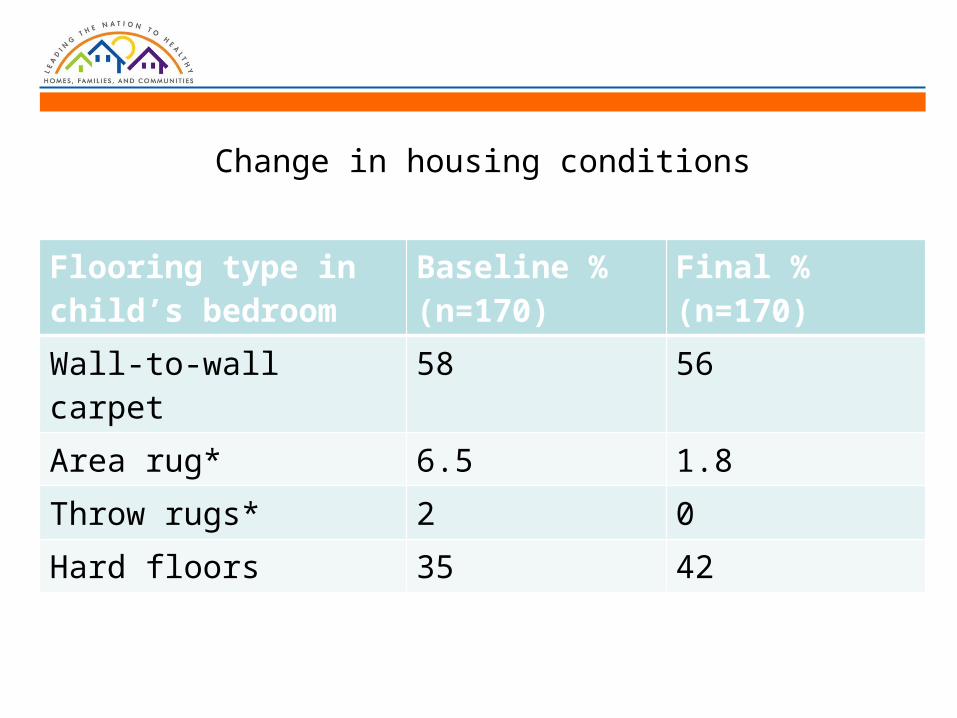
Change in housing conditions
Flooring type in child’s bedroom
Baseline % (n=170)
Final % (n=170)
Wall-to-wall carpet 58 56
Area rug* 6.5 1.8
Throw rugs* 2 0
Hard floors 35 42
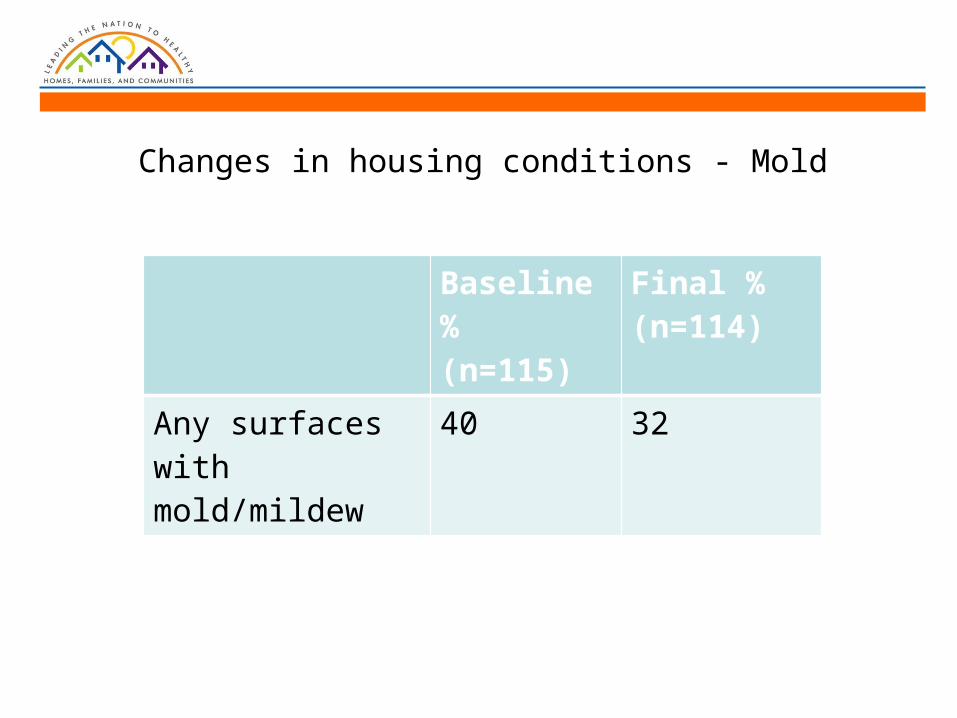
Baseline % (n=115)
Final % (n=114)
Any surfaces with mold/mildew
40 32
Changes in housing conditions - Mold
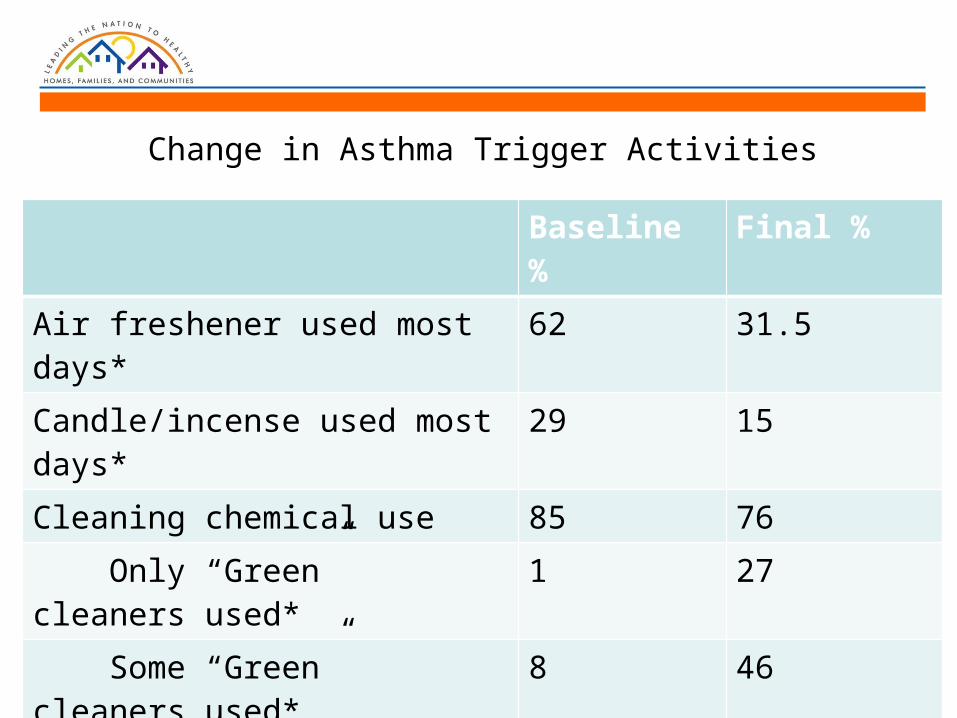
Change in Asthma Trigger Activities
Baseline % Final %
Air freshener used most days* 62 31.5
Candle/incense used most days* 29 15
Cleaning chemical use 85 76
Only “Green” cleaners used* 1 27
Some “Green” cleaners used* 8 46
Own HEPA vacuum cleaner* 9 98
Mattress and pillow covers* 0 96
Wash linens in hot water* 66 89
Dry linens with hot air* 98 100
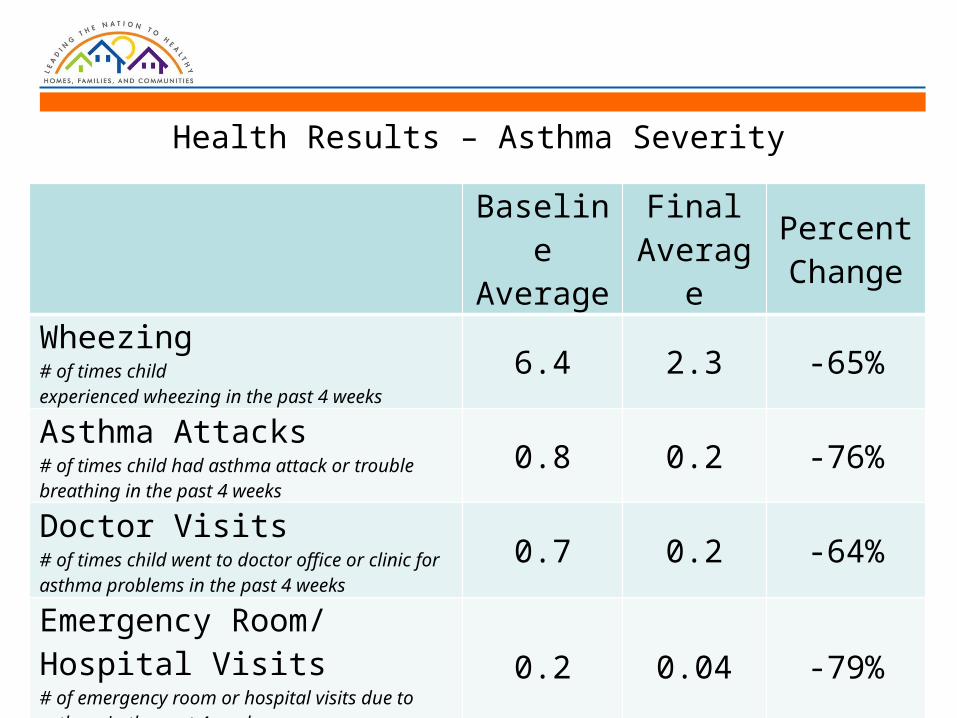
Health Results – Asthma Severity
Baseline Average
Final Average
Percent Change
Wheezing# of times child experienced wheezing in the past 4 weeks
6.4 2.3 -65%
Asthma Attacks# of times child had asthma attack or trouble breathing in the past 4 weeks
0.8 0.2 -76%
Doctor Visits# of times child went to doctor office or clinic for asthma problems in the past 4 weeks
0.7 0.2 -64%
Emergency Room/Hospital Visits # of emergency room or hospital visits due to asthma in the past 4 weeks
0.2 0.04 -79%
n=170
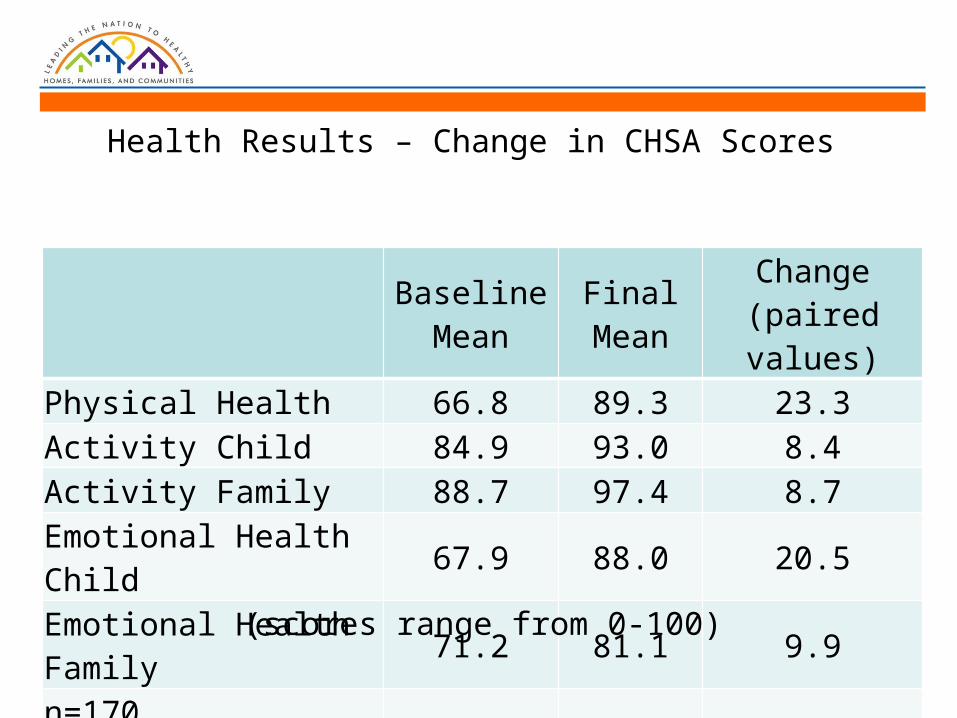
Health Results – Change in CHSA Scores
Baseline Mean
Final Mean
Change(paired values)
Physical Health 66.8 89.3 23.3Activity Child 84.9 93.0 8.4Activity Family 88.7 97.4 8.7Emotional Health Child 67.9 88.0 20.5Emotional Health Family 71.2 81.1 9.9
n=170
(scores range from 0-100)
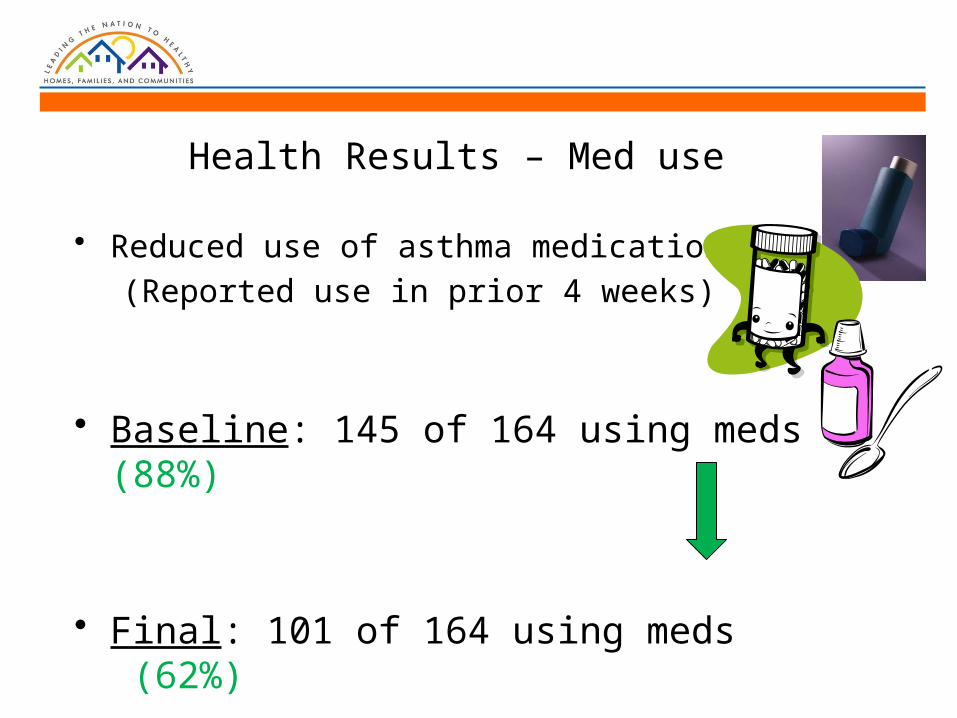
Health Results – Med use
• Reduced use of asthma medication
(Reported use in prior 4 weeks)
• Baseline: 145 of 164 using meds (88%)
• Final: 101 of 164 using meds (62%)
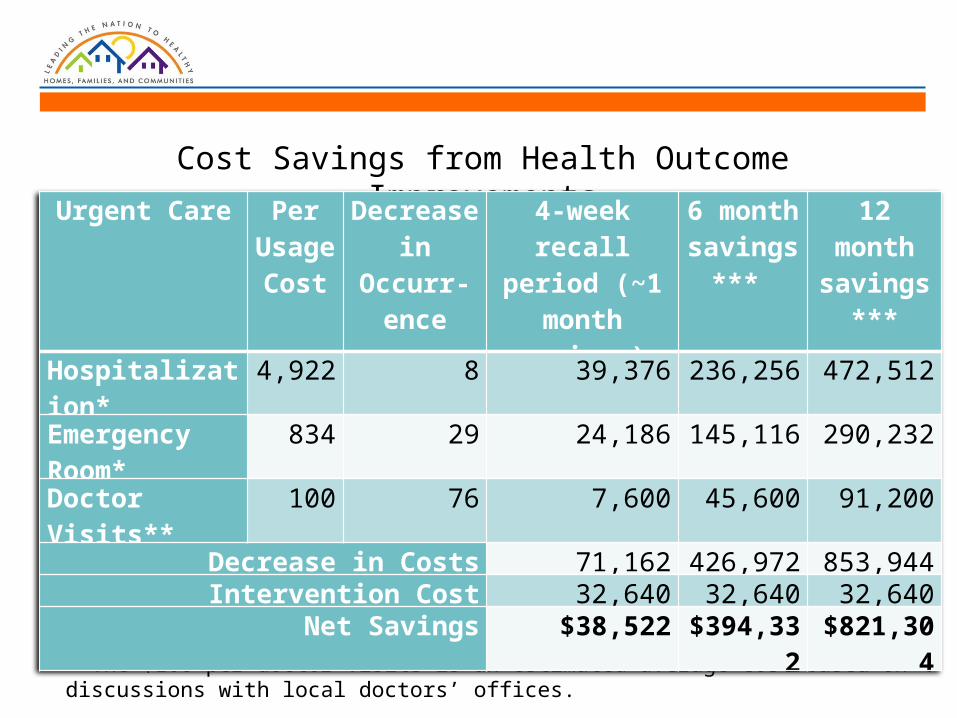
*The hospitalization and ER data was provided by the MA Department of Public Health assessment of average charges in Lowell in 2010 due to usage because of asthma. **The $100 per doctor visits is an estimated average cost based on discussions with local doctors’ offices.
Cost Savings from Health Outcome Improvements
Urgent Care Per Usage Cost
Decrease in Occurr-
ence
4-week recall period (~1
month savings)
6 month savings*
**
12 month savings*
**
Hospitalization*
4,922 8 39,376 236,256 472,512
Emergency Room*
834 29 24,186 145,116 290,232
Doctor Visits** 100 76 7,600 45,600 91,200Decrease in Costs 71,162 426,972 853,944Intervention Cost 32,640 32,640 32,640
Net Savings $38,522 $394,332 $821,304
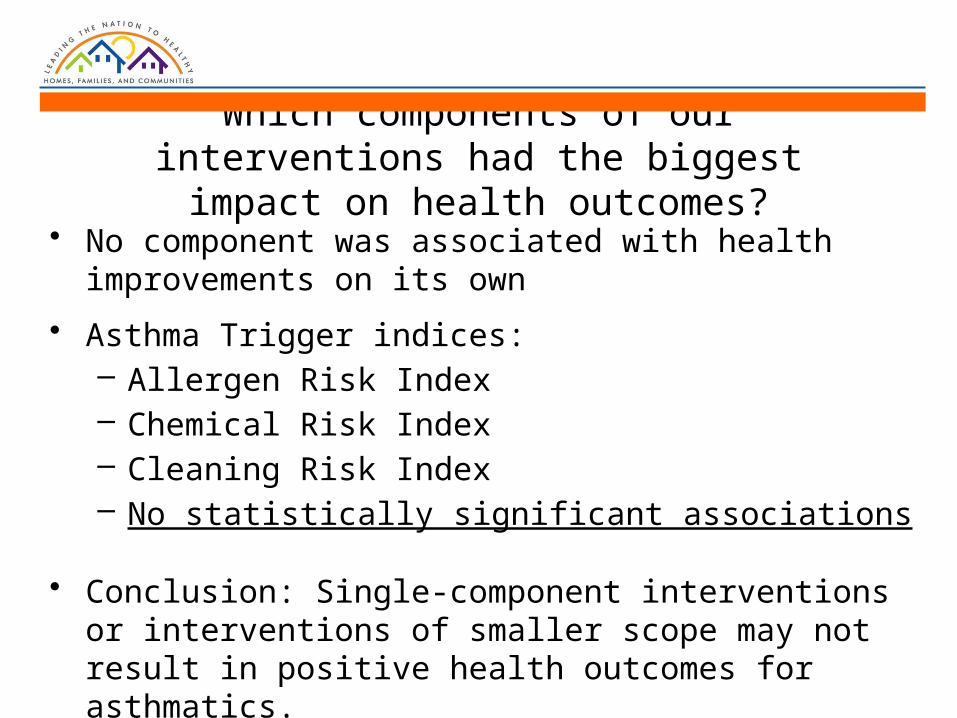
Which components of our interventions had the biggest impact on health outcomes?
• No component was associated with health improvements on its own
• Asthma Trigger indices:– Allergen Risk Index– Chemical Risk Index– Cleaning Risk Index– No statistically significant associations
• Conclusion: Single-component interventions or interventions of smaller scope may not result in positive health outcomes for asthmatics.

Allergen Risk Index• Any pet• Pet in bedroom• Rug
(wall to wall or area)• Mold• Rodents• Cockroach• Feather bedding• No allergen pillow cover• No allergen mattress
cover
Chemical Risk Index• Use air freshener• Use candles• Use cleaning chem.
most days• Used pesticides in past
month• Smoking• Professional rug
cleaning*• Gas stove*
Cleaning Risk Index• Infrequent dusting in
child’s room • Infrequent mopping in
child’s room• Wash linens• Does not wash linens in
hot water• Does not dry linens with
hot air• Food debris in kitchen*
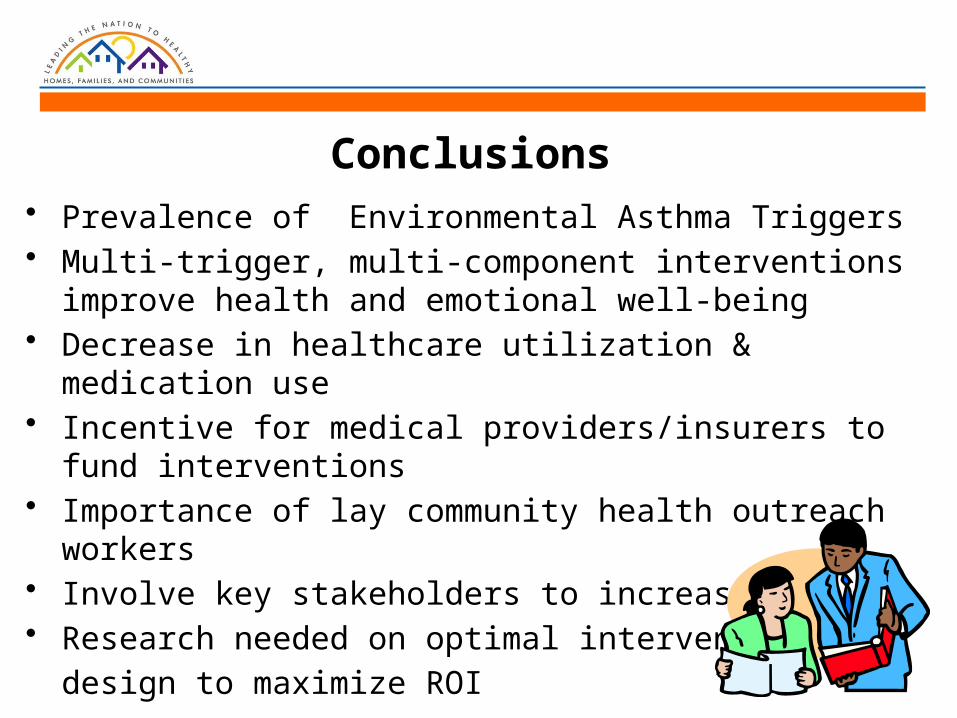
Conclusions• Prevalence of Environmental Asthma Triggers• Multi-trigger, multi-component interventions improve health
and emotional well-being• Decrease in healthcare utilization & medication use• Incentive for medical providers/insurers to fund
interventions • Importance of lay community health outreach workers• Involve key stakeholders to increase impact• Research needed on optimal intervention
design to maximize ROI

Contact Information
David Turcotte, Sc.D.
University of Massachusetts Lowell
Email: [email protected]
Telephone: (978) 934-4682
Emily Chaves, M.A.
University of Massachusetts Lowell
Email: [email protected]
Telephone: (978) 934-4778