healthy dupage tapestrydupage - iwociwoc.org/resources/samples/oatfield-jennifer-1.pdf · my...
TRANSCRIPT

DuPage TapestryInterrelated Factors
Affecting a Healthy DuPage

DuPage Tapestry 2001 Interrelated Factors Affecting a Healthy DuPage
Prepared by HEALTHY DUPAGE
with the assistance of and for the people
of DuPage County
$25.00
Mr. C. William Pollard, ChairChairmanThe ServiceMaster CompanyOne ServiceMaster WayDowners Grove, IL 60515PHONE: 630/271-1300FAX: 630/271-5870
Ms. Betty M. Cheever, Vice Chair1208 Blanchard Downers Grove, IL 60516PHONE: 630/969-4725FAX: 630/969-7165
Mr. Donald C. Sibery, TreasurerPresident and CEOCentral DuPage Health27W353 Jewell RoadWinfield, IL 60190PHONE: 630/933-5500FAX: 630/933-1800
Ms. Barbara M. Stankus, SecretaryPresidentUnited Way of Suburban Chicago900 Jorie Boulevard, Suite 260Oak Brook, IL 60523 PHONE: 630/954-1200 FAX: 630/954-4083
Mr. Cleve E. CarneyBoard PresidentThe DuPage Community Foundation708 Lenox RoadGlen Ellyn, IL 60137PHONE: 630/655-5556FAX: 630/469-3070
Reverend Robert K. DavisExecutive DirectorLOVE Christian ClearinghouseP.O. Box 50Clarendon Hills, IL 60514PHONE: 630/512-8673FAX: 630/512-8675
Mr. Chris J. EllermanExecutive DirectorOutreach Community Ministries122 West Liberty DriveWheaton, IL 60187PHONE: 630/682-1910FAX: 630/682-3094
Ms. Maxine HansenConservation Foundation200 Wyndemere Circle, Apt. E316Wheaton, IL 60187PHONE: 630/752-4110FAX: 630/690-6004
Mr. Roger K. JohnsonExecutive DirectorMetropolitan Family Services DuPage222 E. Willow Ave.Wheaton, IL 60187PHONE: 630/682-1802FAX: 630/682-5276
Most Reverend Roger L. KafferAuxiliary BishopDiocese of Joliet425 SummitJoliet, IL 60435PHONE: 815/722-6606FAX: 815/722-6602
The Honorable Linda A. KurzawaDuPage County Board421 North County Farm RoadWheaton, IL 60187PHONE: 630/682-7993VM: 603-5325FAX: 630/682-7571
Mr. Leland LewisExecutive DirectorDuPage County Health Dept.111 N. County Farm RoadWheaton, IL 60187PHONE: 630/682-7979 X7048FAX: 630/462-9261
Dr. Michael T. MurphyPresidentCollege of DuPage425 22nd StreetGlen Ellyn, IL 60137PHONE: 630/942-2200FAX: 630/858-2869
Ms. Shirley MyersChairmanElmhurst Senior Citizens Commission296 AdeliaElmhurst, IL 60126PHONE: 630/834-2025FAX: 630/834-1408
Ms. Ann S. NeradCommunity Leader420 East Fourth StreetHinsdale, IL 60521PHONE: 630/986-1800 FAX: 630/986-0016
Healthy DuPage Board of Directors
The Healthy DuPage Board of Directorsis composed of respected and knowledgeable community leaders.Its charge is to oversee the healthycommunities initiative and to ensurethat the vision, values, and integrityof the process are upheld. The Boardadds “voice” to the community byusing their gifts, talents, and influenceto create the positive changes neededto measurably improve our health andwell-being.
2

3
Mr. Kenneth C. RobbinsPresidentIllinois Hospital and HealthSystem Assoc.1151 East Warrenville RoadNaperville, IL 60563PHONE: 630/505-7777FAX: 630/505-4237
Ms. Margo E. SchreiberDirectorIllinois Department on Aging421 East Capital Springfield, IL 62701PHONE: 217/785-2870FAX: 217/785-4477
Phil SmithDirector of Human ServicesDuPage County Human Services421 County Farm RoadWheaton, IL 60187PHONE: 630/682-6918FAX: 630/682-7382
Ms. Bonnie J. WoodExecutive DirectorEWCCA1120 East Diehl Road, Suite 140Naperville, IL 60563PHONE: 630/505-7730FAX: 630/505-7732
StaffDonell Bullock, M.P.H.Executive Director
Deborah Krull, M.A.Director of Initiatives
Bette Lawrence-Water, M.S.Director of Administration
Former Board MembersJulia A. Dyer, M.D., M.P.H.
Addy Bonet
Honorable Robert E. Byrne
Honorable Judge Michael R. Galasso
Ret. Cheif George P. Graves
Josephine Herrera
Douglas B. Mains, M.D.
David R. McNutt, M.D., M.P.H.
William F. Renner
David A. Thomas
A. Louis Petriz
continued
Richard Endress, Vice President, Planning and Market Accountability, Central DuPage Health
Tim Fluck, Policy Director, DuPage Mayors and Managers Conference
James Hagen, Deputy Executive Director, DuPage County Health Department
Mary Beth Hardy, Director of Healthy Communities, Advocate Good Samaritan Hospital
Rev. John Hildner, Chaplain, DuPage Convalescent Center
Phil Smith, Administrator of Human Services, DuPage County Division of Human Services
Donell Bullock, Executive Director, Healthy DuPage
The Indicator Task Force mandate is tocreate a useable tool that will function asa resource for groups and organizationsacross the county, helping to keep allgroups informed of the current trendswithin the community.
Indicator Task Force
4
5
As a business leader, I believe that businesses have a responsibility
to take an active role in their communities. Businesses supply jobs,
revenue, and an economic resource that supports quality of life.
However, that is not enough to ensure our employees lead rich,
fulfilling, and productive lives. Communities supply the homes,
social structures, and the spiritual base that allow employees and
their families a complete life. How well communities manage
natural resources, medical challenges, and educational opportunities also determines the
quality of life for our employees.
That is why I have personally been involved in Healthy DuPage and the healthy communities
movement. This is an initiative designed to improve the health and quality of life for our citizens.
My interest and participation in Healthy DuPage stems from my fundamental belief that
the various parts of our community are interrelated. Our efforts to weave these interrelated
variables into programs to improve our health will help us maintain and improve our
community. By working together we can ensure that we live in a healthy community.
C. William Pollard, Chair, Healthy DuPage
Chairman, the ServiceMaster Company
A healthycommunity
works together.
A letter from the Healthy DuPage Chair
PREFACE

6
Healthy Communities is an international grassroots initiative that focuses
efforts on understanding and acting on the systemic connections and
underlying causes that make communities healthy. Healthy DuPage, an
expression of the international movement, is dedicated to creating local
partnerships that measurably improve community health and well-being.
It is aimed at achieving measurable results through the collaborative
efforts of individuals and organizations in all community sectors—
educational, business, health care, governmental, human services and spiritual arenas.
By collectively selecting and investigating the complex weave of physical, social, economic and
environmental factors that determine our community health, together we can monitor, improve, and
sustain quality of life. By focusing on policies and actions that address the social determinants of
health, we can shape our future.
This document is one of the resources for this collaborative effort. By assembling information about
our collectively discovered indicators, this document serves as a guidepost, an informed beginning
for further cohesive action in maintaining the good health of DuPage County.
This document is a part of our effort to fulfill our mission—to stimulate and encourage collaborative
action and efficient use of resources as we work together toward creating and sustaining a healthy
community for our children and ourselves.
Tapestry DuPage 2001 is intended to be a living document. As our county continues to grow and
improve, so too will this document. We welcome your ongoing feedback.
Donell Bullock, Executive Director
Healthy DuPage
A healthycommunity
collectively shapesits future.
A letter from the Healthy DuPage Executive Director
PREFACE
7

Cheryl Adlaf • David Aldridge • Andre Allen • Robin Amberger • Christine Amstadt • Bruce Anderson • Cathy Andrews • Trish Anen • David Angerer
• Jean Arend • Cory Atwell • Sally Atwell • Claude Audley • Susan Auld • Linda Baird • Madeleine Baird • Charles Baker • Rick Ballinger • Richard
Barbieri • David Baron • Ahmed Basith • Scott Baumgartner • Jennifer Baumgartner • Bill Bedrossian • Becky Beilfuss • Cynthia Belon • Sue
Benedetto • Iris Berg • Dru Bergman • Chana Bernstein • Carol Bertulis • Timothy Bessette • Gregory Bielawski • Eloise Bills • Lois D. Bishop •
Rosemary Bleuher • Joseph Block • Jim Boan • Brian Bochenek • Irwin A. Bock • Peter Bokos • Thomas P. Borchett • Janet Bornancin • Raymond P.
Botch, Jr. • Larry Bouldin • Susan Bove • Diane Boynton • Kim Brafford • Kurt Bressner • Nick Bridge • Susan Bridge • Lynette Briggs • Thomas
Brindisi • Rodger Brown • David Brown • Julian Brown • Nancy Brown • Valarie Bruggeman • Jonathan Bruss • Claire Bucaham • Donell Bullock •
Peter Burchard • Edwin Burke • Karen M. Bushy • Judy Callahan, BVM • Barbara Carbon, R.N. • Cleve Carney • James C. Carr • Brenda Carroll • Gina
Caton • Teresa Cendejas • Kathie Cermak • Richard Chamberlain • Betty Cheever • John Chereno • Linda Cherrington • Roger C. Claar • Kelley Clancy
• Elizabeth Clower • John Coakley • Bill Coats • Maggie Cole • Terry Companik • Lesley Connors • John Correll • Denise Cote • Chuck Cozette • Tim
Cramer • Kathy Crampton • Marilyn Crawford • Rick O. Curneal • Mary Alice D’arcy • Gail Daniels • Paul Darrah • Deborah Dassion • Steve Davis
• Robert Davis • Janet Davis • Eric Dawson • John Day • Lynn Day • David Dial • Kim DiGangi • Linda Dimengo • Jessica Dixon • Barbara Dixon •
Charles O. Dobbins • Carol Doerr • Marie Doll • David Dopp • Stephanie Downs Hughes • Janet Driscoll • Gary Duerkoop • Patrick Duffy • Robert
Dunsmuir • Mary Ellen Durbin • Jim Durkan • Barbara DuSold • James Dvorak • Melody Eastman • Bob Egan • James Eggert • Judith Eichmiller •
Chris Ellerman • Laura Ellison • Jerry Elsner • Richard Endress • Kathleen Esposito • Deborah Fagan • J. Ben Fajardo • Pam Feather • Carol Fecht •
Karen Fegley • Kathy Fekete • Ross Ferraro • Maureen Field • Elsa Fischer • Ken Fisher • Peter Fissinger • Laura Flamm • Robert Flesvig • Sadie Flucas
• Tim Fluck • Jenny Folkerts • Joanne Ford • Ann Ford • Theresa Forthofer • David Fox • Ken Fritz • Shron Frys • Gary Fuchs • Eric Fulgenzi • Garry
Gardner • Gerald Gawlik • Debby Gerhardstein • Trish Gherardini • Ronald S. Ghilardi • Farouk Girgis • Maria Glisson • Lawrence Gobble • Marvin
Gough • Pat Grandle • Ron Greene • Leslie Grevoy • Harold Grosboll • Gigi Gruber • Tim Grzesiakowski • Michael Guttman • Nancy Habermeier • Judy
Hackett • James Hagen • Joseph P. Haines • Maxine Hansen • Mary Beth Hardy • Antonia Harlan • John Harrell • Peggy Harrington Lucas • Jean
Hartman • Glen Hartweck • Larry Hartwig • Bruce Hasher • Robert Hatfield • Pat Hayden • Linda Hazen • Ralph Heatherington • Jane Heckman •
Gwendolyn Henry • Munn Heydorn • Cynthia Hildner • John Hildner • Angela Hill • Mary Lou Hinckley • Warren Hineline • Jane Hodgkinson • Laura
Hoglund • Chris Holland • Linda Holmes • Karen A. Holmes • Saralea Holstrom • Kelly Holt • David Holterman • Susan Hudson • Marc Hummel • Kris
Hummel • Dianne Hunter • Jan Hussong • Robert Iden • Jo Irmen • Walter Jackowiec • Nora Jackson • Nancy Jakus • Karen Jarczyk • Robert Jerrick
• Pamela Johnsen • Dennis Johnson • Kenneth Johnson • Roger Johnson • Thomas Johnson • Robert Johnson • Steve Jones • Susan Joyce • Roger Kaffer
• Laurina Kahne, CSJ • William Kallas • Richard Kalus • Kathy Karsh • Victoria Kash • Jan Kay • Mary Keating • James Kempfer • Carol Kettering •
Robert Kieckhefer • Candace King • John Kirschbaum • Bernie Kleina • Ronda Klocko • Laura Knight-Lynn • Rebecca Koch • Pat Koepp • Linda Kolaya
• Paul Kopka • Geoff Korous • Doug Kozlowski • Charles Kramer • Katie Kryda • Karen Kuchar • Brenda Kulp • Linda Kurzawa • Leon Kutzke •
Richard A. Kwasneski • Bobbie Laffin • Carmen Lafranzo • Steven Lakics • Mary Lally • Matthew J. Lambert III • Robert W. Lane • Al Larson • Zoraida8
Laureano • Jackie Laz • Judy Leach • William Leensvaart • Barbara A. Leiber • Marilyn Lester • Cinda Lester • Leland Lewis • William Lichter • David
Lindley • Alyce Litz • Sandy Lockhart • Barbara Lockwood • Alf Logan • Ron Logeman • William Love • Wayne Lulay • Vivian Lund • Laird Luoma •
Art Lyons • John D. Macdonald • Rena Mack • Douglas Mains • Earl Manning • Thomas D. Marcucci • Mary Nell Marten • Stephen Marth • Dale
Martin • Rita M. Martin • Robyn McBroom • Dave McConkey • Mike McCurdy • Brook McDonald • Dave McGowan • Kathleen McGowan • Carol
McHaley • Margaret McKenzie • Kirk McMurray • Mildred McNeal-James • Mark Meaney • Catherine J. Melchert • Tanya Melich • William Mennell •
Deb Mentink • Shayan Merchant • Morgan Meredith • Dabney Messer-Rehak • Walter Meyers • Ralph Miller • Elsie Mills • Lana Millsap • Jeff Moline
• Lisa Mondale • Lynn Montei • James Mortier • Elaine Moss • Gerald Mourning • William Mueller • Freda H. Mullen • William Murphy • William
Murphy • Michael Murphy • Shirley Myers • Wayne Nafzger • Laurie Nagel • Jon Nason • Carol Naveja • Laura Neiberg • Kathryn Nelson • Ann Nerad
• Sharon Neubuer • Sally Newton • Ann Nitsch • Mary Jane Noel • Gary Noll • Tom Norton • Kathy Ochromowicz • Bernard Oglietti • Christy Osius
• Kim Paetschow • Gloria Panama • Tom Paulsen • Kathe Pava • Mark Pawlowski • Jim Percic • John Perry • Linda Peterson • Emily Peterson • Eileen
Phipps • Kathie Pierce • Allen Pisarek • Linda Pizzello • C. William Pollard • Sally Porter • George Pradel • Gary Pretzer • Deb Priebe • Tom Prohaska
• Ron Putman • Paul Pyrcik • Martin Quinn • Saif Qureshi • Ali Rafie • Chris Rambke • Lynette Rasmussen • Rosaura Realegeno • Magy Rehayem •
Michael Remson • William Renner • Laura Ricardo • Ginny Richardson • Kenneth Robbins • Susanna Roberts • Bert V. Robins • Donald Rose • Vanessa
Roth • David Roth • Rae Rupp Srch • Darlene Ruscitti • Thomas S. Ryan • Robert Ryan • Jan Ryk • Joseph Sabatino • Vince Sackett • Jeri Sadegi •
Valerie Salmons • Margaret Salyer • Adriana Santillain • Frank Santore • Gretchen Sauer • Darnae Scales • Randall Schawel • Robert Schillerstrom
• Tad Schlake • Sandee Schlickman • Carol Schoengart • Stephen Scholten • Kathy Scholz • Margo Schreiber • Robert Schroeder • John Schweitzer •
Maureen Schwendener • James Segredo • Patricia Semenek • Pat Semple • James Sevcik • Ronald Severino • Pam Shaw • Ellen Sheaffer • Kathy
Sheridan • Jeanne Sheridan • Art Sheridan • Heather Shook • Donald C. Sibery • Cinda Siligmueller • Nanette Silva • Carol Simler • Sandria Simmons
• Charlie Simpson • Susan Sinderson • Gail Sinwell • Bill Sivak • Bev Sklar • Joseph Skvara • Thomas Slymon • Gary Smit • Phil Smith • Gayle Smolinski
• Carmen D. Soldato • Valerie Spale • JoAnn Spreitzer • LaVonne St. Amand • Barbara Stankus • Marty Stauffer • Marlene Stobler • Sharon Stola,
OSB • David L. Stover • Steven Stricker • Christine Sumida • Sharon Swanson • Cindy Swanson • Rhonda Sykes • Stan Szczap • Cindy Szkolka • Gail
Szydlowski • Joan Taylor • Robert Taylor • Jack Tenison • Pam Terrell • David Tews • Henry Tews • Melody Thompson • Gina Thorson • Mary Lee Tomsa
• Debi Tool • David Torgler • Tony Tosh • Brad Townsend • Victor P. Trinkus, M.D. • Scott Troost • Ray Turano • Debbie Turcja • Susan VanVeen •
Dennise Vaughn • Richard Veenstra • Stephen B. Veitch • Jan Veldsma • Lorraine Vols • Margin Vosicky • Dan Wagner • Gene Wagner • Bob Wahlgren
• Phil Waitzman • Jon Walen • Fredia Walker • Mary Eleanor Wall • Timothy Wall, M.D. • Lynne Walsh • Vince Walsh-Rock • Robert Walz, DDS •
Richard Wansley, Ph.D. • Edward Wardzala • Joe Wark • Robin Weaver • Marilyn Weaver • Gary Webster • William Weidner • Marty Weigand • Daniel
Wennerholm • Ellen Wenzel • Kathleen Whelan • William B. Whitney • William Wiet • Frederick Wildermuth • Rick Wilk • Sharon Williams • Tom
Williams • Kelly Williams-Borst • Lanny F. Wilson • Kenton Withrow • Dave Wolfe • Ellen Wolff, RN • Bonnie Wood • Will Worden • Lori Wrzesinski
• Linda Yonke • John Zaruba • Craig Zeck • Donald Zeilenga • Pamela Zimmerman • Elizabeth Zimmerman • Jane Zimmerman • Marian Zimmerman
We are privileged to have a community filled with visionary individuals, caring organizations, dedicated
government organizations, and conscientious businesses. In compiling this resource many members
of the DuPage community have been generous with their time, information, and passion. During our
investigations we have met with people dedicated to their work and committed to envisioning the
content and compiling accurate data for this document. This has been a truly collaborative effort at
defining DuPage County, its trends, and the concerns we all share for it.
These individuals have been instrumental in the formation, direction, content, and creation of
this document.
Acknowledgements
9
10
This document consists of individual indicators, each of which looks at factors that shape the health
of DuPage County. The indicators are grouped into nine sets of related information for reference.
Healthy DuPage Board of Directors . . . . . . . . . . . . . . . . . . . . . . . . . . . .2
Indicator Task Force . . . . . . . . . . . . . . . . . . . . . . . . . . . . . . . . . . . . . . . .4
Preface . . . . . . . . . . . . . . . . . . . . . . . . . . . . . . . . . . . . . . . . . . . . . . . . . . .5
Acknowledgements . . . . . . . . . . . . . . . . . . . . . . . . . . . . . . . . . . . . . . . .8
DuPage Today . . . . . . . . . . . . . . . . . . . . . . . . . . . . . . . . . . . . . . . . . . . .12
What is Healthy DuPage? . . . . . . . . . . . . . . . . . . . . . . . . . . . . . . . . . . .13
Looking at the Tapestry of Healthy DuPage . . . . . . . . . . . . . . . . . . . .14
How to Use this Document . . . . . . . . . . . . . . . . . . . . . . . . . . . . . . . . . .15
Economic Indicators . . . . . . . . . . . . . . . . . . . . . . . . . . . . . . . . . . . . . . .17household income • affordable homes • rental units •
business trends • unemployment • poverty level • homeless
Transportation Indicators . . . . . . . . . . . . . . . . . . . . . . . . . . . . . . . . . .31traffic volume and congestion • accident rates •
commuters • public transit
Nature Indicators . . . . . . . . . . . . . . . . . . . . . . . . . . . . . . . . . . . . . . . . . .41open space • land, water, and air ratings •
biking • flood hazards • recycling
Table of Contents
11
Education Indicators . . . . . . . . . . . . . . . . . . . . . . . . . . . . . . . . . . . . . .55educational attainment • high school graduation rates •
ACT scores • special adult classes • school revenue •
post-secondary enrollment • adult learning
Family Indicators . . . . . . . . . . . . . . . . . . . . . . . . . . . . . . . . . . . . . . . . .65uninsured children • affordable renting • teen mothers •
domestic violence • divorce • child and elder care
Community Indicators . . . . . . . . . . . . . . . . . . . . . . . . . . . . . . . . . . . . .79voting • crime rates • blood donations • volunteerism
Diversity Indicators . . . . . . . . . . . . . . . . . . . . . . . . . . . . . . . . . . . . . . .87ethnicity • diversity training • equal housing •
religious establishments
Health Indicators . . . . . . . . . . . . . . . . . . . . . . . . . . . . . . . . . . . . . . . . .95YPLL • leading causes of death • asthma • low birth weight •
youth at risk • physical and mental health status
Arts and Leisure Indicators . . . . . . . . . . . . . . . . . . . . . . . . . . . . . . . .109cultural events • park district programs
12
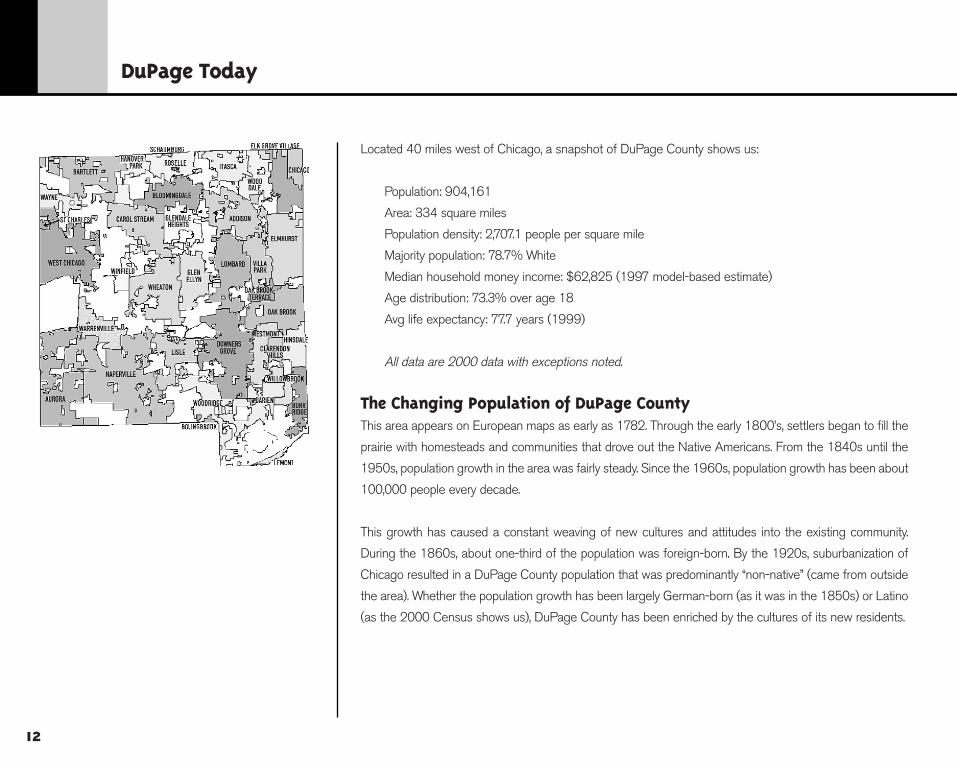
Located 40 miles west of Chicago, a snapshot of DuPage County shows us:
Population: 904,161
Area: 334 square miles
Population density: 2,707.1 people per square mile
Majority population: 78.7% White
Median household money income: $62,825 (1997 model-based estimate)
Age distribution: 73.3% over age 18
Avg life expectancy: 77.7 years (1999)
All data are 2000 data with exceptions noted.
The Changing Population of DuPage County This area appears on European maps as early as 1782. Through the early 1800’s, settlers began to fill the
prairie with homesteads and communities that drove out the Native Americans. From the 1840s until the
1950s, population growth in the area was fairly steady. Since the 1960s, population growth has been about
100,000 people every decade.
This growth has caused a constant weaving of new cultures and attitudes into the existing community.
During the 1860s, about one-third of the population was foreign-born. By the 1920s, suburbanization of
Chicago resulted in a DuPage County population that was predominantly “non-native” (came from outside
the area). Whether the population growth has been largely German-born (as it was in the 1850s) or Latino
(as the 2000 Census shows us), DuPage County has been enriched by the cultures of its new residents.
DuPage Today

13
Healthy DuPage is a grassroots, regional-planning initiative launched by individuals who care about the
quality of life in our communities. Launched in 1997, an Initializing Committee was formed of representa-
tives from various public, private and non-profit organizations.
This Initializing Committee reorganized itself into the current 20-member Healthy DuPage Board of Directors
and its 500 community stakeholders. The Board has worked with the community stakeholders to link
DuPage assets to a future envisioned by the community. Conversations have been held—visioning meetings
around the community, sessions with community stakeholders, and within action teams—to determine:
• What are the social, environmental, and economic factors that contribute to the
high quality of life in DuPage County?
• Building from these strengths, what do we need in DuPage County to make our quality
of life better?
Through these conversations, the Board of Directors identified specific strategic themes that can substantively
move the community towards an enhanced quality of life. From this rich and broad perspective, indicators were
selected to measure our progress toward or away from our shared vision. These indicators can be used to
create a culture of effective countywide planning, data collection, and analysis.
What is Healthy DuPage?
1986
1989
1993
1997
Healthy Communities Timeline
World Health Organization focuses on health promotion and disease prevention.
US Healthy Cities Program formed.
First International Conference on Healthy Cities and Communities.
DuPage County explores creating a county-wide healthy communities effort.

14
Many factors determine the health of a community. The interconnected, interwoven nature of these factors
allows us to compare DuPage County with a tapestry. A tapestry is made of a combination of weaving and
embroidery that tells a story. The tapestry that is Healthy DuPage is woven from a strong background. The
detail, the story, is embroidered on that background by many hands, using the skills unique to each contributor.
A healthy community weaves a tapestry of social, physical, and economic fabric that nurtures its members
even as they repair its worn places and embellish its design. These factors are connected, not in a linear
way, but rather like a tapestry—any thread we examine makes up a part of a picture and contributes to the
whole story of the tapestry.
Yet because the overall picture for DuPage County is one of success, it is easy to be blinded by the colors
or absorbed by the story. It is also difficult to remember that tapestry work is slow work. Inspired by our
success, we may too quickly add to the tapestry, stepping back to discover we have destroyed the
symmetry, rather than adding to its beauty.
To keep DuPage County a strong, and a nurturing place in which to live, we must look closely at the detail,
the individual stitching, to understand how our community works. Then we must look back at the work as
a whole to understand how our new stitches will affect the story told by the tapestry. We must anticipate
areas of wear and, through collaborative effort, weave into our actions, initiatives, and projections the
threads that help us maintain our quality of life.
A tapestry depends for strength and beauty on its weaving and on the skill with which the individual
threads are applied. Likewise, people depend upon their connections with others for fuller, more
accomplished living. A skillfully interwoven fabric of health is the gift we wish to bequeath to and
improve upon for future residents of DuPage County.
Looking at the DuPage Tapestry
Goals of DuPage Tapestry 20011. To provide information important to all the
diverse groups of people in DuPage County.2. To provide measures of community systems
so residents may, together, track communitytrends and engage in actions to make ahealthier DuPage County.
3. To show links and interactions among community systems, such as how the economyimpacts environmental and social issues, andvice versa.
4. To create a culture of effective countywideplanning, data collection, and analysis.

15
For this document, the Healthy DuPage Board of Directors selected those indicators that help us to keep
our tapestry vibrant and alive. Some indicators show us where we are; others show us the direction in which
we seem to be going. Indicators such as household income levels or low birth rates are directly quantifiable.
Other indicators, such as assessments of mental health, or alcohol use by teen-agers, may depend on surveys
and other indirect measures or less quantifiable information. For some indicators, data are not available or
are not currently collected.
In studying the statistical data in the indicators, there is a tendency to focus on the details and initiate changes
that do not improve the whole picture, that miss the story. Yet without the detail, we cannot understand
current health factors. Or, blinded by the story, we miss the details that enable us to make efficient changes.
This document both embroiders the statistical detail for each indicator and weaves a picture that provides
the connections between them. It requires moving back and forth between the detail and the story.
The Indicator Task Force accepted the charge of designing an approach that would turn selected indicators
into a functional tool. The result is this document, designed to provide community residents with countywide
information in their quest to better the health of their community. It is, however, a first attempt, a tapestry on
which we will continue to work. Data are constantly changing and each year we hope to add more threads,
to embroider on the knowledge we have gained with this first effort. We invite your critiques and your
suggestions for improvements in future versions.
Within each of the nine indicator sets are individual indicators that describe the health of DuPage County.
Each indicator has four sections: About the Indicator, Observations, Benchmark Data, and Tapestry. Each
indicator set has additional Community Commentary and Sources sections.
About this Indicator: This section provides the reader with the background information needed
to understand the statistics—how they were collected, explanations of terms used, sources, statistically
significant problems with the data, and why particular data were or were not used.
How to Use this Document
Recognizing a Good Indicator A meaningful and useful indicator usually reflectsa combination of idealism (what we would like tomeasure) and pragmatism (what we are able tomeasure). Good indicators share the followingcharacteristics:
1. Both experts and non-experts easily under-stand them.
2. They show information considered importantby diverse groups.
3. Some provide a guide toward the desiredquality of life with a clear direction thatreflects progress.
4. Some show position on a scale and promotecommunity dialogue on matters about whichthere is disagreement.
5. Some point toward actions under individualcontrol, while others point toward communitydecision-making.
6. They provide a basis for evaluating equity inthe distribution of quality-of-life benefits.
7. Data for most indicators are readily andaffordably available from a credible source. Ifdata are not currently available, methodsexist for obtaining data in the future.
16
Observations:Each indicator includes some discussion of the data as they relate to our shared vision of a Healthy
DuPage. We have defined the data for these indicators with the help of experts in the community. However,
time has limited our search. For example, although new data from the 2000 Census is just becoming
available, much of the analysis on a county-by-county basis has not yet been released. We may discover
the best data to define an indicator in succeeding years.
Benchmark Data: Data are more easily interpreted when there is a context in which to understand them. To that end,
benchmark data are included where available. These benchmark data compare DuPage County to Lake
County, a peer county in Illinois. In subsequent years, comparative data from more than one peer county
will be more meaningful. Data from the Chicago Metro region, the 6-county region, the state, and the
nation are also used as benchmark data.
Tapestry: This section leads the discussion back to causes, reasons for trends, and connections to other indicators.
By the nature of statistics, we tend to find ourselves focusing on the details, or threads, of the facts
at hand. However, this tapestry discussion reminds us that data, no matter how well conceived in their
collection, must be looked at within the whole tapestry of DuPage County. In this first attempt, these
connections are only implied. In subsequent versions, this section should contain more detail.
Community Commentary: Each indicator set closes with the thoughts of content experts for each set. He or she addresses those
issues that are most illuminating when looking at our tapestry of a healthy community.
Sources: Sources are listed in the text with the data. Data were collected online from February-May, 200,1 and in
that time some web pages changed dramatically. Consequently, this section provides contact information
information, not bibliographical information, about the sources.
continued
17
Our economy will
remain strong and will afford
opportunities that enable all individuals
to realize their full human potential.
18
We are a relatively affluent county.
About the Indicator: Household rather than per capita income is used because households consume certain goods as households
rather than as individuals. Here, household income is estimated based on 1990 census data (not actual 2000 cen-
sus data). The median household income for the 6-County region includes Lake, McHenry, Kane, DuPage, Cook,
and Will Counties.
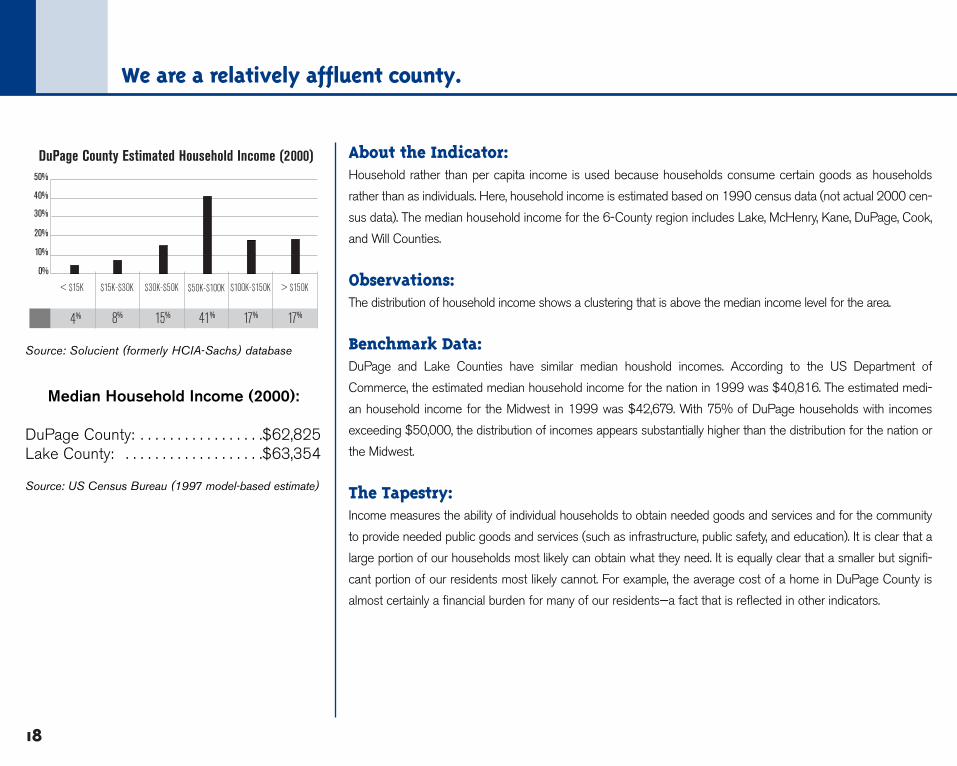
Observations:The distribution of household income shows a clustering that is above the median income level for the area.
Benchmark Data:DuPage and Lake Counties have similar median houshold incomes. According to the US Department of
Commerce, the estimated median household income for the nation in 1999 was $40,816. The estimated medi-
an household income for the Midwest in 1999 was $42,679. With 75% of DuPage households with incomes
exceeding $50,000, the distribution of incomes appears substantially higher than the distribution for the nation or
the Midwest.
The Tapestry:Income measures the ability of individual households to obtain needed goods and services and for the community
to provide needed public goods and services (such as infrastructure, public safety, and education). It is clear that a
large portion of our households most likely can obtain what they need. It is equally clear that a smaller but signifi-
cant portion of our residents most likely cannot. For example, the average cost of a home in DuPage County is
almost certainly a financial burden for many of our residents—a fact that is reflected in other indicators.
Source: Solucient (formerly HCIA-Sachs) database
< $15K
DuPage County Estimated Household Income (2000)
4%
$15K-$30K
8%
$30K-$50K
15%
$50K-$100K
41%
$100K-$150K
17%
> $150K
17%
50%
40%
30%
10%
0%
20%
Median Household Income (2000):
DuPage County: . . . . . . . . . . . . . . . . .$62,825Lake County: . . . . . . . . . . . . . . . . . . .$63,354
Source: US Census Bureau (1997 model-based estimate)
19
Many lower income families cannot afford \typical homes in DuPage County.
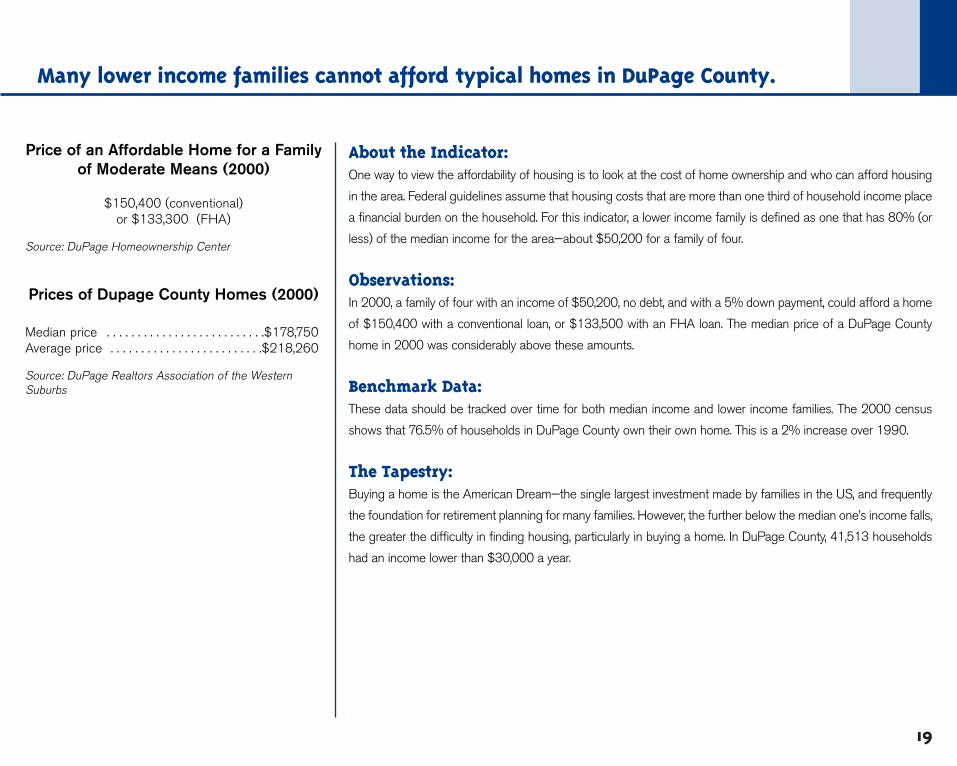
Price of an Affordable Home for a Familyof Moderate Means (2000)
$150,400 (conventional)or $133,300 (FHA)
Source: DuPage Homeownership Center
Prices of Dupage County Homes (2000)
Median price . . . . . . . . . . . . . . . . . . . . . . . . . .$178,750 Average price . . . . . . . . . . . . . . . . . . . . . . . . .$218,260
Source: DuPage Realtors Association of the WesternSuburbs
About the Indicator: One way to view the affordability of housing is to look at the cost of home ownership and who can afford housing
in the area. Federal guidelines assume that housing costs that are more than one third of household income place
a financial burden on the household. For this indicator, a lower income family is defined as one that has 80% (or
less) of the median income for the area—about $50,200 for a family of four.
Observations:In 2000, a family of four with an income of $50,200, no debt, and with a 5% down payment, could afford a home
of $150,400 with a conventional loan, or $133,500 with an FHA loan. The median price of a DuPage County
home in 2000 was considerably above these amounts.
Benchmark Data: These data should be tracked over time for both median income and lower income families. The 2000 census
shows that 76.5% of households in DuPage County own their own home. This is a 2% increase over 1990.
The Tapestry: Buying a home is the American Dream—the single largest investment made by families in the US, and frequently
the foundation for retirement planning for many families. However, the further below the median one’s income falls,
the greater the difficulty in finding housing, particularly in buying a home. In DuPage County, 41,513 households
had an income lower than $30,000 a year.

20
Rental housing supply has not kept pace with the rising number of jobs.
About the Indicator: The number of jobs compared to the number of rental units provides a measure of the housing available to
workers who cannot afford or do not want to buy a home. These data reflect the changes in jobs and rental units
from 1990 to 1998.
Observations:In DuPage County from 1990 to 1998, 117,215 incremental jobs were created while only 2,488 incremental
rental units were created.
Benchmark Data: According to Regional Realities, produced by Chicago Metropolis 2020, the Chicago Metro Area as a whole has
experienced a substantial loss of rental housing (-46,181 rental units).
The Tapestry: According to the Illinois Department of Employment Security from 1998 to 1999, most of the gains in jobs in
DuPage County occurred in Business Services, Other Services, and Contract Construction. Many of these jobs
may not provide the income required for home ownership. Some of them may not provide enough income for rental
units of an appropriate size.
Where the income from a job does not enable a household to buy a home, more rental units are needed. If housing
is not available locally, longer commutes and traffic congestion will follow. In order to fill jobs that require longer
commutes, businesses may have to increase wages.
Source: Regional Realities, Chicago Metropolis 2020
350,000300,000250,000200,000150,000100,00050,000
0-50,000
-100,000Metro Chicago
AreaDuPage Lake
Change in # rental unitsChange in # Jobs
Change in Jobs and Rental Units (1990-1998)
312,558
-46,181
117,215
2,488
58,853
4,568

21
Over time, business leaders’ assessments of business conditions decline, matching their expectations.
About the Indicator: The East West Corporate Corridor Association surveys business leaders in DuPage, Cook, Kane, Kendall, Lake,
McHenry, and Will counties semi-annually. Each season (spring 1998, fall 1998, etc.) business leaders are asked
to rate current business conditions and make projections for future business conditions on a one-to-five scale
(where one is weak and five is strong).
Observations:In surveys taken from 1998 through 2000, business leaders were generally less positive about their projections for
future business conditions than about their assessment of current conditions. By 2000, manufacturing, wholesale, and
retail expectations and current conditions were rated as equally strong.
Benchmark Data: These data are unique to DuPage County and benchmark can only be done across time periods.
The Tapestry: When our business leaders have a positive outlook on business conditions in the area it can lead to continued
economic growth. This benefits the residents of DuPage County. We see this reflected in other indicators in this
indicator set, such as household income or the unemployment rate.
According to the East West Corporate Corridor Association survey, issues that may affect future confidence
levels are: a tight labor market, transportation, recruiting, and cost of labor. Recent energy prices were not cited as
a problem in the survey to date, but they may affect other indicators. Building regulations were listed as a possible
concern for residential construction.
Trends in Business Conditions and Expectations (1998-2000)
3.0
4.44.24.03.83.63.43.2
Spring 1998 Fall 1998Fall 1997 Spring 1999 Fall 1999 Fall 2000
Current ConditionsExpectations
Manufacturing Conditions and Expectations
3.0
4.44.24.03.83.63.43.2
Current ConditionsExpectations
Wholesale Conditions and Expectations
Spring 1998 Fall 1998Fall 1997 Spring 1999 Fall 1999 Fall 2000
Source: East West Corporate Corridor Association

22
3.0
4.44.24.03.83.63.43.2
Current ConditionsExpectations
Retail Conditions and Expectations
Spring 1998 Fall 1998Fall 1997 Spring 1999 Fall 1999 Fall 2000
3.0
4.44.24.03.83.63.43.2
Current ConditionsExpectations
Residential Construction Conditions and Expectations
Spring 1998 Fall 1998Fall 1997 Spring 1999 Fall 1999 Fall 2000
3.0
4.44.24.03.83.63.43.2
Current ConditionsExpectations
Re-Sale Price of Homes Conditions and Expectations
Spring 1998 Fall 1998Fall 1997 Spring 1999 Fall 1999 Fall 2000
continued

23
Unemployment rates show a steady decline and are the lowest in the six-county area.
Source: Northeastern Illinois Planning Commission and Illinois Department of Employment Security
6.0 %
5.0 %
4.0 %
3.0 %
2.0 %
1.0 %
0.0 %1995 1996 1997 1998 1999
DuPage Lake6-County Region
Unemployment Rates (1995-1999) About the Indicator: Unemployment is a measure of how well we provide jobs for our residents. In determining unemployment rates,
people not included in the labor force are those not counted as either employed or unemployed. Examples are:
non-working students, homemakers, retirees, and people who want a job but have stopped looking for work (this
includes those who are discouraged over their job opportunities or who face barriers to entering the labor market).
The 6-County area includes Cook, DuPage, Kane, Lake, McHenry, and Will counties.
Observations:With a 1999 labor force of 528,237, the numbers of unemployed in DuPage County were approximately 14,000
to 15,000 unemployed. In 1999, DuPage County had the lowest unemployment rate in the 6-County region.
Benchmark Data:DuPage County consistently has lower unemployment than the 6-county region and Lake County. According to
the Illinois Department of Employment Securities, the Illinois Labor Force Estimates, overall the unemployment rate
for Illinois for 1999 was 1.6% higher than the rate in DuPage County.
The Tapestry: Low unemployment rates can benefit our residents in ways beyond the obvious. Employers may have difficulty in
finding workers that fit their needs. This may spur a rise in opportunity and possibly improved career advancement
for employees. In order to get the employees needed, businesses may have to increase the wages they offer. At
the same time, this increases their costs.
When studying the unemployment rates, we should remember the people behind them. Some people have
stopped looking for work perhaps because transportation or child care are not available, or the distance from
affordable housing to work is too great. These people are not included in the unemployed rates.
24
Unemployment rates for people with disabilities are estimated to be high.
About the Indicator: Current statistics about the number of people in DuPage County with disabilities and their employability are not
readily available. In trying to obtain this data there are several hurdles to overcome. First, the lack of a universally
accepted definition of what constitutes “disabled” means we cannot define the universe of people with disabilities.
Secondly, there are no numbers available that define, out of the total population of people with disabilities, the num-
ber who are seeking employment. For example, as the population ages, the number of people with disabilities
increases. In this older population, there are a lower number of people who are seeking work.
Observations:Nationally, about one-third of people with disabilities of an employable age (16-64) are employed. We do not know
how many of the rest of the people with disabilities, aged 16-64, would like to work.
Benchmark Data:According to an article in Business Week and the Able to Work Organization, the nationally accepted estimates
for the unemployment rate of people with disabilities is extremely high at 66% to 79%.
The Tapestry: We know some of this unemployment is due to access problems, transportation problems, and some to
discrimination. With the current low unemployment rate, finding workers to fill jobs can be difficult. DuPage
County workers with disabilities would appear to be a large, and largely available, labor pool.
?
25
The percentage of population under the poverty level remains low, but it is slightly higher than 1989 rates.
About the Indicator: The poverty level as recognized by the Census Bureau is a set of money income thresholds that vary by family size
and composition. If the family’s total income is less than the poverty thresholds for a family of that size and composition,
then that family and everyone in it is considered poor. Poverty thresholds do not vary geographically and will be
the same in all parts of the US, regardless of the local cost of living.
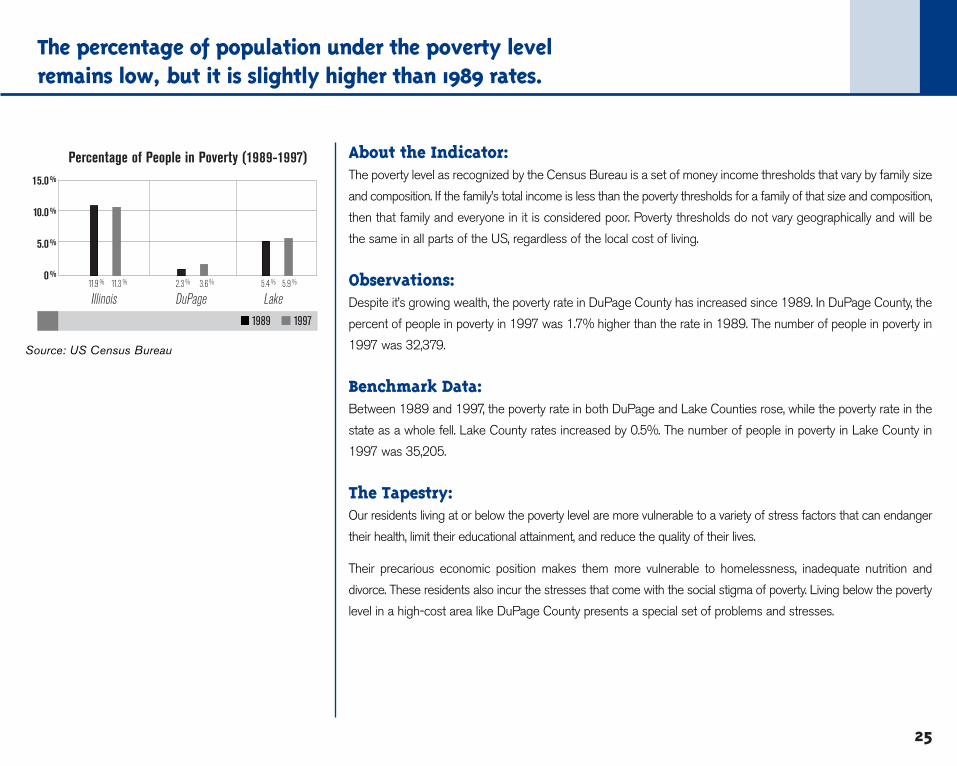
Observations:Despite it’s growing wealth, the poverty rate in DuPage County has increased since 1989. In DuPage County, the
percent of people in poverty in 1997 was 1.7% higher than the rate in 1989. The number of people in poverty in
1997 was 32,379.
Benchmark Data: Between 1989 and 1997, the poverty rate in both DuPage and Lake Counties rose, while the poverty rate in the
state as a whole fell. Lake County rates increased by 0.5%. The number of people in poverty in Lake County in
1997 was 35,205.
The Tapestry: Our residents living at or below the poverty level are more vulnerable to a variety of stress factors that can endanger
their health, limit their educational attainment, and reduce the quality of their lives.
Their precarious economic position makes them more vulnerable to homelessness, inadequate nutrition and
divorce. These residents also incur the stresses that come with the social stigma of poverty. Living below the poverty
level in a high-cost area like DuPage County presents a special set of problems and stresses.
Source: US Census Bureau
15.0 %
10.0 %
5.0 %
0 %
Illinois DuPage Lake
Percentage of People in Poverty (1989-1997)
11.9 % 11.3 % 2.3 % 3.6 % 5.4 % 5.9 %
19971989

26
The homeless are predominantly adult, Caucasian males.
About the Indicator: The figures used here to assess the composition of the homeless were gathered through a single night count
of 15 agencies that serve the homeless in DuPage County. They were verified through mail surveys to multiple agencies.
These numbers were taken from a One-Night Count of homeless persons in shelters in 1997. This is a point-in-time
measurement that may over-estimate the number of chronically homeless because many people are homeless only
for a short time. Others feel that, because a substantial portion of the homeless population do not take up residence
in shelters (living in cars, cardboard shacks, etc.) this method under-estimates the number of homeless.
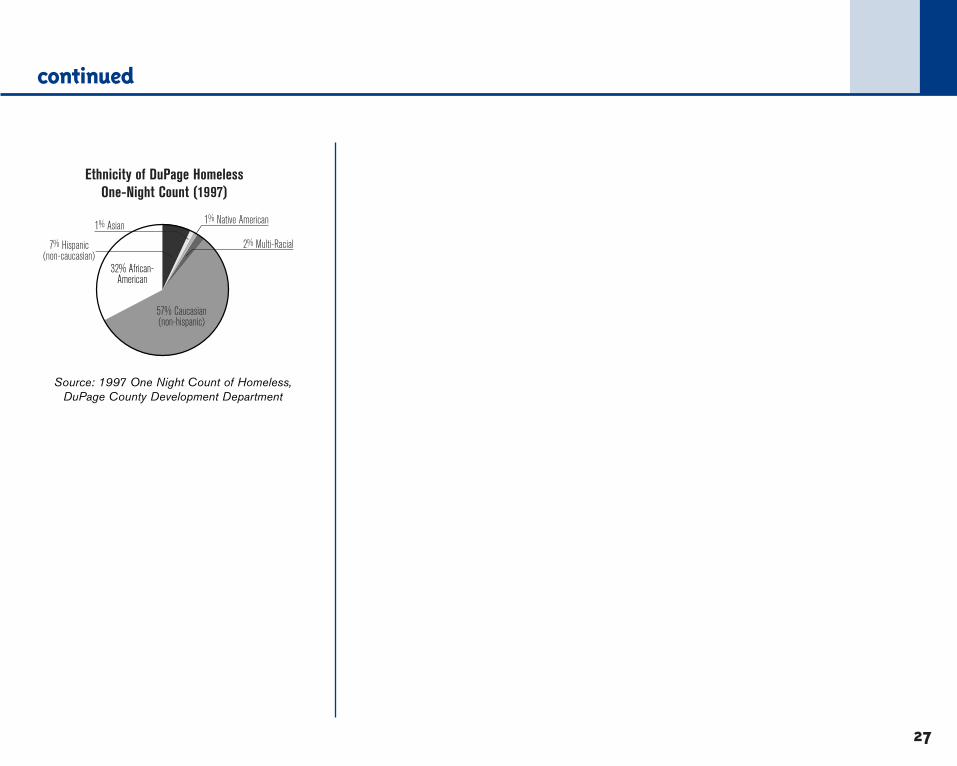
Observations:Of the DuPage homeless residents counted, the largest population is male and 57% Caucasian. (Caucasian does
not include people who identified themselves as Hispanic.) The largest proportion of the homeless (79%) fall
between the ages of 22 and 64. Based on the 1997 One-Night Count, it is estimated that there are 500 homeless
individuals in DuPage County on any given day.
Benchmark Data: Benchmark data should be of homeless populations in DuPage County over time.
The Tapestry: Our residents are homeless for a variety of reasons. Domestic violence is a major factor for homelessness among
women and children. With affordable housing at a premium, frequent upheavals in a life of paycheck-to-paycheck
living can propel lower income residents into homelessness.
These residents may also find it difficult to save the required deposit for rental housing once a crisis is past. Lack
of job opportunities that pay a living wage, lack of affordable housing, and a severe shortage of supportive housing for
persons with mental illness all affect the ability of the homeless to obtain housing.
Source: 1997 One Night Count of Homeless, DuPageCounty Development Department
Gender of DuPage HomelessOne-Night Count (1997)
37%
63%Female
Male
Source: 1997 One Night Count of Homeless, DuPage County Development Department
Age of DuPage HomelessOne-Night Count (1997)
3.5% 18 to 21
45.5% 35 to 64 33.4%
22 to 34
3.9% 65+ 13.7% 0 to 17
27
continued
Source: 1997 One Night Count of Homeless, DuPage County Development Department
Ethnicity of DuPage HomelessOne-Night Count (1997)
57% Caucasian(non-hispanic)
32% African-American
7% Hispanic(non-caucasian)
1% Asian 1% Native American
2% Multi-Racial
28
Bonnie J. Wood
Executive Director, East West Corporate Corridor Association
(EWCCA)
A healthy community is viable in economic, health, environmental, and social terms. With such high median
household incomes in DuPage County, the current methods of assessing our economy tell us we are an
exceptionally viable community, economically. But if a healthy community is a whole community, then we need
economic assessments that take a broader measure of the community’s wealth—economic measures that
incorporate economic effects on the environmental and the social responsibility of businesses that results in
a vibrant community, for example.
In the Healthy Communities movement we speak of the sense of efficacy that enables people to act.
Expecting more from their actions, people move forward to make changes. This sense of efficacy can give
rise to a high level of social capital—the willingness to invest time and energy into the community. On the other
hand, a lower sense of efficacy inhibits actions. How much “wealth” are we ignoring if we don’t account for
our social capital?
In looking at these economic indicators, what do low unemployment figures tell us about economic viability if
our lower income workers cannot afford housing in the community? How low is unemployment if three quarters
of disabled people want work but cannot find it?
These considerations do not mean that DuPage County is not economically well off or that it’s time to ignore
dollars and cents. Rather, they are ways of asking how to examine the detail that is sometimes hidden in the
broader picture of our economic wealth.
Community Commentary

29
S O U R C E S
The sources used for this indicator set are identified within the text. For further information:
The East-West Corridor Association
Provides a consensus-building forum to develop a common voice for key issues in the business communities of
DuPage, Cook, Kane, Kendall, Lake, McHenry, and Will counties.
www.ewcca.org
NIPC Northeastern Illinois Planning Commission
The official planning agency for the 6-county Chicago Metropolitan Region
www.nipc.cog.il.us
Illinois department of Employment Security
www.ides.state.il.us
Business Week (magazine)
www.businessweek.com
Able to Work
Consortium dedicated to increasing the employment of people with disabilities.
www.abletowork.org
US Department of Commerce and US Census Bureau
www.us.census.gov
DuPage Realtors Association of the Western Suburbs
630-653-1790
30
Regional Realities Report produced by Chicago Metropolis 2020
Measure progress toward shared goals in the 6-county region (DuPage, Cook, Kane, Lake, McHenry and Will
counties), encourage regional thinking, and inspire action.
www.chicagometropolis2020.org
DuPage Home Ownership Center
Provides first time homebuyers with information on how to purchase their first home.
www.dupagehomeownershipcenter.org
One-Night count of Homeless Persons Staying in Shelters and Transitional Housing in DuPage County
and Portions of Kane County. March 19, 1997.
DuPage County Development Department
continued

511 Thornhill DriveCarol Stream, IL 60188
Phone: 630-690-2998Fax: 630-690-3258Website: www.healthydupage.org
Additional Research and Writing:
Jennifer S. Oatfield INK, Chicago, Illinois
Publication Coordination and Design:
Duffy Design Works, Oak Book, Illinois
Illustration:
Claire Elizabeth Krause
$25.00