healthy communities client survey - final · healthy communities staff as interviewers, and the...
TRANSCRIPT

ANNEX A: Healthy Communities Client Survey
Prepared for the Colorado Department of Health Care Policy and Financing
as part of the Healthy Communities Evaluation Project
Elizabeth Beachy, MHS and Julia Hasbún, PhD June, 2015
UPLEAF LLC P.O. Box 872 EVERGREEN, CO 80437 T (303) 991 0504 http://upleaf.com
ANNEX A: Healthy Communities Client Survey 1 I. Introduction 3 II. Study Design 4
Technology 4 Interviewers 5 Survey Sample 5
III. Results 6 A. Respondent Demographics 6 B. Sources of Health Information 7 C. Preferred Method of Contact 8 D. Last Time Oldest Child Had Preventive Care 10 E. Barriers to Preventive Care 11 E. Motivators of Preventive Care 13 F. Primary Sources of Information about Benefits & Physicians 14 The Important Role of Doctors 16
IV. Recommendations 17 V. Conclusion 19 Appendix A: Survey Questions 20 Appendix B: Surveys By Team 24 Appendix C: Surveys by County 25
Healthy Communities Client Survey - June, 2015 " 2
I. Introduction The Colorado Department of Health Care Policy and Financing (HCPF) manages a program called “Healthy Communities” across the state to ensure that children and pregnant women on Medicaid or Child Health Plan Plus (CHP+) receive the health care they need. This care includes preventive care, immunizations, and screening.
The Healthy Communities program plays a vital role of reaching out to newly enrolled families with children on Medicaid to explain their new benefits and help them find a medical home / primary care provider who accepts Medicaid. During this initial orientation they also discuss the importance of well-child visits with families, and then follow up over time with reminders when it is time for a well-child visit. Healthy Communities teams also help with eligibility and troubleshoot issues with Medicaid coverage. Since 2007 the caseload of the Healthy Communities teams has grown by 159% while the budget has only grown 26%, which has affected the program’s capacity to keep up with the 570,000+ children on Medicaid.
HCPF hired Upleaf to conduct an evaluation of the Healthy Communities program to better understand how to boost well-child checks and preventive dental and vision care. Ultimately HCPF seeks to increase child participation in the Early, Periodic, Screening, Diagnostic and Testing (EPSDT) benefit offered by Medicaid, given that Colorado’s participation rates are currently well below the national average.
The Healthy Communities Client Survey was therefore designed to help identify:
1. Most important sources of information about health and health care benefits 2. Communication channels preferred by guardians of children on Medicaid and CHP+ 3. Factors that motivate families to take children to the doctor for well-child visits 4. Barriers to taking children to well-child visits
To capture this data Upleaf designed a short survey to be applied to guardians of children on Medicaid from within the Salesforce CRM system by the Healthy Communities teams, as they were already interacting with clients as part of their day-to-day responsibilities.
The survey was highly cost-effective (with a price tag of only $8,500) thanks to the strong participation from Healthy Communities staff as interviewers, and the technology available through the Healthy Communities Salesforce CRM infrastructure.
A total of 1,136 surveys were completed from May 19 through June 9 (excluding two days for an annual conference and one holiday) for a total of 13 business days. In all, 43 counties were represented in the survey sample.
Healthy Communities Client Survey - June 2015 " 3
II. Study Design Based on findings from the Healthy Communities Team Survey conducted in May of 2015, we created a short questionnaire (took an average of 5 minutes to complete) with a total of 6 questions for guardians of children on Medicaid and CHP+. The surveys were applied by Family Health Coordinators working for the Healthy Communities program.
Most of the survey questions were to be answered spontaneously, with the interviewer simply marking each of the responses that best matched the client’s response. Any responses that didn’t fit within the existing options were recorded in a comments box at the end of the survey.
The survey questions and responses were reviewed by the Healthy Communities Program Manager and all of the Healthy Communities team members who participated in the survey training. Changes were incorporated based on their feedback. The final survey questions can be found in Appendix A.
Each survey participant gave their informed consent to participate in the survey, which was reflected in a “Yes” response to the first question. If a participant did not agree to complete the survey, the Family Health Coordinator closed the survey pop-up within Salesforce and recorded an interaction with the note “Declined Survey”. The survey had a rate of roughly 10% of clients who declined to participate. The teams contacted over 1250 clients and completed a total of 1136 surveys.
Technology Once the survey questions were approved, Upleaf created an electronic version of the survey within Salesforce using the TimbaSurvey app. The app was integrated with the Healthy Communities Salesforce CRM (HC CRM) so that team members could simply click on an “Apply Survey” button from the guardian’s record (or child’s record) to begin administering the survey. Once they had completed the survey they tapped a “Submit” button and the survey was recorded within the system.
Upleaf was then able to monitor survey progress from within Salesforce, and keep track of the number of completed surveys each day and who had been administering them. Upleaf created a “Leader Board” to highlight the counties and team members who had completed the most surveys.
Once the data collection period was over, Upleaf deactivated the survey and exported the dataset into a CSV file for data cleaning and then into SPSS for data analysis.
When Upleaf exported the data we also pulled the client’s state ID, county, and type of county (urban, rural, frontier) into the dataset to enrich the available data. We ran crosstabs and tested for significant differences between age groups and county type using Chi-Square tests in SPSS.
Healthy Communities Client Survey - June, 2015 " 4
Interviewers Healthy Communities teams were already interacting with hundreds of Medicaid clients on a daily basis, so Upleaf built the survey in a way that it could be incorporated into day-to-day interactions and the Family Health Coordinators could serve as interviewers. The Family Health Coordinators participated in a training webinar provided by Upleaf which emphasized the importance of objective interviewing, confidentiality, close adherence to the survey questions, and respecting the spontaneous nature of most questions to avoid introducing any bias into the survey responses. Healthy Communities teams were trained on how to administer the survey, who to administer it to, how to note responses that weren’t among those listed, and how to record instances where clients declined to participate.
By having the Healthy Communities teams serve as interviewers we increased the survey completion rate (many clients already had had some sort of interaction with the interviewer in the past) and were able to implement the survey quickly and very cost-effectively.
We spoke at length with the interviewers to let them know that data quality was essential and they would not be evaluated in any way based on the client feedback. We emphasized that documenting the responses accurately was critical to being able to identify ways to improve EPSDT outcomes. Despite this orientation, it is possible that some interviewers may have introduced some bias into some of the questions out of a desire to show higher rates of well-child visits. Based on the consistency of responses across counties however, if the interviewers introduced any bias we believe it would have been very minor and had little impact on the survey results.
Survey Sample The total survey sample (1136) was as large as most national polls, and many of the questions had a high confidence interval enabling us to identify statistically significant differences between demographic groups.
The Family Health Coordinators (FHCs) were asked to survey the families they were already interacting with either by phone or in person. This included many newly enrolled families who were new to Medicaid, people who called or visited a Healthy Communities office with concerns about their benefits, and families they needed to follow up with regarding well-child visits. The FHCs were asked to not interview new mothers with only a baby less than a year old, as their responses regarding preventive care for their “oldest child” would not help understand why children ages 6 and older were not getting their well-child checks. All other parents/guardians were interviewed.
Several days into the survey we realized that we needed to set targets for number of completed surveys for each Healthy Communities team so that every county would be accurately represented in the study. Because some teams were conducting many surveys and others were conducting too few, we asked that teams stop applying the survey as soon as they met their target. Significant over-representation of any one county or team could have skewed the results and make them less representative of the actual Medicaid population. The final list of completed surveys by Healthy Communities team (target versus completed surveys) can be found in Appendix B.
Healthy Communities Client Survey - June 2015 " 5
III. Results
A. Respondent Demographics
Type of County of Residence We included the type of county in the dataset to examine differences in responses from urban to rural to frontier counties (the latter have a population density of six or fewer inhabitants per square mile).
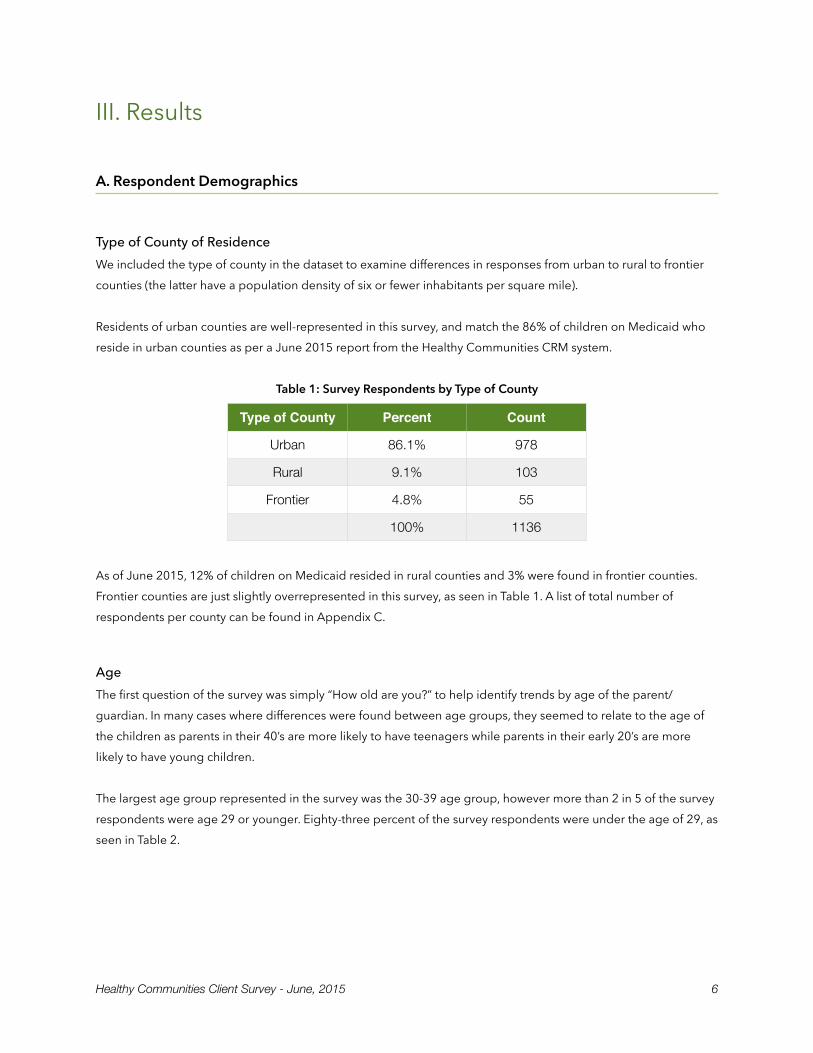
Residents of urban counties are well-represented in this survey, and match the 86% of children on Medicaid who reside in urban counties as per a June 2015 report from the Healthy Communities CRM system.
Table 1: Survey Respondents by Type of County
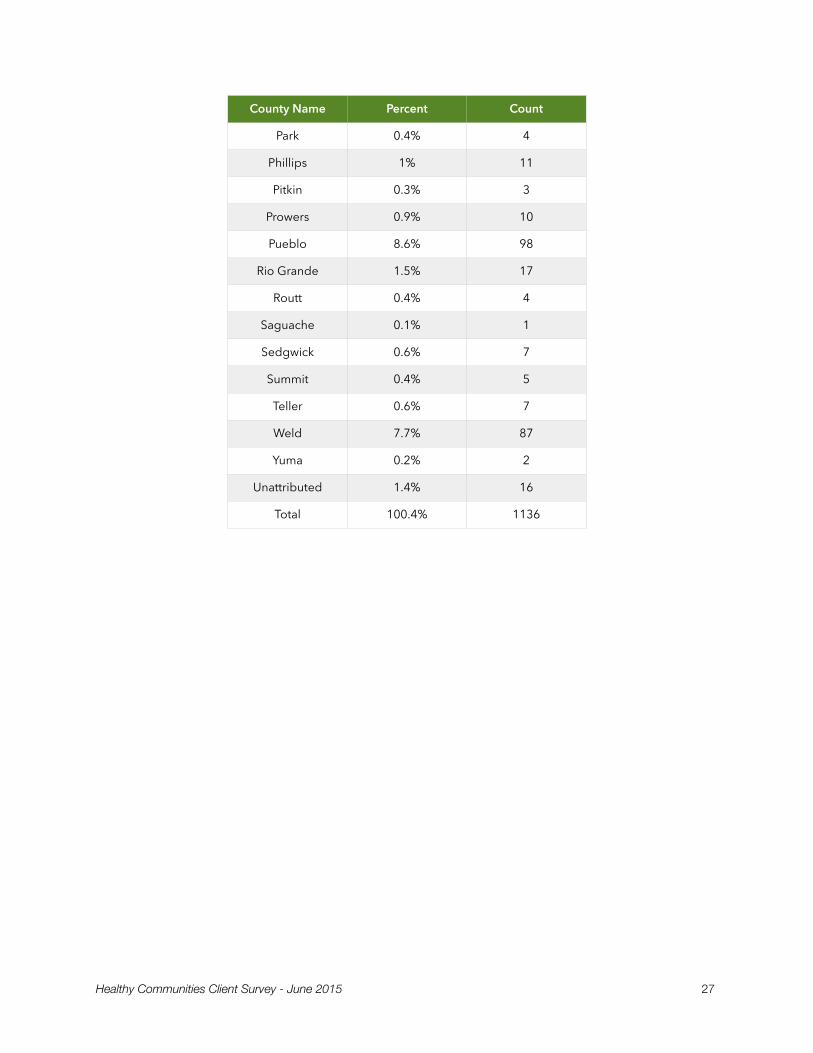
As of June 2015, 12% of children on Medicaid resided in rural counties and 3% were found in frontier counties. Frontier counties are just slightly overrepresented in this survey, as seen in Table 1. A list of total number of respondents per county can be found in Appendix C.
Age The first question of the survey was simply “How old are you?” to help identify trends by age of the parent/guardian. In many cases where differences were found between age groups, they seemed to relate to the age of the children as parents in their 40’s are more likely to have teenagers while parents in their early 20’s are more likely to have young children.
The largest age group represented in the survey was the 30-39 age group, however more than 2 in 5 of the survey respondents were age 29 or younger. Eighty-three percent of the survey respondents were under the age of 29, as seen in Table 2.
Type of County Percent Count
Urban 86.1% 978
Rural 9.1% 103
Frontier 4.8% 55
100% 1136
Healthy Communities Client Survey - June, 2015 " 6
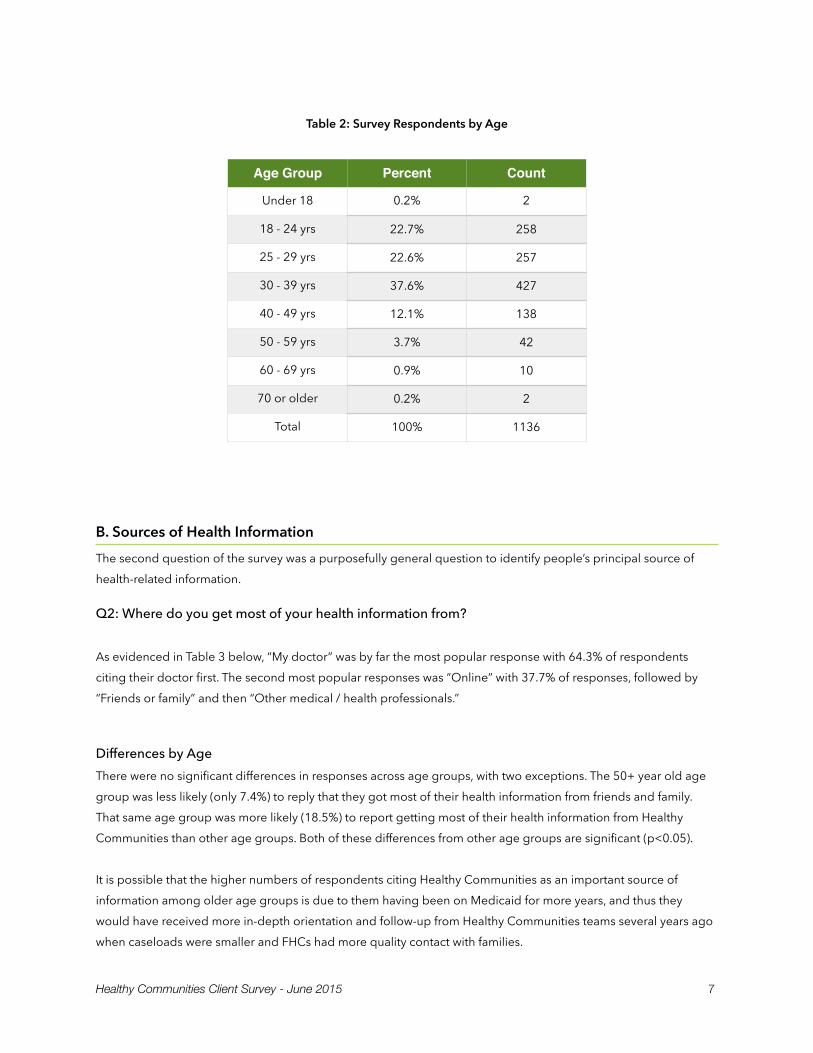
Table 2: Survey Respondents by Age
B. Sources of Health Information The second question of the survey was a purposefully general question to identify people’s principal source of health-related information.
Q2: Where do you get most of your health information from?
As evidenced in Table 3 below, “My doctor” was by far the most popular response with 64.3% of respondents citing their doctor first. The second most popular responses was “Online” with 37.7% of responses, followed by “Friends or family” and then “Other medical / health professionals.”
Differences by Age There were no significant differences in responses across age groups, with two exceptions. The 50+ year old age group was less likely (only 7.4%) to reply that they got most of their health information from friends and family. That same age group was more likely (18.5%) to report getting most of their health information from Healthy Communities than other age groups. Both of these differences from other age groups are significant (p<0.05).
It is possible that the higher numbers of respondents citing Healthy Communities as an important source of information among older age groups is due to them having been on Medicaid for more years, and thus they would have received more in-depth orientation and follow-up from Healthy Communities teams several years ago when caseloads were smaller and FHCs had more quality contact with families.
Age Group Percent Count
Under 18 0.2% 2
18 - 24 yrs 22.7% 258
25 - 29 yrs 22.6% 257
30 - 39 yrs 37.6% 427
40 - 49 yrs 12.1% 138
50 - 59 yrs 3.7% 42
60 - 69 yrs 0.9% 10
70 or older 0.2% 2
Total 100% 1136
Healthy Communities Client Survey - June 2015 " 7
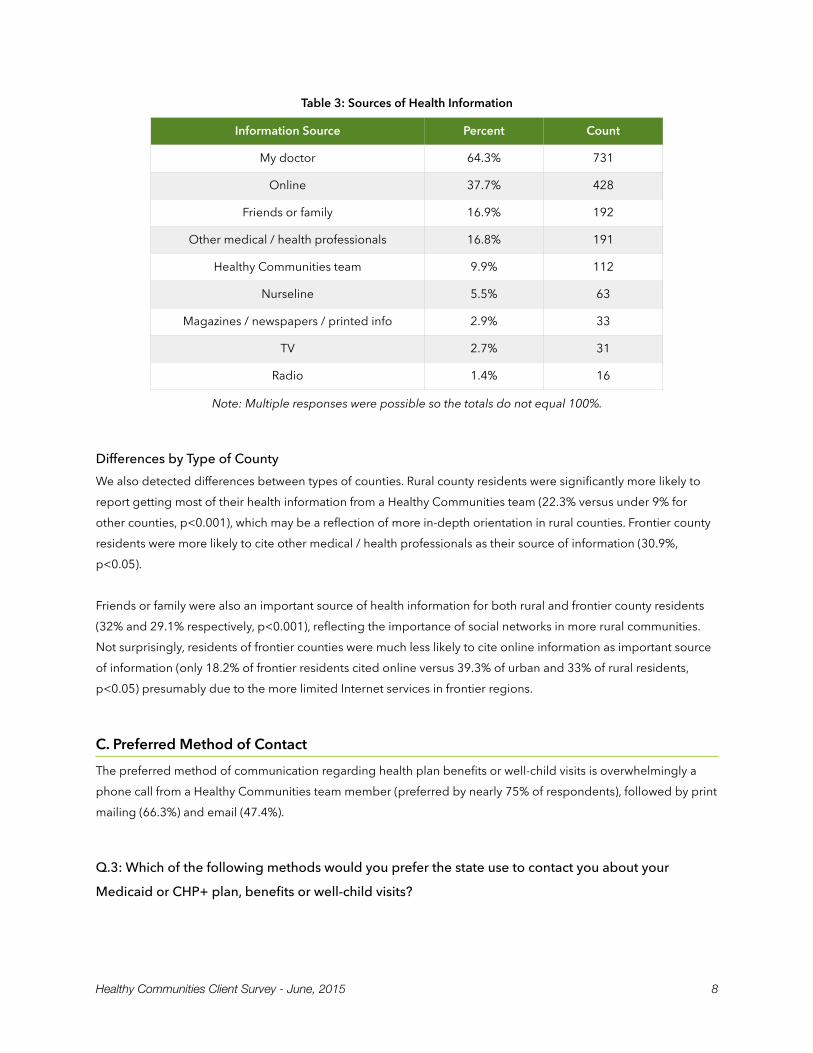
Table 3: Sources of Health Information
Note: Multiple responses were possible so the totals do not equal 100%.
Differences by Type of County We also detected differences between types of counties. Rural county residents were significantly more likely to report getting most of their health information from a Healthy Communities team (22.3% versus under 9% for other counties, p<0.001), which may be a reflection of more in-depth orientation in rural counties. Frontier county residents were more likely to cite other medical / health professionals as their source of information (30.9%, p<0.05).
Friends or family were also an important source of health information for both rural and frontier county residents (32% and 29.1% respectively, p<0.001), reflecting the importance of social networks in more rural communities. Not surprisingly, residents of frontier counties were much less likely to cite online information as important source of information (only 18.2% of frontier residents cited online versus 39.3% of urban and 33% of rural residents, p<0.05) presumably due to the more limited Internet services in frontier regions.
C. Preferred Method of Contact The preferred method of communication regarding health plan benefits or well-child visits is overwhelmingly a phone call from a Healthy Communities team member (preferred by nearly 75% of respondents), followed by print mailing (66.3%) and email (47.4%).
Q.3: Which of the following methods would you prefer the state use to contact you about your
Medicaid or CHP+ plan, benefits or well-child visits?
Information Source Percent Count
My doctor 64.3% 731
Online 37.7% 428
Friends or family 16.9% 192
Other medical / health professionals 16.8% 191
Healthy Communities team 9.9% 112
Nurseline 5.5% 63
Magazines / newspapers / printed info 2.9% 33
TV 2.7% 31
Radio 1.4% 16
Healthy Communities Client Survey - June, 2015 " 8
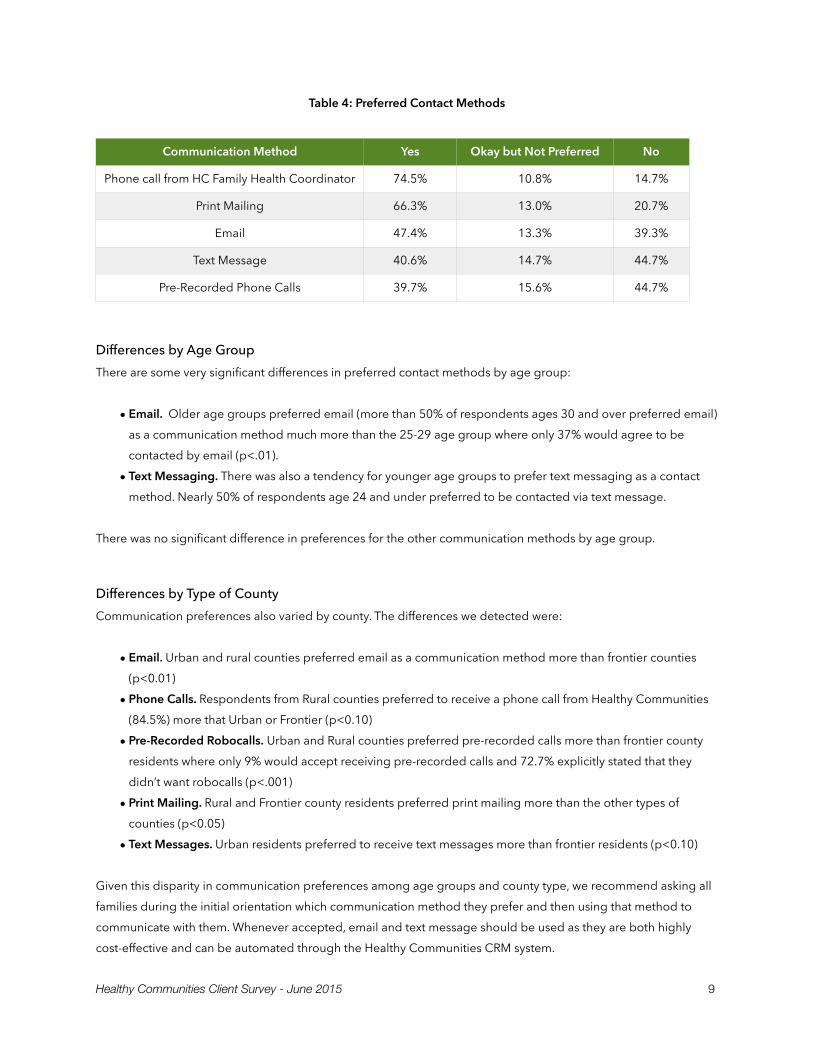
Table 4: Preferred Contact Methods
Differences by Age Group There are some very significant differences in preferred contact methods by age group:
• Email. Older age groups preferred email (more than 50% of respondents ages 30 and over preferred email) as a communication method much more than the 25-29 age group where only 37% would agree to be contacted by email (p<.01).
• Text Messaging. There was also a tendency for younger age groups to prefer text messaging as a contact method. Nearly 50% of respondents age 24 and under preferred to be contacted via text message.
There was no significant difference in preferences for the other communication methods by age group.
Differences by Type of County Communication preferences also varied by county. The differences we detected were:
• Email. Urban and rural counties preferred email as a communication method more than frontier counties (p<0.01)
• Phone Calls. Respondents from Rural counties preferred to receive a phone call from Healthy Communities (84.5%) more that Urban or Frontier (p<0.10)
• Pre-Recorded Robocalls. Urban and Rural counties preferred pre-recorded calls more than frontier county residents where only 9% would accept receiving pre-recorded calls and 72.7% explicitly stated that they didn’t want robocalls (p<.001)
• Print Mailing. Rural and Frontier county residents preferred print mailing more than the other types of counties (p<0.05)
• Text Messages. Urban residents preferred to receive text messages more than frontier residents (p<0.10)
Given this disparity in communication preferences among age groups and county type, we recommend asking all families during the initial orientation which communication method they prefer and then using that method to communicate with them. Whenever accepted, email and text message should be used as they are both highly cost-effective and can be automated through the Healthy Communities CRM system.
Communication Method Yes Okay but Not Preferred No
Phone call from HC Family Health Coordinator 74.5% 10.8% 14.7%
Print Mailing 66.3% 13.0% 20.7%
Email 47.4% 13.3% 39.3%
Text Message 40.6% 14.7% 44.7%
Pre-Recorded Phone Calls 39.7% 15.6% 44.7%
Healthy Communities Client Survey - June 2015 " 9

D. Last Time Oldest Child Had Preventive Care The key question in this study related to the last time the oldest child had preventive care. We asked specifically about the oldest child in an attempt to understand the barriers and the motivators to getting older children in for preventive care, as Colorado’s EPSDT participation rates are very low among children ages 6 and older.
We anticipated that less than half of respondents would have taken their older children in for preventive care in the last year due to the EPSDT participation rates, and therefore opted for a broader description of preventive care that also included dental and vision care. Ultimately however, 86% of respondents reported having taken their child in for some sort of preventive care within the last year.
Q4: When was the last time you took your oldest child to get preventive care? For example they
weren’t sick, but went in to get an annual head-to-toe physical, immunizations, or went to dentist or
eye doctor?
Table 5: Last Preventive Care Visit
In total only 14% of respondents reported that they had not taken their oldest child in for preventive care since more than a year ago (or didn’t even remember the last time). We were anticipating closer to 50% reporting that they had not taken their oldest child in for preventive care.
It is possible that this rate is higher than EPSDT participation ratios due to the inclusion of immunizations, dental and vision care, or that a larger proportion of respondents had younger children (5 or under) that typically have more frequent well-child exams.
Differences by Age Younger parents/guardians were more likely to have brought their child in for preventive care within the last month than older parents, which logically would stem from that age group having younger children. Older parents (30yrs +) were more likely to respond that they had taken their child in the last year. See Table 6 below for differences.
Last Preventive Care Visit Percent
Within the last month 28.6%
Within the last six months 32.3%
Within the last year 25.2%
More than a year ago 9.2%
Can’t remember the last time 4.8%
Total 100%
Healthy Communities Client Survey - June, 2015 " 10
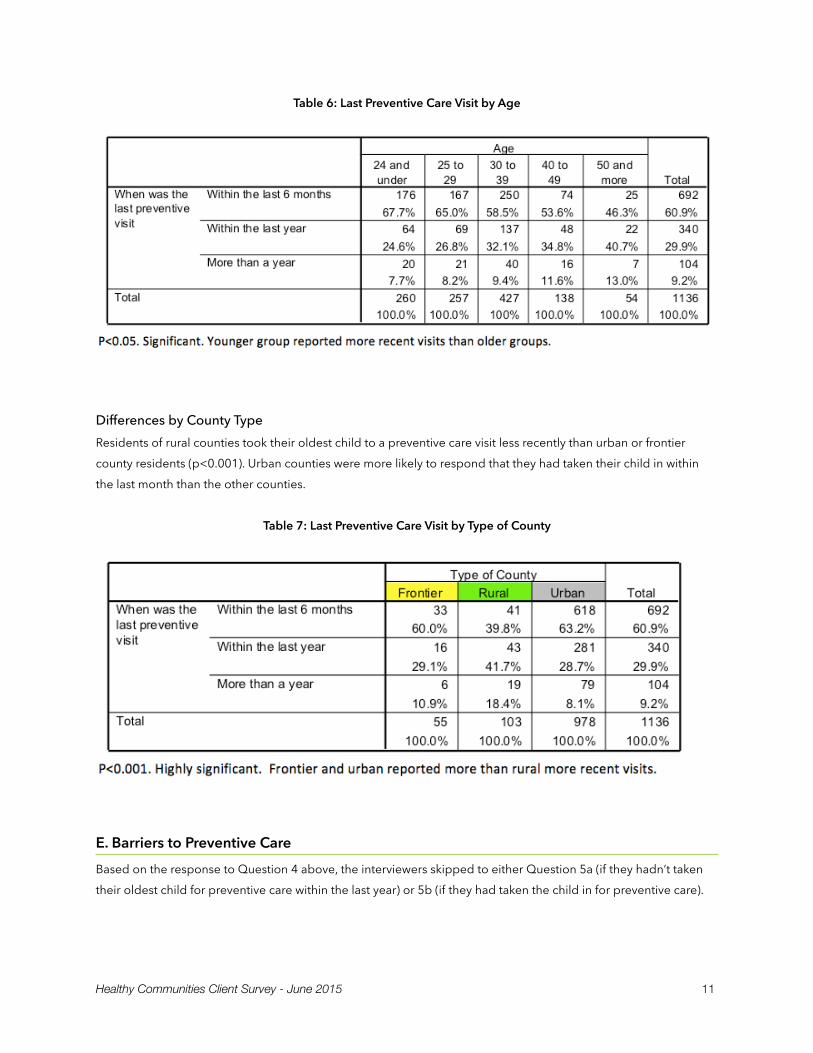
Table 6: Last Preventive Care Visit by Age
Differences by County Type Residents of rural counties took their oldest child to a preventive care visit less recently than urban or frontier county residents (p<0.001). Urban counties were more likely to respond that they had taken their child in within the last month than the other counties.
Table 7: Last Preventive Care Visit by Type of County
E. Barriers to Preventive Care Based on the response to Question 4 above, the interviewers skipped to either Question 5a (if they hadn’t taken their oldest child for preventive care within the last year) or 5b (if they had taken the child in for preventive care).
Healthy Communities Client Survey - June 2015 " 11
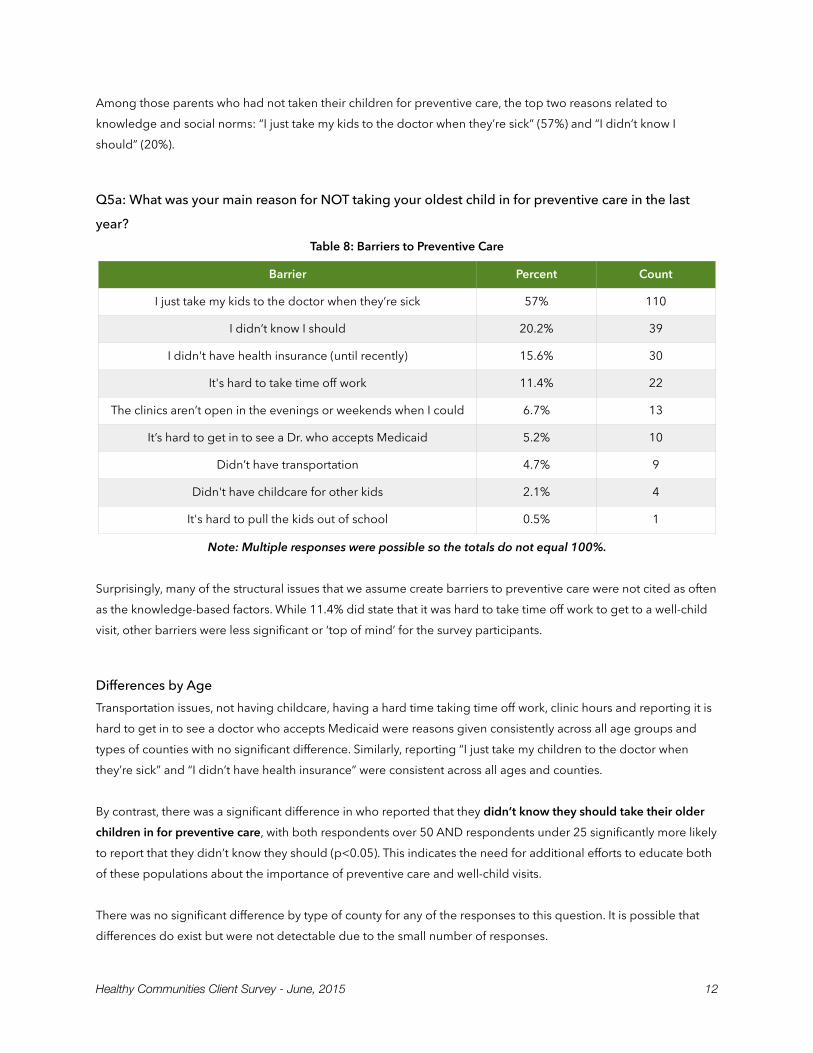
Among those parents who had not taken their children for preventive care, the top two reasons related to knowledge and social norms: “I just take my kids to the doctor when they’re sick” (57%) and “I didn’t know I should” (20%).
Q5a: What was your main reason for NOT taking your oldest child in for preventive care in the last
year? Table 8: Barriers to Preventive Care
Note: Multiple responses were possible so the totals do not equal 100%.
Surprisingly, many of the structural issues that we assume create barriers to preventive care were not cited as often as the knowledge-based factors. While 11.4% did state that it was hard to take time off work to get to a well-child visit, other barriers were less significant or ‘top of mind’ for the survey participants.
Differences by Age Transportation issues, not having childcare, having a hard time taking time off work, clinic hours and reporting it is hard to get in to see a doctor who accepts Medicaid were reasons given consistently across all age groups and types of counties with no significant difference. Similarly, reporting “I just take my children to the doctor when they’re sick” and “I didn’t have health insurance” were consistent across all ages and counties.
By contrast, there was a significant difference in who reported that they didn’t know they should take their older children in for preventive care, with both respondents over 50 AND respondents under 25 significantly more likely to report that they didn’t know they should (p<0.05). This indicates the need for additional efforts to educate both of these populations about the importance of preventive care and well-child visits.
There was no significant difference by type of county for any of the responses to this question. It is possible that differences do exist but were not detectable due to the small number of responses.
Barrier Percent Count
I just take my kids to the doctor when they’re sick 57% 110
I didn’t know I should 20.2% 39
I didn't have health insurance (until recently) 15.6% 30
It's hard to take time off work 11.4% 22
The clinics aren’t open in the evenings or weekends when I could 6.7% 13
It’s hard to get in to see a Dr. who accepts Medicaid 5.2% 10
Didn’t have transportation 4.7% 9
Didn't have childcare for other kids 2.1% 4
It's hard to pull the kids out of school 0.5% 1
Healthy Communities Client Survey - June, 2015 " 12
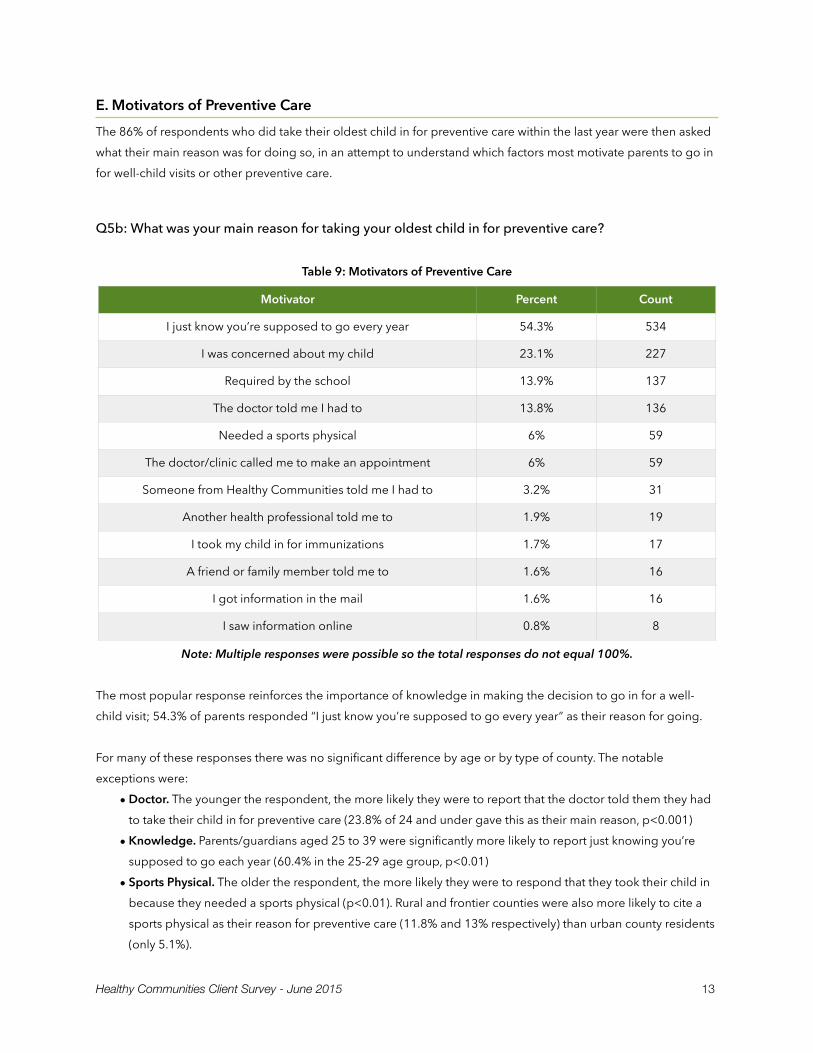
E. Motivators of Preventive Care The 86% of respondents who did take their oldest child in for preventive care within the last year were then asked what their main reason was for doing so, in an attempt to understand which factors most motivate parents to go in for well-child visits or other preventive care.
Q5b: What was your main reason for taking your oldest child in for preventive care?
Table 9: Motivators of Preventive Care
Note: Multiple responses were possible so the total responses do not equal 100%.
The most popular response reinforces the importance of knowledge in making the decision to go in for a well-child visit; 54.3% of parents responded “I just know you’re supposed to go every year” as their reason for going.
For many of these responses there was no significant difference by age or by type of county. The notable exceptions were:
• Doctor. The younger the respondent, the more likely they were to report that the doctor told them they had to take their child in for preventive care (23.8% of 24 and under gave this as their main reason, p<0.001)
• Knowledge. Parents/guardians aged 25 to 39 were significantly more likely to report just knowing you’re supposed to go each year (60.4% in the 25-29 age group, p<0.01)
• Sports Physical. The older the respondent, the more likely they were to respond that they took their child in because they needed a sports physical (p<0.01). Rural and frontier counties were also more likely to cite a sports physical as their reason for preventive care (11.8% and 13% respectively) than urban county residents (only 5.1%).
Motivator Percent Count
I just know you’re supposed to go every year 54.3% 534
I was concerned about my child 23.1% 227
Required by the school 13.9% 137
The doctor told me I had to 13.8% 136
Needed a sports physical 6% 59
The doctor/clinic called me to make an appointment 6% 59
Someone from Healthy Communities told me I had to 3.2% 31
Another health professional told me to 1.9% 19
I took my child in for immunizations 1.7% 17
A friend or family member told me to 1.6% 16
I got information in the mail 1.6% 16
I saw information online 0.8% 8
Healthy Communities Client Survey - June 2015 " 13
• Call from Doctor/Clinic. The 24 and under group was significantly more likely to report that the doctor/clinic called them to make an appointment (10.3%, p<0.05). Frontier county residents were also more likely than other counties to give as a reason that the doctor/clinic called them to make the appointment as their reason for going in for preventive care (15.2% of frontier residents cited this reason, p<0.05)
• Concern for Child. The 40+ age groups were significantly more likely to cite concerns about their child as the reason from bringing them in for preventive care (more than 30% cited this response in those age groups, p<0.05). Urban county residents were significantly more likely to report taking their child in because they were concerned about the child (24.9% versus 10.9% in frontier and 9.2% in rural counties, p<0.01)
• Healthy Communities. Rural county residents were significantly more likely than urban or frontier residents to cite Healthy Communities as the reason they took their child in (11.8% versus 2%, p<0.01)
Many of these differences are easily understood in terms of the ages of the children. Parents of younger children are more likely to be seeing a doctor regularly who tells them when they need to make an appointment or give them a phone call to schedule their next well-child visit. Parents of older children were more likely to need a sports physical for them or be concerned about their pre-teen or adolescent child. Parents ages 25 to 39 are likely to have already had many doctor visits, received orientation from Healthy Communities, and have heard about the importance of an annual exam, attributing it to “just knowing you’re supposed to go each year.”
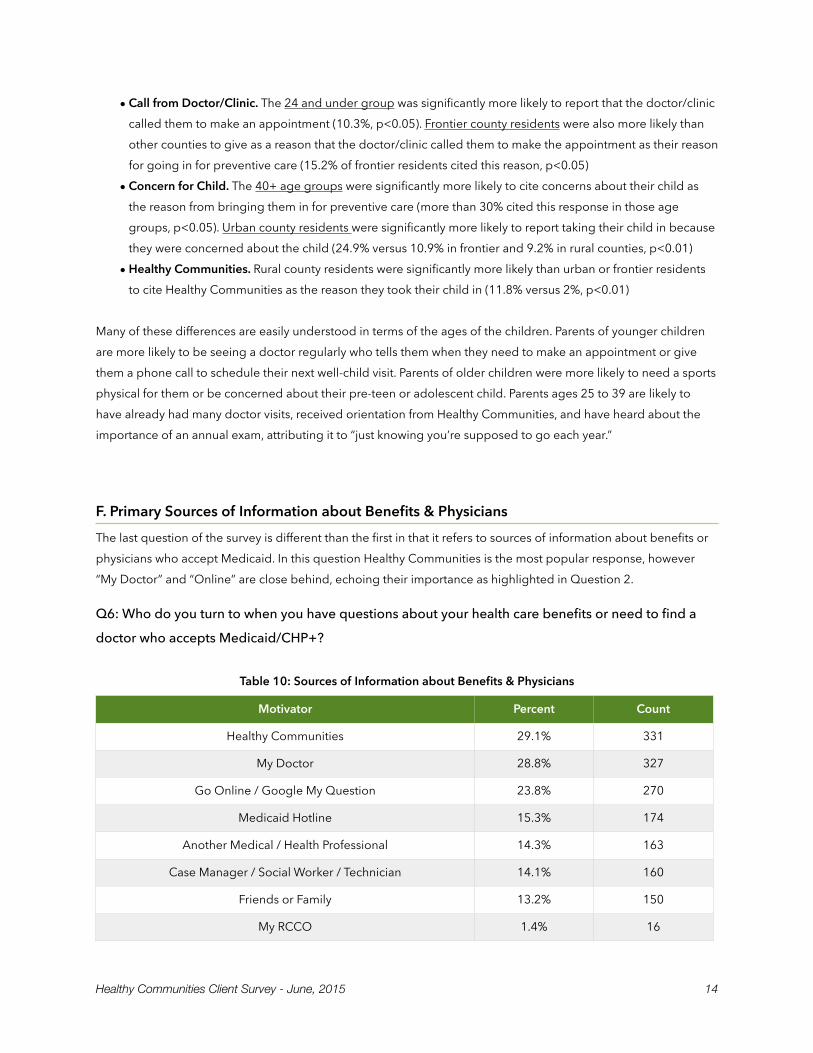
F. Primary Sources of Information about Benefits & Physicians The last question of the survey is different than the first in that it refers to sources of information about benefits or physicians who accept Medicaid. In this question Healthy Communities is the most popular response, however “My Doctor” and “Online” are close behind, echoing their importance as highlighted in Question 2.
Q6: Who do you turn to when you have questions about your health care benefits or need to find a
doctor who accepts Medicaid/CHP+?
Table 10: Sources of Information about Benefits & Physicians
Motivator Percent Count
Healthy Communities 29.1% 331
My Doctor 28.8% 327
Go Online / Google My Question 23.8% 270
Medicaid Hotline 15.3% 174
Another Medical / Health Professional 14.3% 163
Case Manager / Social Worker / Technician 14.1% 160
Friends or Family 13.2% 150
My RCCO 1.4% 16
Healthy Communities Client Survey - June, 2015 " 14
Interviewers were trained to code specific responses such as “Rocky Mountain Health” as “My RCCO” based on who the RCCO in their region is, however there were very few people who mentioned the RCCO as their source of information about benefits and providers.
There were no significant differences between age groups or type of county for some of the responses, however there were a few very notable differences for others.
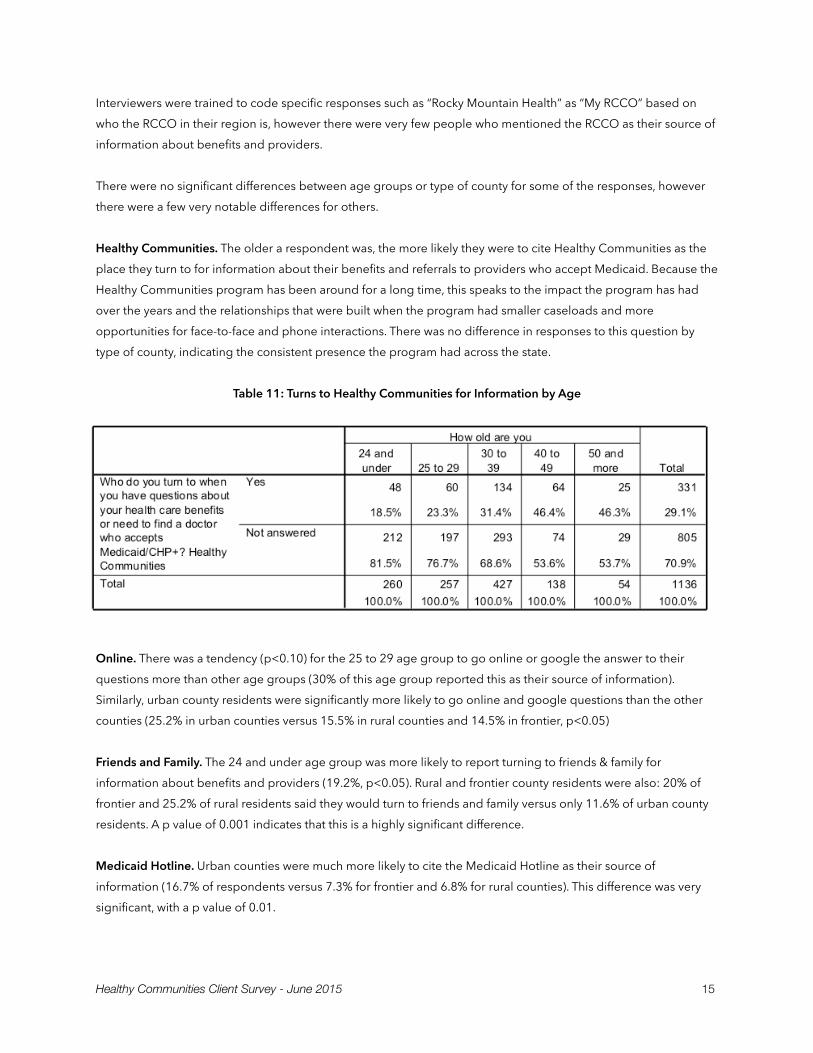
Healthy Communities. The older a respondent was, the more likely they were to cite Healthy Communities as the place they turn to for information about their benefits and referrals to providers who accept Medicaid. Because the Healthy Communities program has been around for a long time, this speaks to the impact the program has had over the years and the relationships that were built when the program had smaller caseloads and more opportunities for face-to-face and phone interactions. There was no difference in responses to this question by type of county, indicating the consistent presence the program had across the state.
Table 11: Turns to Healthy Communities for Information by Age
Online. There was a tendency (p<0.10) for the 25 to 29 age group to go online or google the answer to their questions more than other age groups (30% of this age group reported this as their source of information). Similarly, urban county residents were significantly more likely to go online and google questions than the other counties (25.2% in urban counties versus 15.5% in rural counties and 14.5% in frontier, p<0.05)
Friends and Family. The 24 and under age group was more likely to report turning to friends & family for information about benefits and providers (19.2%, p<0.05). Rural and frontier county residents were also: 20% of frontier and 25.2% of rural residents said they would turn to friends and family versus only 11.6% of urban county residents. A p value of 0.001 indicates that this is a highly significant difference.
Medicaid Hotline. Urban counties were much more likely to cite the Medicaid Hotline as their source of information (16.7% of respondents versus 7.3% for frontier and 6.8% for rural counties). This difference was very significant, with a p value of 0.01.
Healthy Communities Client Survey - June 2015 " 15
Case Manager / Social Worker. Frontier county residents were significantly more likely to report turning to their Case Manager / Social Worker / Technician than the other counties (25.5% of frontier residents versus 8.7% of rural residents and 14% of urban, p<0.05) to answer questions about benefits and providers.
Medical/Health Professionals. Frontier and rural county residents were significantly more likely than urban residents to mention turning to another medical / health professional for information (27.3% and 22.3% respectively, in contrast to only 12.8% of urban residents, p<0.001). Similarly, rural residents were much more likely to report turning to their doctor for this information (49.5% versus 30.9% in frontier counties and only 26.5% in urban counties, p<0.001).
The Important Role of Doctors Doctors clearly play an important role as influencers of health behavior. They were overwhelmingly cited as the top source for most health information (64%), and even cited as the second most important source of information about Medicaid/CHP+ benefits and referrals to other providers who accept these plans.
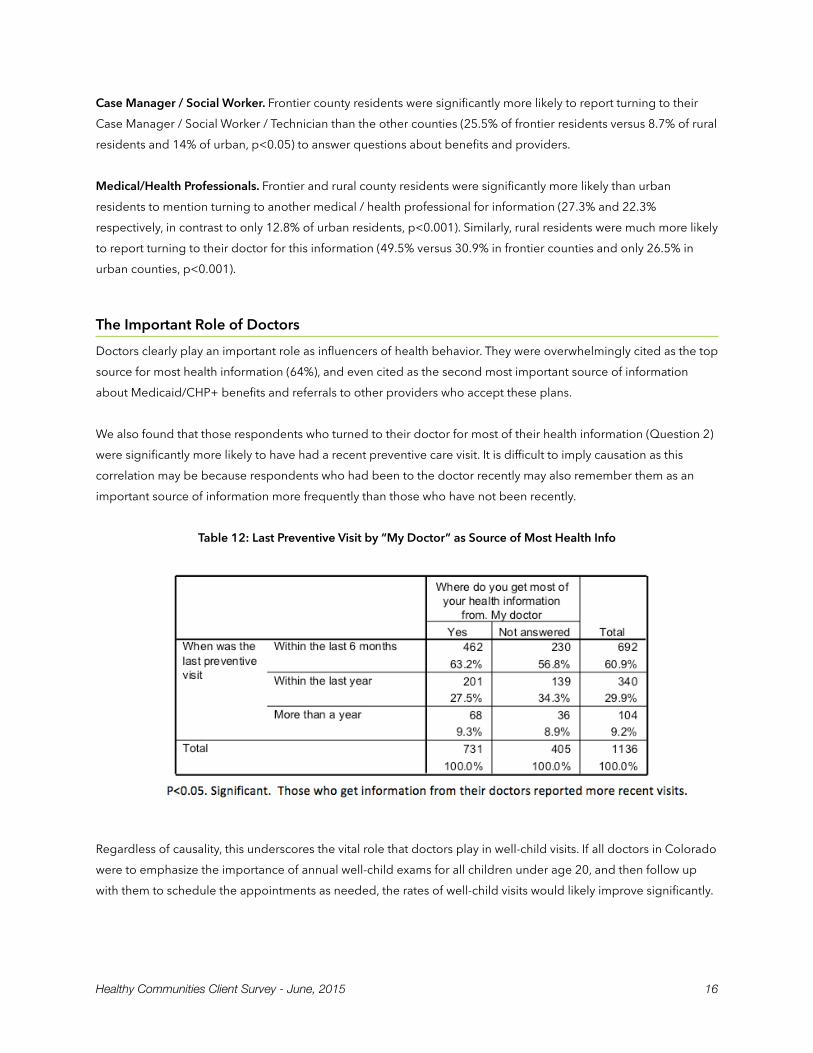
We also found that those respondents who turned to their doctor for most of their health information (Question 2) were significantly more likely to have had a recent preventive care visit. It is difficult to imply causation as this correlation may be because respondents who had been to the doctor recently may also remember them as an important source of information more frequently than those who have not been recently.
Table 12: Last Preventive Visit by “My Doctor” as Source of Most Health Info
Regardless of causality, this underscores the vital role that doctors play in well-child visits. If all doctors in Colorado were to emphasize the importance of annual well-child exams for all children under age 20, and then follow up with them to schedule the appointments as needed, the rates of well-child visits would likely improve significantly.
Healthy Communities Client Survey - June, 2015 " 16
IV. Recommendations The results of this survey help identify a path forward to increase EPSDT outcomes. Based on the findings presented in the previous section, we recommend five key points of action:
1. Educational Campaign. The most important factor cited for NOT taking a child in for preventive care was “I just take my kids to the doctor when they’re sick” (57%) followed by “I didn’t know I should” (20%). Conversely, the most important reason cited for taking a child in for preventive care was “I just know you’re supposed to go every year” (54%). These findings make it clear that knowledge about the importance of annual well-child exams is vital and can make a big difference in outcomes. We recommend that the state spearhead an educational campaign to help change social norms and reinforce the idea of annual well-child exams through age 20 for all children. Findings from this survey also point to the importance of using online media for the educational campaign.
2. Physician Involvement. When it comes to communicating the importance of well-child visits and preventive care, doctors are essential, as highlighted on page 16. Primary care doctors across the state should be given instruction to clearly discuss the benefits of annual well-child visits with all parents/guardians of children under 21. Primary care physicians and pediatricians could be a secondary audience for the educational campaign, with messages tailored specifically to them. Doctors offices / clinics should also take a more active role in scheduling well-child visits at the appropriate intervals (this was also cited as one of the factors that brought families in for preventive care).
3. Online Information. Many younger parents are actively searching online for health information and for answers to their questions about Medicaid benefits and physicians who accept Medicaid. They are also passively absorbing health information they’re exposed to as they spend time online. HCPF must therefore ensure that key information about well-child visits, Medicaid benefits, and providers can be easily found through search engines. This means conducting keyword research to identify the terms parents are actually searching for, adjusting website content to those terms, ensuring backend search engine optimization (SEO) is in place, and also reviewing content to make sure the reading level and terminology used is accessible to Medicaid populations. We also recommend online advertising (via Google AdWords, Facebook Advertising) to get the word out.
4. Preferred Communication Channels. As preferences for email, text messaging, phone calls or print mailing vary across age groups, we recommend asking each family which communication method they prefer during the initial Healthy Communities orientation and welcome to Medicaid (or during the application process). Parents who prefer text messages will receive well-child reminder texts, those who prefer email will get emails, and those who prefer a phone call will receive one. Print mailing can also be used as an additional option in case none of the other three options are accepted or when contact information changes. This will allow for automation and also help ensure that the message gets through in the most cost-effective way possible.
Healthy Communities Client Survey - June 2015 " 17
5. Healthy Communities Staffing. Healthy Communities was the top point of reference for information regarding health care benefits and physician referrals, and the fifth most important source of health information in general. Older age groups were significantly more likely to cite Healthy Communities as an important information source, likely due to the fact that Healthy Communities used to reach a much larger proportion of families on Medicaid when the program had a smaller caseload. Because the initial orientation about Medicaid benefits and the importance of well-child visits is so critical in boosting awareness and increasing the number of people who say “I just know you’re supposed to go every year”, we recommend increasing staffing levels so that Healthy Communities teams can reach more families through one-on-one conversations, with this critical message.
Healthy Communities Client Survey - June, 2015 " 18
V. Conclusion Contrary to some preliminary hypotheses, structural barriers (transportation, lack of providers, lack of childcare, etc) seem to play a less important role in keeping Colorado children on Medicaid from attending their well-child visits.
Instead, knowledge and social norms play a very significant role. Either knowing that you should take your child in for preventive care / well-child visit each year or not knowing that you should is the most important factor reported by Medicaid families as either a motivator or a barrier.
Efforts should therefore focus on increasing awareness of annual well-child visits for all children under age 20 and issuing reminders when it is time for a visit. For this we recommend mobilizing primary care doctors and pediatricians, expanding Healthy Communities teams & practices, and getting information out through a concerted campaign that targets families both online and through other influential media.
With this big push to raise awareness and change social norms, we believe Colorado can increase well-child visits and meet national expectations for EPSDT screening rates.
Healthy Communities Client Survey - June 2015 " 19
Appendix A: Survey Questions
Healthy Communities Client Survey - June, 2015 " 20

Healthy Communities Client Survey
You have been selected to take a short 5-minute survey that will help the State of Colorado better understand and improve the services we offer to Medicaid and CHP+ clients. Your responses will be kept confidential.
Do you agree to participate?
Yes ___ No ___
I will be asking you six questions. Please answer as honestly as you can.
1. How old are you? (Select the appropriate age range that fits their response) • Under 18* (only two teenage mothers under 18 were interviewed) • 18 – 24 • 25 – 29 • 30 – 39 • 40 – 49 • 50 – 59 • 60 – 69 • 70 or older
2. Where do you get MOST of your health information from? (Wait for spontaneous answers, can select more than one)
• My doctor • Online • TV • Radio • Magazines/Newspapers/Print • Friends or Family • Other medical / health professionals • Healthy Communities team • Nurseline
3. Which of the following ways would you want the state to contact you about your Medicaid or CHP+ plan, benefits or well-child checks? (Read each answer) For each of the following the client selected from: No / Okay but not preferred / Yes:
Healthy Communities Client Survey - June 2015 " 21
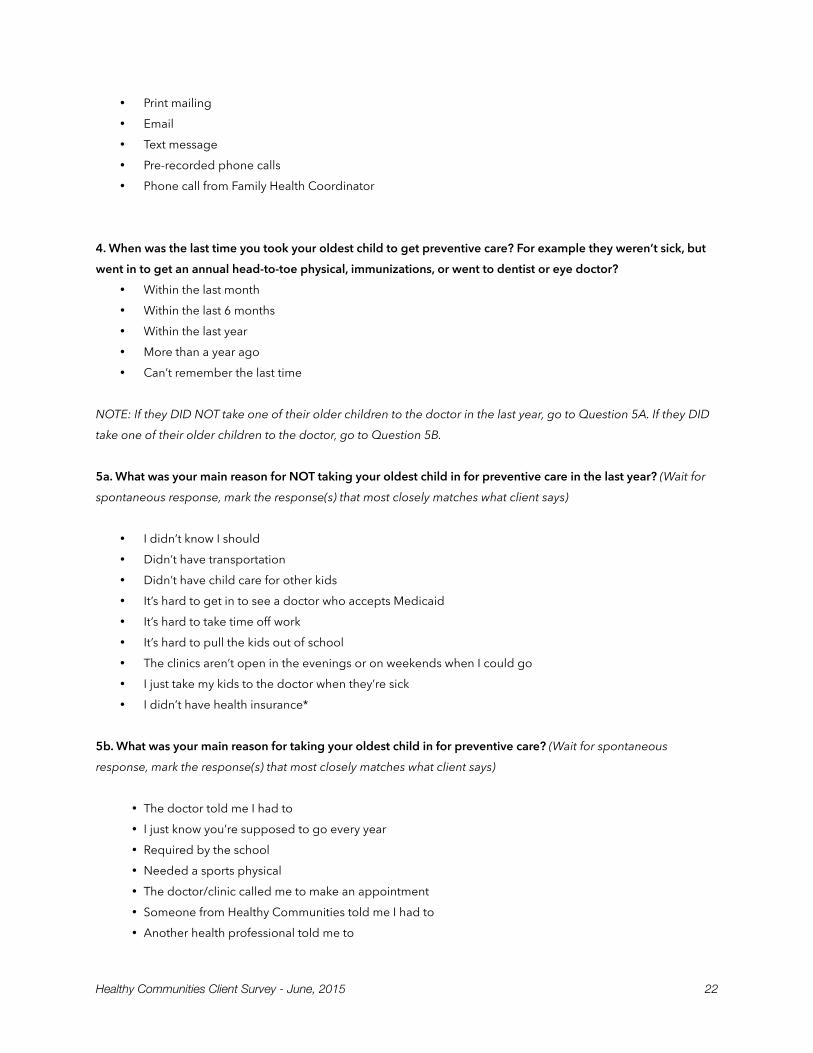
• Print mailing • Email • Text message • Pre-recorded phone calls • Phone call from Family Health Coordinator
4. When was the last time you took your oldest child to get preventive care? For example they weren’t sick, but went in to get an annual head-to-toe physical, immunizations, or went to dentist or eye doctor?
• Within the last month • Within the last 6 months • Within the last year • More than a year ago • Can’t remember the last time
NOTE: If they DID NOT take one of their older children to the doctor in the last year, go to Question 5A. If they DID take one of their older children to the doctor, go to Question 5B.
5a. What was your main reason for NOT taking your oldest child in for preventive care in the last year? (Wait for spontaneous response, mark the response(s) that most closely matches what client says)
• I didn’t know I should • Didn’t have transportation • Didn’t have child care for other kids • It’s hard to get in to see a doctor who accepts Medicaid • It’s hard to take time off work • It’s hard to pull the kids out of school • The clinics aren’t open in the evenings or on weekends when I could go • I just take my kids to the doctor when they’re sick • I didn’t have health insurance*
5b. What was your main reason for taking your oldest child in for preventive care? (Wait for spontaneous response, mark the response(s) that most closely matches what client says)
• The doctor told me I had to • I just know you’re supposed to go every year • Required by the school • Needed a sports physical • The doctor/clinic called me to make an appointment • Someone from Healthy Communities told me I had to • Another health professional told me to
Healthy Communities Client Survey - June, 2015 " 22
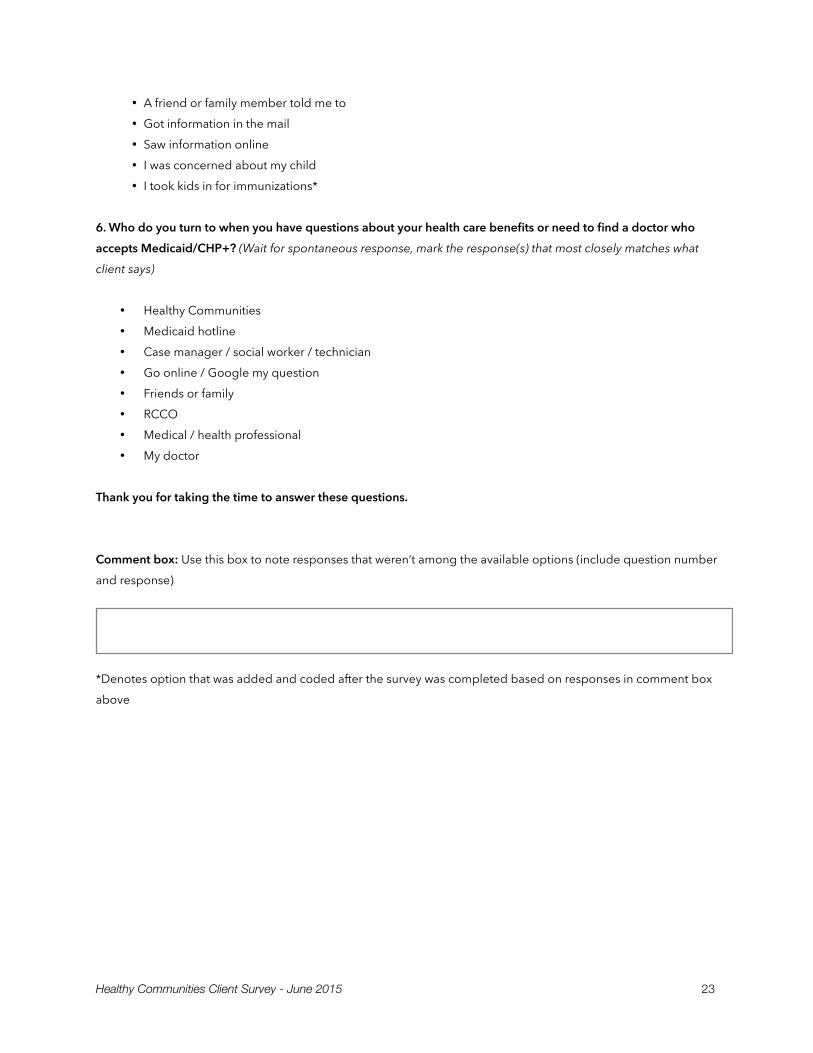
• A friend or family member told me to • Got information in the mail • Saw information online • I was concerned about my child • I took kids in for immunizations*
6. Who do you turn to when you have questions about your health care benefits or need to find a doctor who accepts Medicaid/CHP+? (Wait for spontaneous response, mark the response(s) that most closely matches what client says)
• Healthy Communities • Medicaid hotline • Case manager / social worker / technician • Go online / Google my question • Friends or family • RCCO • Medical / health professional • My doctor
Thank you for taking the time to answer these questions.
Comment box: Use this box to note responses that weren’t among the available options (include question number and response)
*Denotes option that was added and coded after the survey was completed based on responses in comment box above
Healthy Communities Client Survey - June 2015 " 23
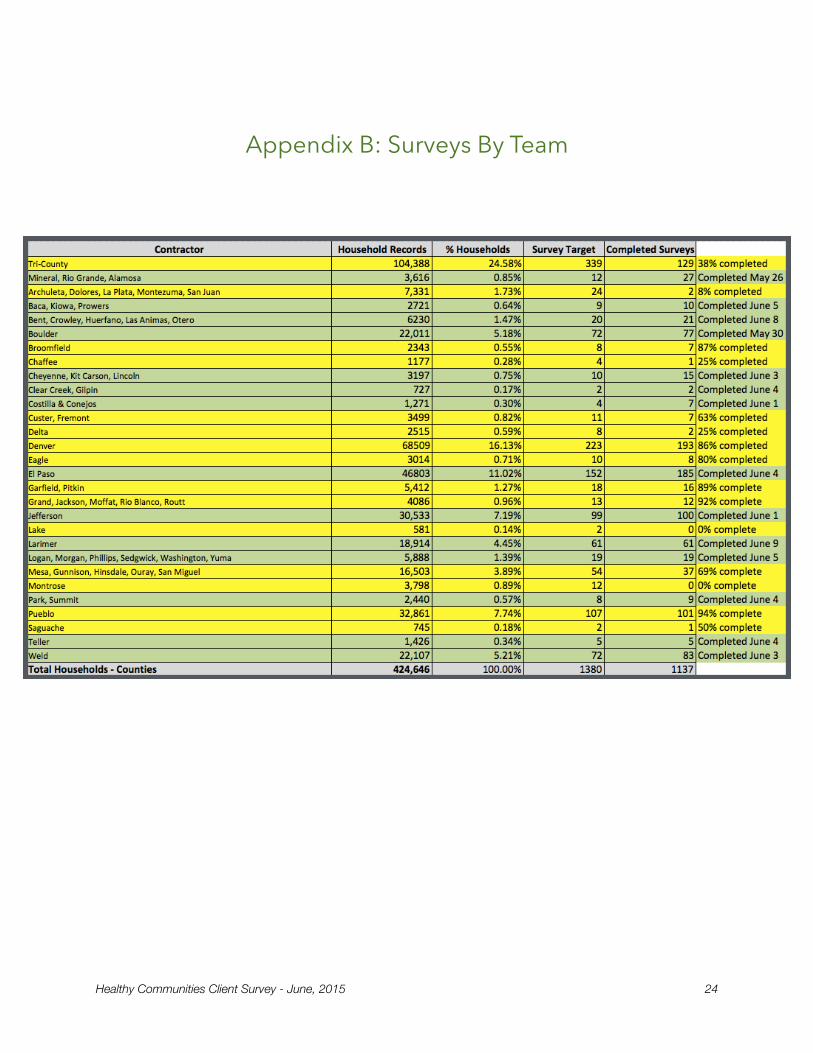
Appendix B: Surveys By Team
Healthy Communities Client Survey - June, 2015 " 24
Appendix C: Surveys by County
Healthy Communities Client Survey - June 2015 " 25

County Name Percent Count
Adams 3.3% 37
Alamosa 0.6% 7
Arapahoe 8.1% 92
Archuleta 0.1% 1
Boulder 6.3% 71
Broomfield 0.6% 7
Chaffee 0.1% 1
Cheyenne 0.1% 1
Clear Creek 0.2% 2
Conejos 0.6% 7
Costilla 0.1% 1
Delta 0.2% 2
Denver 15.7% 178
Douglas 0.4% 4
Eagle 0.7% 8
El Paso 15.9% 181
Fremont 0.6% 7
Garfield 1.1% 13
Gunnison 0.2% 2
Huerfano 1.1% 12
Jefferson 8.6% 98
Kit Carson 1.1% 13
La Plata 0.1% 1
Larimer 5.3% 60
Las Animas 0.3% 3
Lincoln 0.1% 1
Mesa 3.2% 36
Mineral 0.4% 4
Moffat 0.7% 8
Otero 0.5% 6
Healthy Communities Client Survey - June, 2015 " 26
Park 0.4% 4
Phillips 1% 11
Pitkin 0.3% 3
Prowers 0.9% 10
Pueblo 8.6% 98
Rio Grande 1.5% 17
Routt 0.4% 4
Saguache 0.1% 1
Sedgwick 0.6% 7
Summit 0.4% 5
Teller 0.6% 7
Weld 7.7% 87
Yuma 0.2% 2
Unattributed 1.4% 16
Total 100.4% 1136
County Name Percent Count
Healthy Communities Client Survey - June 2015 " 27