healthcare reform and lean leadership
TRANSCRIPT
John S. Toussaint M.D.
AME
11/16/10
Lean Leadership and Health Reform
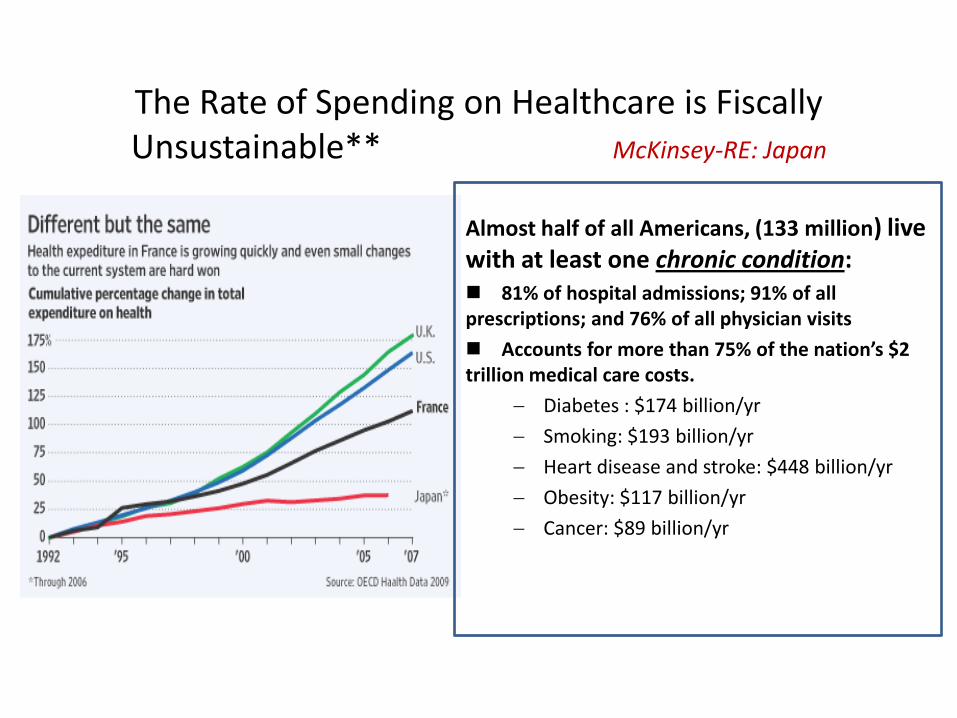
The Rate of Spending on Healthcare is Fiscally Unsustainable** McKinsey-RE: Japan
Almost half of all Americans, (133 million) live with at least one chronic condition: 81% of hospital admissions; 91% of all prescriptions; and 76% of all physician visits
Accounts for more than 75% of the nation’s $2 trillion medical care costs.
Diabetes : $174 billion/yr
Smoking: $193 billion/yr
Heart disease and stroke: $448 billion/yr
Obesity: $117 billion/yr
Cancer: $89 billion/yr
3
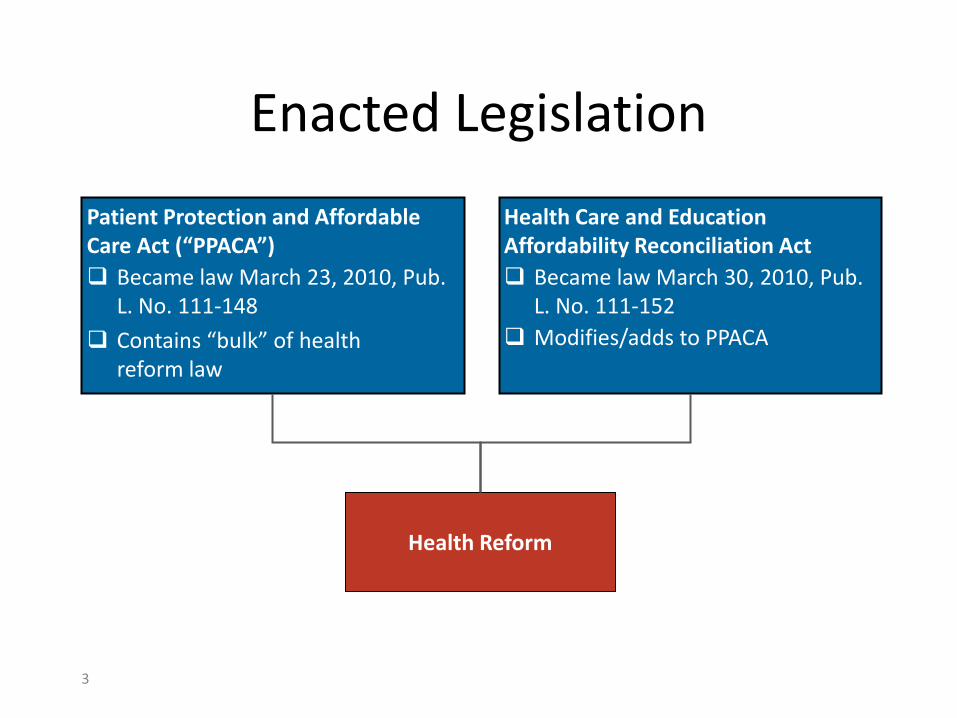
Enacted Legislation
Patient Protection and Affordable Care Act (“PPACA”)
Became law March 23, 2010, Pub. L. No. 111-148
Contains “bulk” of health reform law
Health Care and Education Affordability Reconciliation Act
Became law March 30, 2010, Pub. L. No. 111-152
Modifies/adds to PPACA
Health Reform
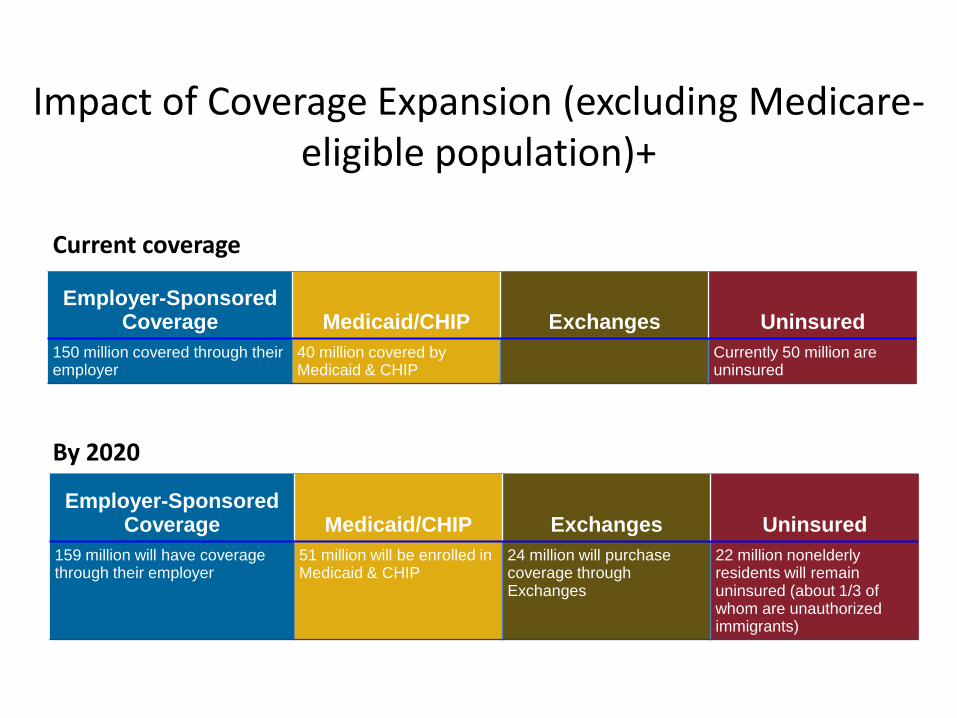
Impact of Coverage Expansion (excluding Medicare-eligible population)+
By 2020
Employer-Sponsored Coverage Medicaid/CHIP Exchanges Uninsured
159 million will have coverage through their employer
51 million will be enrolled in Medicaid & CHIP
24 million will purchase coverage through Exchanges
22 million nonelderly residents will remain uninsured (about 1/3 of whom are unauthorized immigrants)
Current coverage
Employer-Sponsored Coverage Medicaid/CHIP Exchanges Uninsured
150 million covered through their employer
40 million covered by Medicaid & CHIP
Currently 50 million are uninsured
5
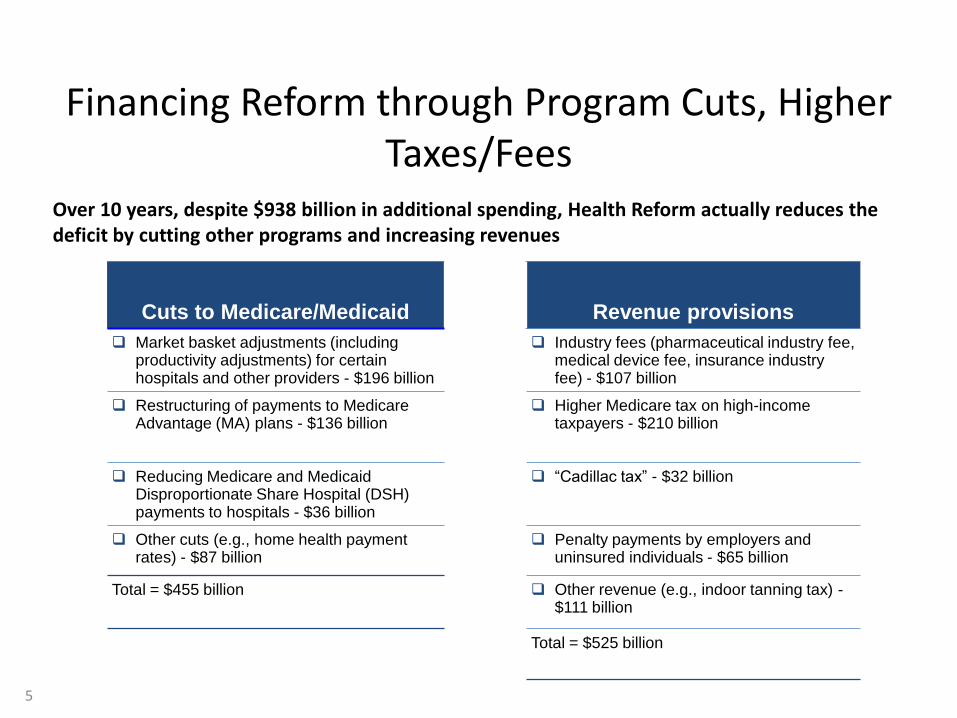
Financing Reform through Program Cuts, Higher Taxes/Fees
Over 10 years, despite $938 billion in additional spending, Health Reform actually reduces the deficit by cutting other programs and increasing revenues
Cuts to Medicare/Medicaid Revenue provisions
Market basket adjustments (including productivity adjustments) for certain hospitals and other providers - $196 billion
Industry fees (pharmaceutical industry fee, medical device fee, insurance industry fee) - $107 billion
Restructuring of payments to Medicare Advantage (MA) plans - $136 billion
Higher Medicare tax on high-income taxpayers - $210 billion
Reducing Medicare and Medicaid Disproportionate Share Hospital (DSH) payments to hospitals - $36 billion
“Cadillac tax” - $32 billion
Other cuts (e.g., home health payment rates) - $87 billion
Penalty payments by employers and uninsured individuals - $65 billion
Total = $455 billion Other revenue (e.g., indoor tanning tax) -$111 billion
Total = $525 billion
6
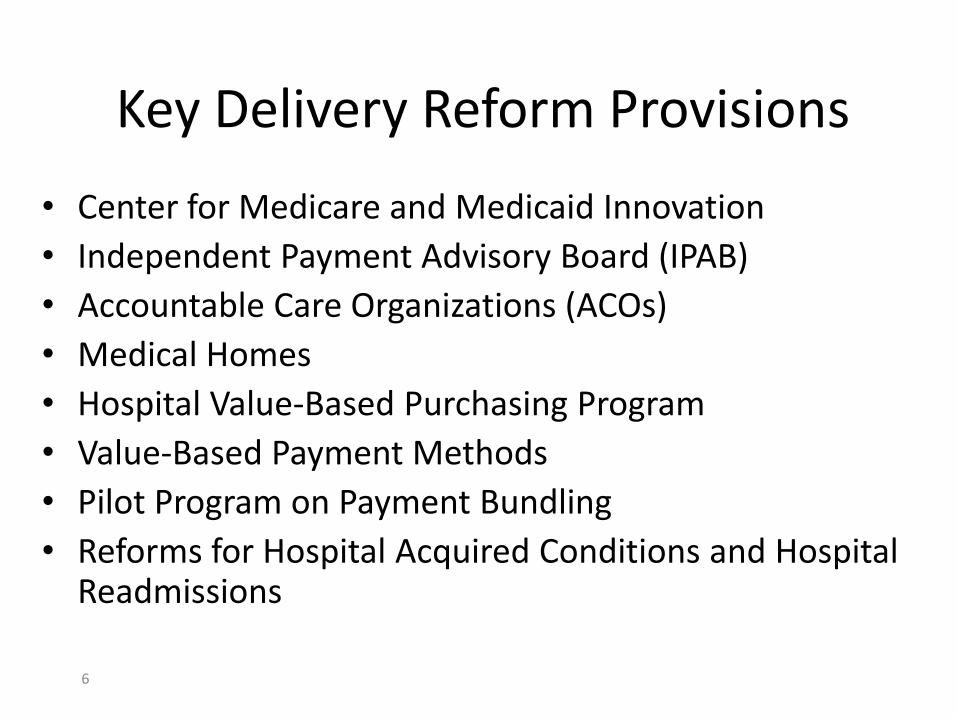
Key Delivery Reform Provisions
• Center for Medicare and Medicaid Innovation
• Independent Payment Advisory Board (IPAB)
• Accountable Care Organizations (ACOs)
• Medical Homes
• Hospital Value-Based Purchasing Program
• Value-Based Payment Methods
• Pilot Program on Payment Bundling
• Reforms for Hospital Acquired Conditions and Hospital Readmissions
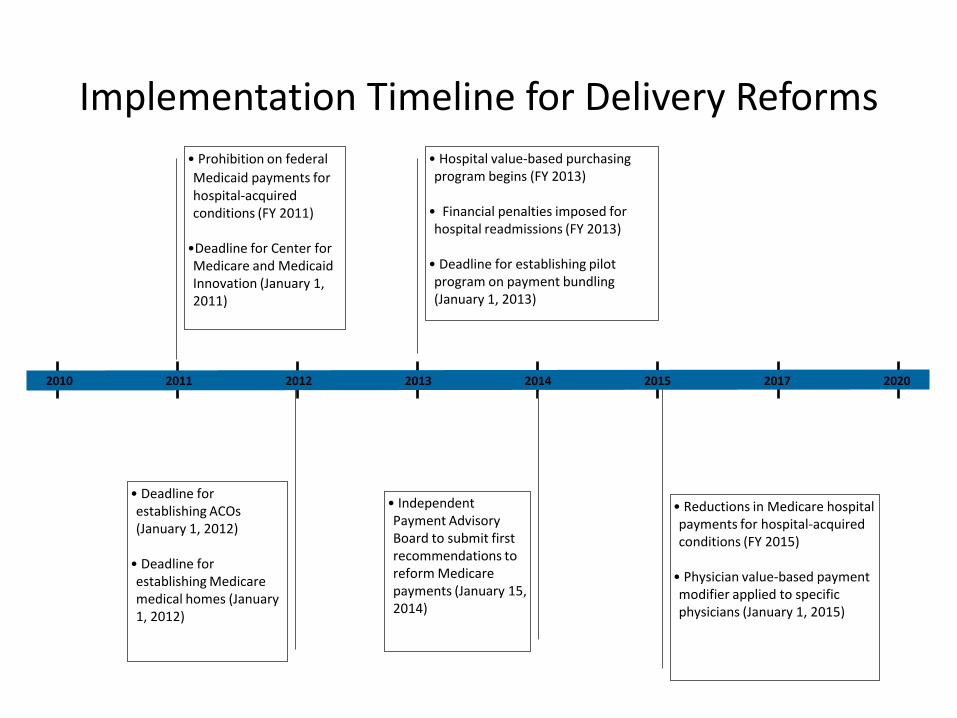
Implementation Timeline for Delivery Reforms
• Hospital value-based purchasing program begins (FY 2013)
• Financial penalties imposed for hospital readmissions (FY 2013)
• Deadline for establishing pilot program on payment bundling (January 1, 2013)
• Deadline for establishing ACOs (January 1, 2012)
• Deadline for establishing Medicare medical homes (January 1, 2012)
• Reductions in Medicare hospital payments for hospital-acquired conditions (FY 2015)
• Physician value-based payment modifier applied to specific physicians (January 1, 2015)
2013 2014 2015 2017 20202010 2011 2012
• Prohibition on federal
Medicaid payments for hospital-acquired conditions (FY 2011)
•Deadline for Center for Medicare and Medicaid Innovation (January 1, 2011)
• Independent Payment Advisory Board to submit first recommendations to reform Medicare payments (January 15, 2014)

• “You can count on Americans to do the right thing … after they have tried everything else” (Winston Churchill)
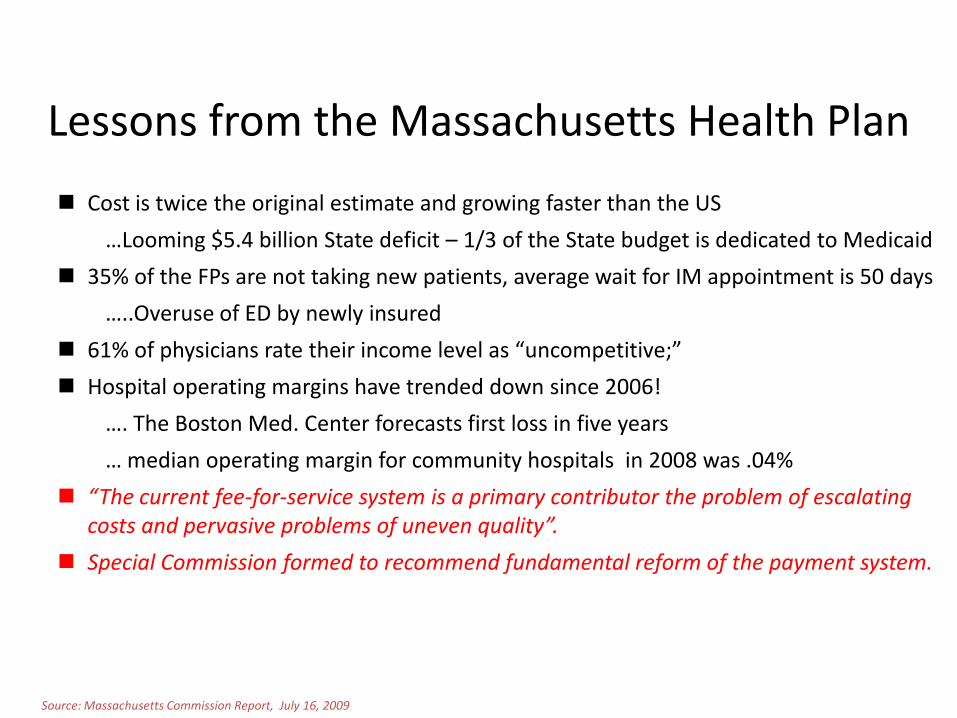
Lessons from the Massachusetts Health Plan
Cost is twice the original estimate and growing faster than the US
…Looming $5.4 billion State deficit – 1/3 of the State budget is dedicated to Medicaid
35% of the FPs are not taking new patients, average wait for IM appointment is 50 days
…..Overuse of ED by newly insured
61% of physicians rate their income level as “uncompetitive;”
Hospital operating margins have trended down since 2006!
…. The Boston Med. Center forecasts first loss in five years
… median operating margin for community hospitals in 2008 was .04%
“The current fee-for-service system is a primary contributor the problem of escalating costs and pervasive problems of uneven quality”.
Special Commission formed to recommend fundamental reform of the payment system.
Source: Massachusetts Commission Report, July 16, 2009
Core components of the public policy problem?
• Payment systems that do not reward healthcare providers to deliver better value
• Lack of transparency of performance
• Providers lack of a consistent methodology to improve care
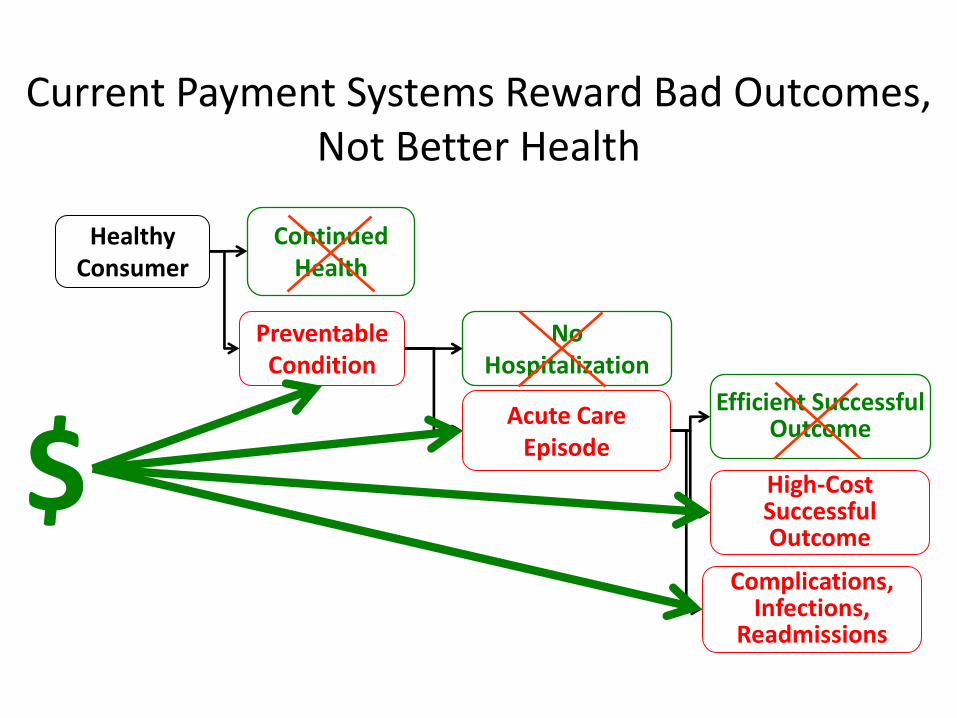
Current Payment Systems Reward Bad Outcomes, Not Better Health
PreventableCondition
ContinuedHealth
HealthyConsumer
NoHospitalization
Acute Care Episode
Efficient Successful Outcome
Complications,Infections,
Readmissions
High-CostSuccessfulOutcome
$
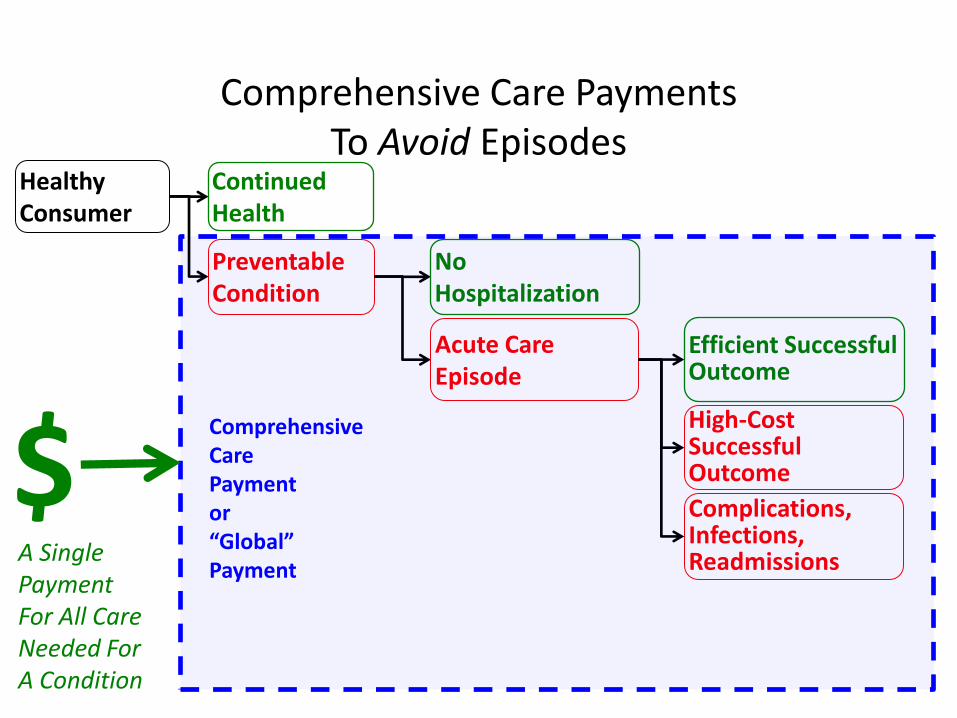
Comprehensive Care PaymentsTo Avoid Episodes
PreventableCondition
ContinuedHealth
HealthyConsumer
NoHospitalization
Acute Care Episode
Efficient Successful Outcome
Complications,Infections,Readmissions
High-CostSuccessfulOutcome
A Single PaymentFor All CareNeeded ForA Condition
$ComprehensiveCarePaymentor“Global”Payment
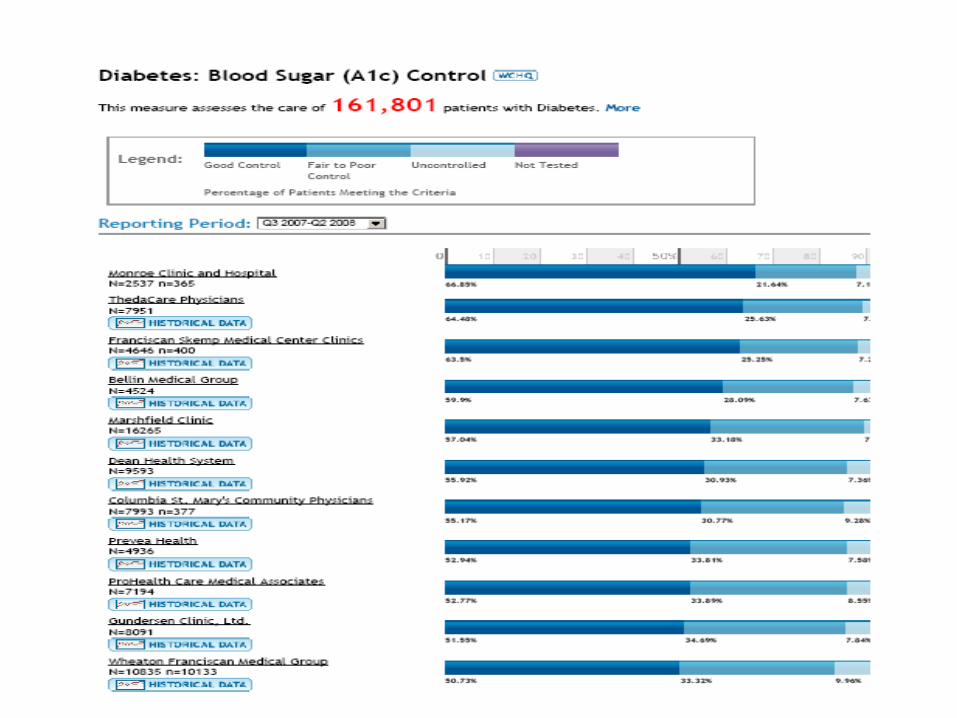
Transparency of Healthcare Performance
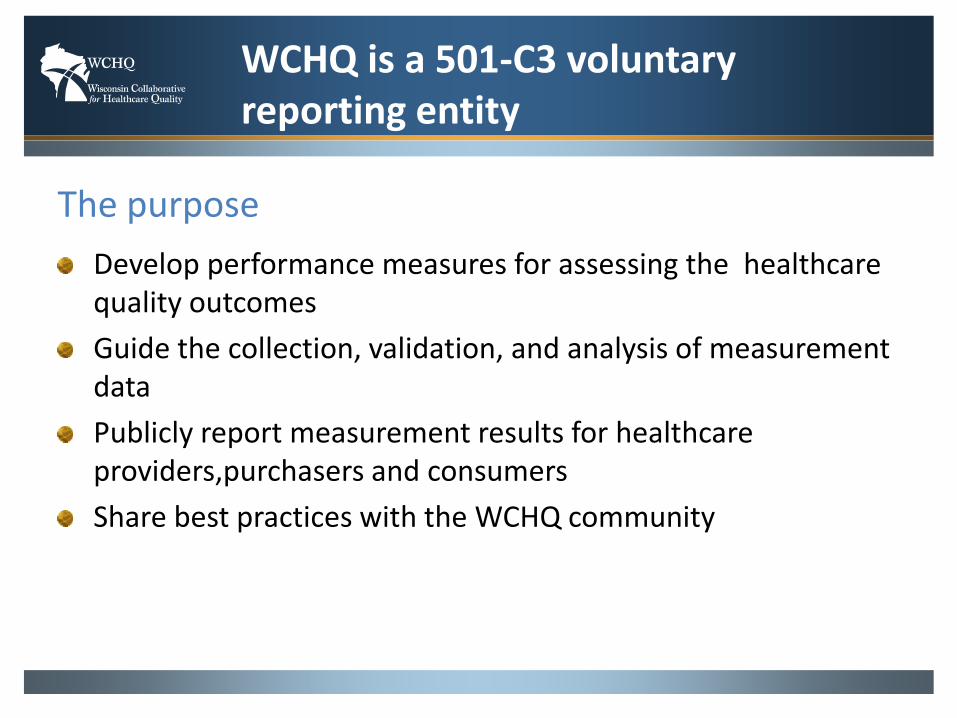
Develop performance measures for assessing the healthcare quality outcomes
Guide the collection, validation, and analysis of measurement data
Publicly report measurement results for healthcare providers,purchasers and consumers
Share best practices with the WCHQ community
WCHQ is a 501-C3 voluntary reporting entity
The purpose
Wisconsin Health Information Organization
• The WHIO Health Analytics Exchange At-a-Glance
-- The Exchange contains claims data that spans multiple care systems and services provided statewide
-- The Exchange holds a rolling 27 months of claims data on the majority of people in Wisconsin
-- The Exchange contains 7.3 million “episodes of care” which capture the patient quality and cost experience over time with conditions such as pneumonia, diabetes, congestive heart failure and 750 others.
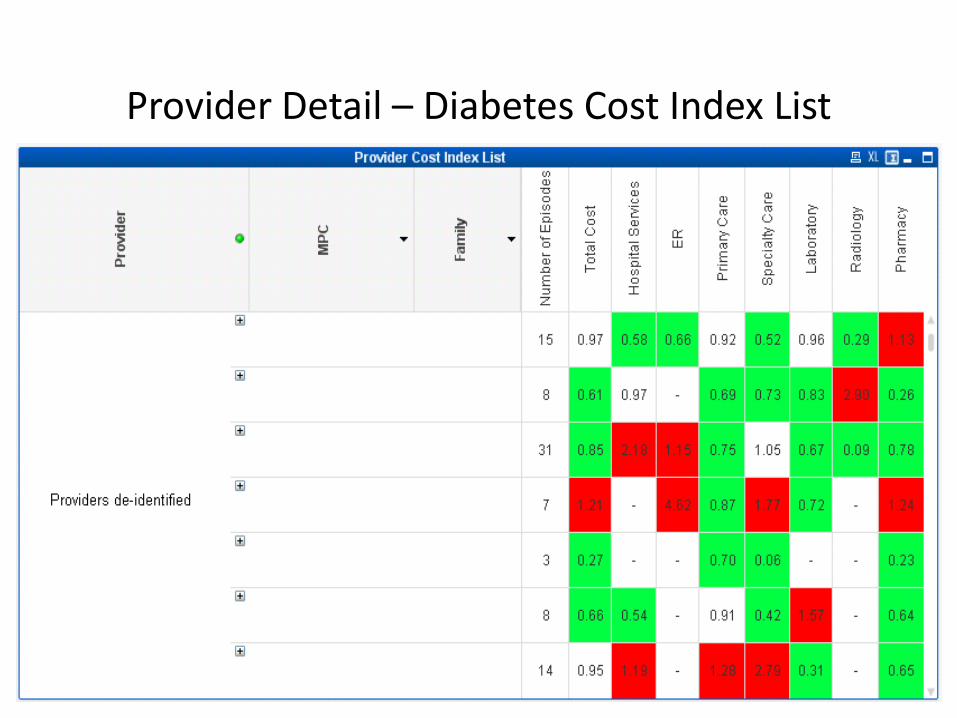
Provider Detail – Diabetes Cost Index List
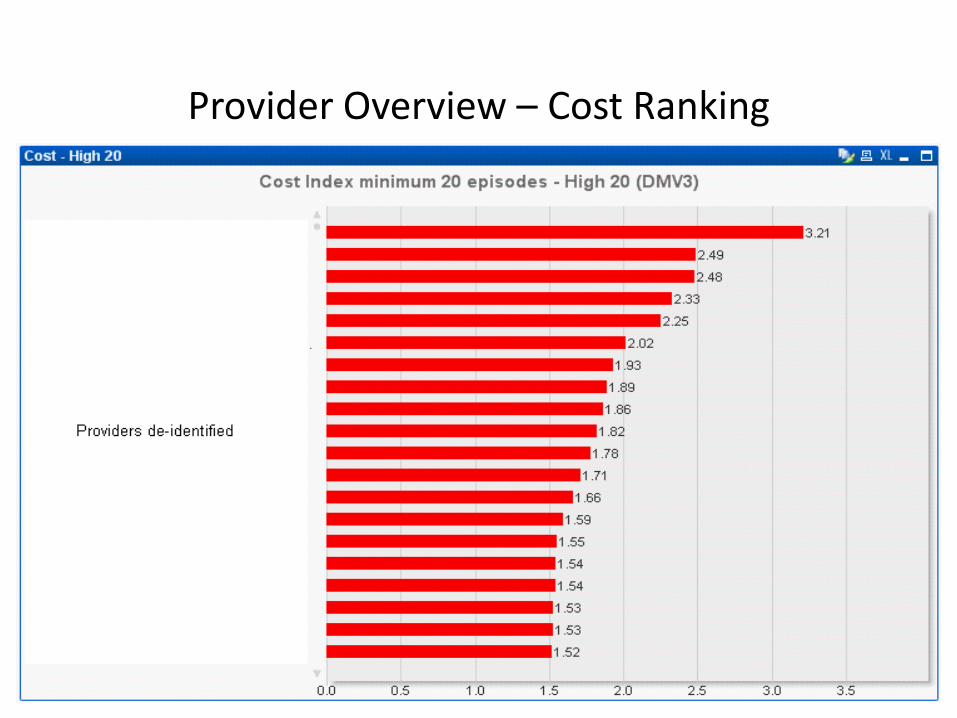
Provider Overview – Cost Ranking
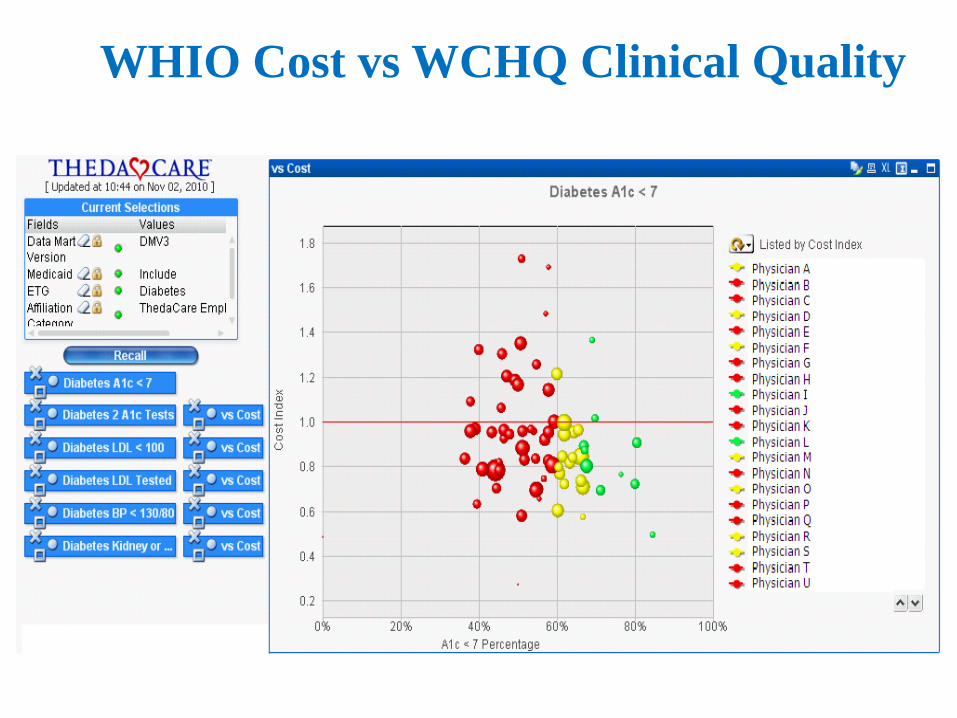
WHIO Cost vs WCHQ Clinical Quality
We must revolutionize healthcare delivery but how?
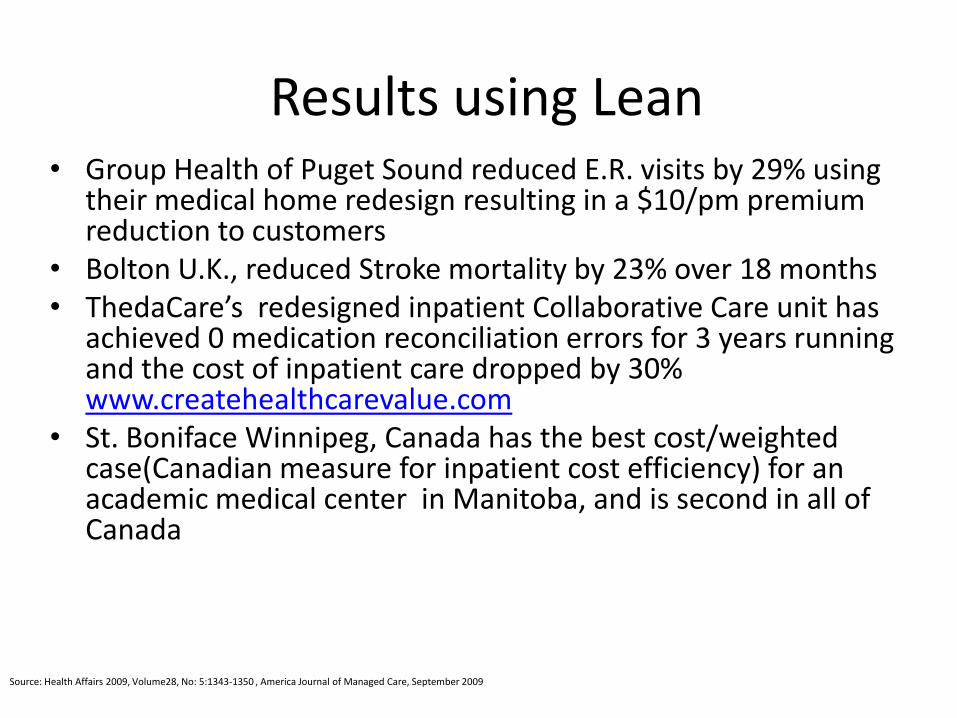
Results using Lean• Group Health of Puget Sound reduced E.R. visits by 29% using
their medical home redesign resulting in a $10/pm premium reduction to customers
• Bolton U.K., reduced Stroke mortality by 23% over 18 months• ThedaCare’s redesigned inpatient Collaborative Care unit has
achieved 0 medication reconciliation errors for 3 years running and the cost of inpatient care dropped by 30% www.createhealthcarevalue.com
• St. Boniface Winnipeg, Canada has the best cost/weighted case(Canadian measure for inpatient cost efficiency) for an academic medical center in Manitoba, and is second in all of Canada
Source: Health Affairs 2009, Volume28, No: 5:1343-1350 , America Journal of Managed Care, September 2009

The Methodology of Lean
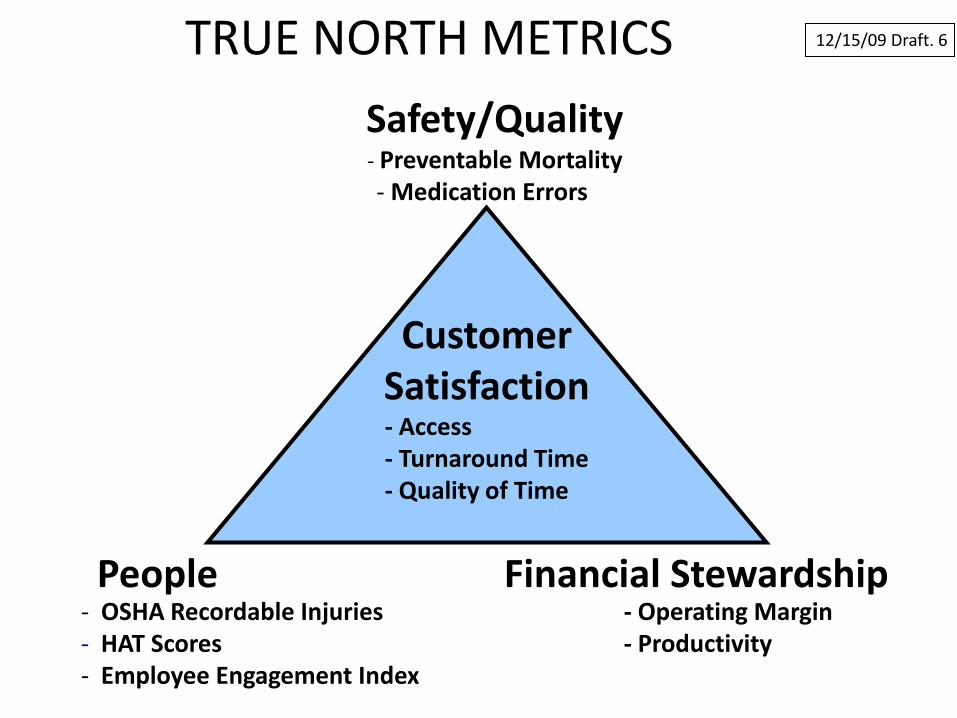
- OSHA Recordable Injuries- HAT Scores- Employee Engagement Index
- Operating Margin- Productivity
Financial StewardshipPeople
Safety/Quality- Preventable Mortality - Medication Errors
- Access- Turnaround Time- Quality of Time
12/15/09 Draft. 6
CustomerSatisfaction
TRUE NORTH METRICS
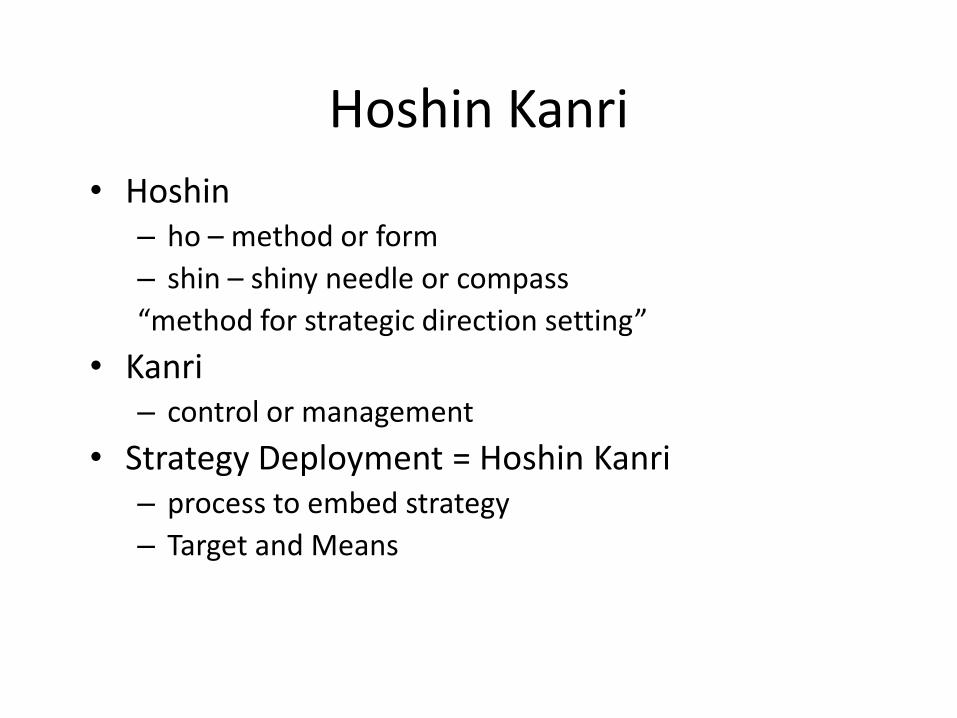
Hoshin Kanri
• Hoshin– ho – method or form
– shin – shiny needle or compass
“method for strategic direction setting”
• Kanri– control or management
• Strategy Deployment = Hoshin Kanri– process to embed strategy
– Target and Means
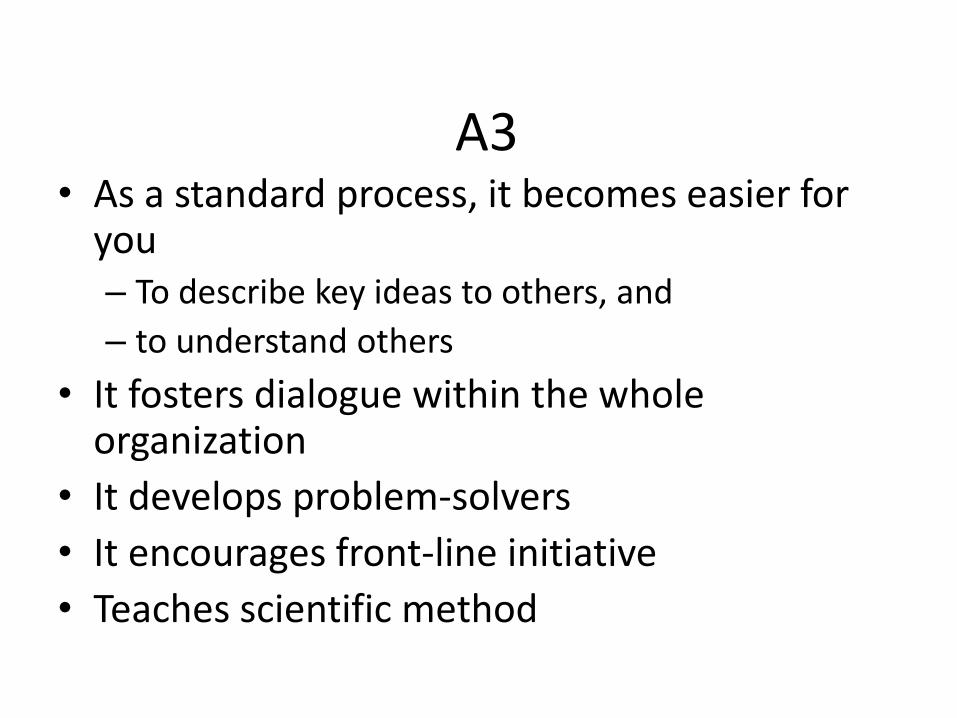
A3• As a standard process, it becomes easier for
you – To describe key ideas to others, and
– to understand others
• It fosters dialogue within the whole organization
• It develops problem-solvers
• It encourages front-line initiative
• Teaches scientific method
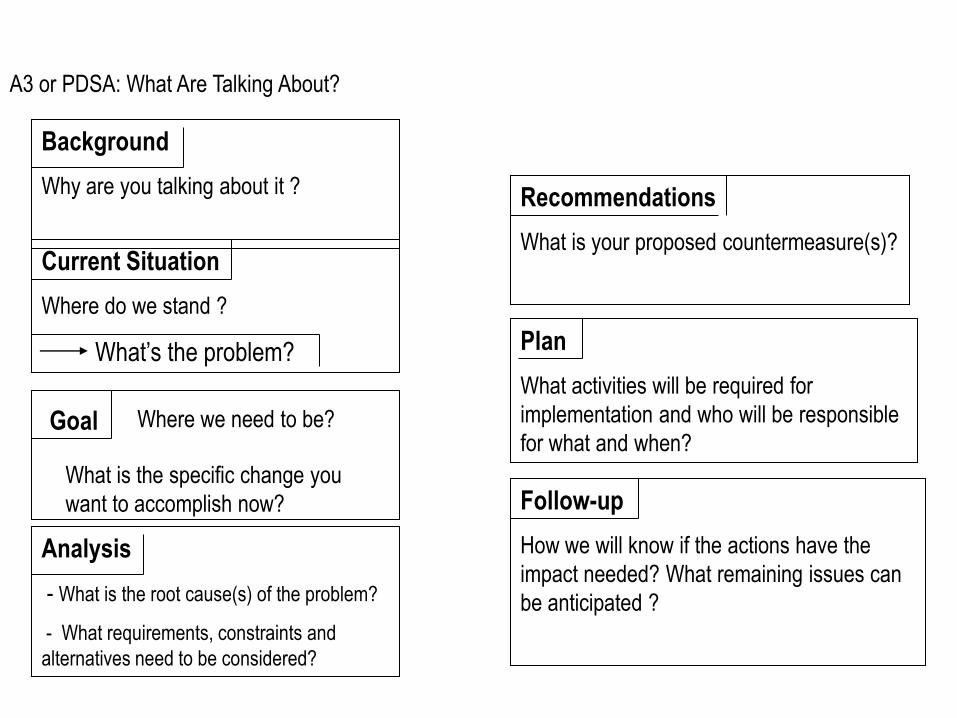
Background
Why are you talking about it ?
Current Situation
Where do we stand ?
What’s the problem?
Analysis
- What is the root cause(s) of the problem?
- What requirements, constraints and
alternatives need to be considered?
Goal Where we need to be?
What is the specific change you
want to accomplish now?
Plan
What activities will be required for
implementation and who will be responsible
for what and when?
Recommendations
What is your proposed countermeasure(s)?
Follow-up
How we will know if the actions have the
impact needed? What remaining issues can
be anticipated ?
A3 or PDSA: What Are Talking About?
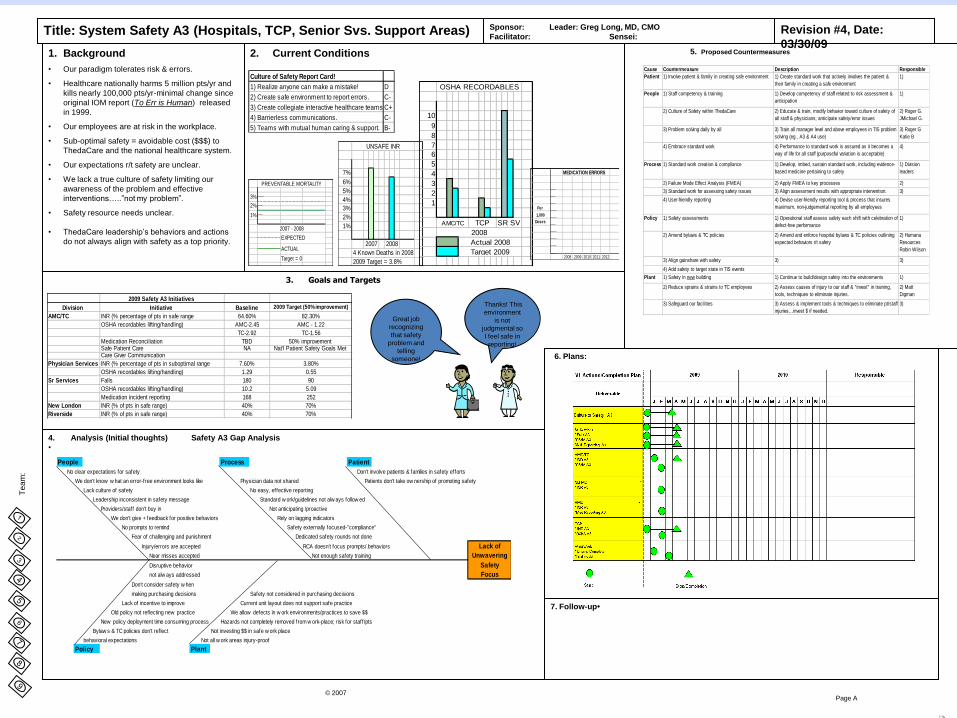
Title: System Safety A3 (Hospitals, TCP, Senior Svs. Support Areas)
2. Current Conditions1. Background
• Our paradigm tolerates risk & errors.
• Healthcare nationally harms 5 million pts/yr and
kills nearly 100,000 pts/yr-minimal change since
original IOM report (To Err is Human) released
in 1999.
• Our employees are at risk in the workplace.
• Sub-optimal safety = avoidable cost ($$$) to
ThedaCare and the national healthcare system.
• Our expectations r/t safety are unclear.
• We lack a true culture of safety limiting our
awareness of the problem and effective
interventions…..”not my problem”.
• Safety resource needs unclear.
• ThedaCare leadership’s behaviors and actions
do not always align with safety as a top priority.
3. Goals and Targets
4. Analysis (Initial thoughts) Safety A3 Gap Analysis
•
Te
am
:
Page A© 2007
5. Proposed Countermeasures
7. Follow-up•
6. Plans:
Revision #4, Date:
03/30/09
Sponsor: Leader: Greg Long, MD, CMO
Facilitator: Sensei:
Culture of Safety Report Card!
1) Realize anyone can make a mistake! D
2) Create safe environment to report errors. C-
3) Create collegiate interactive healthcare teams.C+
4) Barrierless communications. C-
5) Teams with mutual human caring & support. B-
2009 Safety A3 Initiatives
Division Initiative Baseline 2009 Target (50% improvement)
AMC/TC INR (% percentage of pts in safe range 64.60% 82.30%
OSHA recordables lifting/handling) AMC-2.45 AMC - 1.22
TC-2.92 TC-1.56
Medication Reconciliation TBD 50% improvement Safe Patient Care NA Nat'l Patient Safety Goals Met Care Giver Communication
Physician Services INR (% percentage of pts in suboptimal range 7.60% 3.80%
OSHA recordables lifting/handling) 1.29 0.55
Sr Services Falls 180 90
OSHA recordables lifting/handling) 10.2 5.09
Medication incident reporting 168 252
New London INR (% of pts in safe range) 40% 70%
Riverside INR (% of pts in safe range) 40% 70%
7%
6%
5%
4%
3%
2%
1%
2009 Target = 3.8%
UNSAFE INR
2007 2008
4 Known Deaths in 2008
10
9
8
7
6
5
4
3
2
1
Target 2009
OSHA RECORDABLES
AMC/TC TCP SR SV
2008
Actual 2008
Thanks! This
environment
is not
judgmental so
I feel safe in
reporting!
Great job
recognizing
that safety
problem and
telling
someone!
Cause Countermeasure Description Responsible
Patient 1) Involve patient & family in creating safe environment 1) Create standard work that actively involves the patient &
their family in creating a safe environment
1)
People 1) Staff competency & training 1) Develop competency of staff related to risk assessment &
anticipation
1)
2) Culture of Safety within ThedaCare 2) Educate & train, modify behavior toward culture of safety of
all staff & physicians; anticipate safety/error issues
2) Roger G.
JMichael G.
3) Problem solving daily by all 3) Train all manager level and above employees in TIS problem
solving (eg., A3 & A4 use)
3) Roger G
Katie B
4) Embrace standard work 4) Performance to standard work is assured as it becomes a
way of life for all staff (purposeful variation is acceptable)
4)
Process 1) Standard work creation & compliance 1) Develop, imbed, sustain standard work, including evidence-
based medicine pertaining to safety
1) Division
leaders
2) Failure Mode Effect Analysis (FMEA) 2) Apply FMEA to key processes 2)
3) Standard work for assessing safety issues 3) Align assessment results with appropriate intervention. 3)
4) User-friendly reporting 4) Devise user-friendly reporting tool & process that insures
maximum, non-judgemental reporting by all employees
Policy 1) Safety assessments 1) Operational staff assess safety each shift with celebration of
defect-free performance
1)
2) Amend bylaws & TC policies 2) Amend and enforce hospital bylaws & TC policies outlining
expected behaviors r/t safety
2) Humana
Resources
Robin Wilson
3) Align gainshare with safety 3) 3)
4) Add safety to target state in TIS events
Plant 1) Safety in new building 1) Continue to build/design safety into the environments 1)
2) Reduce sprains & strains to TC employees 2) Assess causes of injury to our staff & "invest" in training,
tools, techniques to eliminate injuries.
2) Matt
Digman
3) Safeguard our facilities 3) Assess & implement tools & techniques to eliminate pt/staff
injuries…invest $ if needed.
3)
People Process Patient
No clear expectations for safety Don't involve patients & families in safety efforts
We don't know w hat an error-free environment looks like Physician data not shared Patients don't take ow nership of promoting safety
Lack culture of safety No easy, effective reporting
Leadership inconsistent in safety message Standard w ork/guidelines not alw ays follow ed
Providers/staff don't buy in Not anticipating /proactive
We don't give + feedback for positive behaviors Rely on lagging indicators
No prompts to remind Safety externally focused-"compliance"
Fear of challenging and punishment Dedicated safety rounds not done
Injury/errors are accepted RCA doesn't focus prompts/.behaviors Lack of
Near misses accepted Not enough safety training Unwavering
Disruptive behavior Safety
not alw ays addressed Focus
Don't consider safety w hen
making purchasing decisions Safety not considered in purchasing decisions
Lack of incentive to improve Current unit layout does not support safe practice
Old policy not reflecting new practice We allow defects in w ork environments/practices to save $$
New policy deployment time consuming process Hazards not completely removed from w ork-place; risk for staff/pts
Bylaw s & TC policies don't reflect Not investing $$ in safe w ork place
behavioral expectations Not all w ork areas injury-proof
Policy Plant
Target = 0
EXPECTED
ACTUAL
PREVENTABLE MORTALITY
3%
2%
1%
2007 - 2008
MEDICATION ERRORS
Per
1,000
Doses
2008 2009 2010 2011 2012
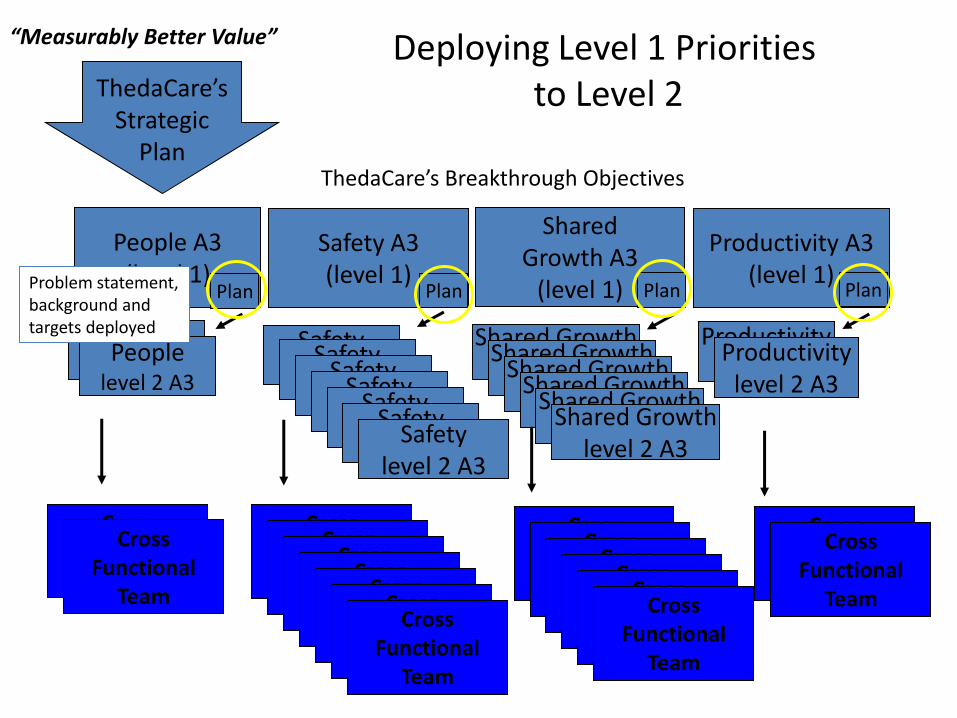
Deploying Level 1 Prioritiesto Level 2ThedaCare’s
StrategicPlan
Safety(level 2)
People(level 2)
Peoplelevel 2 A3
Safety(level 2)
Safety(level 2)
Safety(level 2)
Safety(level 2)
Safety(level 2)
Safetylevel 2 A3
Shared Growth(level 2)
Shared Growth(level 2)
Shared Growth(level 2)
Shared Growth(level 2)
Shared Growth(level 2)
Shared Growthlevel 2 A3
Productivity(level 2)Productivity
level 2 A3
Safety A3(level 1)
People A3(level 1)
SharedGrowth A3
(level 1)
Productivity A3(level 1)
Plan Plan Plan Plan
ThedaCare’s Breakthrough Objectives
“Measurably Better Value”
Cross Function
Team
Cross Functional
Team
Cross Function
Team
Cross Function
Team
Cross Function
Team
Cross Function
Team
Cross Function
Team
Cross Function
Team
Cross Functional
Team
Cross Function
Team
Cross Function
Team
Cross Function
Team
Cross Function
Team
Cross Function
Team
Cross Functional
Team
Cross Function
Team
Cross Functional
Team
Problem statement, background and targets deployed
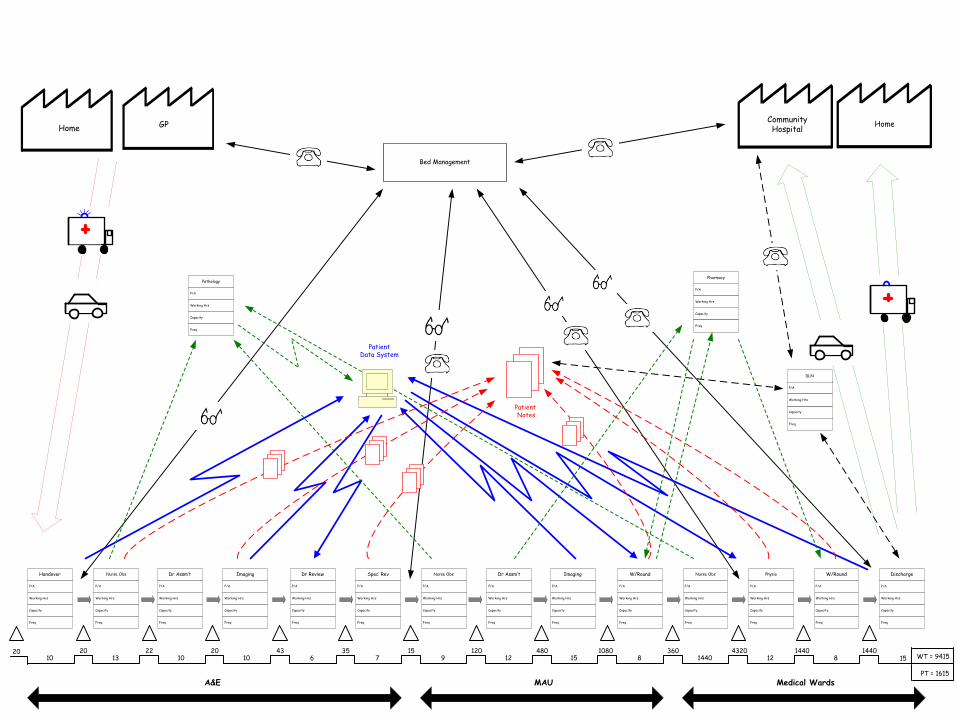
Patient Notes
P/A
Capacity
Working Hrs
Freq
Handover
P/A
Capacity
Working Hrs
Freq
Nurse Obs
P/A
Capacity
Working Hrs
Freq
Dr Assm’t
P/A
Capacity
Working Hrs
Freq
Imaging
P/A
Capacity
Working Hrs
Freq
Dr Review
P/A
Capacity
Working Hrs
Freq
Spec’ Rev
P/A
Capacity
Working Hrs
Freq
Nurse Obs
P/A
Capacity
Working Hrs
Freq
Dr Assm’t
P/A
Capacity
Working Hrs
Freq
Imaging
P/A
Capacity
Working Hrs
Freq
W/Round
P/A
Capacity
Working Hrs
Freq
Nurse Obs
P/A
Capacity
Working Hrs
Freq
Physio
P/A
Capacity
Working Hrs
Freq
W/Round
P/A
Capacity
Working Hrs
Freq
Discharge
GPHome HomeCommunity Hospital
A&E MAU Medical Wards
2010
2013
2210
2010
436
357
159
12012
48015
10808
3601440
432012
14408
144015 WT = 9415
PT = 1615
Bed Management
PatientData System
P/A
Capacity
Working Hrs
Freq
Pathology
P/A
Capacity
Working Hrs
Freq
Pharmacy
P/A
Capacity
Working Hrs
Freq
DLN

VIDEO
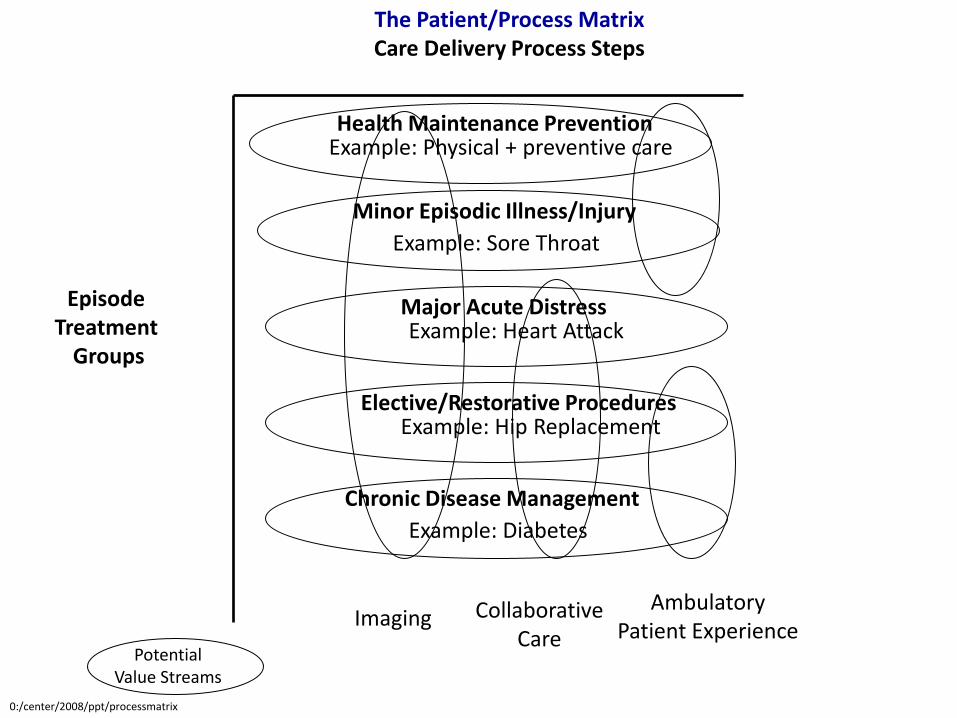
PotentialValue Streams
The Patient/Process MatrixCare Delivery Process Steps
Health Maintenance Prevention
Minor Episodic Illness/Injury
Major Acute Distress
Elective/Restorative Procedures
Chronic Disease Management
Episode Treatment
Groups
Imaging CollaborativeCare
AmbulatoryPatient Experience
Example: Physical + preventive care
Example: Heart Attack
Example: Hip Replacement
Example: Diabetes
Example: Sore Throat
0:/center/2008/ppt/processmatrixex
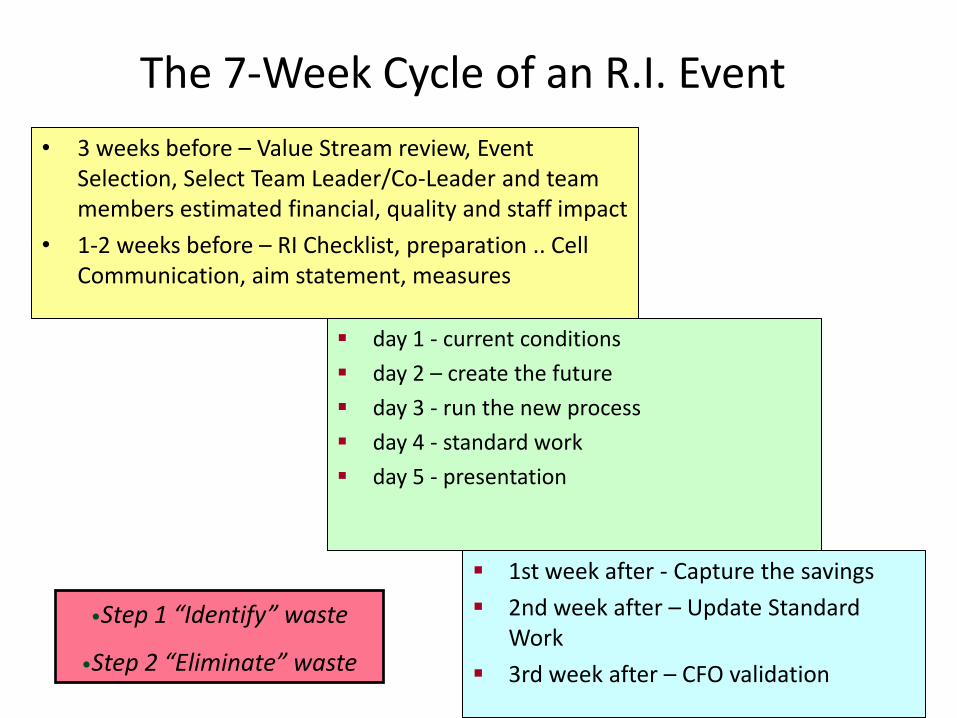
The 7-Week Cycle of an R.I. Event
• 3 weeks before – Value Stream review, Event Selection, Select Team Leader/Co-Leader and team members estimated financial, quality and staff impact
• 1-2 weeks before – RI Checklist, preparation .. Cell Communication, aim statement, measures
day 1 - current conditions
day 2 – create the future
day 3 - run the new process
day 4 - standard work
day 5 - presentation
1st week after - Capture the savings
2nd week after – Update Standard Work
3rd week after – CFO validation
•Step 1 “Identify” waste
•Step 2 “Eliminate” waste

Continuous Daily Improvement
• Front line workers and supervisors able to solve problems, and sustain improvements.
• PDSA Process
• No. of defects identified(front line staff defect huddles)
• Number of Staff ideas implemented
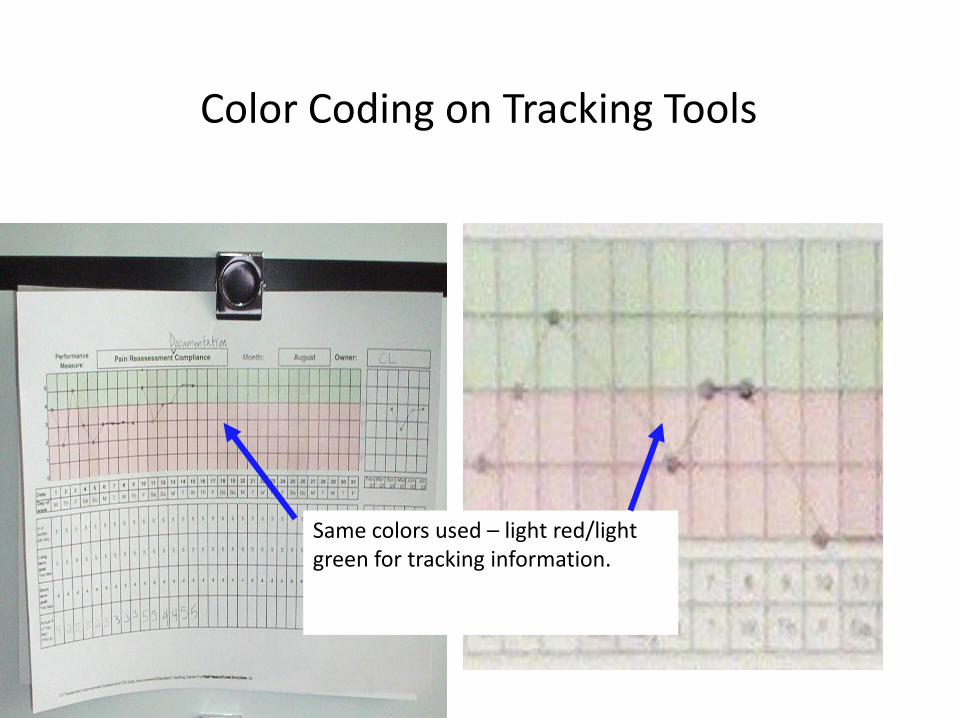
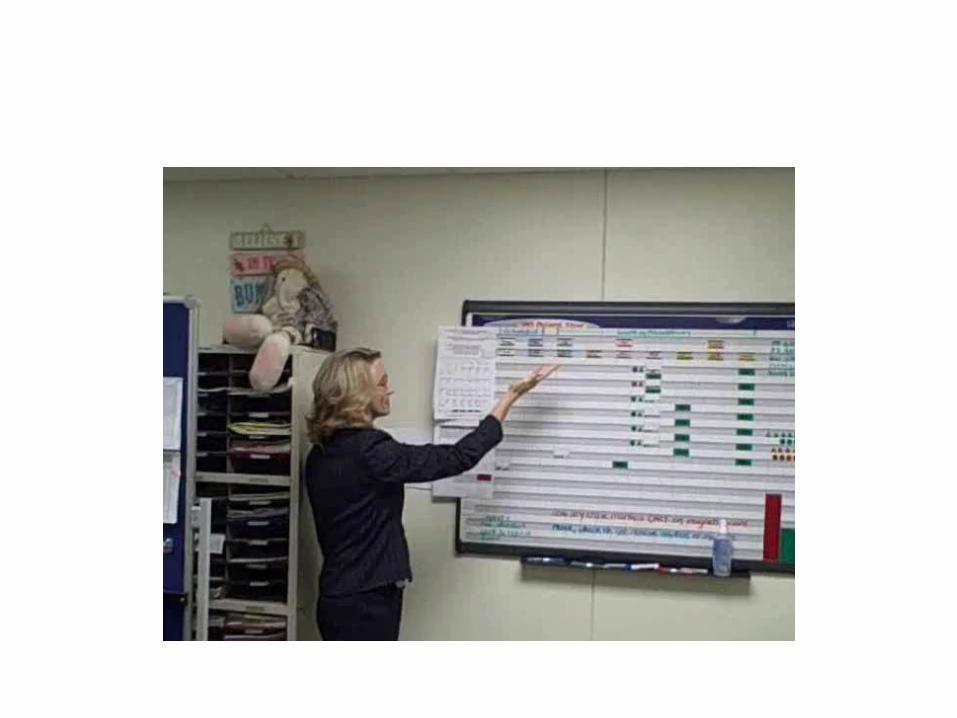
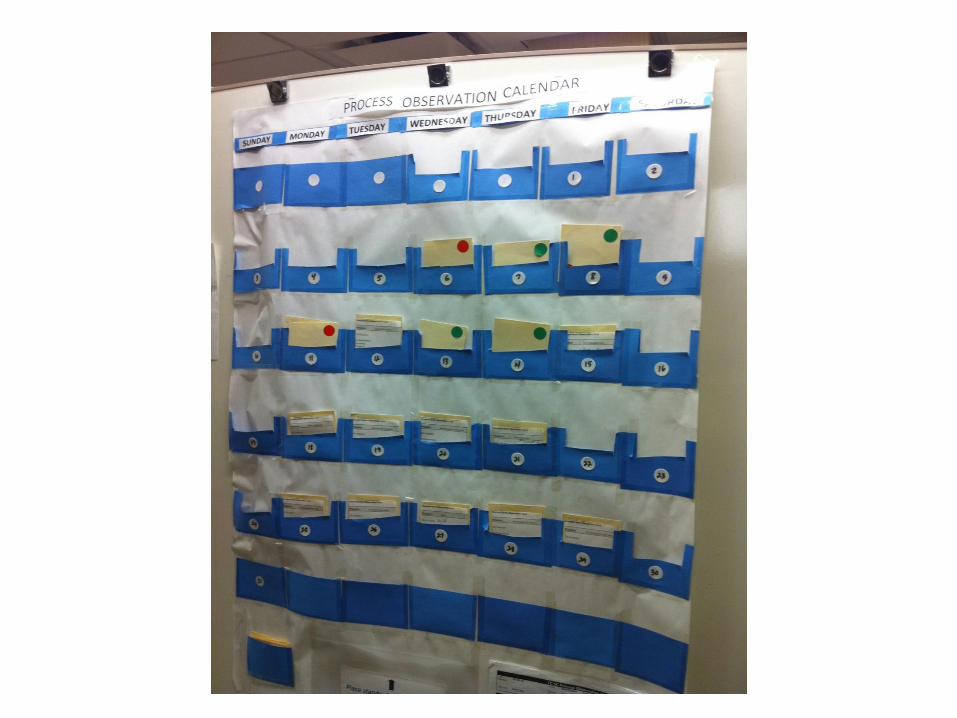
Color Coding on Tracking Tools
Same colors used – light red/light green for tracking information.
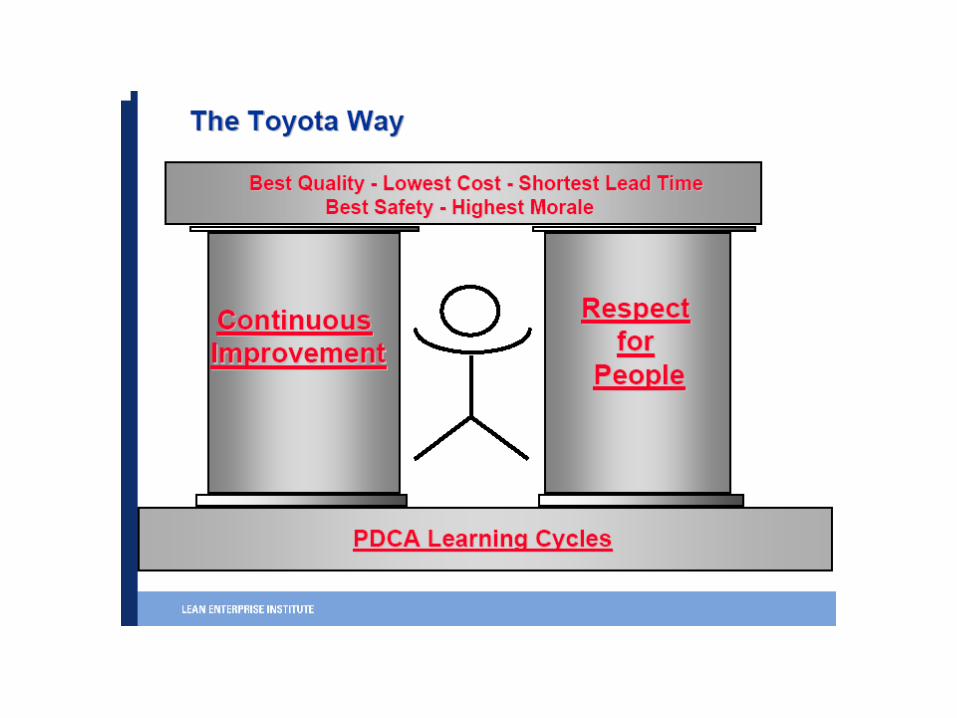
What is a lean management system?
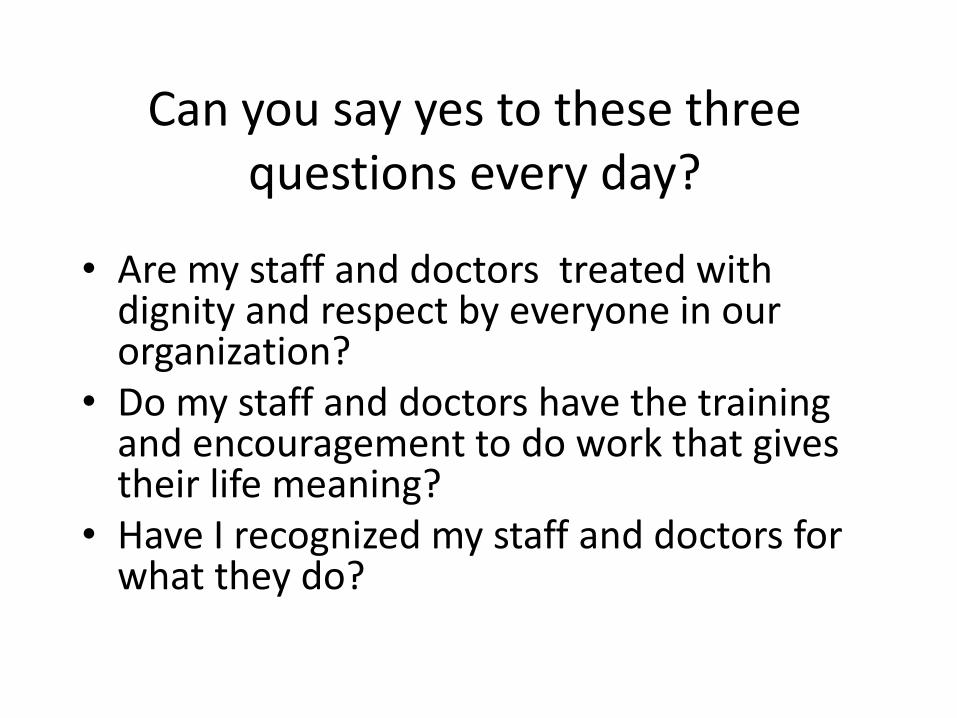
Can you say yes to these three questions every day?
• Are my staff and doctors treated with dignity and respect by everyone in our organization?
• Do my staff and doctors have the training and encouragement to do work that gives their life meaning?
• Have I recognized my staff and doctors for what they do?
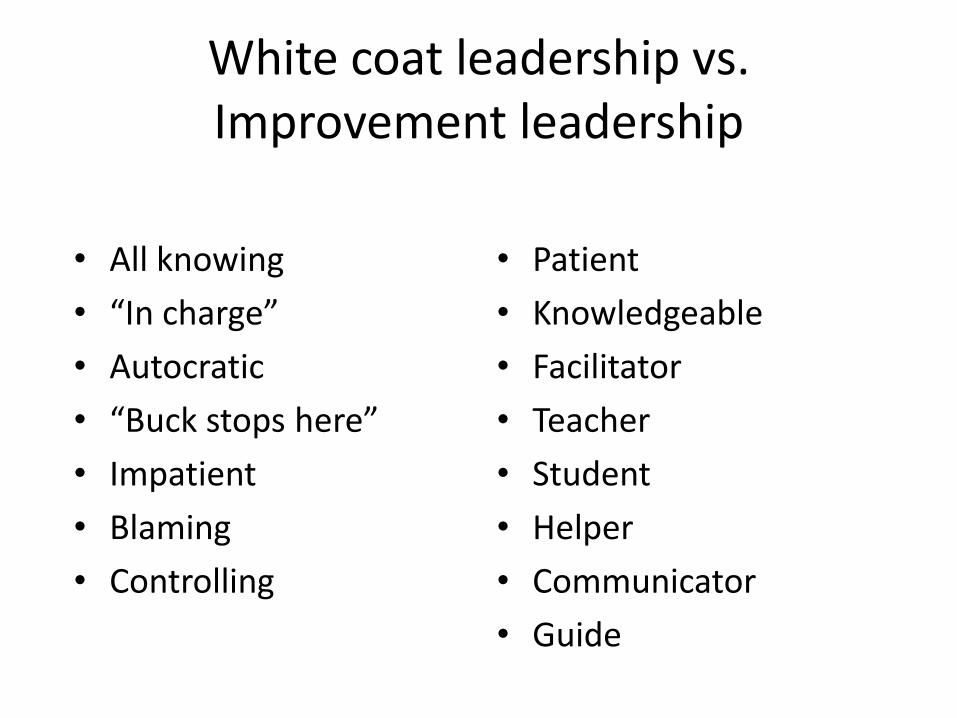
White coat leadership vs. Improvement leadership
• All knowing
• “In charge”
• Autocratic
• “Buck stops here”
• Impatient
• Blaming
• Controlling
• Patient
• Knowledgeable
• Facilitator
• Teacher
• Student
• Helper
• Communicator
• Guide


47
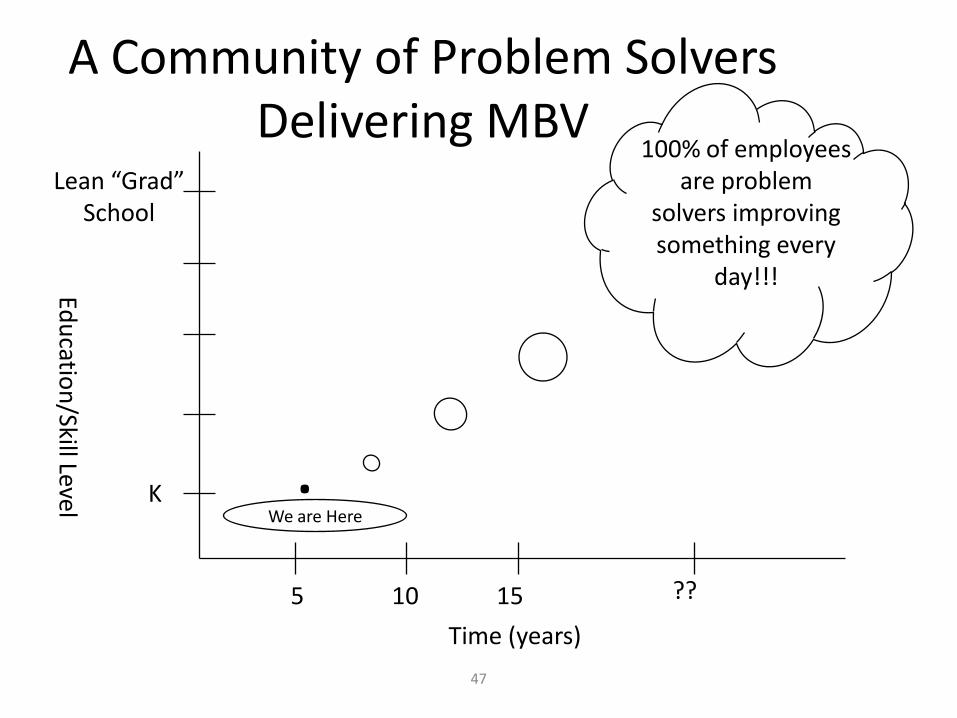
A Community of Problem SolversDelivering MBV
5 10 15 ??
K
Lean “Grad”School
.We are Here
100% of employees are problem
solvers improving something every
day!!!
Time (years)
Edu
cation
/Skill Level
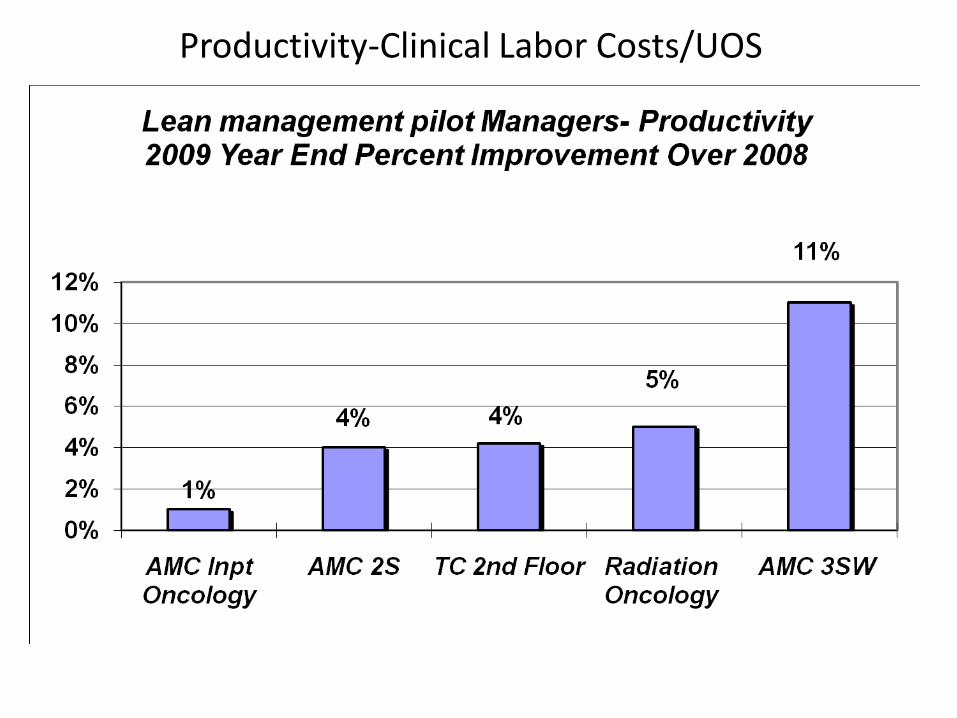
Productivity-Clinical Labor Costs/UOS
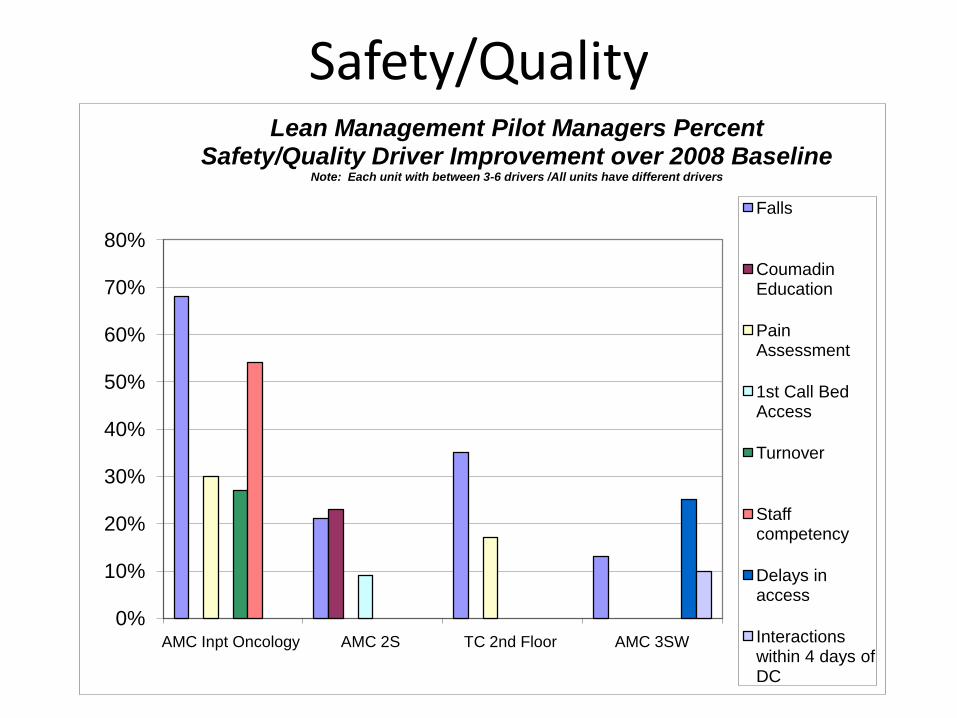
Safety/Quality
0%
10%
20%
30%
40%
50%
60%
70%
80%
AMC Inpt Oncology AMC 2S TC 2nd Floor AMC 3SW
Lean Management Pilot Managers Percent Safety/Quality Driver Improvement over 2008 Baseline
Note: Each unit with between 3-6 drivers /All units have different drivers
Falls
Coumadin Education
Pain Assessment
1st Call Bed Access
Turnover
Staff competency
Delays in access
Interactions within 4 days of DC
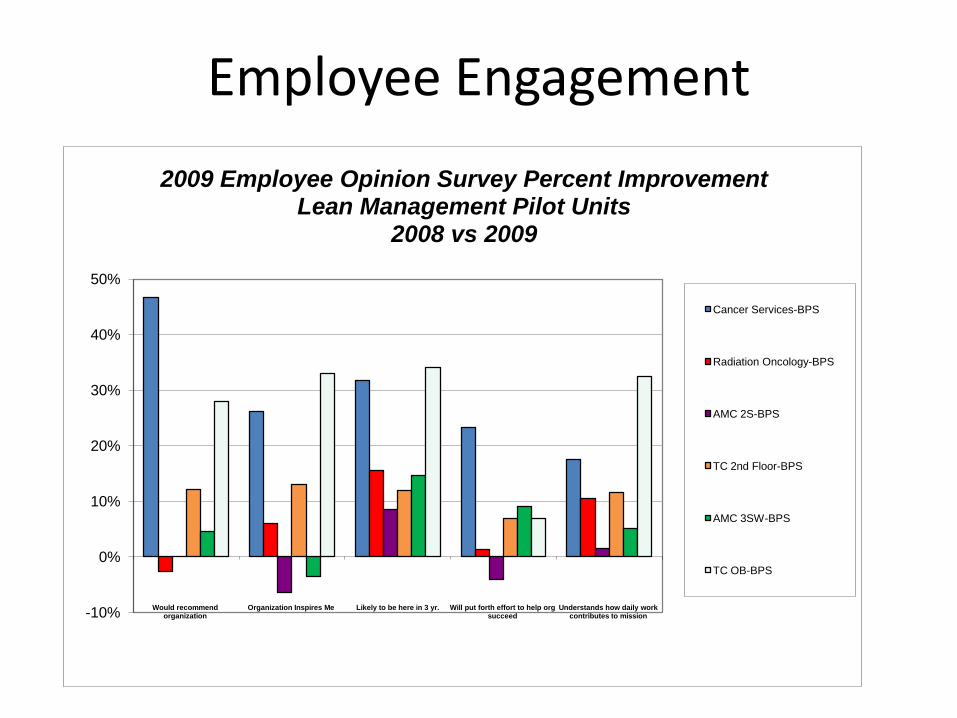
Employee Engagement
-10%
0%
10%
20%
30%
40%
50%
Would recommend organization
Organization Inspires Me Likely to be here in 3 yr. Will put forth effort to help org succeed
Understands how daily workcontributes to mission
2009 Employee Opinion Survey Percent Improvement Lean Management Pilot Units
2008 vs 2009
Cancer Services-BPS
Radiation Oncology-BPS
AMC 2S-BPS
TC 2nd Floor-BPS
AMC 3SW-BPS
TC OB-BPS
51
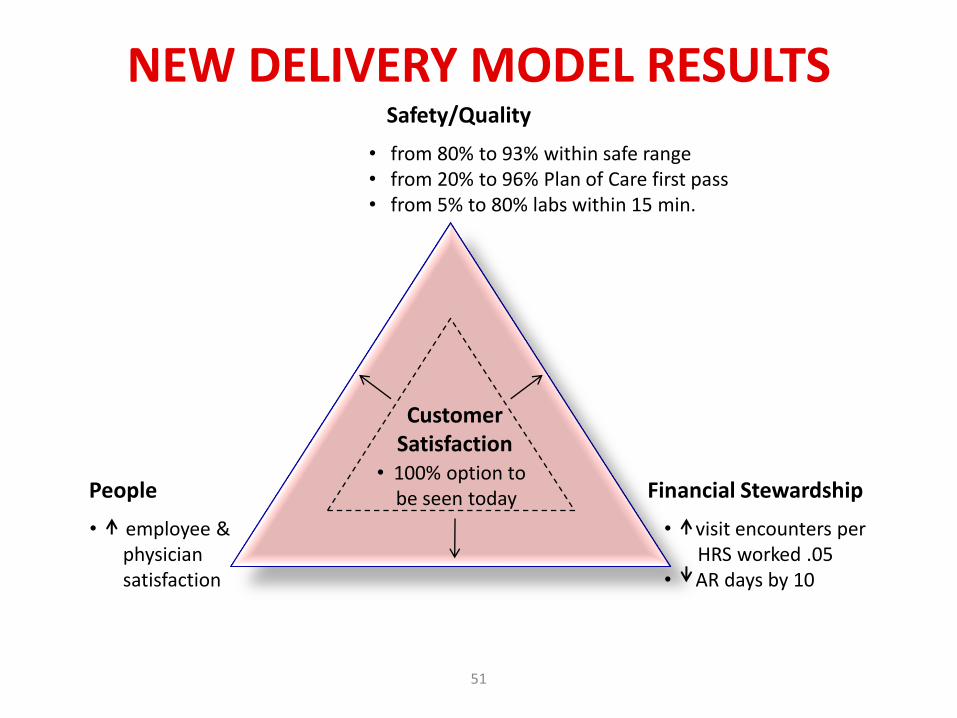
NEW DELIVERY MODEL RESULTS
51
Financial StewardshipPeople
Safety/Quality
CustomerSatisfaction
• from 80% to 93% within safe range• from 20% to 96% Plan of Care first pass• from 5% to 80% labs within 15 min.
• 100% option to be seen today
• visit encounters per HRS worked .05
• AR days by 10
• employee &physiciansatisfaction


Network Purpose
• Accelerate the lean transformation journey for each organization
• Multiple small learning communities
• Spread of current best practices
• Drive change in the larger healthcare system
• www.healthcarevalueleaders.org
First Network
• Gunderson Lutheran
• Group Health Cooperative
• Hotel-Dieu Grace
• Iowa Health System
• Johns Hopkins Medical
• Lawrence & Memorial Hospital
• Lehigh Valley Hospital and Health Network
• McLeod Health
• Mercy Medical Center – Cedar Rapids
• Park Nicollet Health Services
• St. Boniface Hospital
• ThedaCare
• University of Michigan Health System
• UCLA
Second Network
• Alberta Health Services
• Akron Children’s Hospital
• Beth Israel Deaconess
• BJC Healthcare
• Christie Clinic
• Harvard Vanguard Medical Associates
• Kaiser Permanente
• Provena Covenant Medical Center
• Seattle Children’s Hospital
• St. Joseph Health System (Orange, CA)