health service national performance assurance report · pdf file ·...
TRANSCRIPT

Health Service
National Performance
Assurance Report
SE
PT
EM
BE
R 2
01
3

SEPTEMBER 2013 NATIONAL PERFORMANCE ASSURANCE REPORT

SEPTEMBER 2013 NATIONAL PERFORMANCE ASSURANCE REPORT
CONTENTS
Reform Programme 4
Performance Overview September 2013 5
Updates by Division
Acute Services 10
Primary Care Services 17
Health & Wellbeing 21
Social Care Services
• Services for Older People 25
• Disability Services 28
Mental Health Services 30
Children and Family Services 33
Financial Overview 36
Human Resources 38
Appendices
Non Acute Balance Scorecard 42
Acute Balance Scorecard 44
Finance & HR Balance Scorecard 46

SEPTEMBER 2013 NATIONAL PERFORMANCE ASSURANCE REPORT
4
THE REFORM PROGRAMME The Irish Health Service is embarking on one of the largest and most challenging reform
programmes since the foundation of the state. Future Health outlines major elements of this
reform under the four pillars of Structural, Financial, Service Reform and Health & Wellbeing.
Improving the health and wellbeing of the population and providing equitable and timely access
to high quality services are key to the reform process and include action in the following areas:
• Quality and Patient Safety;
• Developing and implementing integrated models of care aligned to patient movement
across services;
• Health & Wellbeing;
• Preventing and managing chronic disease;
• Responsiveness to demographic changes;
• Developing our Workforce;
• ICT and Informatics alignment to business outcomes;
• Structural reform;
o Establishment of Hospital Groups and Integrated Service Areas
o Finance Operations Reform
o New ways of financing services including ‘Money Follows the Patient’
o Establishment of Healthcare Commissioning Agency
Reform will focus on helping all citizens to remain healthy and active and where required,
providing safe, high quality health and social care. The significant and sustained investment in
building the expertise and skills of staff at all levels in leadership, process change, and
management is fundamental to the Reform Programme.

SEPTEMBER 2013 NATIONAL PERFORMANCE ASSURANCE REPORT
5
Performance Overview September 2013
INTRODUCTION TO THE SEPTEMBER 2013 REPORT
ACUTE HOSPITALS
Emergency Admissions There has been an increase of 4,179 (1%) in the number of Emergency Admissions up to the
end of September compared to the same period in 2012.♦ Day Care Attendances There has been a decrease of 1,362 (0.2%) in the number of day care attendances up to the end of September, compared to the same period in 2012. Elective Admissions There has been a decrease of 2,278 (2%) in the number of elective admissions up to the end of September, compared to the same period in 2012. Patient Experience Time (PET) The national target is that 95% of all patients attending Emergency Departments are discharged or admitted within 6 hours. In September 68% of patients attending Emergency Departments were discharged home/admitted within 6hours - with a performance of 47.5% in St James’s Hospital, 50.4% in Connolly Hospital Blanchardstown, 52.4% in Cork University Hospital and 59.2% in the Mid Western Regional Hospital Dooradoyle. The national target is that 100% of all patients attending Emergency Departments are discharged or admitted within 9 hours. In September 82% of patients attending Emergency Departments were discharged home/admitted within 9hours - with a performance of 67.5% in St James’s Hospital, 68.4% in Connolly Hospital Blanchardstown, 71.3% in Cork University Hospital and 75.1% in the Mid Western Regional Hospital Dooradoyle. Waiting Lists There is a 1,049 (2%) reduction in total number of patients waiting for admission in September compared to July. This includes a 6% reduction in total number of patients waiting >8 months for admission. 87% (n=39,335) of all adults waiting on the elective waiting list (excluding GI Scopes) are waiting less than 8 months. 77% (n=3,438) of all children waiting on the Paediatric elective waiting list (excluding GI Scopes) are waiting less than 20 weeks. GI Endoscopy Waiting List – the number of patients waiting greater than 13 weeks has increased from 1,352 (15%) in August to 1,482 (16%) in September.. Plans have been drawn up to ensure that no patient is waiting greater then 13 weeks. Out Patients
• There has been a 7% increase in the total number of OPD new attendances up to the end of September, compared to the same period in 2012.
• There was a 20,649 (11%) reduction in the number of patients waiting more than 6 months.
• There was a 19,010 (18%) reduction in the number of patients waiting more than 12 months.
♦
Data amendments have been made to the August figure as a result of a data verification exercise in three hospitals,
Waterford Regional; Tallaght and Mid Western Regional Dooradoyle. The September results have been updated accordingly.

SEPTEMBER 2013 NATIONAL PERFORMANCE ASSURANCE REPORT
6
• 84,423 (22%) of total number of patients are waiting more than 12 months – down from 103,433 (27%) in March 2013.
Hospitals have developed and commenced necessary action plans to ensure no patient is waiting more than 12 months by year end. Performance improvements have been achieved in relation to increased attendance volume, more appropriate chronological booking and effective validation. These are demonstrated in terms of a 7% increase in new OPD attendances, an increase in the number of patients waiting less than 3 months (7%) and a reduction in the number of patients waiting more than 12 months (18%).
AMBULANCE SERVICE EMERGENCY RESPONSE TIMES
The 2013 target is that 70% of Clinical Status 1 ECHO incidents are responded to by a patient carrying vehicle in 18 minutes and 59 seconds or less. National performance year to date is 69.50%. The 2013 target is that 68% of Clinical Status 1 DELTA incidents are responded to by a patient carrying vehicle in 18 minutes and 59 seconds or less. National performance year to date is 64.48%.
CANCER SERVICES
95.7% of Breast Cancer urgent referrals were offered an appointment within 2 weeks.
94.9% of patients attending rapid Access Lung Cancer clinic attended or were offered an appointment within 10 days of receipt of referral in the cancer centre.
78% of Radiotherapy patients commenced treatment within 15 working days of being deemed ready to treat.
NATIONAL CLINICAL PROGRAMMES The national Clinical Programmes are working closely with services to improve quality, optimize patient flow, and provide an integrated approach to the management of chronic illness. Some performance indicators monitored by the Clinical Programmes show: • The surgical patient average length of stay at 4.6 days for September. The target for this
indicator is 5.26 days by the end of the year (NCP for Surgery). • A median length of stay of 7 days, for patients admitted with principal diagnosis of acute de-
compensated heart failure. This is the performance for the third quarter of 2013 and it is in line with the target for the year (NCP for Heart Failure).
• A median length of stay of 4 days for STEMI patients which is in line with the 2013 target.
Non STEMI patients also have a median length of stay of 4 days against a target of 6 days (NCP for Acute Coronary Syndrome).
• A mean average length of stay for people with COPD of 7.5 days against a target of 7.8 days
(NCP for COPD). • An 18% reduction in the number of bed days for epilepsy patients at the end of September.
This exceeds the target of 10% as set out in the Service Plan (NCP for Epilepsy).
MENTAL HEALTH
The focus of the mental health services has been to enhance the capacity of mental health services to provide acute secondary care to service users within their own community. This has been supported by the focused reinvestment in 2012 and 2013 of €35m and 891 WTES in General Adult and Child and Adolescent Community Mental Health Teams.

SEPTEMBER 2013 NATIONAL PERFORMANCE ASSURANCE REPORT
7
Currently the demand on the Child and Adolescent Community Mental Health Teams as measured by number of new referrals received and accepted, is increasing year on year. 11,142 referrals have been received year to date; this is +1,325 or 13% higher than the planned level of service. However, 70% of accepted referrals are seen within 3 months, consistently meeting the target.
The KPIs for General Adult and Psychiatry of Old Age Community Mental Health Teams are new in 2013 and show that the general adult community teams have received 31,237 referrals so far this year and 86% of referrals have been seen within 8 weeks or less. Our Psychiatry of Old Age Teams have received 7,855 referrals to date, and have seen 97% of referrals within 8 weeks or less.
PRIMARY CARE
Primary Care physiotherapy services have received 133,510 referrals up to the end of September. This is 3.3% above expected levels of service. 109,013 patients were seen for a first time assessment in the same period, which is 4.5% above expected level of service target.
GPs provided services out of hours to 71,877 patients in September, bringing the total number of contacts for the year to the end of September to 735,804.
At the end of September there were 1,864,509 (40.6% of the population) in receipt of a Medical Card and 123,424 (2.7% of the population) in receipt of a GP Visit card. This is a total of 1,987,933 in receipt of either a Medical Card or GP Visit card. Included in these cards are 52,733 Medical Cards granted on discretionary grounds and 22,115 GP Visit Cards granted on discretionary grounds.
96% of completed Medical Card applications are processed and issued within 15 days. This exceeds the National Service Plan target of 90% of completed applications.
SOCIAL CARE: OLDER PERSONS
The Nursing Home Support Scheme supports 23,533 long term residential clients. In the 9 months to September 6,277 new clients were supported. 100% of completed applications under the scheme were processed within four weeks.
The monthly average home help hours delivered in 2013 was: Quarter 1 745,869 hours, Quarter 2 777,161 hours; monthly average for Quarter 3 is 873,572. This is in line with the intention that home help hours progressively increase on a quarter by quarter basis. This growing trend will continue to year end in response to individual service demand, including increased seasonal provision to support the “Winter Plan”. Work is ongoing to ensure a sustainable level of service delivery for home help hours going into 2014.
As of September, 11,372 persons are in receipt of a Home Care Package.
SOCIAL CARE: DISABILITY SERVICES
The expected level of service in 2013 is to deliver a Home Support or a Personal Assistant service to 4,166 persons with a physical and / or sensory disability. As of September 2013, there were 4,692 adults and children with a physical and / or sensory disability in receipt of Home Support or a Personal Assistant Service.

SEPTEMBER 2013 NATIONAL PERFORMANCE ASSURANCE REPORT
8
HEALTH AND WELLBEING
Immunisation is an important priority for protecting the health of children. The 6 in 1 immunisation is now offered for children at 24 months with an uptake rate of 95.4%. This marginally exceeds the target rate of 95%. While targets in the area of immunisations and vaccines are in the main being achieved to a reasonable standard based on international norms the Health and Wellbeing Division is working with Primary Care and Child Health Coordinators to put in place local improvement plans to address any under performance.
In the area of Child Health Screening, while the majority of Local Health Offices have reported development check uptake figures at or almost at the national average, a number of Local Health Offices are performing less satisfactorily. A similar process of implementing quality improvement plans has commenced for this area also.
The flu vaccine is now available. The flu can be a very serious and sometimes deadly illness, especially for people who are older or who have a long-term illness. The HSE is encouraging people over 65 years, those with long term illness and women who are pregnant to avail of the vaccination. It is free for those with a medical care or GP visit card. The vaccine is free for the other groups but there will be a consultation fee. The Health and Wellbeing Division has coordinated a series of actions with the Acute Services and Social Care Divisions commencing in September 2013 to improve uptake rates of the seasonal influenza vaccine by Health Care Workers.
CHILDREN AND FAMILY SERVICES
At the end of September 91.9% of children in care have been allocated a social worker this is a 0.3% increase over the August figure 91.6%. At the end of September 87.8% of children in care have a written care plan.
FINANCE
The HSE is reporting year to date expenditure of €9.345 billion against a budget of €9.226 billion resulting in a gross deficit of €119.26 million at the end of September. The deficit in the same period in 2012 was €399.38 million. Expenditure has reduced by €197m versus September 2012.
HUMAN RESOURCES
There were 100,266 WTEs at end of September, this equates to employment levels equivalent to those in early 2005. The target for year end is 98,938, a variance of 1,328. A total reduction of 1,240 WTE has been seen over 9 months to the end of September.
Implementation of the provisions of the Public Service Stability Agreement (PSSA) has continued during the month of September and is a critical component of the health service reform programme. The Pay reduction element of the PSSA will deliver €56m in a full year. €14m was delivered on this in the three months July – September. The changes to rates of Overtime and Premium payments will deliver €52m in a full year. €13m was delivered in the three months July – September.
Starter Reports for 2013 across the Public Health Sector to the end of August gives a figure of the order of 2093.55 WTEs, with Acute Services accounting for 61.5% of total. The starter figures do not include student nurse placements but do include NCHDs.
HSE absenteeism rate YTD stands at 4.73%. The HSE continues to fill critical front line posts. 2,093 people have commenced employment in 2013 including 549 health and social care personnel across Primary Care, Mental Health and Social Care.

SEPTEMBER 2013 NATIONAL PERFORMANCE ASSURANCE REPORT
9
Updates by Division

SEPTEMBER 2013 NATIONAL PERFORMANCE ASSURANCE REPORT
10
Acute Services Division
KEY AREAS OF FOCUS
� Macro Hospital Overview � Elective Inpatients � Emergency Department New Attendances � Waiting Lists � ED Patient Experience Time (PET) � Day Care Attendances � Inpatient Discharges � Outpatient Waiting List � Inpatient Admission Source � Emergency Response Times � Emergency Admissions � TrolleyGar Performance
� Elective Inpatients � Palliative Care: Access to specialist
inpatient beds
MACRO HOSPITAL ACTIVITY
Activity Type Jan - Sep Actual 2012
Jan - Sep Actual 2013
Val Var % Var
ED New Attendances1 788,201 780,244 (7957) (1%)
Inpatient Discharges2 436,919 432,454 (4,465) (1%)
Day Care Attendances2 612,013 610,651 (1,362) (0.2%)
New 515,763 549,701 33,938 7% OPD Return 1,238,561 1,296,236 57,675 5%
EMERGENCY DEPARTMENT NEW ATTENDANCES
ED New Attendances
40,000
50,000
60,000
70,000
80,000
90,000
100,000
Jan Feb Mar Apr May Jun Jul Aug Sep Oct Nov Dec
2011
2012
2013
• Jan - Sept 2012 / 2013 1% reduction (n=7,957)
PATIENT EXPERIENCE TIME (PET)
ED PET - National Performance 2013
50.0%
60.0%
70.0%
80.0%
90.0%
100.0%
Jan Feb Mar Apr May Jun Jul Aug Sep
% 6 hours
% 9 hours
1 2012 dataset does not include South Infirmary Victoria data. ED closed on 29th July 2012
2 2012 / 2013 datasets do not include CWIUH activity due to unavailability

SEPTEMBER 2013 NATIONAL PERFORMANCE ASSURANCE REPORT
11
• National target is 95% of all patients attending ED being discharged or admitted within 6 hours and 100% of all patients being discharged or admitted within 9 hours.
• In September 2013 68% of patients attending Emergency Departments were discharged home / admitted within 6 hours – 66.1% YTD.
• In September 2013 82% of patients attending Emergency Departments were discharged home / admitted within 9 hours - 80.5% YTD.
INPATIENT DISCHARGES
Inpatient Discharges
40,000
42,000
44,000
46,000
48,000
50,000
52,000
54,000
Jan Feb Mar Apr May Jun Jul Aug Sep Oct Nov Dec
2011
2012
2013
• Jan - September 2013 / 2012 1% decrease in the number of discharges (n=4,465) • Jan - September 2013 actual / target 0.6% decrease in the number of discharges
(n=2,530)
INPATIENT ADMISSION SOURCE1
Activity Type Jan – Sep Actual 2012
Jan - Sep Actual 2013
Val Var % Var
ED Admissions 212,911 207,111 (5,800) (3%)
Emergency (Other)3 59,969 59,343 (626) (1%)
MAU Admissions4 13,630 24,235 10,605 78%
Emergency Admissions
Subtotal 286,510 290,689 4,179 1%
Elective Elective Admissions 2 128,172 125,894 (2,278) (2%)
Total Admissions 414,682 416,583 1,901 0.5%
EMERGENCY ADMISSIONS • 1% increase in overall number of Emergency Admissions • 3% decrease in the number of Emergency Department admissions (n=5,800) • 78% increase in the number of MAU Admissions (n=10,605)
TROLLEYGAR PERFORMANCE
Average Number of Patients waiting on Trolleys for Ward Bed Accommodation 2011
/ 2012 / 2013
0
100
200
300
400
500
Jan Feb Mar Apr May Jun Jul Aug Sep Oct Nov Dec
2011 2012 2013
1 2012 dataset does not include South Infirmary Victoria data. ED closed on 29th July 2012
2 2012 / 2013 datasets do not include CWIUH activity due to unavailability 3 Emergency Other includes Paediatric Assessment, Surgical Assessment, Transfer, OPD admission sources
4 MAU - Medical Assessment Unit

SEPTEMBER 2013 NATIONAL PERFORMANCE ASSURANCE REPORT
12
• 2011 / 2012 - 22.9% reduction in the number of ED patients waiting on trolleys for ward bed accommodation
• 2012 / 2013 - 11.9% reduction in the number of ED patients waiting on trolleys for ward bed accommodation
• 2011 / 2013 - 32.1% reduction in the number of ED patients waiting on trolleys for ward bed accommodation
ELECTIVE INPATIENTS AND DAY CARE ATTENDANCES ELECTIVE ADMISSIONS
Elective Admissions
4000
6000
8000
10000
12000
14000
16000
Jan Feb Mar Apr May Jun Jul Aug Sep Oct Nov Dec
2011
2012
2013
• 2% decrease in the number of elective admissions (n=2278)
DAY CARE ATTENDANCES
Day Care Attendances
50,000
55,000
60,000
65,000
70,000
75,000
80,000
Jan Feb Mar Apr May Jun Jul Aug Sep Oct Nov Dec
2011
2012
2013
• Jan-September 2013 / 2012 0.2% decrease in the number of Day Care attendances (n=1,362)
• Jan-September 2013 actual / target broadly in line showing a marginal increase (n=134)
WAITING LISTS – INPATIENT / DAY CARE / GI National number of scheduled patients waiting for admission July / September 2013 comparison5
Period 0-3
months 3-6
months 6-8
months 8-12
months 12+
months Total
25/07/2013 33,005 15,334 5,131 5,396 1,066 59,932
26/09/2013 31186 15542 6084 5135 936 58,883
Val Var -1,819 208 953 -261 -130 -1,049
National
% Var -6% 1% 19% -5% -12% -2%
• overall waiting list growth trend experienced January - July now reversed • July / September - 2% reduction in total number of patients waiting for admission
- 6% reduction in total number of patients waiting >8 months for admission
5 Waiting list values stated includes Adults / Children / GI Scopes

SEPTEMBER 2013 NATIONAL PERFORMANCE ASSURANCE REPORT
13
WAITING LIST ADULT (EXCLUDING GI SCOPES) • 87% of all adults waiting on the elective waiting list are waiting less than 8 months (n=
39,335)
WAITING LIST PAEDIATRIC (EXCLUDING GI SCOPES) • 77% of all children waiting on the elective waiting list are waiting less than 20 weeks
(n=3,438)
GI ENDOSCOPY WAITING LIST • 84% of people on the GI Endoscopy waiting list are waiting less than 13 weeks. At the
end of September, 16% of patients were waiting greater than 13 weeks (n=1,482). Plans have been drawn up to ensure that no patient is waiting greater than 13 weeks.
COLONOSCOPY WAITING LIST • No patients were reported as waiting greater than 4 week (28 Days) for an urgent
Colonoscopy at the end of September • All Hospitals have now developed and commenced necessary action plans to effect
national target (0 patients waiting >8 months) by 31.12.13 • Requirement remains for more effective chronological admission - this necessity will be
closely monitored by SDU / NTPF for remainder of year.
OUTPATIENT ACTIVITY - ALL SPECIALTIES • 7% increase in the total number of OPD new attendances
CANCER SERVICES - OPD ACCESS Performance analysis for Quarter 3 2013 demonstrates:
• 95.7% of Breast Cancer urgent referrals were offered an appointment within 2 weeks • 94.9% of patients attending rapid Access Lung Cancer clinic attended or were offered
an appointment within 10 days of receipt of referral in the cancer centre.
OUTPATIENT WAITING LIST6 7
Outpatient Waiting List - March / Sept 2013
0
20000
40000
60000
80000
100000
120000
140000
160000
0-3 M onths 3-6 M onths 6-12 M onths 12 - 24 M onths 24 - 36 M onths 36-48 M onths 48+ M onths
Mar-13
Sep-13
• 0.5% increase in total number of new patients waiting (n=1,752) • 11% reduction in the number of patients waiting more than 6 months (n=20,649) • 18% reduction in the number of patients waiting more than 12 months (n=19,010) • March 2013: 27% of total number of patients are waiting more than 12 months
(n=103,433)
6 NTPF full dataset availability March 2013 - comparison March / September 2013
7 Children’s University Hospital Temple Street commenced recording of waiting list values in September this resulted in 15,319
additional patients being recorded on national waiting list
7%
20% -2% -14%
-11% -24%
-74%

SEPTEMBER 2013 NATIONAL PERFORMANCE ASSURANCE REPORT
14
• September 2013: 22% of total number of patients are waiting more than 12 months (n=84,423)
Hospitals have developed and commenced necessary action plans to ensure no patient is waiting more than 12 months by year end. Performance improvements have been achieved in relation to increased attendance volume, more appropriate chronological booking and effective validation. These are demonstrated in terms of a 7% increase in new OPD attendances, an increase in the number of patients waiting less than 3 months (7%) and a reduction in the number of patients waiting more than 12 months (18%)

SEPTEMBER 2013 NATIONAL PERFORMANCE ASSURANCE REPORT
15
AMBULANCE SERVICE EMERGENCY RESPONSE TIMES
In 2013 YTD, 58,172 Category 1 calls (ECHO and DELTA) have been received. The target for 2013 is that 70% of Clinical Status 1 ECHO incidents are responded to by a patient carrying vehicle in 18 minutes and 59 seconds or less. National performance year to date is 69.50%.
The target for 2013 is that 68% of Clinical Status 1 DELTA incidents are responded to by a patient carrying vehicle in 18 minutes and 59 seconds or less. National performance year to date is 64.48%.
In 2013 YTD, 58,172 Category 1 calls (ECHO and DELTA) have been received. Table 1: Ambulance Response Times August (data reported one month in arrears) & YTD
METRIC North Leinster
South West Dublin Fire Brigade
National Performance
National Performance YTD
Emergency Response Times - % of Clinical Status 1 ECHO incidents responded to by a patient carrying vehicle in 18 minutes and 59 seconds or less
80.81%
57.14%
71.05%
55.87%
67.72%
69.50%
Emergency Response Times - % of Clinical Status 1 DELTA incidents responded to by a patient carrying vehicle in 18 minutes and 59 seconds or less
69.04%
55.52%
61.28%
64.70%
65.84%
64.48%
Table 2: Total Number of Calls August (Data reported one month in arrears) & YTD
METRIC North Leinster
South West Dublin Fire Brigade
National Performance
National Performance YTD
Emergency Response Times – Number of Clinical Status 1 ECHO calls
57
28
38
66
189
1,987
Emergency Response Times – Number of Clinical Status 1 DELTA calls
2,083
1,068
1,250
2,452
6,853
56,185
The National Ambulance Service recently met with Dublin Fire Brigade with a view to ensuring a focus is place on response time improvements. Dublin Fire Brigade are putting a dedicated team in place to focus on actions to improve response time performance. The recorded response times for the South Area are being monitored closely through the recently centralised call taking and control facility in Townsend St. with a focus by Control Managers on any required improvements to the call and dispatch arrangements.
INTERMEDIATE CARE SERVICES
A more effective model of patient transfer service delivery, known as the Intermediate Care Service (ICS) has been set up to provide a service to people who need to move between hospitals or other care facilities. This facilitates a safe and timely transfer for non-emergency patients when transferring between hospitals within the healthcare system or moving to step down facilities in the community. The ICS will ensure that emergency ambulance personnel are available to focus on the core function of the delivery of pre-hospital emergency care. This will support an improvement in response times to people who require emergency care and transportation To date in 2013, 16 Intermediate Care Vehicles and 41.4 WTE have been appointed to Intermediate Care Operative (ICO) positions across the country. A further 36 WTE will complete training and be appointed to ICO posts nationally by year end.

SEPTEMBER 2013 NATIONAL PERFORMANCE ASSURANCE REPORT
16
Palliative Care Services
INTRODUCTION
Palliative care services aim to provide the best possible quality of life for patients and their families facing the problems associated with life-limiting illness. This is achieved through the prevention and relief of suffering by means of early identification, high quality assessment, and treatment of pain and other physical, psychosocial, and spiritual problems.
Services are provided in both the specialist and generalist palliative care settings in order to support the provision of care in the place of the patient’s need and choice. A significant proportion of specialist services are delivered in partnership with the voluntary sector.
PALLIATIVE CARE: ACCESS TO SPECIALIST INPATIENT BEDS
The target is to provide 92% of people with access to specialist in-patient beds within 7 days.
• The target is being exceeded at 94% YTD.
• Year-to-date performance in DNE and the West Region are above their individual targets.
• 1,700 new patients received inpatient services year to date equating to an average of 189 new patients per month.
• 366 people on average per month are receiving specialist palliative care inpatient services.
PALLIATIVE CARE: ACCESS TO SPECIALIST COMMUNITY TEAMS
The target is to provide 82% of people at home in non-acute hospitals or long term residential care settings with access to palliative care specialist community services within 7 days.
• 86% of people referred received the service within 7 days YTD.
• Year-to-date performance in all regions are above their individual targets.
• 6,584 new patients received specialist palliative care community services year-to-date equating to an average of 731 new patients per month.
• 3,093 people on average per month are in receipt of specialist palliative care community services.

SEPTEMBER 2013 NATIONAL PERFORMANCE ASSURANCE REPORT
17
Primary Care Services Division
INTRODUCTION
Primary care is an approach to care that includes a range of services designed to keep people well, ranging health promotion and screening for disease through to assessment, diagnosis, treatment and rehabilitation as well as personal social services. The services provide first-level contact that is fully accessible by self-referral and have a strong emphasis on working with communities and individuals to improve their health and social well-being. The Primary Care Division brings together the various stakeholders to ensure that services are delivered safely and effectively in a community setting. This will achieve a more accessible and cost effective health services for the benefit of all service users.
AREAS OF FOCUS IN THIS REPORT
• Primary Care Teams • Orthodontics
• GP Out of Hours service • Primary Care Reimbursement Service (PCRS)
• Physiotherapy Services • Social Inclusion
• Occupational Therapy Services
PRIMARY CARE TEAMS (PCTS)
• 423 Primary Care Teams are in place providing services for the population.
• During the month of September, a further 2,220 patient care plans for complex cases were initiated.
GP OUT OF HOURS SERVICE
• 71,877 patients availed of GP out of hour’s services in September (i.e. triage, treatment, home visit etc). This brings the total number of contacts year to date at the end of September to 735,804, (0.6% above target).
• Performance year to date in the four Regions is as follows; DML is 0.5% above target, DNE is 3.3% above target, South is -0.2% below and West is on target 0.0%.
No of contacts with GP OOH's per month
60,000
70,000
80,000
90,000
100,000
110,000
120,000
130,000
2012 2013
2012 85,505 81,833 91,790 84,521 83,145 83,847 74,077 71,348 75,641 75,676 71,403 118,783
2013 87,441 76,679 98,373 82,957 82,196 83,173 77,094 76,014 71,877
Jan Feb Mar Apr May Jun Jul Aug Sep Oct Nov Dec

SEPTEMBER 2013 NATIONAL PERFORMANCE ASSURANCE REPORT
18
PHYSIOTHERAPY SERVICES
• 15,282 referrals were received in September – this brings the referrals received year to date to the end of September to 133,510. This is 3.3% above expected activity year to date.
• 12,679 patients were seen for a first time assessment in September - this brings the figure seen year-to-date to the end of September to 109,013.This is 4.5% above the expected activity year to date.
• There were 62,388 treatment contacts in September - this brings the figure seen year-to-date to the end of September to 546,991. This is 1.3% above the expected activity year to date.
Variance from expected activity in the month
Regions DML DNE South West National
Referrals -3.5% +7.7% +3.4% +6.1% +3.3%
Patients seen -1.6% +10.5% +0.6% +10.4% +4.5%
Treatment contacts +0.2% +4.1% -1.7% +3.6% +1.3%
OCCUPATIONAL THERAPY SERVICES
• 6,559 referrals were received in September – this brings the referrals received year to date to the end of September to 56,947. This 7.3% above the expected activity year to date
• 12,293 clients received a direct service in September. This is 0.3% above the expected activity year to date.
Variance from expected activity in the month
Regions DML DNE South West National
Referrals +8.5% +5.9% +6.5% +7.9% +7.3%
Direct contacts -3.2% -5.3% -7.8% +16.5% 0.3%
ORTHODONTICS
7,390 patients were waiting assessment with the following waiting times:
Wait time from referral to assessment
1-6 months 7- 12 months >12 months
National 2,647 (35.8%)
4,459 (60.3%) 284 (3.9%)
Number of patients waiting to commence treatment following assessment: - 14,262
Waiting time from assessment to commencement of treatment
1-6 months 7- 12 months >12 months
National -Grade 4/Grade 5 2,782 (19.5%)
2,120 (14.9%)
9,360 (65.6%)
The number of patients in active treatment is 22,114.
Following a review of KPI definitions, ‘Retention’ has been included under active treatment. ‘Retention’ is the period following completion of orthodontic treatment, whereby a fixed appliance/brace is placed on teeth for to maintain the teeth in their corrected position, and regularly reviewed. This has led to an increase on figures reported in Q2.
A waiting list initiative for orthodontics is planned for 2014.

SEPTEMBER 2013 NATIONAL PERFORMANCE ASSURANCE REPORT
19
Primary Care Reimbursement Service
MEDICAL CARDS
The number of people covered by medical cards now stands at 1,864,509 people (40.6% of the population); the highest ever since the scheme commenced. Included in these cards are 52,733 medical cards granted on discretionary grounds.
The total number of GP visit cards is 123,424. Included in these cards are 22,115 GP visit cards granted on discretionary grounds.
As of end September 2013, 96% of completed medical card applications are processed and issued within 15 days - the National Service Plan target is 90%. Of the 4% which are not processed within target, the majority relates to applications where the income is in excess of the qualifying limits and a medical assessment is required.
Performance Activity Medical Cards and GP Visit Cards *
DML DNE South West National Total
Number of People with Medical Cards 470,463 395,986 499,167 498,893 1,864,509
Number of people with GP Visit Cards 29,006 24,535 37,456 32,427 123,424
Total 499,469 420,521 536,623 531,320 1,987,933
*Includes cards granted on discretionary grounds

SEPTEMBER 2013 NATIONAL PERFORMANCE ASSURANCE REPORT
20
Social Inclusion Services
Social Inclusion services place a special emphasis on marginalised groups who need special support including those with Addiction issues, Homeless people, Irish Travellers, Roma and other members of diverse ethnic and cultural groups (including asylum seekers, refugees and migrants), Lesbian Gay Bisexual Transgender (LGBT) service users and those with HIV/AIDs. The people in these groups have complex health and social care needs which cross the remit of the HSE and the community and voluntary services who work together to ameliorate the poorer health outcomes for these groups in areas such as life expectancy, morbidity and self reported health. It is the aim of the service to be person centred and to provide an evidence based quality service.
SUBSTANCE MISUSE
• The expec ted leve l o f se rv i ce in 2013 is that 8,650 clients would receive methadone treatment.
• 9,034 clients received this service (excluding prisons) for the September reporting period which includes 3,735 patients being treated by 324 GPs in the community.
• Methadone was dispensed by 581 pharmacies catering for 6,149 clients for the reporting period.
• At the end of September there were 72 HSE clinics providing methadone treatment and an additional 10 clinics were provided in the prison service.
• 92 new patients commenced methadone treatment during September (50 in General Practice, 33 in HSE clinics and 9 in prison clinics).
• 921 people over 18 years commenced treatment following assessment during the reporting period. 96% received their treatment within one calendar month (DML 91%, DNE is 100%, South is 96%, and West 100%).
• 75 people under 18 years commenced treatment following assessment during the reporting period. 93% received their treatment within one week (DML 100%, DNE is 100%, South is 81%, and West 100%).
PHARMACY NEEDLE EXCHANGE PROGRAMMES
The ob jec t i ve in 2013 is:
• To recruit 130 pharmacies. As of the end of the reporting period there were 87 pharmacies recruited.
• 250 unique individuals attending pharmacy needle exchange. As of the end of the reporting period there were 871 unique individuals attending.
• To provide 1,650 needle exchange packs. As of the end of the reporting period there were 2,212 packs provided.
• To provide an average of 90 needles per unique individual per quarter. Currently we are reporting 59 needles per unique individual.
HOMELESS SERVICES
2,027 individual service users used statutory and voluntary managed residential homeless services during the reporting period.
• 66% had a medical card supporting their health and wellbeing needs (DML is 44%, DNE is 69%, South is 67%, and West 84%).
• 77% had their needs formally assessed within one week (DML 47%, DNE is 83%, South is 91%, and West 84%),
• 69% had a written care plan in place within two weeks (DML 48%, DNE is 57%, South is 80%, and West 75%).

SEPTEMBER 2013 NATIONAL PERFORMANCE ASSURANCE REPORT
21
Health and Wellbeing
INTRODUCTION TO HEALTH AND WELLBEING SERVICES
The work of the Division is focused on helping people to stay healthy and protecting people from threats to their health and wellbeing. Specialist services such as Emergency Management, Environmental Health, Public Health, the Health Protection Surveillance Centre and the National Immunisation Office support critical functions including immunisation and vaccination programmes, control of infectious diseases and outbreak management, health screening, the environment, food and public health threats, preventative health services. Health Promotion and Improvement services collaborate across the health sector and with key external agencies and organisations to effect improvements in individual, community and population health – often by targeting lifestyle health determinants such as smoking, alcohol consumption, physical inactivity and obesity.
AREAS OF FOCUS IN THIS REPORT
• Child Health Development Screening • Tobacco cessation support
• PHN visits • Number of outbreaks being managed
• Immunisation uptake rates
CHILD HEALTH DEVELOPMENTAL SCREENING
• The target in 2013 is that 95% of children reaching 10 months within the monthly reporting period have had their child development health screening (7 – 9 month developmental check) before reaching 10 months of age.
• 45,838 children (87.6%) have received child developmental health screening within target year-to- date – 5,234 (88.4%) in September 2013.
• Galway Local Health Office continues to have a low uptake with a September figure returned of 59.3% which is an improvement over previous returns and demonstrates a % improvement of 139.1% over the January return 24.8%. Galway Local Health Office prioritised the 7 - 9 month developmental check and a plan was formulated for PHN and AMO services to specifically address the backlog during the months of July and August.
• While the majority of Local Health Offices have reported development check uptake figures at or almost at the national average a number of Local Health Offices are performing less satisfactorily. The Division is coordinating a response to the low uptake in underperforming Local Health Offices through the RDPIs and the Child Health Coordinators.

SEPTEMBER 2013 NATIONAL PERFORMANCE ASSURANCE REPORT
22
Percentage of Children Reaching 10 months who had their Child Health Developmental Screening (7-9 months) on time
before reaching 10 months of age : 2013
60%
70%
80%
90%
100%
National 83.8% 86.8% 86.5% 86.9% 88.5% 88.9% 88.5% 89.9% 88.4%
DML 84.9% 90.5% 92.7% 90.3% 90.3% 92.6% 91.6% 92.2% 88.8%
DNE 90.0% 91.5% 93.4% 93.3% 92.9% 92.0% 93.5% 92.6% 93.0%
South 88.9% 92.0% 88.2% 92.4% 96.2% 95.5% 92.6% 93.8% 92.8%
West 71.2% 72.0% 69.6% 70.9% 74.6% 73.3% 75.6% 80.0% 78.3%
Jan Feb Mar Apr May Jun Jul Aug Sep
IMMUNISATIONS AND VACCINATIONS
CHILD HEALTH IMMUNISATIONS 6-IN-1 AT 24 MONTHS
The national performance uptake for Quarter 2 is 95.4% (95.2% YTD). 20 Local Health Offices have met or exceeded the target of 95% for the percentage of children reaching 24 months in the reporting period (Q2 2013) who have received their 6-in-1 vaccination. The remaining Local Health Offices performed between 89.1% and 94.9%.
% children aged 24 months who have received 3 doses of the 6-in-1 vaccine: 2013
92%
94%
96%
98%
National 94.9% 95.4% 95.2%
DML 95.8% 95.8% 95.8%
DNE 93.9% 94.4% 94.1%
South 95.2% 95.3% 95.2%
West 94.7% 96.2% 95.5%
Quarter 1 Quarter 2 YTD/Outturn
*Data is reported quarterly in arrears.
CHILD HEALTH IMMUNISATIONS MMR AT 24 MONTHS
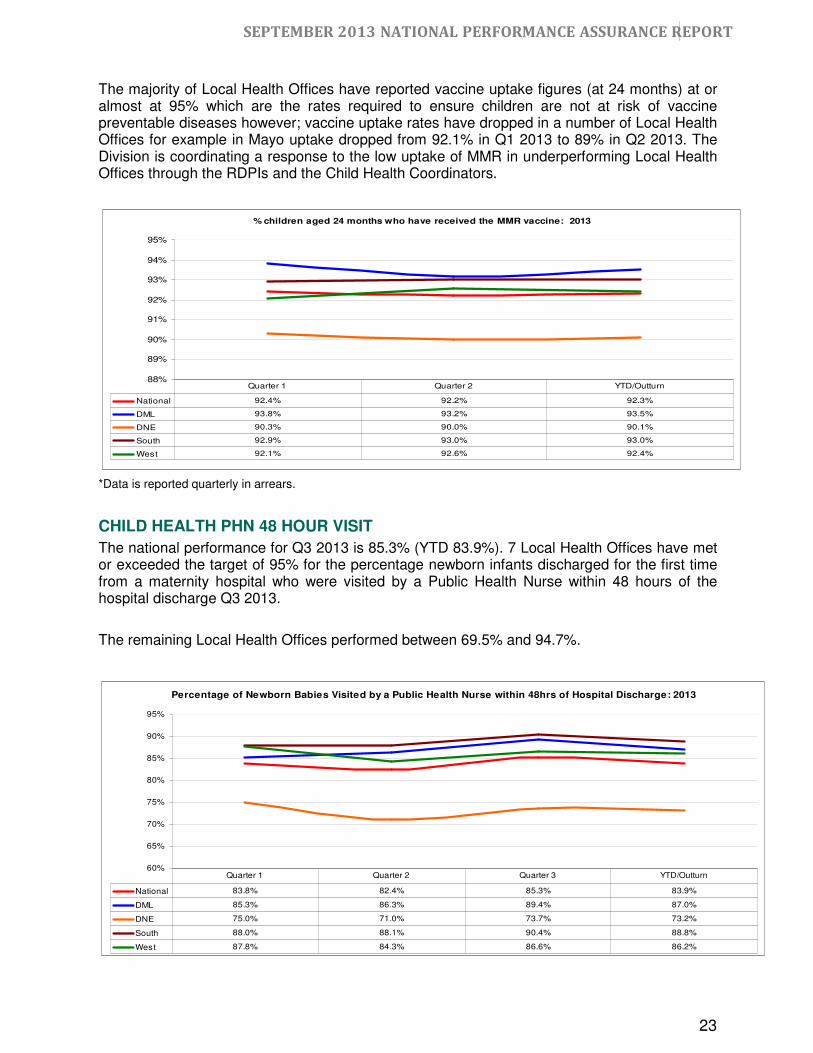
The national performance uptake for Quarter 2 is 92.2% (92.3% YTD). 6 Local Health Offices have met or exceeded the target of 95% for the percentage of children reaching 24 months in the reporting period (Q2 2013) who have received their MMR vaccination. The remaining Local Health Offices performed between 84.2% and 94.8%. In Ireland 47 cases of measles have been notified nationally since the start of 2013.
SEPTEMBER 2013 NATIONAL PERFORMANCE ASSURANCE REPORT
23
The majority of Local Health Offices have reported vaccine uptake figures (at 24 months) at or almost at 95% which are the rates required to ensure children are not at risk of vaccine preventable diseases however; vaccine uptake rates have dropped in a number of Local Health Offices for example in Mayo uptake dropped from 92.1% in Q1 2013 to 89% in Q2 2013. The Division is coordinating a response to the low uptake of MMR in underperforming Local Health Offices through the RDPIs and the Child Health Coordinators.
% children aged 24 months who have received the MMR vaccine: 2013
88%
89%
90%
91%
92%
93%
94%
95%
National 92.4% 92.2% 92.3%
DML 93.8% 93.2% 93.5%
DNE 90.3% 90.0% 90.1%
South 92.9% 93.0% 93.0%
West 92.1% 92.6% 92.4%
Quarter 1 Quarter 2 YTD/Outturn
*Data is reported quarterly in arrears.
CHILD HEALTH PHN 48 HOUR VISIT
The national performance for Q3 2013 is 85.3% (YTD 83.9%). 7 Local Health Offices have met or exceeded the target of 95% for the percentage newborn infants discharged for the first time from a maternity hospital who were visited by a Public Health Nurse within 48 hours of the hospital discharge Q3 2013.
The remaining Local Health Offices performed between 69.5% and 94.7%.
Percentage of Newborn Babies Visited by a Public Health Nurse within 48hrs of Hospital Discharge: 2013
60%
65%
70%
75%
80%
85%
90%
95%
National 83.8% 82.4% 85.3% 83.9%
DML 85.3% 86.3% 89.4% 87.0%
DNE 75.0% 71.0% 73.7% 73.2%
South 88.0% 88.1% 90.4% 88.8%
West 87.8% 84.3% 86.6% 86.2%
Quarter 1 Quarter 2 Quarter 3 YTD/Outturn

SEPTEMBER 2013 NATIONAL PERFORMANCE ASSURANCE REPORT
24
FLU VACCINATION
The flu vaccine is now available. The flu can be a very serious and sometimes deadly illness, especially for people who are older or who have a long-term illness. The HSE is encouraging people over 65 years and those with long term illness and women who are pregnant to avail of the vaccination. It is free for those with a medical care or GP visit card. The vaccine is free for the other groups but there will be a consultation fee.
The Health and Wellbeing Division has coordinated a series of actions with the Acute Services and Social Care Divisions commencing in September 2013 to improve uptake rates of the seasonal influenza vaccine by Health Care Workers. As part of this process the following actions have been taken;
1. Hospitals and Long Term Care Facilities have been requested to appoint a designated lead to coordinate and ensure good uptake of the vaccine among Health Care Workers.
2. Additional information and guidance re the influenza vaccine has been made available online this year as part of a communications plan for Health Care Workers and to support Hospitals and Long Term Care Facilities in encouraging uptake.
3. In order to measure progress made on foot of these actions a new Performance Indicator (PI) has been developed by the Division for inclusion in the PI suite for 2014 that will measure uptake based on these actions for the flu season 2013-2014.

SEPTEMBER 2013 NATIONAL PERFORMANCE ASSURANCE
REPORT 25
25
Social Care Services: Services for Older People INTRODUCTION TO OLDER PERSONS SERVICES
The majority of people in Ireland over 65 years do remain independent into very old age, some with the informal support of family and friends, and some occasionally needing to access services such as home help services, home care packages, respite care, day care, meals on wheels, community physiotherapy and health promotion programmes as and when required. For those who can no longer be cared for at home, we continue to provide high quality public residential care in compliance with the National Standards for Residential Care Settings for Older People in Ireland. The HSE also administers the Nursing Homes Support Scheme (NHSS – A Fair Deal) introduced in 2009 as a demand-led, means-tested, resource-capped national scheme.
AREAS OF FOCUS IN THIS REPORT
• Service activity • Home Care Packages
• Number of people being funded under NHSS • Home Help Hours
SERVICE ACTIVITY
• 46,049 clients are receipt of home help service
• 11,372 clients (at any one time) are in receipt of a home care package
• 23,533 clients are supported by the Nursing Home Support Scheme
NUMBER OF PEOPLE FUNDED UNDER THE NURSING HOME SUPPORT SCHEME (NHSS)
Number of patients who have been approved for Long Term Residential Care funded beds
Number of patients in Long Term Residential Care funded beds
HSE Region
NHSS Public Beds
No. of patients in NHSS Private
No of clients in other * categories
Total in Payment during Month
Approved but not yet in payment
Overall Total
End Q4 –2012 5,080 14,590 2,395 22,065 806 22,871
DML 1,439 4,172 761 6,372 268 6,640
DNE 911 3,125 407 4,443 201 4,644
South 1,527 4,229 358 6,114 149 6,263
West 1,270 4,289 300 5,859 127 5,986
Total –Sept. 2013 5,147 15,815 1826 22,788 745 23,533
* refers to subvention scheme, contracted beds and ‘savers’.

SEPTEMBER 2013 NATIONAL PERFORMANCE ASSURANCE
REPORT 26
26
• In September 2013 23,533 long-term public and private residential places are supported under the scheme.
• In the first nine months of 2013, 8,261 applications were received and 6,277 new clients were supported under the NHSS in public and private nursing homes (net increase of 1,298 during the period).
• The scheme is taking on new clients within the limits of the resources available, in accordance with the legislation. At the end of September there were 523 people on the scheme’s national placement list.
• 100% of complete NHSS applications were processed within four weeks.
HOME CARE PACKAGES
• The expected level of service in 2013 is to deliver 10,870 home care packages.
• 11,372 home care packages have been provided to end of September 2013.
• Activity year-to-date is 4.6% above the expected level of service.
• South and West Regions are below the expected level of service with a variance of 13.2% and 4.6% respectively.
• DML and DNE Regions are above the expected level of service at 16.5% and 13.7%.
No. of Persons in receipt of a HCP 2013
1,800
2,100
2,400
2,700
3,000
3,300
3,600
3,900
4,200
4,500
Jan Feb Mar Apr May Jun Jul Aug Sep
DML DNE South West
HOME HELP HOURS
• At the end of September 2013, 7.1m home help hours have been provided, supporting over 46,000 people in their own homes.
• For 2013, expected level of service is 10.3m home help hours. Home help hours at the end of September are 2.9% behind expected level of service DML, South and West Regions are behind expected level of service by 6.9%, 7.8% and 1.5% respectively, while DNE is 8.9% ahead of expected level of service for home help hours.

SEPTEMBER 2013 NATIONAL PERFORMANCE ASSURANCE
REPORT 27
27
No. of People in reciept of HHH (excl. HCP hours) 2013
7,500
8,500
9,500
10,500
11,500
12,500
13,500
14,500
Jan Mar Jun Sep
DML DNE South West
• The intention for 2013 was to progressively increase the level of service provision being provided on a quarter by quarter basis. The monthly average for Quarter 1 is 745,869 hours, Quarter 2 is 777,161 hours and the monthly average for Quarter 3 is 873,572, this growing trend will continue to year end in response to individual service demand, including increased seasonal provision to support the “Winter Plan”, while also ensuring a sustainable level of service delivery on an existing level of service basis for home help hours going into 2014.
Home Help Hours
650,000
700,000
750,000
800,000
850,000
900,000
Q1 Q2 Q3
Average no. of Home Help Hours provided 2012 Average no. of Home Help Hours provided 2013

SEPTEMBER 2013 NATIONAL PERFORMANCE ASSURANCE
REPORT 28
28
Social Care Services: Disability Services INTRODUCTION TO DISABILITY SERVICES
The HSE works in partnership with other stakeholders to ensure that Ireland becomes a society where people with disabilities are supported to participate fully in economic and social life, and have access to a range of quality supports and services to enhance their quality of life and well-being.
Services are delivered by both the HSE and our non-statutory partners. Approximately 80% of all disability services are delivered by the non-statutory sector, funded through section 38 and 39 of the Health Act 2004. The funding allocated to the non-statutory sector is covered by either Service or Grant Aid Agreements.
AREAS OF FOCUS IN THIS REPORT
• Home Support and Personal Assistant Service
• School Leavers & Rehabilitative Training Placements
HOME SUPPORT AND PERSONAL ASSISTANT SERVICE
The expected level of service in 2013 is to deliver a Home Support or Personal Assistant service to 4,166 persons with a physical or sensory disability.
As of September 2013, there were 4,701 adults and children with a physical and / or sensory disability in receipt of Home Support or a Personal Assistant (PA) Service (12.8% over expected level of service).
In addition, 4,906 persons with an Intellectual Disability received 693,971 hours of Home Support (Jan – Sept 2013).
No. adults and children with physical and / or sensory disability benefiting from Home
Support Hours (including PA)
500
700
900
1,100
1,300
1,500
1,700
DML 823 986 1,106 1,048
DNE 842 1,073 1,136 1,130
South 1,055 1,072 1,065 1,052
West 1,383 1,430 1,617 1,471
Dec-12 Mar-13 Jun-13 Sep-13
SEPTEMBER 2013 NATIONAL PERFORMANCE ASSURANCE
REPORT 29
29
SCHOOL LEAVERS & REHABILITATIVE TRAINING PLACEMENTS
As outlined in the August Performance Assurance report a significant challenge presented in providing appropriate services for all school leavers and service users completing their Rehabilitative Training programmes. Of the total requirement of 1,332 places, the services have now provided places for 1,330 people i.e. 848 school leavers and 482 RT exits. In August it was clear that solutions had been found for many of the individuals with 27 remaining without a service and 163 requiring additional hours of service. Given the complexity in meeting the needs of 2 individuals further assessment and discussion was required. Engagement in respect of these 2 cases will lead to a longer lead in time for implementation. Overall therefore, all the individuals provided with partial placement and who required additional hours to address their assessed need have been fully addressed Now that the issues for 2013 are resolved the focus now has turned to streamlining arrangements for 2014 to ensure effective planning and implementation at an earlier stage and these arrangements will be reflected in the Service Plan 2014.

SEPTEMBER 2013 NATIONAL PERFORMANCE ASSURANCE
REPORT 30
30
Mental Health Services INTRODUCTION TO MENTAL HEALTH SERVICES
Mental Health services span all life stages and include a broad range of primary and community based services as well as specialised services for children and adolescents, adults and older persons. In recent years there has been increased specialisation including rehabilitation and recovery, liaison, forensic psychiatric services and services for those with a mental illness and intellectual disability. Services are provided in a number of different settings including; the individuals own home, outpatient clinics, day hospitals and day centres, low, medium and high support community accommodation and inpatient facilities.
Arising from the change of governance to the Mental Health Division in July, work has begun to support the establishment and service improvement objectives of the Division and the following workstreams have progressed:-
• Financial Control – the validation of the data base of all HSE mental health cost ongoing and once complete, spend and budget for mental health can be made fully visible nationally.
• Staff Analysis – a detailed exercise to map all mental health staff and link them to a particularly community team population or specific unit is at an advanced stage and this will allow linkage of mental health staff costs to overall mental health spend and budget.
The detail below refers to the performance framework agreed at the start of 2013 and this will be further developed in the context of the new Mental Health Division.
AREAS OF FOCUS IN THIS REPORT
• Child and Adolescent Mental Health Service • Recruitment update
• Key Performance Indicators for General Adult and Psychiatry of Old Age
CHILD AND ADOLESCENT MENTAL HEALTH SERVICE (CAMHS)
• The plan for 2013 is to offer first appointments to, and see, 10,025 new (including re-referred) cases. To date, 8,364 children / adolescents have been offered first appointment, with 7,384 new (including re-referred) cases seen by the end of September 2013.
• 11,142 referrals have been received year to date; this is +1,325 or 13% higher than the planned level of service.
• Currently the demand on our community teams, as measured by number of new referrals received and accepted, is increasing year on year.
• Consequently, some regions are running behind planned levels of service: DML -4%, DNE -33% and South -13%.
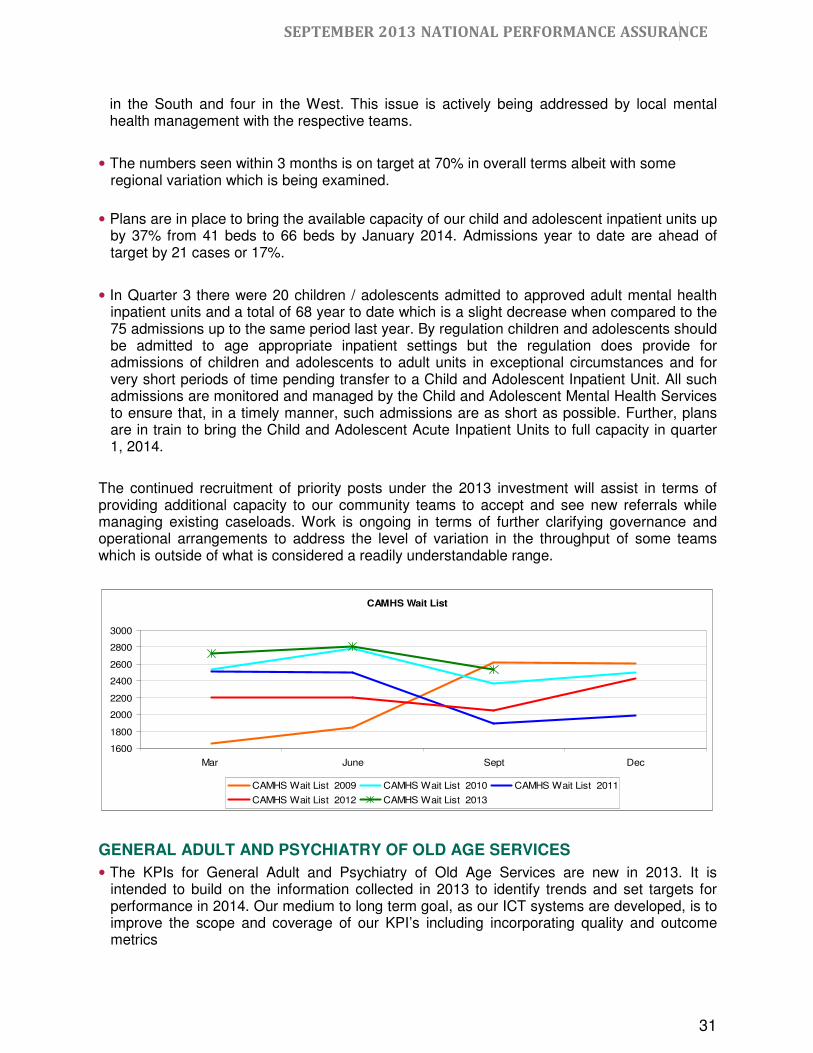
• The Child and Adolescent Mental Health Waiting List is 2,541 cases, this is 50% (845 cases) above the target of 1,696 cases and is reflecting the demand level.
• 38% (23) of teams have no patients waiting more than 12 months
• 11 out of the 37 teams with patients waiting more than 12 months make up 89% (369) of the total of 413 patients waiting more than 12 months. This includes one team in DNE, six teams
SEPTEMBER 2013 NATIONAL PERFORMANCE ASSURANCE
REPORT 31
31
in the South and four in the West. This issue is actively being addressed by local mental health management with the respective teams.
• The numbers seen within 3 months is on target at 70% in overall terms albeit with some regional variation which is being examined.
• Plans are in place to bring the available capacity of our child and adolescent inpatient units up by 37% from 41 beds to 66 beds by January 2014. Admissions year to date are ahead of target by 21 cases or 17%.
• In Quarter 3 there were 20 children / adolescents admitted to approved adult mental health inpatient units and a total of 68 year to date which is a slight decrease when compared to the 75 admissions up to the same period last year. By regulation children and adolescents should be admitted to age appropriate inpatient settings but the regulation does provide for admissions of children and adolescents to adult units in exceptional circumstances and for very short periods of time pending transfer to a Child and Adolescent Inpatient Unit. All such admissions are monitored and managed by the Child and Adolescent Mental Health Services to ensure that, in a timely manner, such admissions are as short as possible. Further, plans are in train to bring the Child and Adolescent Acute Inpatient Units to full capacity in quarter 1, 2014.
The continued recruitment of priority posts under the 2013 investment will assist in terms of providing additional capacity to our community teams to accept and see new referrals while managing existing caseloads. Work is ongoing in terms of further clarifying governance and operational arrangements to address the level of variation in the throughput of some teams which is outside of what is considered a readily understandable range.
CAMHS Wait List
1600
1800
2000
2200
2400
2600
2800
3000
Mar June Sept Dec
CAMHS Wait List 2009 CAMHS Wait List 2010 CAMHS Wait List 2011
CAMHS Wait List 2012 CAMHS Wait List 2013
GENERAL ADULT AND PSYCHIATRY OF OLD AGE SERVICES
• The KPIs for General Adult and Psychiatry of Old Age Services are new in 2013. It is intended to build on the information collected in 2013 to identify trends and set targets for performance in 2014. Our medium to long term goal, as our ICT systems are developed, is to improve the scope and coverage of our KPI’s including incorporating quality and outcome metrics

SEPTEMBER 2013 NATIONAL PERFORMANCE ASSURANCE
REPORT 32
32
• Our general adult community teams have received 31,237 referrals so far this year and have accepted 90% or 28,076. 86% of referrals have been seen within 8 weeks or less with 94% seen within 12 weeks or less.
• Our Psychiatry of Old Age Teams have received 7,855 referrals to date, have accepted 7,381 or 94% and have seen 6,795. 97% of referrals have been seen within 8 weeks or less and 99% within 12 weeks or less.
.
ACUTE ADULT INPATIENTS SERVICES
• In Q2 2013 the number of admissions to adult acute units was 3,480 and a total of 6,802 to date, 4% less than the anticipated admission numbers based on 2012 data. This trend may reflect the increasing capacity provided by the investment in General Adult Community Mental Health Teams.
• The median length of stay nationally was 10 days.
MENTAL HEALTH - RECRUITMENT We are progressing the Programme for Government investment in mental health in 2012 and 2013 of 891 WTEs to enhance the provision of community mental health services and suicide prevention initiatives.
Of the 414 WTEs allocated in 2012, the recruitment process is complete for 378 or 91% of the posts as at 30th September 2013. There are a number of posts for which there are difficulties in identifying suitable candidates due to factors including availability of qualified candidates and geographic location and the remainder are at various stages in the recruitment process.
In 2013, a further €35m and up to 477 WTES, was reinvested, building on the 2012 commitments and also to support the development of specialist mental health services.
Of the posts allocated in 2013, as at 30th September 2013, the recruitment process is complete for 19 or 4% of the post, 236 or 50 % of the posts are in the final stages of the recruitment process with a further 149 or 31% posts at various stages in the recruitment process, indicating that 85% of the 2013 allocation are in the recruitment process with the balance in the HR approvals process.
Table 1 – Progress in recruitment to 2012 posts and 2013 posts
Year Approved new
WTEs* per NSP
National Recruitment Service reported progress on Posts* As at 30/09/2013
Recruitment Process Complete**
Post Accepted and processing clearance
Post Offered
Post in Recruitment process
Potential Posts yet to enter recruitment process based on approved new WTEs i.e. WTEs less total posts in process or complete
2012 414 378 14 1 18 3
2013 477 19 209 27 149 73 * Note – WTEs and Posts may not always be 1 for 1 as people are recruited to full and part time posts
** Note – Recruitment may be complete and staff either in post or due to take up post

SEPTEMBER 2013 NATIONAL PERFORMANCE ASSURANCE
REPORT 33
33
Percentage of Children in Care with an Allocated Social Worker : 2013
80%
85%
90%
95%
100%
National 91.5% 91.2% 91.4% 92.4% 91.0% 91.0% 92.2% 91.6% 91.9%
DML 88.7% 90.2% 90.3% 90.4% 89.1% 88.7% 90.0% 87.4% 90.2%
DNE 94.8% 91.5% 87.6% 88.3% 86.4% 86.5% 86.5% 87.3% 85.0%
South 90.8% 91.4% 92.9% 93.8% 92.3% 96.3% 97.8% 96.9% 98.0%
West 91.8% 91.9% 94.7% 96.9% 96.0% 90.9% 92.8% 93.6% 92.8%
Jan Feb Mar Apr May Jun Jul Aug Sep
Children and Family Services INTRODUCTION
Children and Family services aim to promote and protect the health and wellbeing of children and families, particularly those who are at risk of abuse and neglect. These services work to improve quality and provision of effective community-based services for children with ‘additional needs’ and separated children seeking asylum, the rationalisation of special arrangements and maximising occupancy rates of residential units. As part of the Reform Programme the HSE’s Children and family services will transfer to the new Child and Family Support Agency.
CHILD PROTECTION AND WELFARE SERVICES
The HSE has a statutory duty under the Child Care Act 1991, for the care and protection of children and their families. In its Programme for Government 2011, the Government has set out fundamental reform for the provision of children and family services in Ireland. As part of this reform, the new Child and Family Support Agency (CFSA) is being established, the core of which is the existing HSE children and family services. The establishment of the new agency is part of a wider change agenda, aimed at strengthening the organisational capacity, processes and systems necessary to deliver safe, effective, consistent and reliable child protection services.
AREAS OF FOCUS IN THIS REPORT
• Allocated Social Workers
• Care Plans
ALLOCATED SOCIAL WORKERS
• The target in 2013 is that 100% of children in care have an allocated social worker.
• 5,943 (91.9%) of children in care (6,465) have been allocated a social worker at the end of
• September 2013.
• Activity is 8.1% down on target.
• Regional performance is as follows:

SEPTEMBER 2013 NATIONAL PERFORMANCE ASSURANCE
REPORT 34
34
Percentage of Children in Care with a Written Care Plan : 2013
50%
60%
70%
80%
90%
100%
National 87.3% 88.6% 88.6% 87.9% 89.9% 89.2% 89.7% 90.0% 87.8%
DML 67.0% 71.9% 73.2% 69.7% 78.0% 78.9% 75.1% 78.1% 78.5%
DNE 92.1% 92.4% 90.0% 89.2% 88.5% 87.1% 87.1% 85.3% 76.9%
South 95.3% 95.1% 95.1% 94.8% 95.4% 95.5% 96.6% 96.1% 96.1%
West 93.6% 94.0% 95.1% 97.1% 96.9% 93.9% 99.0% 99.2% 98.0%
Jan Feb Mar Apr May Jun Jul Aug Sep
DML 90.2% Performance is below 80% in Dublin South East 75.7% and Kildare West
Wicklow 73.0%
DNE 85.0% Performance is below 80% in Cavan Monaghan 67.4% and Dublin North West 79.0%
South 98.0% No LHO demonstrated a Performance below 80% West 92.8%. Performance is below 80% Tipperary North 74.1%
• There are a number of social worker posts which have been approved for filling and are
being processed as a priority by the National Recruitment Service.
• In addition to existing vacancy levels, the absence of staff on maternity leave is also having a significant impact on the capacity of some areas to allocate a social worker to all children in care.
CARE PLANS
• The target in 2013 is that 100% of children in care have a written care plan. • 5,679 (87.8%) of children in care (6,465) have a written care plan at the end of
September 2013. • Activity is 12.2% down on target. • Regional performance is as follows:
DML 78.5% Performance is below 80% in Dun Laoghaire 76.5%; Dublin South East 68.9%; Dublin South West 69.4%; Dublin West 77.3% and Kildare West Wicklow 48.3%
DNE 76.9% Performance is below 80% in Dublin North West 51.7% and Dublin North Central 74.3%.
South 96.1%. No LHO demonstrated a Performance below 80%
West 98.0%. No LHO demonstrated a Performance below 80%

SEPTEMBER 2013 NATIONAL PERFORMANCE ASSURANCE
REPORT 35
35
• A significant level of vacancies in social work services continues to adversely affect performance in some areas.
• There are a number of social worker posts which have been approved for filling and are being processed as a priority by the National Recruitment Service. Outstanding Children in Care reviews and care plans have been prioritised for completion. Social work staff have been reassigned to undertake this work. Targets have been set to ensure improvement within specific timelines.
• The drop in percentage of children with a written care plan refers to plans which have gone out of date in the month under review. Staff vacancies and maternity leave is adversely affecting the capacity of some regions to ensure that all care plans are up to date. The drop in DNE is related to a large number of care plans falling due in the month which cannot be completed on time within existing staffing levels.

SEPTEMBER 2013 NATIONAL PERFORMANCE ASSURANCE
REPORT 36
36
Financial Overview The HSE is reporting year to date expenditure of €9.345 billion against a budget of €9.226 billion leading to a gross deficit of €119.26m or 1.2% to the end of September 2013. For the same period in 2012 the deficit was €399.38m. Within this there is a core deficit of €14.25m when account is taken of the shortfall in budgeted retirees (Employment Control Framework (ECF) Target) resulting in lower than target pay savings. Delayed implementation of the Haddington Road Agreement (HRA) and Financial Emergency Measures in the Public Interest (FEMPI) in the Primary Care Re-imbursement Service (PCRS) also contributed to the deficit. These gross and core income and expenditure deficits are broken down as follows: Net / Core Deficit at the end of September 2013
DML DNE South West Other
National
Total Core
Deficit
2013 Gross Deficit
2012 Gross Deficit
€m €m €m €m €m €m €m €m
Hospital Services 19.32 12.95 14.47 27.61 0.00 74.35 123.87 207.05 Community Services 9.40 9.52 (2.28) (8.32) 0.00 8.34 25.83 22.88
Local Schemes 7.90 6.44 4.85 4.67 0.00 23.86 23.86
Sub - Total 36.62 28.91 17.04 23.96 0.00 106.54 173.56 229.92
PCRS 0.00 0.00 0.00 0.00 21.66 21.66 59.66 179.66 Corporate Services & Pensions 0.00 0.00 0.00 0.00 (94.88) (94.88) (94.88) 4.54
National Services 0.00 0.00 0.00 0.00 (5.15) (5.15) (5.15) (4.96)
Fair Deal 0.00 0.00 0.00 0.00 (13.78) (13.78) (13.78) (10.42)
Children and Families 0.00 0.00 0.00 0.00 11.64 11.64 11.64 28.78
Population Health 0.00 0.00 0.00 0.00 (10.76) (10.76) (10.76) (7.33)
Care Group / Other 0.00 0.00 0.00 0.00 (1.02) (1.02) (1.02) (20.81)
Total 36.62 28.91 17.04 23.96 (92.30) 14.25 119.26 399.38
*Local Schemes included under PCRS heading in 2012
It is important to note that the surpluses under some headings may reverse by year end. In relation to “Fair Deal”, the scheme is taking on new clients within the limits of the resources available, in accordance with the legislation. The Fair Deal surplus has reduced by €3.19m in the month. The HSE will continue to examine the position with a view to releasing additional funded approvals if necessary in the remaining months of the year from within the resources available.
Based on nine months data the HSE is not flagging any new concerns / risks beyond those which were clearly set out within the National Service Plan 2013 (NSP) as approved by the Minister on 9th January 2013 and within the Regional and Hospital Group Service Plans which were published in February. These risks remain and principally include the following;

SEPTEMBER 2013 NATIONAL PERFORMANCE ASSURANCE
REPORT 37
37
1. PCRS - SCALE OF BUDGETED SAVINGS -€353M
A total of €353m in savings targets was set for the HSE in 2013. Due to delayed implementation of regulations under FEMPI, €38m of the €59m deficit at the end of September can be attributed to this delay. FEMPI regulations are effective from 24th July 2013 and reductions of €6m were achieved to September 2013. The current risk assessment / projected outlook to year end indicates a projected deficit in the region of €70m based on nine months data. This is subject to certain assumptions around performance in the remaining months of 2013. 2. PUBLIC SERVICE AGREEMENT - €150M
The Haddington Road Agreement took effect from 1st July 2013.The potential value of this risk in terms of projected deficit has undergone a detailed review and an assessment of the likely 2013 savings that are expected to be delivered. 3. PRIVATE HEALTH INSURANCE INCOME – 2013 LEGISLATION TARGET €60M
The private patient charges provisions were originally due to take effect on July 1st 2013 and generate €60m for the latter half of the year. These measures will now take effect on 1 January 2014 and therefore there will be no generation or collection benefit in 2013 to the HSE.
The financial impact of the delayed implementation of the legislation started to materialise in July with an increase in deficits being reported by relevant hospitals. To the end of September 2013 non achievement of these income targets has increased hospital deficits by €30m and will increase hospital deficits by a further €10m a month for the remaining months of 2013. 4. 2012 ACCELERATED PRIVATE HEALTH INSURANCE INCOME €104M
The accelerated income received in December 2012 will be required in 2013 or it will have an adverse effect on the HSE Vote. Resolution of this issue will require a sustainable improvement in payment terms or similar. Engagement is ongoing with the insurers through the Consultative Forum on Health Insurance seeking to progress this matter. €20m of this amount is being addressed by the HSE through income collection improvement measures. CONCLUSION
The risk assessment / projected outlook to year end would indicate that there is a direct services projected deficit of circa €105m including a projected shortfall for hospitals of €75m and €25m on local schemes (previously PCRS). The direct services projected deficit is a reflection of the overall challenge within the remainder of our community and hospital services once account is taken of the risks that were set out in the National Service Plan 2013. This deficit is stated net of the four key risk areas the HSE has identified and referred to above where, within the parameters of the NSP 2013 as approved by the Minister on the 9th January 2013, the HSE does not in itself have the capacity to address any shortfalls that may emerge in these risk areas that are outside of the sole control of the HSE. Within our direct services HSE is at this stage in the year, subject to any necessary approvals around the use of once-off surpluses1, expecting to deliver a substantially breakeven position by year end on these services. However in relation to 1 – 4 above a risk still remains.
1 Including Superannuation and time related savings on priority 2013 investments. Recruitment of priority posts has been
underway since earlier this year when DOH approvals were received. However, even allowing for accelerated recruitment processing times, full year funding has been provided and there will be an element of once-off time related savings.
SEPTEMBER 2013 NATIONAL PERFORMANCE ASSURANCE
REPORT 38
38
Human Resources
INTRODUCTION TO THE HUMAN RESOURCES DIVISION
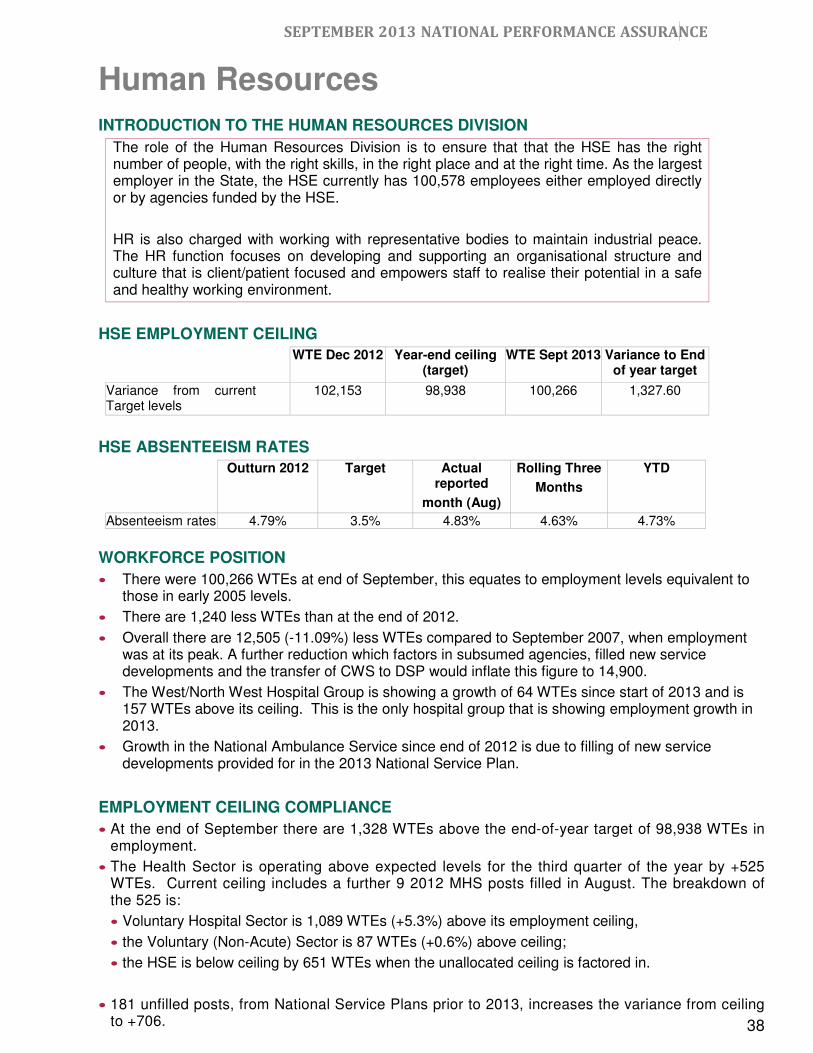
The role of the Human Resources Division is to ensure that that the HSE has the right number of people, with the right skills, in the right place and at the right time. As the largest employer in the State, the HSE currently has 100,578 employees either employed directly or by agencies funded by the HSE.
HR is also charged with working with representative bodies to maintain industrial peace. The HR function focuses on developing and supporting an organisational structure and culture that is client/patient focused and empowers staff to realise their potential in a safe and healthy working environment.
HSE EMPLOYMENT CEILING
WTE Dec 2012 Year-end ceiling (target)
WTE Sept 2013 Variance to End of year target
Variance from current Target levels
102,153 98,938 100,266 1,327.60
HSE ABSENTEEISM RATES
Outturn 2012 Target Actual reported
month (Aug)
Rolling Three
Months
YTD
Absenteeism rates 4.79% 3.5% 4.83% 4.63% 4.73%
WORKFORCE POSITION
• There were 100,266 WTEs at end of September, this equates to employment levels equivalent to those in early 2005 levels.
• There are 1,240 less WTEs than at the end of 2012.
• Overall there are 12,505 (-11.09%) less WTEs compared to September 2007, when employment was at its peak. A further reduction which factors in subsumed agencies, filled new service developments and the transfer of CWS to DSP would inflate this figure to 14,900.
• The West/North West Hospital Group is showing a growth of 64 WTEs since start of 2013 and is 157 WTEs above its ceiling. This is the only hospital group that is showing employment growth in 2013.
• Growth in the National Ambulance Service since end of 2012 is due to filling of new service developments provided for in the 2013 National Service Plan.
EMPLOYMENT CEILING COMPLIANCE
• At the end of September there are 1,328 WTEs above the end-of-year target of 98,938 WTEs in employment.
• The Health Sector is operating above expected levels for the third quarter of the year by +525 WTEs. Current ceiling includes a further 9 2012 MHS posts filled in August. The breakdown of the 525 is:
• Voluntary Hospital Sector is 1,089 WTEs (+5.3%) above its employment ceiling,
• the Voluntary (Non-Acute) Sector is 87 WTEs (+0.6%) above ceiling;
• the HSE is below ceiling by 651 WTEs when the unallocated ceiling is factored in.
• 181 unfilled posts, from National Service Plans prior to 2013, increases the variance from ceiling to +706.

SEPTEMBER 2013 NATIONAL PERFORMANCE ASSURANCE
REPORT 39
39
• 879 new service development posts as provided for in the National Service Plan 2013 must be factored in to the headroom required between now and the end of 2013.
• Just one Region (HSE South) is currently operating within its employment ceiling.
AGENCY/OVERTIME EXPENDITURE AND HADDINGTON ROAD AGREEMENT
There has been overall agency spend of €184 million up to the end of September, this is an increase of
€19 million (+11.85%) compared to the same period in 2012.
• There have been increases in four staff categories with Medical/Dental up 23.97%, and Health & Social Care Professionals up 18.97% the two major contributors.
Overtime expenditure to the end of September totals €173 million. This is a reduction of €23m on the same period in 2012. All staff categories are recording reductions.
• Nursing overtime is down €6 million or -20% and compares with a recorded reduction of €4 million or -17.5% at the end of June.
• Overtime costs in the staff category of Medical/Dental, who account for over two thirds of total overtime expenditure, has reduced by 7%.
Effective utilisation of additional hours, implementation of the Nurse Graduate Programme and Support Staff Intern Scheme, coupled to redeployment of staff are significant enablers to service managers to reduce overtime and agency usage post 1st July 2013.
Nursing and Support Staff Agency and Overtime Expenditure compared 2012 and year to date 2013 is set out in the table below.
Nursing and Support Staff Agency and Overtime Expenditure 2012 and YTD 2013
Region/Year Total DML DNE South West
Combined Nursing Agency and Overtime Expenditure as recorded in CRS
2012 - Full Year €125,026,196 €48,752,783 €44,342,161 €21,553,564 €8,974,459
% of total 38.99% 35.47% 17.24% 7.18%
YTD 2013 (September) €94,086,454 €35,289,501 €33,579,580 €17,061,631 €6,231,805
% of total 37.51% 35.69% 18.13% 6.62%
Combined Support Staff Agency and Overtime Expenditure as recorded in CRS
2012 - Full Year €87,092,533 €37,641,508 €26,700,075 €13,824,754 €8,091,893
% of total 43.22% 30.66% 15.87% 9.29%
YTD 2013 (September) €67,189,094 €29,170,670 €20,235,608 €10,279,075 €6,090,103
% of total 43.42% 30.12% 15.30% 9.06%
Source: CRS
RECRUITMENT / STARTERS
Starter Reports for 2013 across the Public Health Sector to the end of August gives a figure of the order of 2,093 WTEs, with Acute Services accounting for 61.5% of total. The starter figures do not include student nurse placements but do include NCHDs.
Non-acute services account for 32.4% of total with the balance between; National Ambulance Service, Health & Wellbeing and Corporate.

SEPTEMBER 2013 NATIONAL PERFORMANCE ASSURANCE
REPORT 40
40
Report from National Recruitment Services – Recruitment of Health & Social Care Professionals • 549 health and social care personnel have been recruited to work in the health services year-to-
date of which 96 commenced employment in September 2013. • 321 of these posts are Development Posts under the National Service Plan. Health and social care personnel recruited year-to-date
Social Care Region
Acute
Services
Primary
Care
Health & Wellbeing
Services for Older People
Disability Services
Mental Health
Child Protection and
Welfare Services
DNE 14 25 0 0 0 80 19
DML 0 19 0 1 0 52 17
South 31 9 0 0 1 75 17
West 31 19 0 3 0 75 22
Corporate 19 1 0 0 0 0 19
TOTAL 95 73 0 4 1 282 94
NEW SERVICE DEVELOPMENTS 2012 AND 2013
• 351WTEs (76.4%) of 2011 new service developments filled, up 4 WTEs from August.
• 340 WTEs (82.3%) of the 413 planned and funded 2012 service developments in Mental Health Services have been filled, up 9 WTEs since August. Final 73 WTEs are in the final stages of recruitment.
• 124 WTEs of 2013 new service development posts filled, up 54 WTEs from August (63.7 WTEs - National Ambulance Service, 44 WTEs - Primary Care, 8 WTEs - Mental Health Services and 8 WTEs - Acute Services).
PUBLIC SERVICE STABILITY AGREEMENT (PSSA)
• The Pay reduction element of the PSSA will deliver €56m in a full year. €14m was delivered on this in the three months July – September.
• The changes to rates of Overtime and Premium payments will deliver €52m in a full year. €13m was delivered in the three months July – September.
ABSENTEEISM1
• Reported 1 month in arrears
• Overall absenteeism target for 2013 is 3.5%.
• Absenteeism for August is 4.83%, while the year to date position stands at 4.73% (Jan– Aug). Annual absenteeism rates have been showing a gradual improvement from 2008 when it was recorded at 5.76%.
• 91.92% of absenteeism in August was medically certified, showing an upward trend since late 2012 when changes to self-certified leave were introduced.
Regional performance
Region DML DNE South West National
August 2013 4.38% 4.50% 4.98% 5.52% 4.83%
YTD 4.37% 4.48% 4.83% 5.23% 4.73%
1 Reported 1 month in arrears.

SEPTEMBER 2013 NATIONAL PERFORMANCE ASSURANCE
REPORT 41
41
Health Service Management has a range of supports and interventions to address attendance management and absenteeism in place. These include;
• Training and development for line managers.
• HR and Occupational Health Interventions to support line managers in managing attendance.
• An agreed set of actions, monitored on a monthly basis by the Regional Directors of Performance and Integration and overseen by the Office of the Chief Operations Officer, is in place.
Monthly reporting of absenteeism levels in National Performance Reports. Absenteeism is a key performance indicator (KPI) and is a feature of all management engagement at national, regional and local levels.

SEPTEMBER 2013 NATIONAL PERFORMANCE ASSURANCE
REPORT 42
42
Target YTD Activity YTD
% var
Activity
YTD v
Target YTD
Target this
M/Q
Actual this
M/Q
% var
reported
activity v
target this
M/Q
Health Protection
% of children 24 months of age who have received
three doses of 6 in 1 vaccine
Q
(Arrears)
95.1% 95% 95% 95.2% 0.2% 95% 95.4% 0.4%
% of children 24 months of age who have received
the MMR vaccine
Q
(Arrears)
92.4% 95% 95% 92.3% -2.8% 95% 92.2% -2.9%
Child Health
% new born babies visited by a PHN within 48 hours
of hospital dischargeQ 84.0% 95% 95% 83.9% -11.7% 95% 85.3% -10.2%
% children reaching 10 months in the reporting
period who have had their child development health
screening on time before reaching 10 months of age
M
(Arrears)85.7% 95% 95% 87.6% -7.8% 95% 88.4% -6.9%
Child Protection and Welfare Services
% children in care who have an allocated social
worker at the end of the reporting periodM 91.9% 100% 100% 91.9% -8.1% 100.0% 91.9% -8.1%
% children in care who currently have a written care
plan, as defined by Child Care Regulations 1995 , at
the end of the reporting period
M 87.6% 100% 100% 87.8% -12.2% 100.0% 87.8% -12.2%
Primary Care
No. of PCTs implementing the national integrated
Care Package for Diabetes Q 51 51 0 -100.0% 51 0 -100.0%
No. primary care physiotherapy patients seen for a
first time assessmentM 139,102 104,327 109,013 4.5% 11,592 12,679 9.4%
Child and Adolescent Mental Health
% on waiting list for first appointment waiting >12
monthsQ 338 0% 0% 413 >100% 0% 16% >100%
Adult Acute Mental Health Services Inpatient
Units
No. of admissions to adult acute inpatient units Q 13,584 14,044 7,082 6,802 -4.0% 3,541 3,480 -1.7%
Disability Services
Total no. of home support hours (incl. PA) delivered
to adults and children with physical and / or sensory
disability
Q 2.14m 1.68m 1,257,992 2,059,847 63.7% 419,331 740,597 76.6%
No. of persons with ID and / or autism benefitting
from residential servicesQ 8,188 8,172 8,172 8,174 0.0% 8,172 8,174 0.0%
Non Acute CarePerformance YTD Performance this M/Q
Report
Frequency
(NSP 2013)
Performance Indicator Outturn 2012Target
2013
APPENDIX 1 NATIONAL BALANCE SCORECARD

SEPTEMBER 2013 NATIONAL PERFORMANCE ASSURANCE
REPORT 43
43
Target YTD Activity YTD
% var
Activity
YTD v
Target YTD
Target this
M/Q
Actual this
M/Q
% var
reported
activity v
target this
M/Q
Older People Services
No. of people being funded under the Nursing Home
Support Scheme (NHSS) in long term residential
care at end of reporting period
M 22,871 22,761 22,767 23,533 3.4% 22,767 23,533 3.4%
No. of persons in receipt of a Home Care Package M 11,023 10,870 10,870 11,372 4.6% 10,870 11,372 4.6%
No. of Home Help Hours provided for all care groups
(excluding provision of hours from HCPs)M 9,887,727 10.3m 7,402,816 7,189,809 -2.9% 884,000 824,076 -6.8%
% of elder abuse referrals receiving first response
from senior case workers within 4 weeksQ 99% 100% 100% 97.7% -2.3% 100% 97.9% -2.1%
Palliative Care
% of specialist inpatient beds provided within 7 days M 93% 92% 92% 94.0% 2.2% 92% 97% 5.4%
% of home, non-acute hospital, long term residential
care delivered by community teams within 7 daysM 83% 82% 82% 86.0% 4.9% 82% 88% 7.3%
Social Inclusion
% of individual service users admitted to residential
homeless services who have medical cards.Q 75% >75% >75% 66% -28.0% >75% 66% -28.0%
Non Acute CarePerformance YTD Performance this M/Q
Report
Frequency
(NSP 2013)
Performance Indicator Outturn 2012Target
2013

SEPTEMBER 2013 NATIONAL PERFORMANCE ASSURANCE
REPORT 44
44
Target YTD Activity
YTD
% var
Activity
YTD v
Target YTD
Target this
M/Q
Reported
this M/Q
% var
reported
activity v
target this
M/Q
Emergency Care
% of all attendees at ED who are discharged or
admitted within 6 hours of registration M
67.5% 95% 95% 65.8% -30.7% 95% 68.1% -28.3%
% of all attendees at ED who are discharged or
admitted within 9 hours of registrationM
81.5% 100% 100% 79.9% -20.1% 100% 82.4% -17.6%
Elective Waiting Time
No. of adults waiting more than 8 months for an
elective procedureM
0 0 5,713
12.7%
0 5,713
12.7%
No. of children waiting more than 20 weeks for an
elective procedureM
0 0 1,010
22.7%
0 1,010
22.7%
Colonoscopy / Gastrointestinal Service
No. of people waiting more than 4 weeks for an
urgent colonoscopyM
0 0 0 0 0 0
No of people waiting more than 13 weeks following a
referral for routine colonoscopy or OGDM
36 0 0 1,482
15.8%
0 1,482
15.8%
Outpatients
No. of people waiting longer than 52 weeks for OPD
appointmentM
0 0 84,423 0 84,423
Day of Procedure Admission
% of elective inpatients who had principal procedure
conducted on day of admissionM
56% 75% 75% 61% -18.7% 75% 61% -18.7%
% of elective surgical inpatients who had principal
procedure conducted on day of admission M
New for
2013
85% 85% 66% -22.8% 85% 66% -22.8%
Re-Admission Rates
% of surgical re-admissions to the same hospital
within 30 days of dischargeM
New for
2013
<3% <3% 2% 32.8% <3% 2% 32.8%
% of emergency re-admissions for acute medical
conditions to the same hospital within 28 days of
discharge
M
11.1% 9.6% 9.6% 10.7% -11.5% 9.6% 10.7% -11.5%
Surgery
% of emergency hip fracture surgery carried out
within 48 hours (pre-op LOS: 0, 1 or 2) M
84.0% 95% 95% 83.3% -12.4% 95% 83.3% -12.4%
Stroke Care
% of hospital stay for acute stroke patients in stroke
unit who are admitted to an acute or combined
stroke unit.
BI-A
50% 50% 59.6% 50% 50% 59.6% 19.2%
Acute Coronary Syndrome
% STEMI patients (without contraindication to
reperfusion therapy) who get PPCIQ
70% 70% 68.4% -2.3% 70% 68.4% -2.3%
Acute CarePerformance YTD
Performance Indicator
Performance this M/Q
Report
Frequency
(NSP 2013)
Outturn
2012
Target
2013
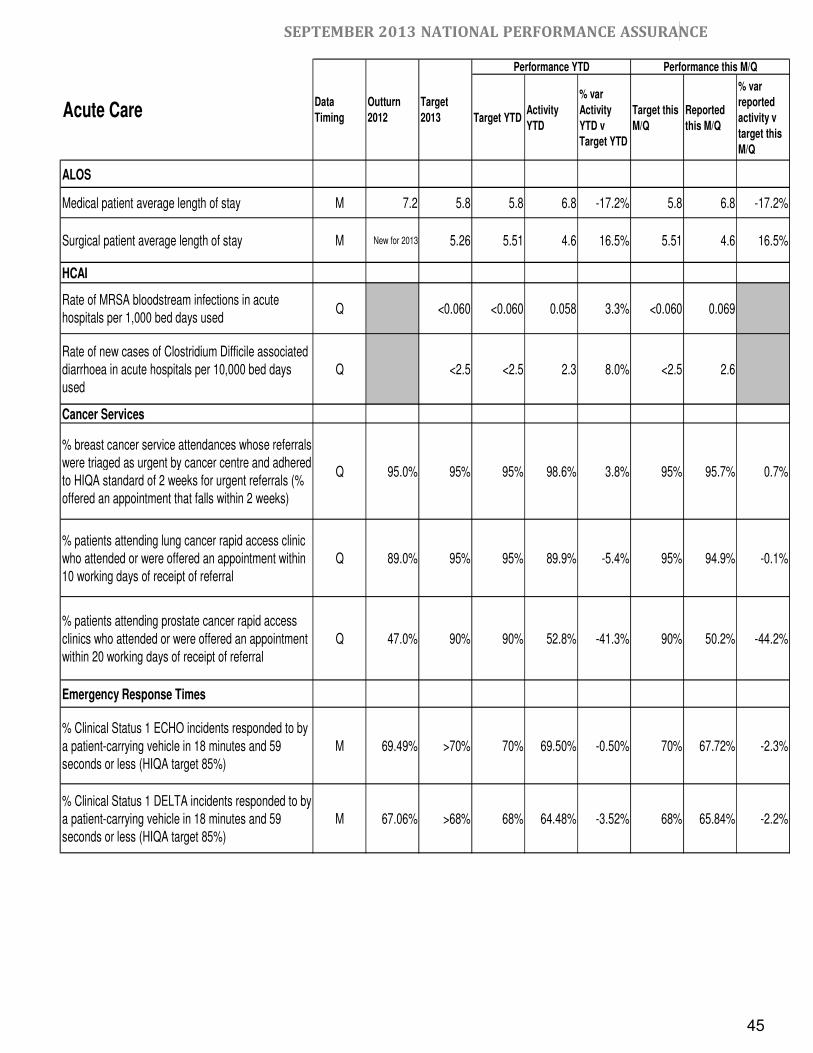
SEPTEMBER 2013 NATIONAL PERFORMANCE ASSURANCE
REPORT 45
45
Target YTD Activity
YTD
% var
Activity
YTD v
Target YTD
Target this
M/Q
Reported
this M/Q
% var
reported
activity v
target this
M/Q
ALOS
Medical patient average length of stay M 7.2 5.8 5.8 6.8 -17.2% 5.8 6.8 -17.2%
Surgical patient average length of stay M New for 2013 5.26 5.51 4.6 16.5% 5.51 4.6 16.5%
HCAI
Rate of MRSA bloodstream infections in acute
hospitals per 1,000 bed days usedQ <0.060 <0.060 0.058 3.3% <0.060 0.069
Rate of new cases of Clostridium Difficile associated
diarrhoea in acute hospitals per 10,000 bed days
used
Q <2.5 <2.5 2.3 8.0% <2.5 2.6
Cancer Services
% breast cancer service attendances whose referrals
were triaged as urgent by cancer centre and adhered
to HIQA standard of 2 weeks for urgent referrals (%
offered an appointment that falls within 2 weeks)
Q 95.0% 95% 95% 98.6% 3.8% 95% 95.7% 0.7%
% patients attending lung cancer rapid access clinic
who attended or were offered an appointment within
10 working days of receipt of referral
Q 89.0% 95% 95% 89.9% -5.4% 95% 94.9% -0.1%
% patients attending prostate cancer rapid access
clinics who attended or were offered an appointment
within 20 working days of receipt of referral
Q 47.0% 90% 90% 52.8% -41.3% 90% 50.2% -44.2%
Emergency Response Times
% Clinical Status 1 ECHO incidents responded to by
a patient-carrying vehicle in 18 minutes and 59
seconds or less (HIQA target 85%)
M 69.49% >70% 70% 69.50% -0.50% 70% 67.72% -2.3%
% Clinical Status 1 DELTA incidents responded to by
a patient-carrying vehicle in 18 minutes and 59
seconds or less (HIQA target 85%)
M 67.06% >68% 68% 64.48% -3.52% 68% 65.84% -2.2%
Performance YTD
Acute Care
Performance this M/Q
Data
Timing
Outturn
2012
Target
2013

SEPTEMBER 2013 NATIONAL PERFORMANCE ASSURANCE
REPORT 46
46
FINANCE BALANCE SCORECARD
Income and Expenditure Key Performance Measurement
Approved Allocation
€000
Actual YTD
€000
Budget YTD
€000
Variance YTD
€000
% Var Act v Tar
Variance against Budget: Pay
6,945,834 5,147,080 5,210,372 -63,292 -1.2%Variance against Budget: Non Pay
7,329,463 5,598,826 5,471,226 127,599 2.3%Variance against Budget: Income
(1,960,147) (1,400,360) (1,455,316) 54,956 -3.8%Variance against Budget: Income and Expenditure Total
12,315,149 9,345,546 9,226,282 119,263 1.3%
Vote Key Performance
Measurement REV 2013
'€000
Actual YTD
€000
Profile YTD
€000
(Under) /
Over YTD
€000
% Var Act v
Tar
Vote expenditure vs Profile Revenue
11,939,471 9,338,611 9,209,121 129,490 1.4%Vote expenditure vs Profile Capital
373,000 168,329 256,696 -88,367 -34.4%Total - Vote Expenditure vs Profile (Revenue & Capital) 12,312,471 9,506,940 9,465,817 41,123 0.4%
Income Key Performance Measurement
Working
Target
€000
Actual YTD
€000
Budget YTD
€000
Variance YTD
€000
% Var Act v
Tar
Patient Private Insurance – Claims processed
530,603 314,619 382952 -68,333 -18%
HUMAN RESOURCES BALANCE SCORECARD
WTE Dec 2012 Year-end ceiling (target)
WTE Sept 2013 Variance to End of year target
Variance from current
102,153 98,938 100,266 1,328
Outturn 2012 Target Actual reported
month (Aug)
Rolling Three
Months
YTD
Absenteeism rates 4.79% 3.50% 4.83% 4.63% 4.73%