health sector performance - world...
TRANSCRIPT

H N P D I S C U S S I O N P A P E R
About this series...
This series is produced by the Health, Nutrition, and Population Family(HNP) of the World Bank’s Human Development Network. The papersin this series aim to provide a vehicle for publishing preliminary andunpolished results on HNP topics to encourage discussion and debate.The findings, interpretations, and conclusions expressed in this paperare entirely those of the author(s) and should not be attributed in anymanner to the World Bank, to its affiliated organizations or to membersof its Board of Executive Directors or the countries they represent.Citation and the use of material presented in this series should takeinto account this provisional character. For free copies of papers inthis series please contact the individual authors whose name appearson the paper.
Enquiries about the series and submissions should be made directly tothe Editor in Chief Alexander S. Preker ([email protected]) orHNP Advisory Service ([email protected], tel 202 473-2256,fax 202 522-3234). For more information, see alsowww.worldbank.org/hnppublications.
THE WORLD BANK
1818 H Street, NWWashington, DC USA 20433Telephone: 202 477 1234Facsimile: 202 477 6391Internet: www.worldbank.orgE-mail: [email protected]
Using Immunization Coverage Rates for MonitoringHealth Sector Performance
Measurement and Interpretation Issues
Eduard Bos and Amie Batson
August 2000

USING IMMUNIZATION COVERAGE RATES FOR MONITORING HEALTH SECTOR PERFORMANCE
Measurement and Interpretation Issues
Eduard Bos and Amie Batson
August 2000
2
Health, Nutrition and Population (HNP) Discussion Paper This series is produced by the Health, Nutrition, and Population Family (HNP) of the World Bank's Human Development Network (HNP Discussion Paper). The papers in this series aim to provide a vehicle for publishing preliminary and unpolished results on HNP topics to encourage discussion and debate. The findings, interpretations, and conclusions expressed in this paper are entirely those of the author(s) and should not be attributed in any manner to the World Bank, to its affiliated organizations or to members of its Board of Executive Directors or the countries they represent. Citation and the use of material presented in this series should take into account this provisional character. For free copies of papers in this series please contact the individual authors whose name appears on the paper. Enquiries about the series and submissions should be made directly to the Editor in Chief. Submissions should have been previously reviewed and cleared by the sponsoring department which will bear the cost of publication. No additional reviews will be undertaken after submission. The sponsoring department and authors bear full responsibility for the quality of the technical contents and presentation of material in the series. Since the material will be published as presented, authors should submit an electronic copy in a predefined format as well as three camera-ready hard copies (copied front to back exactly as the author would like the final publication to appear). Rough drafts that do not meet minimum presentational standards may be returned to authors for more work before being accepted. The Editor in Chief of the series is Alexander S. Preker ([email protected]); For information regarding this and other World Bank publications, please contact the HNP Advisory Services ([email protected]) at: Tel (202) 473-2256; and Fax (202) 522-3234. ISBN 1-932126-24-4 © 2000 The International Bank for Reconstruction and Development / The World Bank 1818 H Street, NW Washington, DC 20433 All rights reserved.

2

3
Contents
Acknowledgements 4 Abstract 5
1. Immunization Coverage Indicators: What, Why, and How 7 2. Measuring immunization: what is measured 8
3. Sources of immunization data 10 4. Potential errors in immunization coverage data 10 5. Using immunization coverage data: setting targets 18. 6. Using immunization coverage data: assessing equity in health 19 7. Using immunization coverage data: dropout rates 20 8. Summary 21
Tables
1. Immunization coverage rates and standard errors 12 2. Survey and program coverage rates, DPT3 and measles 14 3. Immunization coverage, 1980-1997 17 4. Average annual improvement in coverage, all low-and middle income countries 17 5. Average annual improvement in coverage, countries with over 80 percent coverage 17
Figures
1. Immunization coverage and under-five mortality, low and middle income countries 8 2. The denominator problem: Yemen, measles coverage 11 3. Routine and survey coverage for DPT3 13 4. Comparison of survey and program coverage rates, six countries 15 5. DPT3 Coverage by State, India, 1998 19 6. Immunization coverage: DPT3 coverage by wealth quintile 20 7. Dropout rates, Bolivia, 1989, 1994, and 1998 20
Annex Tables
1. Immunization coverage rates, BCG, DPT3,HBV, Measles, OPV3,TT2, WHO time series 1980-1998
2a. Immunization coverage rates, Demographic and Health Surveys, children age 12-23 months
2b. Immunization coverage rates, Demographic and Health Surveys, children age 12-23 months, immunized before reaching age 1
3. Immunization coverage rates by wealth quintiles 4. Immunization coverage for DPT1, DPT2, and DPT3 and drop-out rates

4
Acknowledgments
The authors acknowledge with thanks the financial assistance provided by the Gates Children's Vaccine Program at PATH that supported the preparation of this report. The following individuals provided helpful
comments, information and other suggestions on an earlier draft: Maureen Birmingham, Anthony Burton, Sara England, Alan Hinman John Lloyd, and Anthony Measham.
5
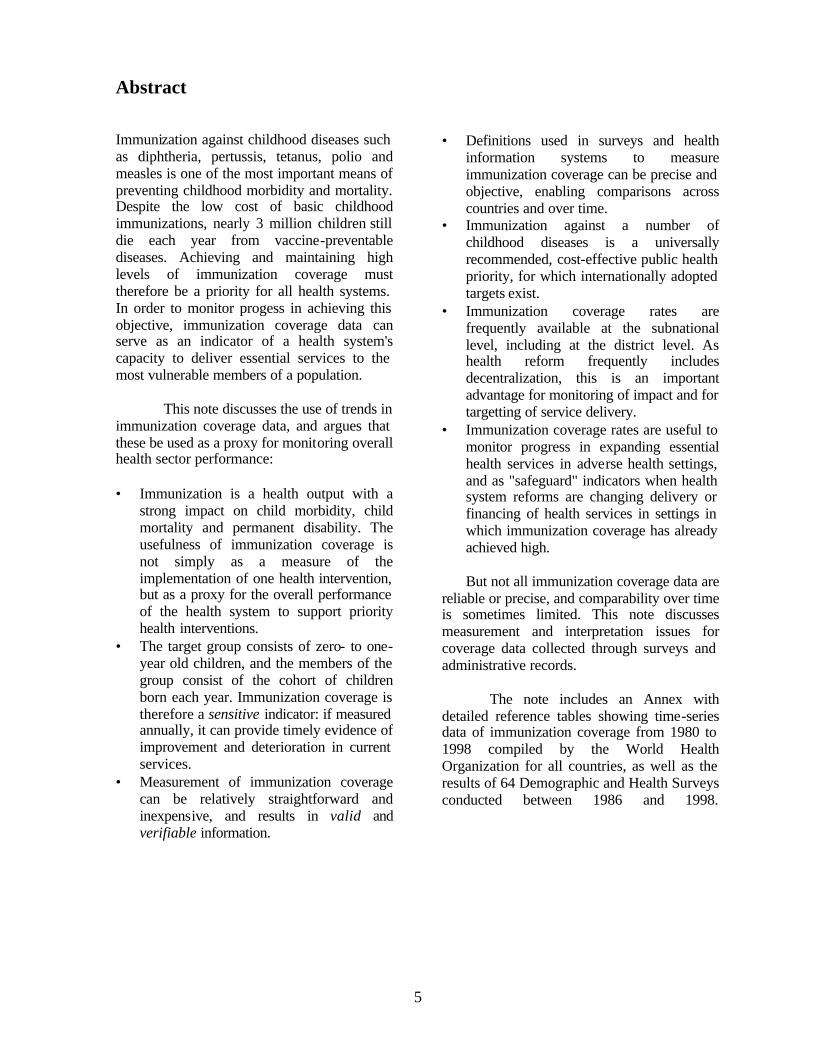
Abstract Immunization against childhood diseases such as diphtheria, pertussis, tetanus, polio and measles is one of the most important means of preventing childhood morbidity and mortality. Despite the low cost of basic childhood immunizations, nearly 3 million children still die each year from vaccine-preventable diseases. Achieving and maintaining high levels of immunization coverage must therefore be a priority for all health systems. In order to monitor progess in achieving this objective, immunization coverage data can serve as an indicator of a health system's capacity to deliver essential services to the most vulnerable members of a population.
This note discusses the use of trends in
immunization coverage data, and argues that these be used as a proxy for monitoring overall health sector performance:
• Immunization is a health output with a
strong impact on child morbidity, child mortality and permanent disability. The usefulness of immunization coverage is not simply as a measure of the implementation of one health intervention, but as a proxy for the overall performance of the health system to support priority health interventions.
• The target group consists of zero- to one-year old children, and the members of the group consist of the cohort of children born each year. Immunization coverage is therefore a sensitive indicator: if measured annually, it can provide timely evidence of improvement and deterioration in current services.
• Measurement of immunization coverage can be relatively straightforward and inexpensive, and results in valid and verifiable information.
• Definitions used in surveys and health information systems to measure immunization coverage can be precise and objective, enabling comparisons across countries and over time.
• Immunization against a number of childhood diseases is a universally recommended, cost-effective public health priority, for which internationally adopted targets exist.
• Immunization coverage rates are frequently available at the subnational level, including at the district level. As health reform frequently includes decentralization, this is an important advantage for monitoring of impact and for targetting of service delivery.
• Immunization coverage rates are useful to monitor progress in expanding essential health services in adverse health settings, and as "safeguard" indicators when health system reforms are changing delivery or financing of health services in settings in which immunization coverage has already achieved high.
But not all immunization coverage data are
reliable or precise, and comparability over time is sometimes limited. This note discusses measurement and interpretation issues for coverage data collected through surveys and administrative records.
The note includes an Annex with detailed reference tables showing time-series data of immunization coverage from 1980 to 1998 compiled by the World Health Organization for all countries, as well as the results of 64 Demographic and Health Surveys conducted between 1986 and 1998.

6
7
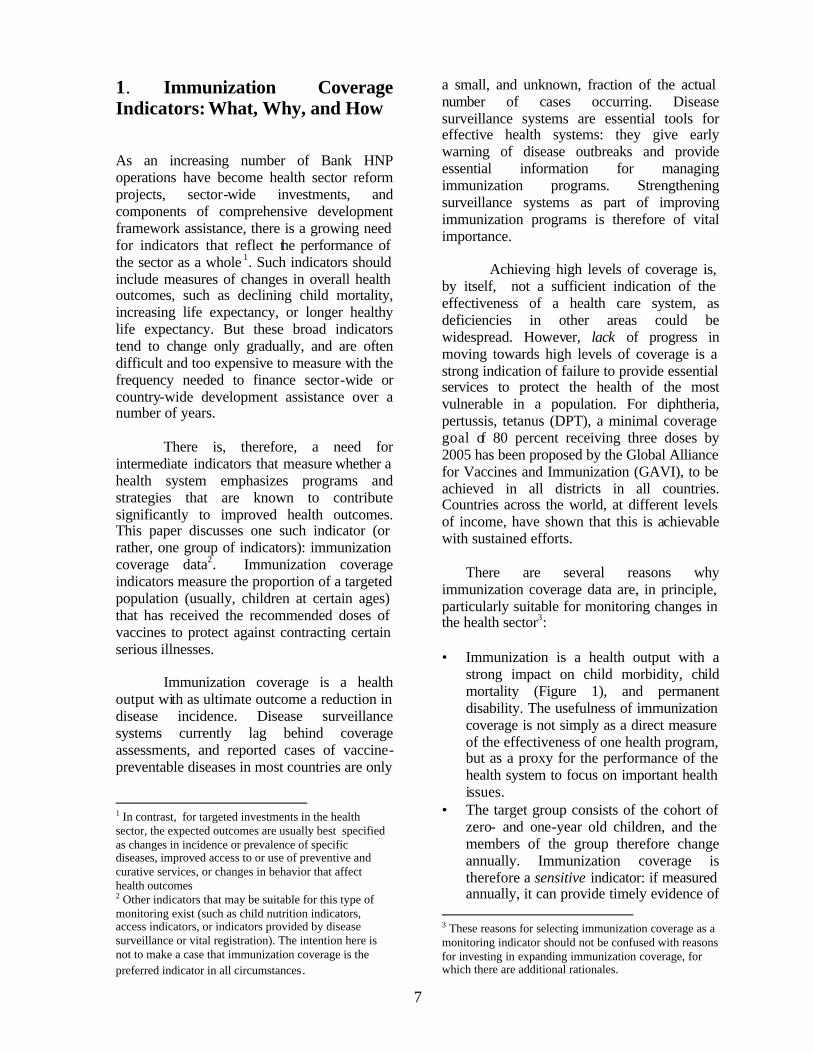
1. Immunization Coverage Indicators: What, Why, and How As an increasing number of Bank HNP operations have become health sector reform projects, sector-wide investments, and components of comprehensive development framework assistance, there is a growing need for indicators that reflect the performance of the sector as a whole 1. Such indicators should include measures of changes in overall health outcomes, such as declining child mortality, increasing life expectancy, or longer healthy life expectancy. But these broad indicators tend to change only gradually, and are often difficult and too expensive to measure with the frequency needed to finance sector-wide or country-wide development assistance over a number of years.
There is, therefore, a need for intermediate indicators that measure whether a health system emphasizes programs and strategies that are known to contribute significantly to improved health outcomes. This paper discusses one such indicator (or rather, one group of indicators): immunization coverage data2. Immunization coverage indicators measure the proportion of a targeted population (usually, children at certain ages) that has received the recommended doses of vaccines to protect against contracting certain serious illnesses.
Immunization coverage is a health output with as ultimate outcome a reduction in disease incidence. Disease surveillance systems currently lag behind coverage assessments, and reported cases of vaccine-preventable diseases in most countries are only
1 In contrast, for targeted investments in the health sector, the expected outcomes are usually best specified as changes in incidence or prevalence of specific diseases, improved access to or use of preventive and curative services, or changes in behavior that affect health outcomes 2 Other indicators that may be suitable for this type of monitoring exist (such as child nutrition indicators, access indicators, or indicators provided by disease surveillance or vital registration). The intention here is not to make a case that immunization coverage is the preferred indicator in all circumstances.
a small, and unknown, fraction of the actual number of cases occurring. Disease surveillance systems are essential tools for effective health systems: they give early warning of disease outbreaks and provide essential information for managing immunization programs. Strengthening surveillance systems as part of improving immunization programs is therefore of vital importance.
Achieving high levels of coverage is, by itself, not a sufficient indication of the effectiveness of a health care system, as deficiencies in other areas could be widespread. However, lack of progress in moving towards high levels of coverage is a strong indication of failure to provide essential services to protect the health of the most vulnerable in a population. For diphtheria, pertussis, tetanus (DPT), a minimal coverage goal of 80 percent receiving three doses by 2005 has been proposed by the Global Alliance for Vaccines and Immunization (GAVI), to be achieved in all districts in all countries. Countries across the world, at different levels of income, have shown that this is achievable with sustained efforts.
There are several reasons why immunization coverage data are, in principle, particularly suitable for monitoring changes in the health sector3: • Immunization is a health output with a
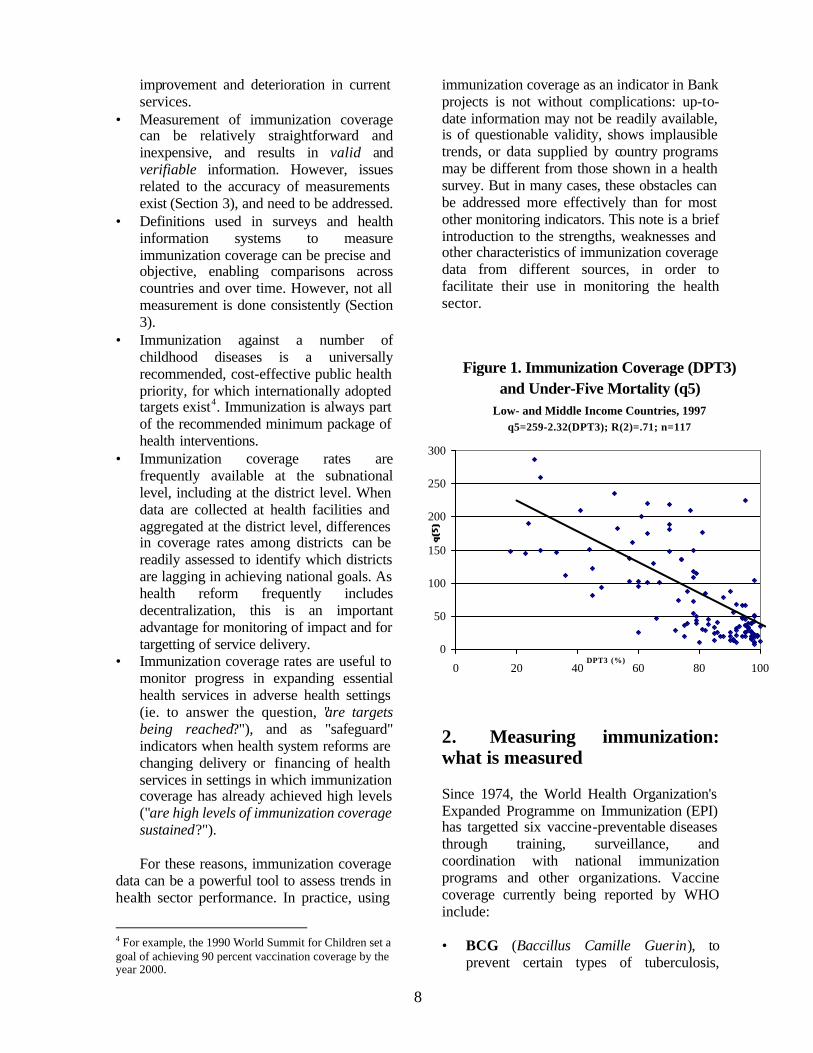
strong impact on child morbidity, child mortality (Figure 1), and permanent disability. The usefulness of immunization coverage is not simply as a direct measure of the effectiveness of one health program, but as a proxy for the performance of the health system to focus on important health issues.
• The target group consists of the cohort of zero- and one-year old children, and the members of the group therefore change annually. Immunization coverage is therefore a sensitive indicator: if measured annually, it can provide timely evidence of
3 These reasons for selecting immunization coverage as a monitoring indicator should not be confused with reasons for investing in expanding immunization coverage, for which there are additional rationales.
8
improvement and deterioration in current services.
• Measurement of immunization coverage can be relatively straightforward and inexpensive, and results in valid and verifiable information. However, issues related to the accuracy of measurements exist (Section 3), and need to be addressed.
• Definitions used in surveys and health information systems to measure immunization coverage can be precise and objective, enabling comparisons across countries and over time. However, not all measurement is done consistently (Section 3).
• Immunization against a number of childhood diseases is a universally recommended, cost-effective public health priority, for which internationally adopted targets exist4. Immunization is always part of the recommended minimum package of health interventions.
• Immunization coverage rates are frequently available at the subnational level, including at the district level. When data are collected at health facilities and aggregated at the district level, differences in coverage rates among districts can be readily assessed to identify which districts are lagging in achieving national goals. As health reform frequently includes decentralization, this is an important advantage for monitoring of impact and for targetting of service delivery.
• Immunization coverage rates are useful to monitor progress in expanding essential health services in adverse health settings (ie. to answer the question, "are targets being reached?"), and as "safeguard" indicators when health system reforms are changing delivery or financing of health services in settings in which immunization coverage has already achieved high levels ("are high levels of immunization coverage sustained?"). For these reasons, immunization coverage
data can be a powerful tool to assess trends in health sector performance. In practice, using
4 For example, the 1990 World Summit for Children set a goal of achieving 90 percent vaccination coverage by the year 2000.
immunization coverage as an indicator in Bank projects is not without complications: up-to-date information may not be readily available, is of questionable validity, shows implausible trends, or data supplied by country programs may be different from those shown in a health survey. But in many cases, these obstacles can be addressed more effectively than for most other monitoring indicators. This note is a brief introduction to the strengths, weaknesses and other characteristics of immunization coverage data from different sources, in order to facilitate their use in monitoring the health sector.
2. Measuring immunization: what is measured Since 1974, the World Health Organization's Expanded Programme on Immunization (EPI) has targetted six vaccine-preventable diseases through training, surveillance, and coordination with national immunization programs and other organizations. Vaccine coverage currently being reported by WHO include: • BCG (Baccillus Camille Guerin), to
prevent certain types of tuberculosis,
Figure 1. Immunization Coverage (DPT3) and Under-Five Mortality (q5)
Low- and Middle Income Countries, 1997q5=259-2.32(DPT3); R(2)=.71; n=117
0
50
100
150
200
250
300
0 20 40 60 80 100DPT3 (%)

9
mainly during the first year of life, administered soon after a child's birth;
• OPV (Oral Polio Vaccine): three doses to protect against poliomyelitis, given during the first year of life. Volunteers, rather than trained health workers can administer oral polio vaccine, as it does not require injection equipment. Some countries also use a killed, inactivated polio vaccine that needs to be injected.
• DPT: usually three doses of a combined vaccine that protects against diphtheria, pertussis, and tetanus, given during the first year of life.
• Measles: a single dose of measles vaccine given during the first year of life, usually at 9 months (but at 12-15 months in industrialized countries).
• Yellow Fever (in endemic countries): during the first year of life for children over 6 months of age in the endemic countries of tropical and subtropical Africa and South America, often administered at the same time as measles immunization.
• Hepatitis B: usually three doses of a vaccine to prevent hepatitis B, recommended as part of routine infant immunization schedule, given at same time as DPT. A combined DPT-Hepatitis B vaccine also exists.
• Hib: usually three doses of haemophilus influenzae type b vaccine to protect against meningitis and Hib pneumonia administered as part of DPT immunization. This can also be delivered as a combined DPT-Hepatitis B-Hib vaccine.
• TT (Tetanus Toxoid): a vaccine administered to pregnant women or women of childbearing age, consisting of at least two doses (with five providing life- long protection), to prevent neonatal tetanus.
Of these eight vaccines, information on coverage is readily available for most countries for most years since 1980 from country immunization programs for BCG, OPV3, DPT-3, and measles. TT coverage data are available for about one-half of low-and middle income countries, whereas yellow fever coverage (where recommended) and hepatitis B coverage estimates are available in less than 20 percent of countries. Coverage of Hib, the
vaccine most recently added to the schedule, is very low in almost all low-and middle income countries. The following table shows the number of countries, territories, or other economies for which WHO has reported coverage data for at least five years during the period 1990 to 1998: Vaccine
Number of countries for which data are available for five or more years during 1990-98 (n=215)
Hepatitis B 39 TT 90 BCG 160 Measles 190 OPV 190 DPT 191 Incidence of the diseases prevented by these vaccines varies across countries, and the use of coverage measures should take these differences into account. Polio eradication is in its final stages, with many countries now being free of polio. Different strategies are used in administering polio, including mass campaigns to reach children 0-4 years old, irrespective of immunization history. Therefore, as an indicator of routine service delivery effectiveness, OPV3 coverage rates are less suitable. Measles has virtually disappeared from the Americas and periodic mass campaigns targetting young children irrespective of immunization history have become an important strategy. But in Africa and Asia, where measles remains an important cause of child mortality, monitoring coverage levels is still essential. BCG monitoring is less frequently used because the vaccine is delivered once, often by midwives and other birth attendants, rather than by immunization programs. Yellow fever is endemic only in many countries in equatorial Africa and in some countries in South America. Hib and Hepatitis B are too new and not in use in many countries. For these reasons, DPT3 coverage rates are the most frequently used to monitor immunization coverage levels and trends. The WHO recommended schedule is to administer

10
the vaccine at three different times during the first year of life (often at around 6, 10 and 14 weeks, but this varies from country to country). The developing countries in Africa, South Asia, and East Asia and the Pacific observe this schedule. A four-dose schedule, with a booster dose administered in the second or third year of life is typical in European countries, while a five-dose schedule (two booster doses) is typical in the Latin American region. The existence of schedules allows the construction of more refined monitoring indicators: in addition to coverage with one, two, or three doses of DPT, coverage by age can be monitored to assess age appropriate coverage. The multiple dose standard also enables calculation of dropout rates, which indicate what proportion of children receive 1 but not 2, or 2 but not 3 doses of the vaccine. Dropout rates can be used as indicators of a health system's ability to deliver services requiring multiple visits. 3. Sources of immunization data Three main instruments exist for assessing immunization coverage in low- and middle-income countries: nationally generated program statistics, specialized immunization coverage surveys, and more general household surveys that include other health or demographic topics. Program statistics, (or "routine reports" or "administrative coverage") are based on data collected by health facilities and other providers of the number of children immunized with specific vaccines. The data are usually aggregated at the district level, thus providing detailed geographical information. National level estimates may be aggregated in sophisticated electronic health information systems or immunization registries, or more
commonly, aggregated from district and regionally tabulated information. Immunization coverage surveys, in many cases EPI cluster surveys, use a simplified sampling design for relatively rapid and inexpensive collection of coverage. The EPI cluster surveys are particularly suitable for monitoring coverage in subnational areas, although alternative sampling strategies may be used to obtain nationally representative estimates. EPI cluster surveys, which have been carried out in many low- and middle-income countries, can be used to validate program statistics at the regional level. For validating immunization coverage at individual health service units, the Lot Quality Coverage Survey approach is sometimes used. Household surveys, such as USAID's Demographic and Health Surveys (DHS), the Arab League's PAPCHILD, CDC's Reproductive Health Surveys, or UNICEF's Multiple Indicator Surveys (MICS), include immunization modules in their questionnaires, among a number of other modules. These surveys may use more complex stratified sampling designs, as in the case of the DHS, or use basic cluster survey methodology, as in the case of MICS. They provide information on a number of indicators, and are therefore particularly suitable for further analyses of variables affecting immunization coverage. 4. Potential errors in immunization coverage data Program statistics have a number of weaknesses that may result in invalid or unreliable estimates of immunization coverage. These weaknesses concern both the numerator and the denominator:

• Program statistics rely on accurate records of the number of children immunized by health personnel (the numerator). At the facility and district level, pressures to achieve targets may result in an upward bias in the reporting, or a lack of interest in record keeping and reporting may lead to underestimates of coverage. At the central level, aggregation of distorted district or regional estimates compounds the errors. At times, the number of doses distributed may be counted as the number of doses administered, ignoring wastage that inevitably occurs, and leading to an overestimate of coverage.
• In order to calculate coverage rates, program statistics need not only keep track of the number of children that have been immunized, but also need to estimate the size of the target population (the denominator: the cohort of zero and one year olds). Complete vital registration - the most reliable source for such data - does not exist in the majority of the low- and middle-income countries. Estimates of the denominators of the target population of 0 and 1 year olds are therefore based on counts or estimates by local health workers, or on projections from the latest census data, which introduces considerable uncertainty. Projections are usually made with cohort-component methods for which estimates of fertility rates and mortality rates are required. Census estimates of the number of women of reproductive age are then multiplied by the age-specific fertility rates to obtain the number of births. Estimates of infant mortality are used to reduce the number of births to obtain an estimate of the surviving number of zero-year olds.
Given the uncertainty regarding the various parameters used to estimate the 0-1 cohort, it is not surprising that the denominator problem is a major obstacle to obtaining accurate national immunization coverage rates from program statistics. As an example of the potential size of the error, Figure 2 shows two projections of the number of surviving zero year olds for Yemen. The top line (triangles) shows the
projection of 0-1 year olds used by WHO5, which is based on a fertility rate of 7.6 children. A 1997 Demographic and Health Survey (DHS) found that fertility had declined to 6.5 children, resulting in a lower projection of 0-1 year olds (squares line). Applying these different denominators to the number of children immunized against measles shows considerably lower coverage rates with the larger denominators (bars). While this is an extreme example, there is some uncertainty regarding the denominators in all countries.
At the district level, estimates of the denominator may also be affected by migration. As a result of net in-migration, districts report routine coverage of greater than 100 percent of the assumed target population. A special case is China, where the denominator excludes children intentionally not registered, and where some immunization providers have reported administering 25 percent more vaccines than would be expected on the basis of registration.
Given the difficulties in providing
accurate denominators, GAVI has proposed using information on changes in only the
5 Immunization Profile: Yemen (WHO Vaccine Surveillance webpage). The population and vital rates estimates are from the UN Population Division, World Population Prospects, The 1998 Revision.
Figure 2. The Denominator ProblemYemen, Measles Coverage with Different
Denominators
40
45
50
55
60
65
70
75
80
1995 1996 1997 1998 1999 2000500
550
600
650
700
750
800
Coverage, TFR=7.6 Coverage, TFR=6.4
0-1 pop., TFR=7.6 0-1 pop., TFR=6.4
12
number of children immunized (the numerator) as a way to measure program activity. This approach is particularly useful as a management tool to measure program effort.
The numerator does not affect survey-
based estimates of immunization coverage and denominator issues described for program statistics, but suffer from a number of other weaknesses:
• EPI Cluster surveys are not suitable as
large national surveys; DHS type-surveys do not provide estimates for smaller areas.
• A representative sample of households needs to be drawn to produce representative estimates at the desired level of aggregation (national, regional, provincial, etc.). A recent population census and statistical capacity are therefore necessary - but frequently not available.
• Every survey estimate is subject to sampling errors, resulting from the fact that many samples drawn from the same population would have produced slightly different estimates. The sampling errors are used to construct confidence intervals, usually at the 95 percent level (or plus or minus two standard errors) to indicate a high probability that the true population estimate of coverage is within these intervals. Standard errors tend to become larger at the subnational level, making it more difficult to compare different regions or to measure change over time. DHS findings for national level immunization coverage have standard errors ranging from 1 to 5 percent, indicating a 95 percent confidence interval around the estimate of
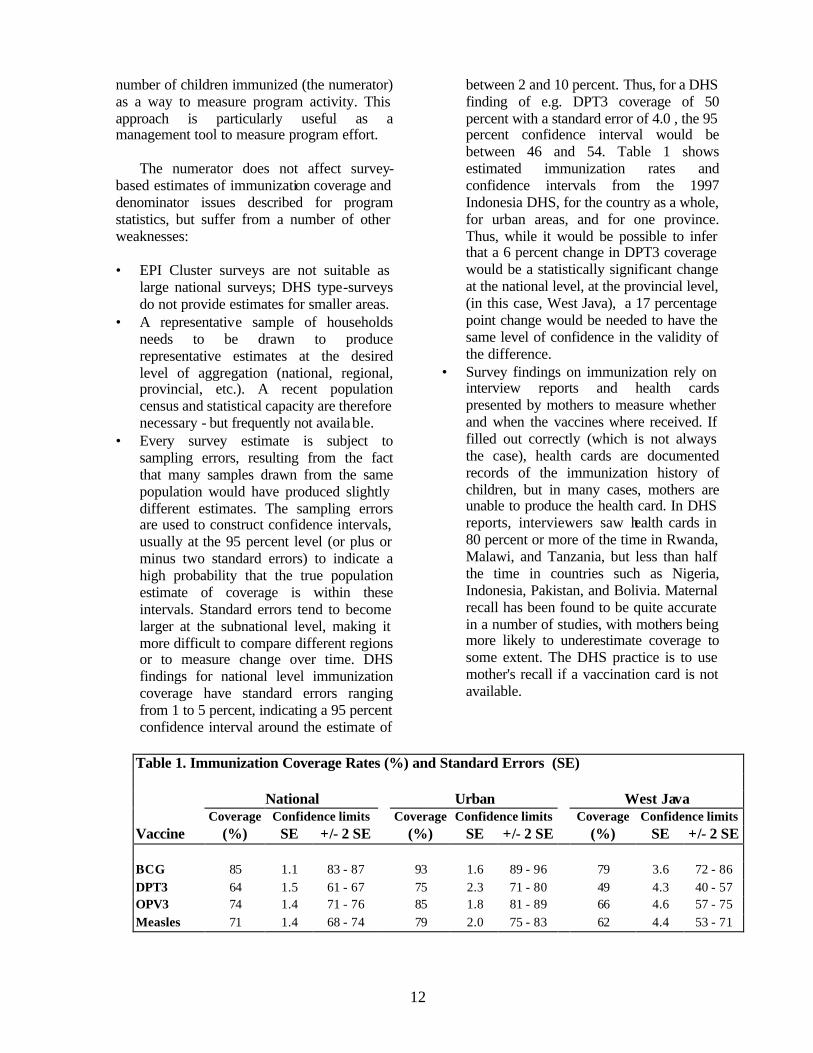
between 2 and 10 percent. Thus, for a DHS finding of e.g. DPT3 coverage of 50 percent with a standard error of 4.0 , the 95 percent confidence interval would be between 46 and 54. Table 1 shows estimated immunization rates and confidence intervals from the 1997 Indonesia DHS, for the country as a whole, for urban areas, and for one province. Thus, while it would be possible to infer that a 6 percent change in DPT3 coverage would be a statistically significant change at the national level, at the provincial level, (in this case, West Java), a 17 percentage point change would be needed to have the same level of confidence in the validity of the difference.
• Survey findings on immunization rely on interview reports and health cards presented by mothers to measure whether and when the vaccines where received. If filled out correctly (which is not always the case), health cards are documented records of the immunization history of children, but in many cases, mothers are unable to produce the health card. In DHS reports, interviewers saw health cards in 80 percent or more of the time in Rwanda, Malawi, and Tanzania, but less than half the time in countries such as Nigeria, Indonesia, Pakistan, and Bolivia. Maternal recall has been found to be quite accurate in a number of studies, with mothers being more likely to underestimate coverage to some extent. The DHS practice is to use mother's recall if a vaccination card is not available.
Table 1. Immunization Coverage Rates (%) and Standard Errors (SE)
National Urban West Java Coverage Confidence limits Coverage Confidence limits Coverage Confidence limits Vaccine (%) SE +/- 2 SE (%) SE +/- 2 SE (%) SE +/- 2 SE
BCG 85 1.1 83 - 87 93 1.6 89 - 96 79 3.6 72 - 86 DPT3 64 1.5 61 - 67 75 2.3 71 - 80 49 4.3 40 - 57 OPV3 74 1.4 71 - 76 85 1.8 81 - 89 66 4.6 57 - 75 Measles 71 1.4 68 - 74 79 2.0 75 - 83 62 4.4 53 - 71
• The timing of the survey may affect coverage rates if national immunization days for polio immunization or large-scale campaigns for measles immunization occur just before or during the period the survey is being conducted in the field, or just after the survey has been completed. In the first case, the coverage rates may be biased upwards, especially if efforts are not sustained. If a la rge immunization campaign is conducted right after the completion of a survey, the survey estimates are of little use. For example, in two rounds of polio immunization days in Yemen in October and November of 1999, 3.7 and 3.9 million children under age 5 were said to have been immunized, covering more than 90 percent of all children under age 5 (WHO Vaccine News). A DHS survey conducted in 1997 found immunization coverage rates of below 50 percent for OPV3. Using DPT3 coverage rates avoids this potential issue.
• Survey-based coverage estimates are at times ambiguous about the age group included in the sample. Surveys may include the entire age group between 12 and 23 months, irrespective of when the vaccine was received, or may use only reported immunizations received before reaching age 1. Including all children aged 12 to 23 months means including some who have received immunizations after the recommended age, but limiting the sample to those who received the immunizations according to schedule before age 1 requires accurate reporting by mothers, if a health card is not available. The average differences in coverage rates for age-appropriate immunization and immunization status at age 1 are smallest for BCG (usually administered soon after birth), at 5 percentage points, and largest for measles (usually administered at 9 months), at 9 percentage points difference (Annex Tables 2a and 2b).
Table 2 shows a comparison of recent DHS findings with routine reports of immunization coverage rates for two different vaccines. The difference between the two sources is relatively small, as measured by the unweighted average of the countries. However,
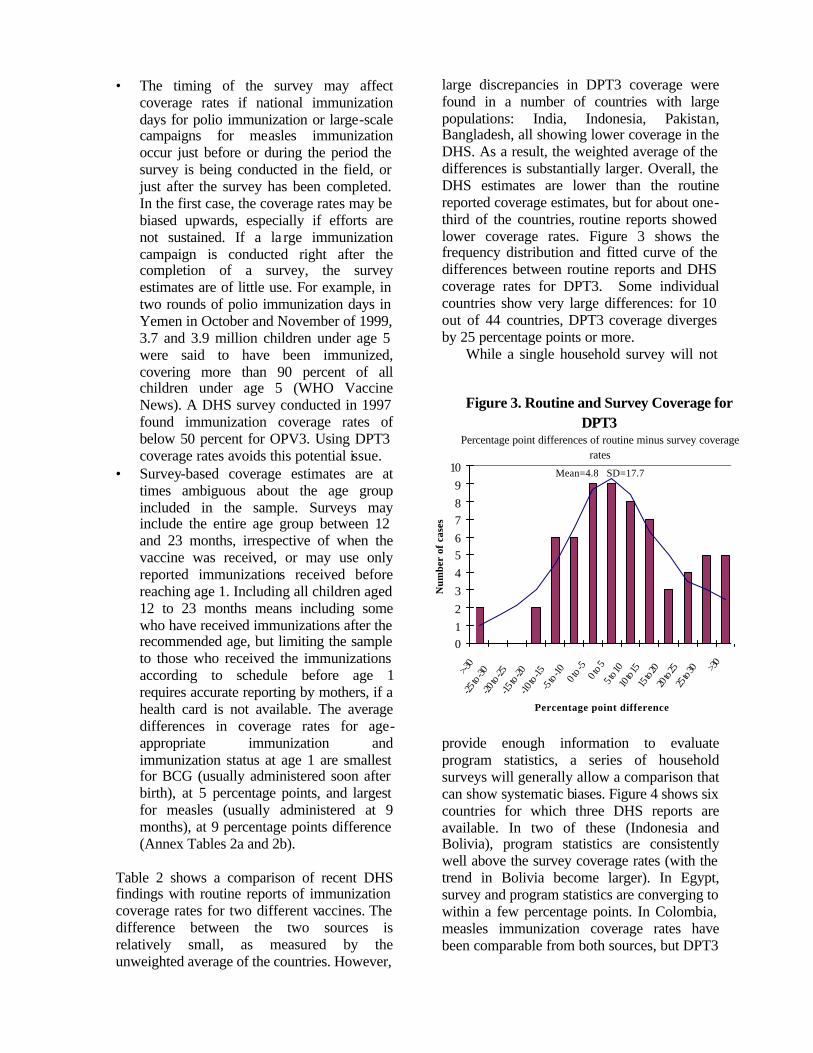
large discrepancies in DPT3 coverage were found in a number of countries with large populations: India, Indonesia, Pakistan, Bangladesh, all showing lower coverage in the DHS. As a result, the weighted average of the differences is substantially larger. Overall, the DHS estimates are lower than the routine reported coverage estimates, but for about one-third of the countries, routine reports showed lower coverage rates. Figure 3 shows the frequency distribution and fitted curve of the differences between routine reports and DHS coverage rates for DPT3. Some individual countries show very large differences: for 10 out of 44 countries, DPT3 coverage diverges by 25 percentage points or more.
While a single household survey will not
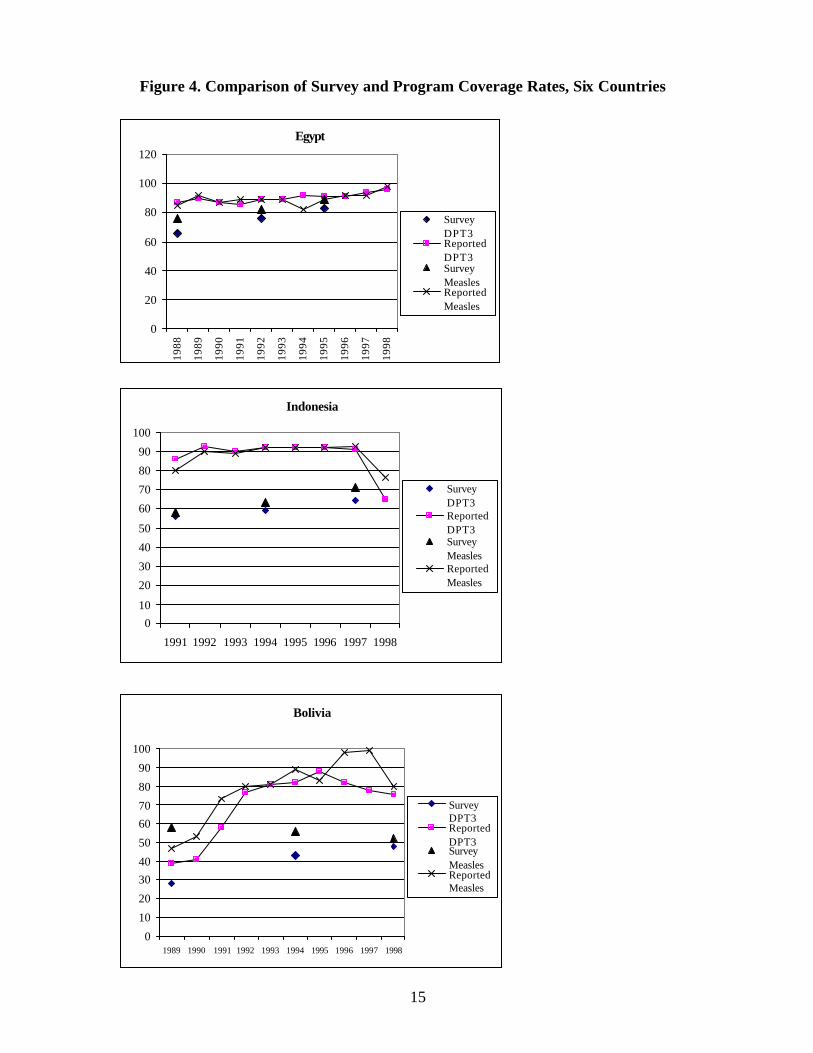
provide enough information to evaluate program statistics, a series of household surveys will generally allow a comparison that can show systematic biases. Figure 4 shows six countries for which three DHS reports are available. In two of these (Indonesia and Bolivia), program statistics are consistently well above the survey coverage rates (with the trend in Bolivia become larger). In Egypt, survey and program statistics are converging to within a few percentage points. In Colombia, measles immunization coverage rates have been comparable from both sources, but DPT3
Figure 3. Routine and Survey Coverage for DPT3
Percentage point differences of routine minus survey coverage rates
Mean=4.8 SD=17.7
0123456789
10>-3
0-25
to -3
0-20
to -2
5-15
to -2
0-10
to -1
5 -5
to -1
00 t
o -5
0 to 5
5 to 1
010
to 15
15 to
2020
to 25
25 to
30 >30
Percentage point difference
Num
ber
of c
ases

Table 2. Survey and Program Coverage Rates, DPT3 and Measles
Country Survey DPT3 Measles
Year Survey Reported Difference Survey Reported Difference
Bangladesh 1993/94 66 92 -26 69 91 -22 Benin 1996 67 80 -13 64 74 -10 Bolivia (*) 1998 49 82 -33 51 98 -47 Brazil 1996 81 75 6 87 80 7 Burkina Faso 1992/93 41 43 -2 60 42 18 Cameroon (*) 1998 51 44 7 54 43 11 Chad 1996/97 20 22 -2 23 31 -8 Colombia 1995 77 89 -12 84 95 -11 Comoros 1996 68 60 8 63 43 20 Dominican Rep. 1996 58 83 -25 78 81 -3 Egypt 1995 83 91 -8 89 89 0 Eritrea 1995 49 35 14 51 29 22 Ghana 1993 62 48 14 64 50 14 Guatemala 1995 59 80 -21 75 83 -8 Haiti 1994/95 41 32 9 48 28 20 India 1992/93 52 92 -40 42 88 -46 Indonesia 1997 64 91 -27 71 92 -21 Jordan 1997 96 93 3 90 95 -5 Kazakhstan 1995 51 91 -40 72 97 -25 Kenya (*) 1998 79 36 43 79 32 47 Kyrgyz Rep. 1997 95 98 -3 85 98 -13 Madagascar 1997 48 73 -25 46 68 -22 Malawi 1993 89 91 -2 86 87 -1 Morocco 1995 90 90 0 89 88 1 Mozambique 1997 58 61 -3 55 70 -15 Namibia 1992 70 82 -12 76 71 5 Nicaragua (*) 1998 80 94 -14 86 94 -8 Niger (*) 1998 25 28 -3 35 42 -7 Nigeria 1990 33 56 -23 46 48 -2 Pakistan 1990/91 43 82 -39 50 77 -27 Pap. New Guinea 1996 47 55 -8 76 44 32 Paraguay 1990 53 79 -26 58 70 -12 Peru 1996 77 99 -22 86 87 -1 Philippines (*) 1998 81 83 -2 79 83 -4 Rwanda 1992 91 85 6 90 81 9 Senegal 1992/93 59 48 11 57 45 12 Sudan 1989/90 59 51 8 61 46 15 Tanzania 1996 85 70 15 81 75 6 Turkey 1993 78 76 2 78 72 6 Uganda 1995 61 79 -18 60 79 -19 Uzbekistan 1996 96 96 0 92 61 31 Yemen 1997 40 57 -17 43 51 -8 Zambia 1996 86 83 3 87 93 -6 Zimbabwe 1994 85 80 5 86 79 7
Country (unweighted) Average
65 72 -7 68 70 -2
*: reported rate is for 1997
15
Figure 4. Comparison of Survey and Program Coverage Rates, Six Countries
Egypt
0
20
40
60
80
100
120
1988
1989
1990
1991
1992
1993
1994
1995
1996
1997
1998
Survey DPT3ReportedDPT3SurveyMeaslesReportedMeasles
Indonesia
010
20
30
40
50
60
70
80
90
100
1991 1992 1993 1994 1995 1996 1997 1998
Survey DPT3ReportedDPT3SurveyMeaslesReportedMeasles
Bolivia
0
10
20
30
40
50
60
70
80
90
100
1989 1990 1991 1992 1993 1994 1995 1996 1997 1998
Survey DPT3ReportedDPT3SurveyMeaslesReportedMeasles

16
Kenya
0
1020
30
405060
70
8090
100
1989 1990 1991 1992 1993 1994 1995 1996 1997 1998
Survey DPT3ReportedDPT3SurveyMeaslesReportedMeasles
Peru
0102030405060708090
100
Survey DPT3ReportedDPT3SurveyMeaslesReportedMeasles
Colombia
0
10
20
30
40
50
60
70
80
90
100
1986 1988 1990 1992 1994 1996 1998
Survey DPT3
ReportedDPT3
SurveyMeasles
ReportedMeasles
17
Table 3. Average Immunization Coverage, 1980-97 Averages of Low and Middle Income Countries BCG DPT-3 Measles Polio-3 Percent Change Percent Change Percent Change Percent Change
1980 51.5 3.2 39.5 3.1 36.7 2.8 43.3 -0.1 1981 54.7 1.4 42.6 3.1 39.5 -1.2 43.3 5.9 1982 56.0 6.9 45.7 2.7 38.3 6.2 49.1 3.7 1983 63.0 -0.9 48.4 3.1 44.5 2.5 52.9 1.5 1984 62.1 3.2 51.6 4.3 47.0 6.0 54.3 3.7 1985 65.2 2.7 55.8 2.2 53.1 2.2 58.0 2.8 1986 67.9 6.8 58.0 5.2 55.2 5.1 60.8 3.2 1987 74.7 0.9 63.2 2.2 60.3 3.6 64.1 3.0 1988 75.6 4.1 65.4 4.8 64.0 4.2 67.1 4.4 1989 79.7 4.3 70.2 6.7 68.1 7.6 71.4 7.2 1990 84.0 -2.1 76.9 -0.8 75.7 -0.8 78.6 -1.1 1991 81.8 1.0 76.1 0.0 74.9 -0.4 77.5 -0.2 1992 82.8 -0.7 76.1 -1.2 74.5 0.8 77.3 -0.7 1993 82.1 1.9 74.8 2.4 75.2 1.5 76.6 1.4 1994 83.9 2.5 77.2 2.7 76.8 2.4 78.0 2.5 1995 86.5 0.7 79.9 0.3 79.2 0.4 80.5 -0.1 1996 87.2 -1.2 80.2 0.0 79.5 0.8 80.4 0.3 1997 85.9 80.3 80.3 80.7
Table 4. Average Annual Improvements in Coverage
by Level (%), All Low- and Middle Income Countries
BCG DPT-3 Measles Polio-3 Predicted Predicted Predicted Predicted
Level Improv. Level Improv. Level Improv. Level Improv. 40 5.3 40 4.2 40 3.8 40 4.1 50 4.3 50 3.4 50 3.2 50 3.4 60 3.3 60 2.7 60 2.6 60 2.6 70 2.3 70 1.9 70 2.0 70 1.9 80 1.3 80 1.2 80 1.5 80 1.1 90 0.3 90 0.4 90 0.9 90 0.3
Table 5. Average Annual Improvements in Coverage
by Level (%), Low and Middle Income Countries with >80% Coverage by 1997
BCG DPT-3 Measles Polio-3
Predicted Predicted Predicted Predicted Level Improv. Level Improv. Level Improv. Level Improv.
40 5.5 40 5.6 40 4.6 40 5.0 50 4.6 50 4.7 50 4.0 50 4.3 60 3.8 60 3.8 60 3.5 60 3.7 70 3.1 70 2.9 70 3.0 70 3.0 80 2.3 80 2.0 80 2.5 80 2.4 90 1.5 90 1.1 90 1.9 90 1.7

18
is much higher in program statistics. In Peru, program statistics have moved over time from below survey findings to higher levels. Kenya shows a case where program statistics have been consistently well below the rates in three surveys.
Figure 4 also indicate that routine reports
show greater annual variation (for example, Kenya, where coverage rates dropped in 1997, but recovered in 1998). Whether such patterns reflect real changes in coverage, or are the result of data collection problems, must be investigated with country-specific information. If such trends are correct, they indicate the advantage of annually reported statistics over a periodically conducted survey for monitoring trends over time.
A comparison of immunization coverage
rates from program statistics with those measured in household surveys provides the basis for investigating the reliability of immunization coverage data. The following issues must be considered: • How large are the standard errors for the
immunization coverage estimates from the survey - is the estimate reported by the program within the 95 percent confidence interval?
• During which months was the survey conducted, and how does this compare with the time frame of the estimates reported by the program? Did any large-scale campaign or national immunization day take place before or after the survey, and how is this reflected in either dataset?
• Are consistent age definitions used to count those immunized (ie, in surveys: immunized before age 12 months, or at any time before the survey for children age 12-23 months)?
• How were the denominators estimated in calculating coverage rates for program statistics, and how much uncertainty is there in the assumptions used?
Routine data collection and surveys are not
mutually exclusive ways of assessing immunization coverage, and combining both instruments would in many cases provide the best way to evaluate coverage rates collected
by immunization programs. Large DHS type surveys are expensive and do not provide the subnational information that is needed. For subnational areas, EPI Cluster Surveys are often the preferred way to obtain rapid and inexpensive estimates of coverage. For evaluating the completeness of routine data in even smaller units, such as health services in one community, so-called Lot Quality Coverage Survey (LQCS) can be used. These surveys use estimates of immunization coverage from cluster surveys or routine data collection, and evaluate whether a group of children (a "lot") passes a certain minimum coverage threshold. Findings from these surveys would assist in identifying areas that contribute to biased national coverage areas. The availability of multiple data sources can lead to better estimates of coverage.
5. Using immunization coverage data: setting targets Monitoring trends in immunization coverage can be done to evaluate past and current health systems performance. To evaluate future performance, immunization coverage rates can be set as targets or "milestones" to be achieved in future years. Such targets, when set realistically and agreed to by those implementing the activities, can serve to provide direction for a program and can help motivate staff. While target setting needs to be done in specific country contexts, the experience of other countries at similar levels of coverage can provide guidance on targets that can reasonably be achieved.
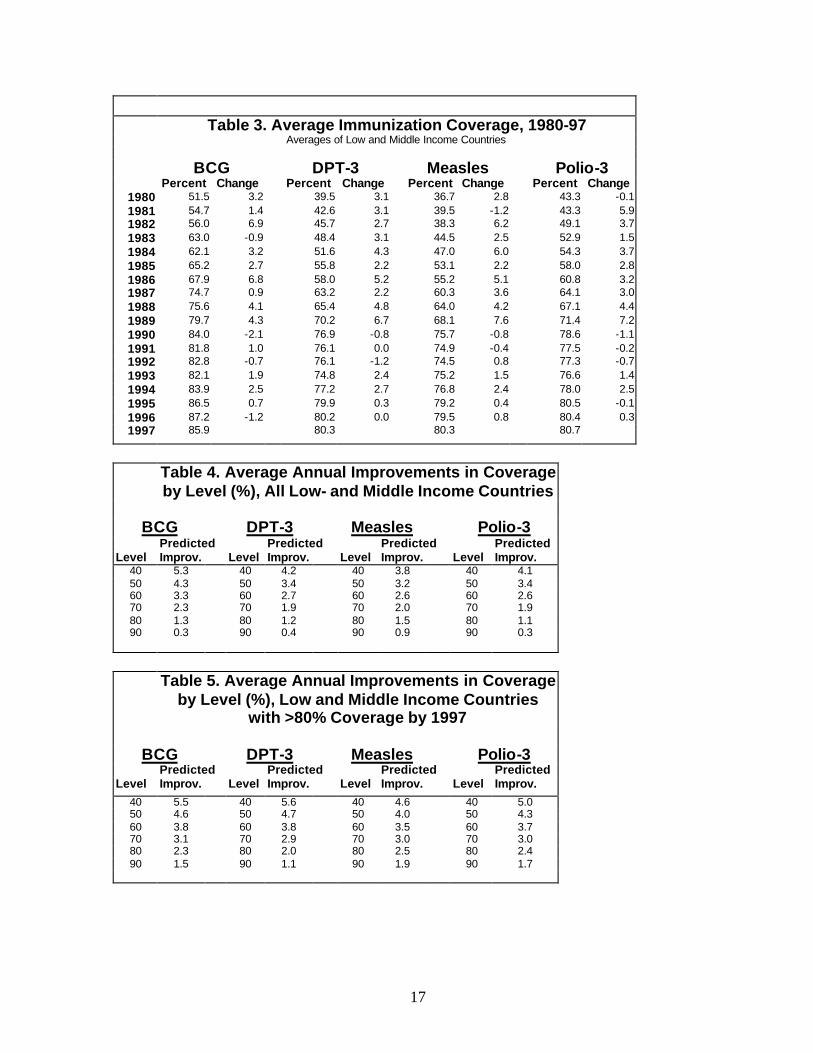
Average levels of immunization coverage in low-and middle-income countries increased steadily during the 1980s, then stagnated in the early 1990s, and were sustained at about 80% (Table 3)6, in part
6 The averages are based on the data reported by country programs, as shown in Annex 1. While some of the country data are likely to be overestimates of true coverage, changes in coverage rates would not necessarily be biased upwards. The figures presented here are unweighted averages of immunization coverage for low-and middle income countries and territories, rather than for the low-and middle income aggregate as a whole.
19
because marginal increases are harde r to achieve at higher levels of coverage. Average annual improvements by level of immunization coverage are shown in Table 4. These predicted improvements are based on regressions using the entire sample of low- and middle-income countries with coverage data, and therefore also include countries that have experienced declines in coverage, as well as countries that made rapid progress. If only countries which have achieved 80 percent
coverage or higher in 1997, the predicted annual improvement by level of coverage are substantially higher (Table 5).
To the extent that the future will resemble the recent past, predicted levels of improvements provide some guidance for making reasonable assumptions for future improvements. But levels in immunization coverage frequently vary a great deal from year to year in a given country. Unlike indicators such as child mortality that respondo a number of determinants and change slowly, immunization coverage is much more subject to inputs and efforts within the health system. As country resources and needs differ, setting targets should always take country circumstances into account.
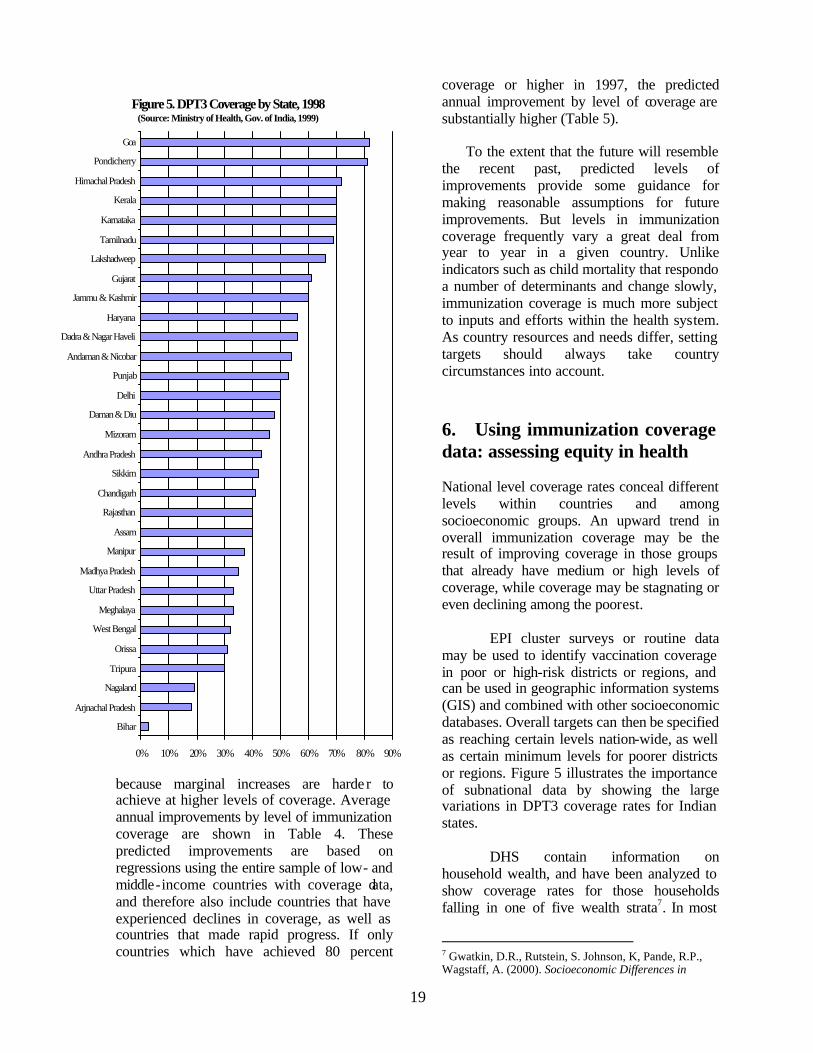
6. Using immunization coverage data: assessing equity in health National level coverage rates conceal different levels within countries and among socioeconomic groups. An upward trend in overall immunization coverage may be the result of improving coverage in those groups that already have medium or high levels of coverage, while coverage may be stagnating or even declining among the poorest. EPI cluster surveys or routine data may be used to identify vaccination coverage in poor or high-risk districts or regions, and can be used in geographic information systems (GIS) and combined with other socioeconomic databases. Overall targets can then be specified as reaching certain levels nation-wide, as well as certain minimum levels for poorer districts or regions. Figure 5 illustrates the importance of subnational data by showing the large variations in DPT3 coverage rates for Indian states. DHS contain information on household wealth, and have been analyzed to show coverage rates for those households falling in one of five wealth strata7. In most
7 Gwatkin, D.R., Rutstein, S. Johnson, K, Pande, R.P., Wagstaff, A. (2000). Socioeconomic Differences in
Figure 5. DPT3 Coverage by State, 1998(Source: Ministry of Health, Gov. of India, 1999)
0% 10% 20% 30% 40% 50% 60% 70% 80% 90%
Bihar
Arjnachal Pradesh
Nagaland
Tripura
Orissa
West Bengal
Meghalaya
Uttar Pradesh
Madhya Pradesh
Manipur
Assam
Rajasthan
Chandigarh
Sikkim
Andhra Pradesh
Mizoram
Daman & Diu
Delhi
Punjab
Andaman & Nicobar
Dadra & Nagar Haveli
Haryana
Jammu & Kashmir
Gujarat
Lakshadweep
Tamilnadu
Karnataka
Kerala
Himachal Pradesh
Pondicherry
Goa
20
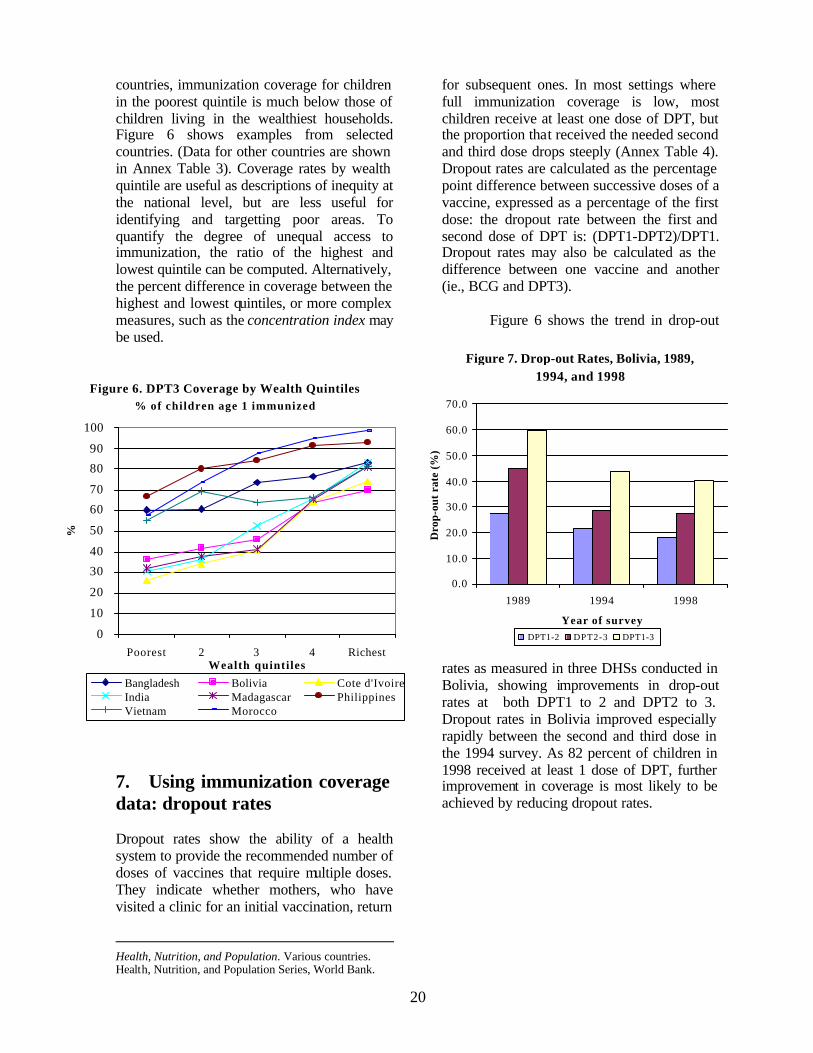
countries, immunization coverage for children in the poorest quintile is much below those of children living in the wealthiest households. Figure 6 shows examples from selected countries. (Data for other countries are shown in Annex Table 3). Coverage rates by wealth quintile are useful as descriptions of inequity at the national level, but are less useful for identifying and targetting poor areas. To quantify the degree of unequal access to immunization, the ratio of the highest and lowest quintile can be computed. Alternatively, the percent difference in coverage between the highest and lowest quintiles, or more complex measures, such as the concentration index may be used.
7. Using immunization coverage data: dropout rates Dropout rates show the ability of a health system to provide the recommended number of doses of vaccines that require multiple doses. They indicate whether mothers, who have visited a clinic for an initial vaccination, return
Health, Nutrition, and Population. Various countries. Health, Nutrition, and Population Series, World Bank.
for subsequent ones. In most settings where full immunization coverage is low, most children receive at least one dose of DPT, but the proportion that received the needed second and third dose drops steeply (Annex Table 4). Dropout rates are calculated as the percentage point difference between successive doses of a vaccine, expressed as a percentage of the first dose: the dropout rate between the first and second dose of DPT is: (DPT1-DPT2)/DPT1. Dropout rates may also be calculated as the difference between one vaccine and another (ie., BCG and DPT3).
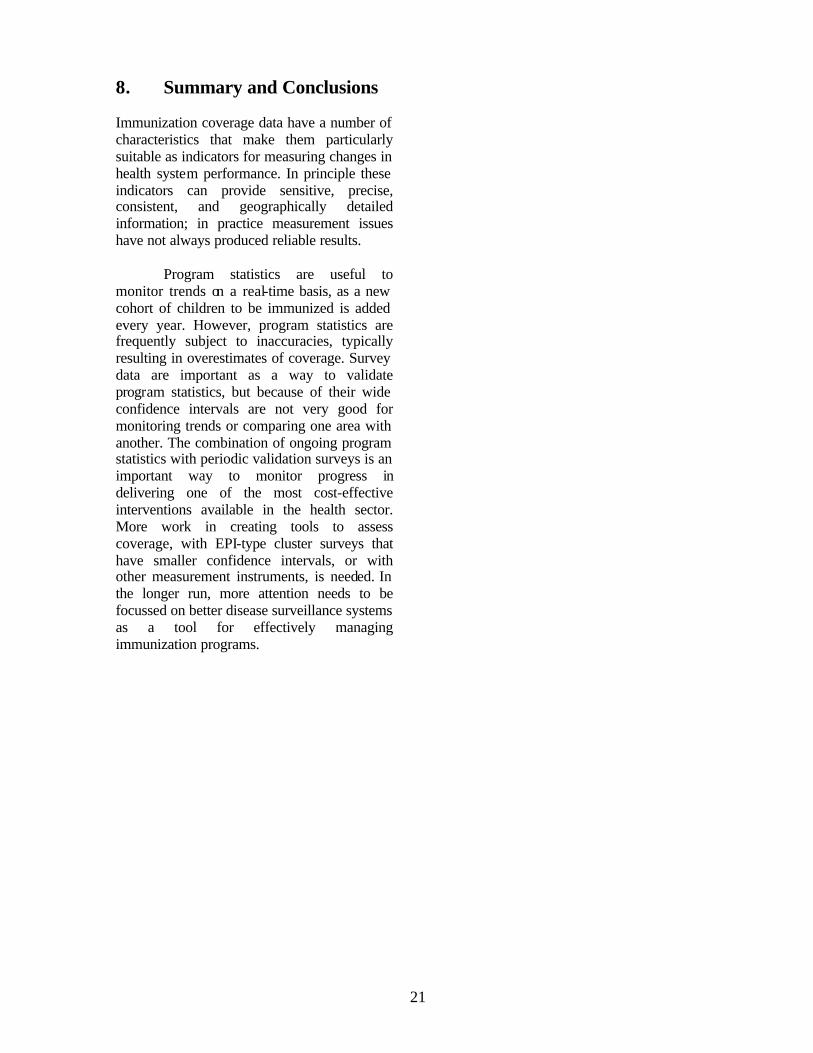
Figure 6 shows the trend in drop-out
rates as measured in three DHSs conducted in Bolivia, showing improvements in drop-out rates at both DPT1 to 2 and DPT2 to 3. Dropout rates in Bolivia improved especially rapidly between the second and third dose in the 1994 survey. As 82 percent of children in 1998 received at least 1 dose of DPT, further improvement in coverage is most likely to be achieved by reducing dropout rates.
Figure 6. DPT3 Coverage by Wealth Quintiles% of children age 1 immunized
0
10
20
30
40
50
60
70
80
90
100
Poorest 2 3 4 RichestWealth quintiles
%
Bangladesh Bolivia Cote d'IvoireIndia Madagascar PhilippinesVietnam Morocco
Figure 7. Drop-out Rates, Bolivia, 1989, 1994, and 1998
0.0
10.0
20.0
30.0
40.0
50.0
60.0
70.0
1989 1994 1998
Year of survey
Dro
p-ou
t ra
te (
%)
DPT1-2 DPT2-3 DPT1-3
21
8. Summary and Conclusions Immunization coverage data have a number of characteristics that make them particularly suitable as indicators for measuring changes in health system performance. In principle these indicators can provide sensitive, precise, consistent, and geographically detailed information; in practice measurement issues have not always produced reliable results. Program statistics are useful to monitor trends on a real-time basis, as a new cohort of children to be immunized is added every year. However, program statistics are frequently subject to inaccuracies, typically resulting in overestimates of coverage. Survey data are important as a way to validate program statistics, but because of their wide confidence intervals are not very good for monitoring trends or comparing one area with another. The combination of ongoing program statistics with periodic validation surveys is an important way to monitor progress in delivering one of the most cost-effective interventions available in the health sector. More work in creating tools to assess coverage, with EPI-type cluster surveys that have smaller confidence intervals, or with other measurement instruments, is needed. In the longer run, more attention needs to be focussed on better disease surveillance systems as a tool for effectively managing immunization programs.
Annex Tables The Annex includes three sets of tables: Annex Table 1 shows the reported immunization rates for all available years from 1980 to 1998. These are unadjusted program statistics, reported by country programs to WHO, and made available on the Diseases and Vaccines webpages of the WHO. Annex Table 2a and 2b show immunization coverage rates measured in Demographic and Health Surveys since the mid-1980s, for both 12-23 month old children who received the vaccine at any time before the survey (Table 2a), and for 12-23 month old children who received the vaccine before reaching age 1 (Table 2b). Annex Table 3 shows the results of the analysis by Gwatkin et al., in which households covered by the Demographic and Health Surveys were divided into five wealth strata. Immunization coverage rates are shown for each of the quintiles. Annex Table 4 shows dropout rates for DPT1-2-3, from Demographic and Health Surveys.


H N P D I S C U S S I O N P A P E R
About this series...
This series is produced by the Health, Nutrition, and Population Family(HNP) of the World Bank’s Human Development Network. The papersin this series aim to provide a vehicle for publishing preliminary andunpolished results on HNP topics to encourage discussion and debate.The findings, interpretations, and conclusions expressed in this paperare entirely those of the author(s) and should not be attributed in anymanner to the World Bank, to its affiliated organizations or to membersof its Board of Executive Directors or the countries they represent.Citation and the use of material presented in this series should takeinto account this provisional character. For free copies of papers inthis series please contact the individual authors whose name appearson the paper.
Enquiries about the series and submissions should be made directly tothe Editor in Chief Alexander S. Preker ([email protected]) orHNP Advisory Service ([email protected], tel 202 473-2256,fax 202 522-3234). For more information, see alsowww.worldbank.org/hnppublications.
THE WORLD BANK
1818 H Street, NWWashington, DC USA 20433Telephone: 202 477 1234Facsimile: 202 477 6391Internet: www.worldbank.orgE-mail: [email protected]
Using Immunization Coverage Rates for MonitoringHealth Sector Performance
Measurement and Interpretation Issues
Eduard Bos and Amie Batson
August 2000