health risk-based capital (e) working group wednesday
TRANSCRIPT

© 2020 National Association of Insurance Commissioners 1
Conference Call
HEALTH RISK-BASED CAPITAL (E) WORKING GROUP Wednesday, February 10, 2021
11:00 a.m. ET / 10:00 a.m. CT / 9:00 a.m. MT / 8:00 a.m. PT / 7:00 a.m. AT / 6:00 a.m. HT
ROLL CALL
Steve Drutz, Chair Washington Rhonda Ahrens/ Nebraska Steve Ostlund/Jennifer Li Alabama Michael Muldoon Eric Unger/Rolf Kaumann Colorado Tom Dudek New York Wanchin Chou Connecticut Kimberly Rankin Pennsylvania Carolyn Morgan/Kyle Collins Florida Mike Boerner/Aaron Hodges Texas Tish Becker Kansas
NAIC Support Staff: Crystal Brown
AGENDA
1. Discuss Impact Analysis on the Inclusion of Investment Income in Underwriting Risk—SteveDrutz (WA)
a. Rate and Durationi. Determine Investment Yield Percentages to Use in Impact Analysis
b. Frequency of Adjustment
Attachment A
2. Discuss Proposal 2021-02-CA-Managed Care Credit-Incentives—Steve Drutz (WA) Attachment B
3. Discuss Bond Factor Analysis—Steve Drutz (WA)
4. Discuss Any Other Matters Brought Before the Working Group—Steve Drutz (WA)
5. Adjournment
W:\QA\RBC\HRBC\2021\Calls and Meetings\02-10-21 Call\Agenda.docx

This page intentionally left blank.

1850 M Street NW Suite 300 Washington, DC 20036 Telephone 202 223 8196 Facsimile 202 872 1948 www.actuary.org
December 15, 2020
Steve Drutz Chair, Health Risk-Based Capital (E) Working Group National Association of Insurance Commissioners (NAIC)
Re: Request for Analysis to Incorporate Investment Income into the Underwriting Risk Component of the Health Risk-Based Capital Formula
Dear Mr. Drutz:
On behalf of the American Academy of Actuaries (Academy)1 Health Solvency Subcommittee, I am pleased to provide this response letter to the NAIC Health Risk-Based Capital (HRBC) Working Group. This letter is in response to the request from the HRBC Working Group to provide analysis to incorporate investment income into the existing underwriting risk factors within the HRBC formula.
Incorporation of Investment Income into H2 Risk Factors The H2 risk factors were based on a 5% probability of ruin over a 3- to 5-year period for each line. There is a fair degree of uncertainty with respect to the development of these factors, though it is likely they were developed without consideration of offsetting investment income. To reflect investment income into these factors, we studied the property and casualty (P&C) underwriting risk factor approach, which explicitly includes investment income via an Investment Income Adjustment (IIA).
To summarize the P&C framework with respect to the IIA within the P&C Net Written Premium Risk (akin to the Health H2 Experience Fluctuation Risk), the base RBC charge amounts to:
Premium * (IIA * Risk_Factor + Expense_Ratio - 1)
1 The American Academy of Actuaries is a 19,500-member professional association whose mission is to serve the public and the U.S. actuarial profession. For more than 50 years, the Academy has assisted public policymakers on all levels by providing leadership, objective expertise, and actuarial advice on risk and financial security issues. The Academy also sets qualification, practice, and professionalism standards for actuaries in the United States.
Attachment A
2
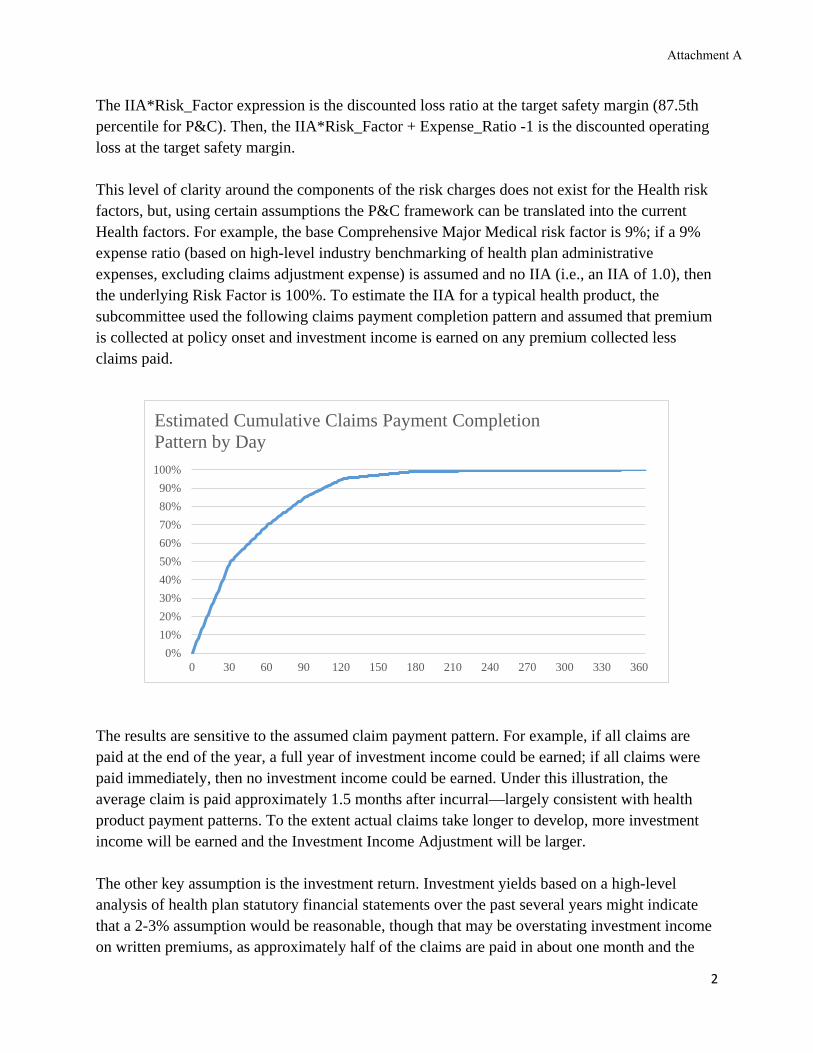
The IIA*Risk_Factor expression is the discounted loss ratio at the target safety margin (87.5th percentile for P&C). Then, the IIA*Risk_Factor + Expense_Ratio -1 is the discounted operating loss at the target safety margin. This level of clarity around the components of the risk charges does not exist for the Health risk factors, but, using certain assumptions the P&C framework can be translated into the current Health factors. For example, the base Comprehensive Major Medical risk factor is 9%; if a 9% expense ratio (based on high-level industry benchmarking of health plan administrative expenses, excluding claims adjustment expense) is assumed and no IIA (i.e., an IIA of 1.0), then the underlying Risk Factor is 100%. To estimate the IIA for a typical health product, the subcommittee used the following claims payment completion pattern and assumed that premium is collected at policy onset and investment income is earned on any premium collected less claims paid.
The results are sensitive to the assumed claim payment pattern. For example, if all claims are paid at the end of the year, a full year of investment income could be earned; if all claims were paid immediately, then no investment income could be earned. Under this illustration, the average claim is paid approximately 1.5 months after incurral—largely consistent with health product payment patterns. To the extent actual claims take longer to develop, more investment income will be earned and the Investment Income Adjustment will be larger. The other key assumption is the investment return. Investment yields based on a high-level analysis of health plan statutory financial statements over the past several years might indicate that a 2-3% assumption would be reasonable, though that may be overstating investment income on written premiums, as approximately half of the claims are paid in about one month and the
0%10%20%30%40%50%60%70%80%90%
100%
0 30 60 90 120 150 180 210 240 270 300 330 360
Estimated Cumulative Claims Payment Completion Pattern by Day
Attachment A

3
one-month Treasury rates are near zero today. Additionally, most investment income is likely earned from surplus funds. Given this uncertainty, the subcommittee performed sensitivity testing to understand the impact returns would have on the Risk Factor, as shown below:
Investment Return
Investment Income Adj.
Risk Charge Adj. Factor
Base Risk Factor
0.0% 1.0000 1.0000 9.00% 0.1% 0.9999 0.9985 8.99% 0.5% 0.9993 0.9927 8.93% 1.0% 0.9987 0.9854 8.87% 1.5% 0.9980 0.9780 8.80% 2.0% 0.9974 0.9707 8.74% 3.0% 0.9960 0.9558 8.60%
One concern raised by the Academy’s Solvency Subcommittee is that investment income is not generally a consideration with respect to the underwriting of short-term health care policies. While this is true, the related claims payable reserves and corresponding assets do generate investment returns. Because reserving risk is not considered within the HRBC formula, inclusion of investment income in Experience Fluctuation Risk may be reasonable.
There is considerably more uncertainty around the development of the Health Experience Fluctuation Risk factors than P&C Net Written Premium risk factors, as it has been some time since they were materially changed. As a result, making this change in the RBC formula may be an exercise in false precision because the baseline factors are not well understood. Ultimately, the regulatory usefulness of changes to the RBC formula will depend on both a strong understanding of the starting point and the suggested change. Given the importance of Underwriting Risk factors within the HRBC formula, it may be worth revisiting their development more broadly in the future.
*****
If you have any questions or would like to discuss further, please contact Matthew Williams, the Academy’s senior health policy analyst, at [email protected].
Sincerely,
Derek Skoog, MAAA, FSA Chairperson Health Solvency Subcommittee American Academy of Actuaries
Cc: Crystal Brown: Senior Insurance Reporting Analyst
Attachment A

1850 M Street NW Suite 300 Washington, DC 20036 Telephone 202 223 8196 Facsimile 202 872 1948 www.actuary.org
January 11, 2021
Steve Drutz Chair, Health Risk-Based Capital (E) Working Group National Association of Insurance Commissioners (NAIC)
Re: Request for Analysis to Incorporate Investment Income into the Underwriting Risk Component of the Health Risk-Based Capital Formula
Dear Mr. Drutz:
On behalf of the American Academy of Actuaries (Academy)1 Health Solvency Subcommittee, I am pleased to provide this response letter to the NAIC Health Risk-Based Capital (HRBC) Working Group. This letter is in response to the request from the HRBC Working Group to provide additional detail regarding the potential investment income adjustment factor for Health H2 Experience Fluctuation Risk.
Incorporation of Investment Income into H2 Risk Factors
As described in our letter dated December 15, 2020, the property and casualty (P&C) framework with respect to the Investment Income Adjustment (IIA) within the P&C Net Written Premium Risk (akin to the Health H2 Experience Fluctuation Risk), the base RBC charge amounts to:
Premium * (IIA * Risk_Factor + Expense_Ratio - 1)
The IIA*Risk_Factor expression is the discounted loss ratio at the target safety margin (87.5th percentile for P&C). Then, the IIA*Risk_Factor + Expense_Ratio -1 is the discounted operating loss at the target safety margin.
For Comprehensive Major Medical, if a 9% expense ratio (based on high-level industry benchmarking of health plan administrative expenses, excluding loss adjustment expense) is assumed and no IIA (i.e., an IIA of 1.0), then the underlying Risk Factor is 100%. This is essentially the loss plus loss adjustment expense ratio at the target safety margin implied by the Health RBC formula.
1 The American Academy of Actuaries is a 19,500-member professional association whose mission is to serve the public and the U.S. actuarial profession. For more than 50 years, the Academy has assisted public policymakers on all levels by providing leadership, objective expertise, and actuarial advice on risk and financial security issues. The Academy also sets qualification, practice, and professionalism standards for actuaries in the United States.
Attachment A
2
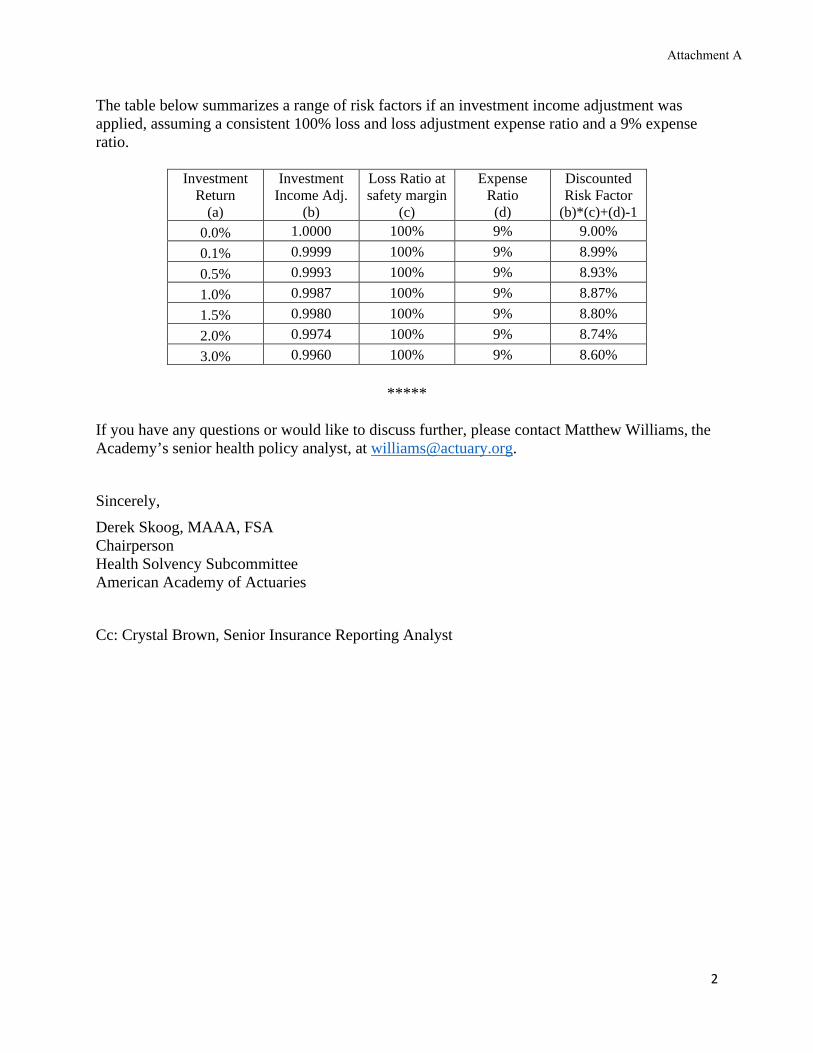
The table below summarizes a range of risk factors if an investment income adjustment was applied, assuming a consistent 100% loss and loss adjustment expense ratio and a 9% expense ratio.
Investment Return
(a)
Investment Income Adj.
(b)
Loss Ratio at safety margin
(c)
Expense Ratio
(d)
Discounted Risk Factor
(b)*(c)+(d)-1 0.0% 1.0000 100% 9% 9.00% 0.1% 0.9999 100% 9% 8.99% 0.5% 0.9993 100% 9% 8.93% 1.0% 0.9987 100% 9% 8.87% 1.5% 0.9980 100% 9% 8.80% 2.0% 0.9974 100% 9% 8.74% 3.0% 0.9960 100% 9% 8.60%
*****
If you have any questions or would like to discuss further, please contact Matthew Williams, the Academy’s senior health policy analyst, at [email protected]. Sincerely, Derek Skoog, MAAA, FSA Chairperson Health Solvency Subcommittee American Academy of Actuaries Cc: Crystal Brown, Senior Insurance Reporting Analyst
Attachment A

2020 National Association of Insurance Commissioners
Capital Adequacy (E) Task Force RBC Proposal Form
[ x ] Capital Adequacy (E) Task Force [ ] Health RBC (E) Working Group [ ] Life RBC (E) Working Group [ ] Catastrophe Risk (E) Subgroup [ ] Investment RBC (E) Working Group [ ] Longevity Risk (A/E) Subgroup [ ] C3 Phase II/ AG43 (E/A) Subgroup [ ] P/C RBC (E) Working Group
DATE: 1-28-21
CONTACT PERSON: Crystal Brown
TELEPHONE: 816-783-8146
EMAIL ADDRESS: [email protected]
ON BEHALF OF: Health RBC (E) Working Group
NAME: Steve Drutz
TITLE: Chief Financial Analyst/Chair
AFFILIATION: WA Office of Insurance Commissioner
ADDRESS: PO Box 40255
Olympia, WA 98504-0255
FOR NAIC USE ONLY
Agenda Item # 2021-02-CA
Year 2021
DISPOSITION
[ ] ADOPTED
[ ] REJECTED
[ ] DEFERRED TO
[ ] REFERRED TO OTHER NAIC GROUP
[ ] EXPOSED
[ ] OTHER (SPECIFY)
IDENTIFICATION OF SOURCE AND FORM(S)/INSTRUCTIONS TO BE CHANGED
[ x ] Health RBC Blanks [ x ] Property/Casualty RBC Blanks [ x ] Life and Fraternal RBC Instructions [ x ] Health RBC Instructions [ x ] Property/Casualty RBC Instructions [ x ] Life and Fraternal RBC Blanks
[ ] OTHER ____________________________
DESCRIPTION OF CHANGE(S)
Incorporate references for “Incentives” under the managed care instructions and blank as “Bonuses/Incentives.”
REASON OR JUSTIFICATION FOR CHANGE **
Currently the managed care instructions and blank only reference the bonuses, this change would clarify that both incentives and bonuses are to be included.
Additional Staff Comments:
___________________________________________________________________________________________________ ** This section must be completed on all forms. Revised 2-2019
Attachment B

HEALTH UNDERWRITING RISK – MANAGED CARE CREDIT
XR017
The effect of managed care arrangements on the variability of underwriting results is the fundamental difference between health entities and pure indemnity carriers. The managed care credit is used to reduce the RBC requirement for experience fluctuations. It is important to understand that the managed care credit is based on the reduction in uncertainty about future claims payments, not on any reduction in the actual level of cost. Those managed care arrangements that have the greatest reduction in the uncertainty of claim payments receive the greatest credit, while those that have less effect on the predictability of claims payments engender less of a discount.
There are currently five levels of managed care that are used in the formula, other than for Medicare Part D Coverage, although in the future as new managed care arrangements evolve, the number of categories may increase, or new arrangements may be added to the existing categories. The managed care categories are:
* Category 0 – Arrangements not Included in Other Categories * Category 1 – Contractual Fee Payments * Category 2 – Bonus and/or Incentives / Withhold Arrangements * Category 3 – Capitation* Category 4 – Non-Contingent Expenses and Aggregate Cost Arrangements and Certain PSO Capitated Arrangements
For Medicare Part D Coverage, the reduction in uncertainty comes from two federal supports. The reinsurance coverage is optional in that a plan sponsor may elect to participate in the Part D Payment Demonstration. The risk corridor protection is expected to have less impact after the first few years. To allow flexibility within the RBC formula, Lines (10) through (13) will be used to give credit for the programs in which the plan sponsor participates. While all PDPs will have formularies and may utilize other methods to reduce uncertainty, for the near future, no other managed care credits are allowed for this coverage.
The managed care credit is based on the percentage of paid claims that fall into each of these categories. Total claims payments are allocated among these managed care “buckets” to determine the weighted average discount, which is then used to reduce the Underwriting Risk-Experience Fluctuation RBC. Paid claims are used instead of incurred claims due to the variability of reserves (unpaid claims) in incurred claim amounts and the difficulty in allocating reserves (unpaid claims) by managed care category.
In some instances, claim payments may fit into more than one category. If that occurs, enter the claim payments into the highest applicable category. CLAIM PAYMENTS CAN ONLY BE ENTERED INTO ONE OF THESE CATEGORIES! The total of the claim payments reported in the Managed Care Credit Calculation page should equal the total year’s paid claims.
Line (1) – Category 0 – Arrangements not Included in Other Categories. There is a zero managed care credit for claim payments in this category, which includes:
• Fee for service (charges). • Discounted FFS (based upon charges). • Usual Customary and Reasonable (UCR) Schedules.• Relative Value Scales (RVS) where neither payment base nor RV factor is fixed by contract or where they are fixed by contract for one year or less.• Stop-loss payments by a health entity to its providers that are capitated or subject to withhold/incentive programs.• Retroactive payments to capitated providers or intermediaries whether by capitation or other payment method (excluding retroactive withholds later released
to the provider and retroactive payments made solely because of a correction to the number of members within the capitated agreement). • Capitation paid to providers or intermediaries that have received retroactive payments for previous years (including bonus arrangements on capitation
programs).
Formatted: Left
Formatted: Highlight
Formatted: Highlight
Attachment B

This amount should equal Exhibit 7, Part 1, Column 1, Line 5 of the annual statement excluding Stand-Alone Medicare Part D business reported in Lines (12) and (13). Line (2) – Category 1 – Payments Made According to Contractual Arrangements. There is a 15 percent managed care credit for payments included in this category:
• Hospital per diems, DRGs or other hospital case rates. • Non-adjustable professional case and global rates. • Provider fee schedules. • RVS where the payment base and RV factor are fixed by contract for more than one year. • Ambulatory payment classifications (APCs).
This amount should equal Exhibit 7, Part 1, Column 1, Line 6 of the annual statement excluding Stand-Alone Medicare Part D business reported in Lines (12) and (13). Line (3) - Category 2a - Payments Made Subject to Withholds or Bonuses/Incentives With No Other Managed Care Arrangements. This category may include business that would have otherwise fit into Category 0. That is, there may be a bonus/incentives/withhold arrangement with a provider who is reimbursed based on a UCR schedule (Category 0). The maximum Category 2a managed care credit is 25 percent. The credit is based upon a calculation that determines the ratio of withholds returned and bonuses and/or incentives paid to providers during the prior year to total withholds and bonuses and incentives available to the providers during that year. That ratio is then multiplied by the average provider withhold ratio for the prior year to determine the current year’s Category 2a managed care credit factor. Bonus and/or incentive payments that are not related to financial results are not included (e.g., patient satisfaction). Therefore, the credit factor is equal to the result of the following calculation:
EXAMPLE – 2019 Reporting Year
2018 withhold / bonus/incentive payments ........................................................... 750,000 2018 withholds / bonuses/incentives available ................................................... 1,000,000 A. MCC Factor Multiplier.................................................................................... 75% – Eligible for credit 2018 withholds / bonuses/incentives available .................................................... 1,000,000 2018 claims subject to withhold - gross* .............................................................. 5,000,000 B. Average Withhold Rate ................................................................................... 20% Category 2 Managed Care Credit Factor (A x B) ............................................................. 15%
The resulting factor is multiplied by claim payments subject to withhold - net** in the current year.
* These are amounts due before deducting withhold or paying bonuses and/or incentives. ** These are actual payments made after deducting withhold or paying bonuses and/or incentives.
Enter the paid claims for the current year where payments to providers were subject to withholds and bonuses/incentives, but otherwise had no managed care arrangements. This amount should equal Exhibit 7, Part 1, Column 1, Line 7 of the annual statement excluding Stand-Alone Medicare Part D business reported in Lines (12) and (13).
Attachment B

Line (4) – Category 2b – Payments Made Subject to Withholds or Bonuses/Incentives That Are Otherwise Managed Care Category 1. Category 2b may include business that would have otherwise fit into Category 1. That is, there may be a bonus/incentives/withhold arrangement with a provider who is reimbursed based on a provider fee schedule (Category 1). The Category 2 discount for claim payments that would otherwise qualify for Category 1 is the greater of the Category 1 factor or the calculated Category 2 factor. The maximum Category 2b managed care credit is 25 percent. The minimum of Category 2b managed care credit is 15 percent (Category 1 credit factor). The credit calculation is the same as found in the previous example for Category 2a. Enter the paid claims for the current year where payments to providers were subject to withholds and bonuses/incentives AND where the payments were made according to one of the contractual arrangements listed for Category 1. This amount should equal Exhibit 7, Part 1, Column 1, Line 8 of the annual statement excluding Stand-Alone Medicare Part D business reported in Lines (12) and (13). Line (5) – Category 3a – Capitated Payments Directly to Providers. There is a managed care credit of 60 percent for claims payments in this category, which includes:
• All capitation or percent of premium payments directly to licensed providers. Enter the amount of claim payments paid DIRECTLY to licensed providers on a capitated basis. This amount should equal Exhibit 7, Part 1, Column 1, Line 1 + Line 3 of the annual statement excluding Stand-Alone Medicare Part D business reported in Lines (12) and (13). Line (6) – Category 3b – Capitated Payments to Regulated Intermediaries. There is a managed care credit of 60 percent for claim payments in this category, which includes:
• All capitation or percent of premium payments to intermediaries that in turn pay licensed providers. Enter the amount of medical expense capitations paid to regulated intermediaries. An intermediary is a person, corporation or other business entity (not licensed as a medical provider) that arranges, by contracts with physicians and other licensed medical providers, to deliver health services for a health entity and its enrollees via a separate contract between the intermediary and the health entity. This includes affiliates of a health entity that are not subject to RBC, except in those cases where the health entity qualifies for a higher managed care credit because the capitated affiliate employs providers and pays them non-contingent salaries, and where the affiliated intermediary has a contract only with the affiliated health entity. A Regulated Intermediary is an intermediary (affiliated or not) subject to state regulation and files the Health RBC formula with the state. Line (7) – Category 3c – Capitated Payments to Non-Regulated Intermediaries. There is a managed care credit of 60 percent for claim payments in this category, which includes:
• All capitation or percent of premium payments to intermediaries that in turn pay licensed providers. (Subject to a 5 percent limitation on payments to providers or other corporations that have no contractual relationship with such intermediary. Amounts greater than the 5 percent limitation should be reported in Category 0.)
Enter the amount of medical expense capitations paid to non-regulated intermediaries. IN ORDER TO QUALIFY FOR ANY OF THE CAPITATION CATEGORIES, SUCH CAPITATION MUST BE FIXED (AS A PERCENTAGE OF PREMIUM OR FIXED DOLLAR AMOUNT PER MEMBER) FOR A PERIOD OF AT LEAST 12 MONTHS. Where an arrangement contains a provision for prospective revision within a 12-month period, the entire arrangement shall be subject to a managed care credit that is calculated under category 1 for a provider, and for an intermediary at the greater of category 1 or a credit calculated using the underlying payment method(s) to the providers of care. Where an arrangement contains a provision for retroactive revisions
Attachment B

either within or beyond a 12-month period, the entire arrangement shall be subject to a managed care credit that is calculated under category 0 for both providers and intermediaries. Line (8) – Category 4 – Medical & Hospital Expense Paid as Salary to Providers. There is a managed care credit of 75 percent for claim payments in this category. Once claim payments under this managed care category are totaled, any fee for service revenue from uninsured plans (i.e., ASO or ASC) that was included on line 7 in the Underwriting Risk section should be deducted before applying the managed care credit factor. This category includes:
• Non-contingent salaries to persons directly providing care. • The portion of payments to affiliated entities, which is passed on as non-contingent salaries to persons directly providing care where the entity has a contract
only with its affiliated health entity. • All facilities related medical expenses and other non-provider medical costs generated within a health facility that is owned and operated by the health entity. • Aggregate cost payments.
Salaries paid to doctors and nurses whose sole corporate purpose is utilization review are also included in this category if such payments are classified as “medical expense” payments (paid claims) rather than administrative expenses. The "aggregate cost" method of reimbursement means where a health plan has a reimbursement plan with a corporate entity that directly provides care, where (1) the health plan is contractually required to pay the total operating costs of the corporate entity, less any income to the entity from other users of services, and (2) there are mutual unlimited guarantees of solvency between the entity and the health plan, which put their respective capital and surplus at risk in guaranteeing each other. This amount should equal Exhibit 7, Part 1, Column 1, Line 9 + Line 10 of the annual statement excluding Stand-Alone Medicare Part D business reported in Lines (12) and (13). Line (9) – Sub-Total Paid Claims. The total of paid claims for Comprehensive Medical, Medicare Supplement and Dental [should equal the total claims paid for the year as reported in Exhibit 7, Part 1, Column 1, Line 13 less Line 11 of the annual statement and the sum of Lines (8.3), (12) and (13) on page XR017 – Underwriting Risk – Managed Care Credit. Line (10) – Category 0 – No Federal Reinsurance or Risk Corridor Protection. Category 0 for Medicare Part D Coverage would be all claims during a period where neither the reinsurance coverage or risk corridor protection is provided. Line (11) – Category 1 – Federal Reinsurance but no Risk Corridor Protection. Category 1 for Medicare Part D Coverage would be all claims during a period when only the reinsurance coverage is provided. This is designed for some future time period and is not to be interpreted as including employer-based Part D coverage that is not subject to risk corridor protection. Line (12) – Category 2a – No Federal Reinsurance but Risk Corridor Protection. Category 2a for Medicare Part D Coverage would be for all claims during a period when only the risk corridor protection is provided. Line (13) – Category 3a – Federal Reinsurance and Risk Corridor Protection. Category 3a for Medicare Part D Coverage would be for all claims during a period when both reinsurance coverage and risk corridor protection are provided. Line (14) – Sub-Total Paid Claims. The total paid claims for Medicare Part D Coverage, excluding supplemental benefits. Line (16) – Weighted Average Managed Care Discount. These amounts are calculated by dividing the total weighted claims by the comparable sub-total claim payments. For Column (3), this is Column (3), Line (9) divided by Column (2), Line (9). For Column (4), this is Column (4) Line (14) divided by Column (2), Line (14).
Attachment B

Line (17) – Weighted Average Managed Care Risk Adjustment Factor. These are the credit factors that are carried back to the underwriting risk calculation. They are one minus the Weighted Average Managed Care Discount values in Line (16). Lines (18) through (24) are the calculation of the weighted average factor for the Category 2 claims payments subject to withholds and bonuses/incentives. This table requires data from the PRIOR YEAR to compute the current year’s discount factor. These do not apply to Medicare Part D coverage. Line (18) – Withhold & Bonus/Incentive Payments, prior year. Enter the prior year’s actual withhold and bonus/incentive payments. Line (19) –Withhold & Bonuses/Incentives Available, prior year. Enter the prior year’syears withholds and bonuses/incentives that were available for payment in the prior year. Line (20) – MCC Multiplier – Average Withhold Returned. Divides Line (18) by Line (19) to determine the portion of withholds and bonuses/incentives that were actually returned in the prior year. Line (21) – Withholds & Bonuses/Incentives Available, prior year. Equal to Line (19) and is automatically pulled forward. Line (22) – Claims Payments Subject to Withhold, prior year. Claim payments that were subject to withholds and bonuses/incentives in the prior year. Equal to L(3) + L(4) of the managed care credit claims payment table FOR THE PRIOR YEAR. Line (23) – Average Withhold Rate, prior year. Divides Line (21) by Line (22) to determine the average withhold rate for the prior year. Line (24) – MCC Discount Factor, Category 2. Multiplies Line (20) by Line (23) to determine the discount factor for Category 2 claims payments in the current year, based on the performance of the health entity’sentities withhold/bonus/incentive program in the prior year.
Attachment B
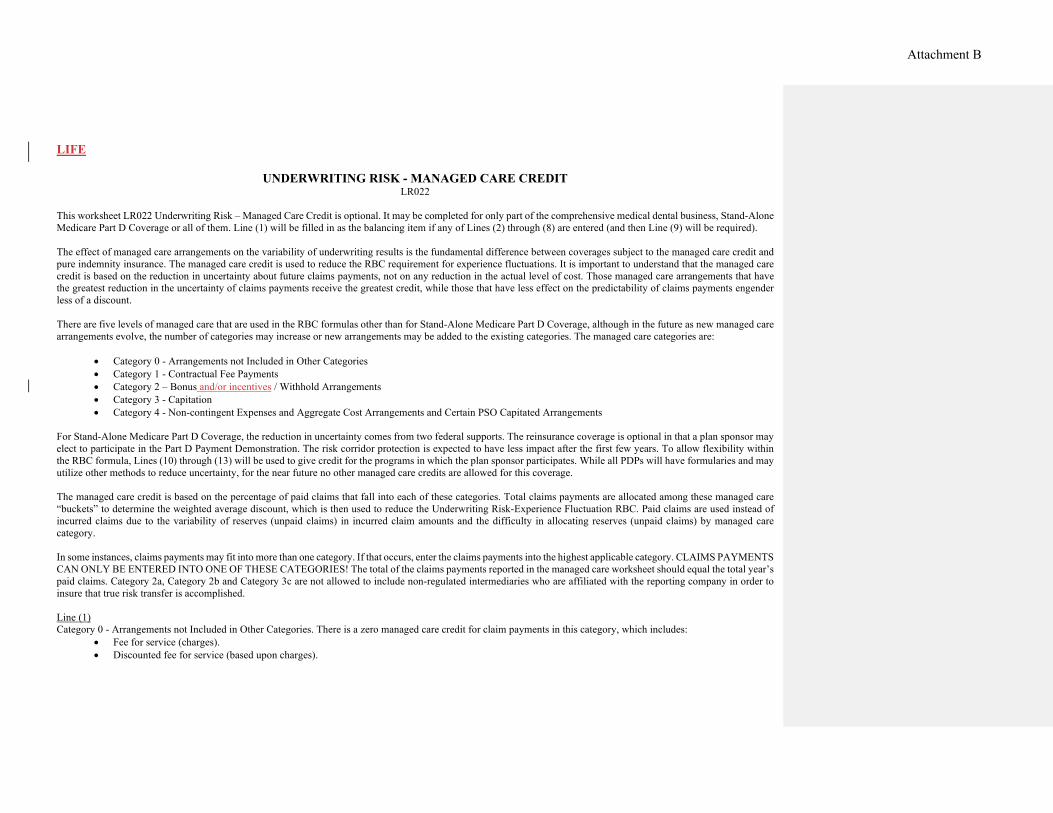
LIFE
UNDERWRITING RISK - MANAGED CARE CREDIT LR022
This worksheet LR022 Underwriting Risk – Managed Care Credit is optional. It may be completed for only part of the comprehensive medical dental business, Stand-Alone Medicare Part D Coverage or all of them. Line (1) will be filled in as the balancing item if any of Lines (2) through (8) are entered (and then Line (9) will be required). The effect of managed care arrangements on the variability of underwriting results is the fundamental difference between coverages subject to the managed care credit and pure indemnity insurance. The managed care credit is used to reduce the RBC requirement for experience fluctuations. It is important to understand that the managed care credit is based on the reduction in uncertainty about future claims payments, not on any reduction in the actual level of cost. Those managed care arrangements that have the greatest reduction in the uncertainty of claims payments receive the greatest credit, while those that have less effect on the predictability of claims payments engender less of a discount. There are five levels of managed care that are used in the RBC formulas other than for Stand-Alone Medicare Part D Coverage, although in the future as new managed care arrangements evolve, the number of categories may increase or new arrangements may be added to the existing categories. The managed care categories are:
• Category 0 - Arrangements not Included in Other Categories • Category 1 - Contractual Fee Payments • Category 2 – Bonus and/or incentives / Withhold Arrangements • Category 3 - Capitation • Category 4 - Non-contingent Expenses and Aggregate Cost Arrangements and Certain PSO Capitated Arrangements
For Stand-Alone Medicare Part D Coverage, the reduction in uncertainty comes from two federal supports. The reinsurance coverage is optional in that a plan sponsor may elect to participate in the Part D Payment Demonstration. The risk corridor protection is expected to have less impact after the first few years. To allow flexibility within the RBC formula, Lines (10) through (13) will be used to give credit for the programs in which the plan sponsor participates. While all PDPs will have formularies and may utilize other methods to reduce uncertainty, for the near future no other managed care credits are allowed for this coverage. The managed care credit is based on the percentage of paid claims that fall into each of these categories. Total claims payments are allocated among these managed care “buckets” to determine the weighted average discount, which is then used to reduce the Underwriting Risk-Experience Fluctuation RBC. Paid claims are used instead of incurred claims due to the variability of reserves (unpaid claims) in incurred claim amounts and the difficulty in allocating reserves (unpaid claims) by managed care category. In some instances, claims payments may fit into more than one category. If that occurs, enter the claims payments into the highest applicable category. CLAIMS PAYMENTS CAN ONLY BE ENTERED INTO ONE OF THESE CATEGORIES! The total of the claims payments reported in the managed care worksheet should equal the total year’s paid claims. Category 2a, Category 2b and Category 3c are not allowed to include non-regulated intermediaries who are affiliated with the reporting company in order to insure that true risk transfer is accomplished. Line (1) Category 0 - Arrangements not Included in Other Categories. There is a zero managed care credit for claim payments in this category, which includes:
• Fee for service (charges). • Discounted fee for service (based upon charges).
Attachment B

• Usual customary and reasonable (UCR) schedules. • Relative value scale (RVS), where neither payment base nor RV factor is fixed by contract or where they are fixed by contract for one year or less. • Retroactive payments to capitated providers or intermediaries whether by capitation or other payment method (excluding retroactive withholds later released
to the provider and retroactive payments made solely because of a correction to the number of members within the capitated agreement). • Capitation paid to providers or intermediaries that have received retroactive payments for previous years (including bonus arrangements on capitation
programs). • Claim payments not included in other categories.
Line (2) Category 1 - Payments Made According to Contractual Arrangements. There is a 15 percent managed care credit for payments included in this category:
• Hospital per diems, diagnostic related groups (DRGs) or other hospital case rates. • Non-adjustable professional case and global rates. • Provider fee schedules. • Relative value scale (RVS), where the payment base and RV factor are fixed by contract for more than one year.
Line (3) Category 2a - Payments Made Subject to Withholds or Bonuses/Incentives with No Other Managed Care Arrangements. This category may include business that would have otherwise fit into Category 0. That is, there may be a bonus/incentives/withhold arrangement with a provider who is reimbursed based on a UCR schedule (Category 0). The maximum Category 2a managed care credit is 25 percent. The credit is based upon a calculation that determines the ratio of withholds returned and bonuses and/or incentives paid to providers during the prior year to total withholds and bonuses and incentives available to the providers during that year. That ratio is then multiplied by the average provider withhold ratio for the prior year to determine the current year’s Category 2a managed care credit factor. Bonus and/or incentive payments that are not related to financial results are not included (e.g., patient satisfaction). Therefore, the credit factor is equal to the result of the following calculation:
EXAMPLE - 1998 Reporting Year 1997 withhold / bonus/incentive payments 750,000 1997 withholds / bonuses/incentives available 1,000,000
A . MCC Factor Multiplier 75% - Eligible for credit 1997 withholds / bonuses/incentives available 1,000,000 1997 claims subject to withhold -gross† 5,000,000 B. Average Withhold Rate 20% Category 2 Managed Care Credit Factor (A x B) 15% The resulting factor is multiplied by claims payments subject to withhold - net‡ in the current year. † These are amounts due before deducting withhold or paying bonuses and/or incentives. ‡ These are actual payments made after deducting withhold or paying bonuses and/or incentives. Enter the paid claims for the current year where payments to providers were subject to withholds and bonuses/incentives, but otherwise had no managed care arrangements. Line (4)
Formatted: Highlight
Attachment B

Category 2b - Payments Made Subject to Withholds or Bonuses/Incentives That Are Otherwise Managed Care Category 1. Category 2b may include business that would have otherwise fit into Category 1. That is, there may be a bonus/incentive/withhold arrangement with a provider who is reimbursed based on a provider fee schedule (Category 1). The Category 2 discount for claims payments that would otherwise qualify for Category 1 is the greater of the Category 1 factor or the calculated Category 2 factor. The maximum Category 2b managed care credit is 25 percent. The minimum of Category 2b managed care credit is 15 percent (Category 1 credit factor). The credit calculation is the same as found in the previous example for Category 2a. Enter the paid claims for the current year where payments to providers were subject to withholds and bonuses/incentives AND where the payments were made according to one of the contractual arrangements listed for Category 1. Line (5) Category 3a - Capitated Payments Directly to Providers. There is a managed care credit of 60 percent for claims payments in this category, which includes:
• All capitation or percent of premium payments directly to licensed providers. Enter the amount of claims payments paid DIRECTLY to licensed providers on a capitated basis. Line (6) Category 3b - Capitated Payments to Regulated Intermediaries. There is a managed care credit of 60 percent for claims payments in this category, which includes:
• All capitation or percent of premium payments to regulated intermediaries that, in turn, pay licensed providers. Enter the amount of medical expense capitations paid to regulated intermediaries (see Appendix 2 for definition). In those cases where the capitated regulated intermediary employs providers and pays them non-contingent salaries or otherwise qualifies for Category 4, the insurer may include that portion of such capitated payments in Category 4. Line (7) Category 3c - Capitated Payments to Non-Regulated Intermediaries. There is a managed care credit of 60 percent for claims payments in this category, which includes:
• All capitated or percent of premium payments to non-affiliated intermediaries that, in turn, pay licensed providers (subject to a 5 percent limitation on payments to providers or other corporations that have no contractual relationship with such intermediary. Amounts greater than the 5 percent limitation should be reported in Category 0).
Enter the amount of medical expense capitations paid to non-regulated intermediaries not affiliated with the reporting company. Do not include the amount of medical expense capitations paid to non-regulated intermediaries affiliated with the reporting company. These amounts should be reported in Category 0. Non-regulated intermediaries are those organizations that meet the definition in Appendix 2 for Intermediary but not regulated intermediary. In those cases where the capitated non-regulated intermediary (even if affiliated) employs providers and pays them non-contingent salaries or otherwise qualifies for Category 4, the insurer may include that portion of such capitated payments in Category 4. IN ORDER TO QUALIFY FOR ANY OF THE CAPITATION CATEGORIES, SUCH CAPITATION MUST BE FIXED (AS A PERCENTAGE OF PREMIUM OR FIXED DOLLAR AMOUNT PER MEMBER) FOR A PERIOD OF AT LEAST 12 MONTHS. Where an arrangement contains a provision for prospective revision within a 12-month period, the entire arrangement shall be subject to a managed care credit that is calculated under Category 1 for a provider, and for an intermediary at the greater
Attachment B

of Category 1 or a credit calculated using the underlying payment method(s) to the providers of care. Where an arrangement contains a provision for retroactive revisions either within or beyond a 12 month period, the entire arrangement shall be subject to a managed care credit that is calculated under Category 0 for both providers and intermediaries. Line (8) Category 4 - Medical & Hospital Expense Paid as Salary to Providers. There is a managed care credit of 75 percent for claims payments in this category. Once claims payments under this managed care category are totaled, any fee for service revenue from uninsured plans (i.e., ASO or ASC) that was included on Line (7) in the underwriting risk section should be deducted before applying the managed care credit factor.
• Non-contingent salaries to persons directly providing care. • The portion of payments to affiliated entities passed on as non-contingent salaries to persons directly providing care where the entity has a contract only with
the company. • All facilities-related medical expenses and other non-provider medical costs generated within health facility that is owned and operated by the insurer. • Aggregate cost payments.
Salaries paid to doctors and nurses whose sole corporate purpose is utilization review are also included in this category if such payments are classified as “medical expense” payments (paid claims) rather than administrative expenses. The Aggregate Cost method of reimbursement means where a health plan has a reimbursement plan with a corporate entity that directly provides care, where (1) the health plan is contractually required to pay the total operating costs of the corporate entity, less any income to the entity from other users of services; and (2) there are mutual unlimited guarantees of solvency between the entity and the health plan, which put their respective capital and surplus at risk in guaranteeing each other. Line (9) Subtotal Paid Claims – The total of Column (2) paid claims should equal the total claims paid for the year as reported in Schedule H, Part 5, Columns 1 and 2, Line A.4 of the annual statement. Line (10) Category 0 for Stand-Alone Medicare Part D Coverage would be all claims during a period where neither the reinsurance coverage or risk corridor protection is provided. Line (11) Category 1 for Stand-Alone Medicare Part D Coverage would be for all claims during a period when only the reinsurance coverage is provided. This is designed for some future time period and is not to be interpreted as including employer-based Part D coverage that is not subject to risk corridor protection. Line (12) Category 2a for Stand-Alone Medicare Part D Coverage would be for all claims during a period when only the risk corridor protection is provided. Line (13) Category 3a for Stand-Alone Medicare Part D Coverage would be for all claims during a period when both reinsurance coverage and risk corridor protection are provided. Line (16) Weighted Average Managed Care Discount – The amounts in Column (3) and Column (4) are calculated by dividing the total weighted claims in Column (3) by the total claims paid in Column (2) for Lines (9) and (14) respectively. Line (17)
Attachment B

Weighted Average Managed Care Risk Adjustment Factor – These are the credit factors that are carried back to the underwriting risk calculation. They are one minus the Weighted Average Managed Care Discount (Line (16)). Lines (18) through (24) Lines (18) through (24) are the calculation of the weighted average factor for the Category 2 claims payments subject to withholds and bonuses/incentives. This table requires data from the PRIOR YEAR to compute the current year’s discount factor. Line (18) Enter the prior year’s actual withhold and bonus/incentive payments. Line (19) Enter the prior year’s withholds and bonuses/incentives that were available for payment in the prior year. Line (20) Divides Line (18) by Line (19) to determine the portion of withholds and bonuses/incentives that were actually returned in the prior year. Line (21) Equal to Line (19) and is automatically pulled forward. Line (22) Claims payments that were subject to withholds and bonuses/incentives in the prior year. Equal to Line (3) + Line (4) of LR022 Underwriting Risk – Managed Care Credit FOR THE PRIOR YEAR. Line (23) Divides Line (21) by Line (22) to determine the average withhold rate for the prior year. Line (24) Multiplies Line (20) by Line (23) to determine the discount factor for Category 2 claims payments in the current year, based on the performance of the insurer’s withhold/bonus/incentive program in the prior year.
Attachment B
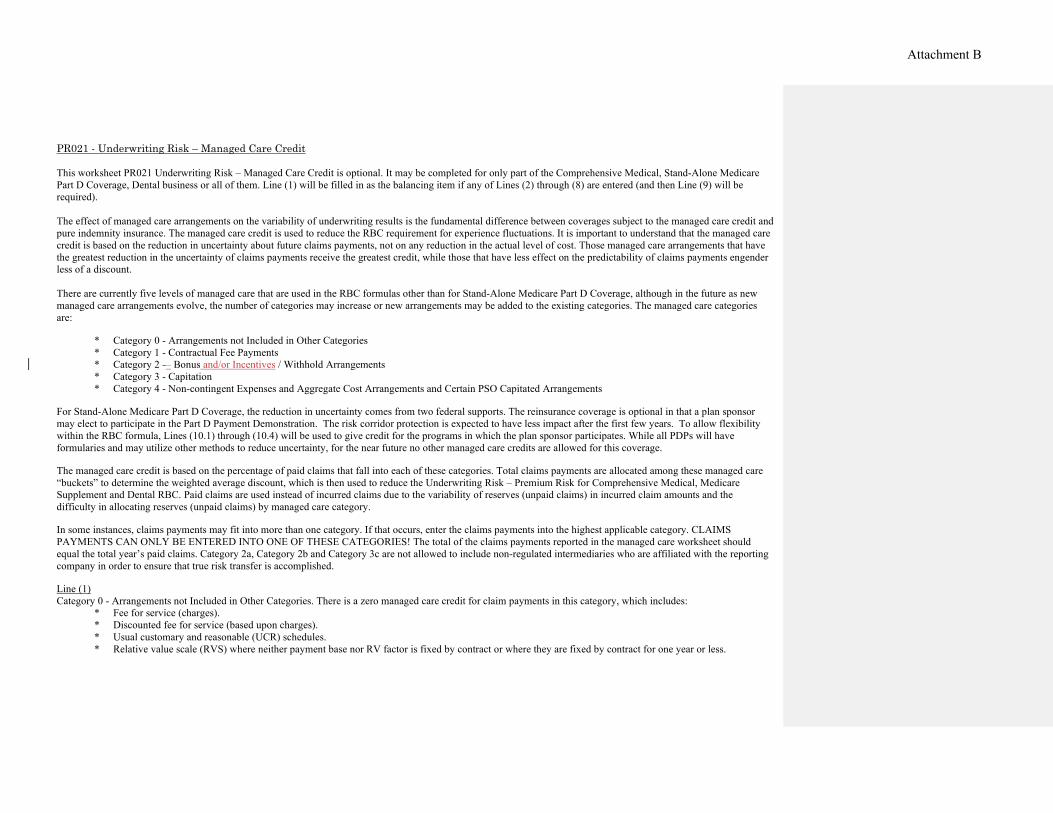
PR021 - Underwriting Risk – Managed Care Credit This worksheet PR021 Underwriting Risk – Managed Care Credit is optional. It may be completed for only part of the Comprehensive Medical, Stand-Alone Medicare Part D Coverage, Dental business or all of them. Line (1) will be filled in as the balancing item if any of Lines (2) through (8) are entered (and then Line (9) will be required). The effect of managed care arrangements on the variability of underwriting results is the fundamental difference between coverages subject to the managed care credit and pure indemnity insurance. The managed care credit is used to reduce the RBC requirement for experience fluctuations. It is important to understand that the managed care credit is based on the reduction in uncertainty about future claims payments, not on any reduction in the actual level of cost. Those managed care arrangements that have the greatest reduction in the uncertainty of claims payments receive the greatest credit, while those that have less effect on the predictability of claims payments engender less of a discount. There are currently five levels of managed care that are used in the RBC formulas other than for Stand-Alone Medicare Part D Coverage, although in the future as new managed care arrangements evolve, the number of categories may increase or new arrangements may be added to the existing categories. The managed care categories are:
* Category 0 - Arrangements not Included in Other Categories * Category 1 - Contractual Fee Payments * Category 2 -– Bonus and/or Incentives / Withhold Arrangements * Category 3 - Capitation * Category 4 - Non-contingent Expenses and Aggregate Cost Arrangements and Certain PSO Capitated Arrangements
For Stand-Alone Medicare Part D Coverage, the reduction in uncertainty comes from two federal supports. The reinsurance coverage is optional in that a plan sponsor may elect to participate in the Part D Payment Demonstration. The risk corridor protection is expected to have less impact after the first few years. To allow flexibility within the RBC formula, Lines (10.1) through (10.4) will be used to give credit for the programs in which the plan sponsor participates. While all PDPs will have formularies and may utilize other methods to reduce uncertainty, for the near future no other managed care credits are allowed for this coverage. The managed care credit is based on the percentage of paid claims that fall into each of these categories. Total claims payments are allocated among these managed care “buckets” to determine the weighted average discount, which is then used to reduce the Underwriting Risk – Premium Risk for Comprehensive Medical, Medicare Supplement and Dental RBC. Paid claims are used instead of incurred claims due to the variability of reserves (unpaid claims) in incurred claim amounts and the difficulty in allocating reserves (unpaid claims) by managed care category. In some instances, claims payments may fit into more than one category. If that occurs, enter the claims payments into the highest applicable category. CLAIMS PAYMENTS CAN ONLY BE ENTERED INTO ONE OF THESE CATEGORIES! The total of the claims payments reported in the managed care worksheet should equal the total year’s paid claims. Category 2a, Category 2b and Category 3c are not allowed to include non-regulated intermediaries who are affiliated with the reporting company in order to ensure that true risk transfer is accomplished. Line (1) Category 0 - Arrangements not Included in Other Categories. There is a zero managed care credit for claim payments in this category, which includes:
* Fee for service (charges). * Discounted fee for service (based upon charges). * Usual customary and reasonable (UCR) schedules. * Relative value scale (RVS) where neither payment base nor RV factor is fixed by contract or where they are fixed by contract for one year or less.
Attachment B

* Retroactive payments to capitated providers or intermediaries whether by capitation or other payment method (excluding retroactive withholds later released to the provider and retroactive payments made solely because of a correction to the number of members within the capitated agreement).
* Capitation paid to providers or intermediaries that have received retroactive payments for previous years (including bonus arrangements on capitation programs).
* Claim payments not included in other categories. Line (2) Category 1 - Payments Made According to Contractual Arrangements. There is a 15 percent managed care credit for payments included in this category:
* Hospital per diems, diagnostic related groups (DRGs) or other hospital case rates. * Non-adjustable professional case and global rates. * Provider fee schedules. * Relative value scale (RVS) where the payment base and RV factor are fixed by contract for more than one year.
Line (3) Category 2a - Payments Made Subject to Withholds or Bonuses/Incentives with No Other Managed Care Arrangements. This category may include business that would have otherwise fit into Category 0. That is, there may be a bonus/incentive/withhold arrangement with a provider who is reimbursed based on a UCR schedule (Category 0). The maximum Category 2a managed care credit is 25 percent. The credit is based upon a calculation that determines the ratio of withholds returned and bonuses and/or incentives paid to providers during the prior year to total withholds and bonuses and incentives available to the providers during that year. That ratio is then multiplied by the average provider withhold ratio for the prior year to determine the current year’s Category 2a managed care credit factor. Bonus and/or incentive payments that are not related to financial results are not included (e.g., patient satisfaction). Therefore, the credit factor is equal to the result of the following calculation:
EXAMPLE - 1998 Reporting Year 1997 withhold / bonus payments $750,000 1997 withholds / bonuses available $1,000,000
A. MCC Factor Multiplier 75% - Eligible for credit 1997 withholds / bonuses available $1,000,000 1997 claims subject to withhold -gross† $5,000,000
B. Average Withhold Rate 20% Category 2 Managed Care Credit Factor (A x B) 15%
The resulting factor is multiplied by claims payments subject to withhold - net‡ in the current year. † These are amounts due before deducting withhold or paying bonuses and/or incentives. ‡ These are actual payments made after deducting withhold or paying bonuses and/or incentives.
Enter the paid claims for the current year where payments to providers were subject to withholds and bonuses/incentives, but otherwise had no managed care arrangements. Line (4) Category 2b - Payments Made Subject to Withholds or Bonuses/Incentives That Are Otherwise Managed Care Category 1. Category 2b may include business that would have otherwise fit into Category 1. That is, there may be a bonus/incentive/withhold arrangement with a provider who is reimbursed based on a provider fee schedule
Formatted: Highlight
Attachment B

(Category 1). The Category 2 discount for claims payments that would otherwise qualify for Category 1 is the greater of the Category 1 factor or the calculated Category 2 factor.
The maximum Category 2b managed care credit is 25 percent. The minimum Category 2b managed care credit is 15 percent (Category 1 credit factor). The credit calculation is the same as found in the previous example for Category 2a. Enter the paid claims for the current year where payments to providers were subject to withholds and bonuses/incentives AND where the payments were made according to one of the contractual arrangements listed for Category 1. Line (5) Category 3a - Capitated Payments Directly to Providers. There is a managed care credit of 60 percent for claims payments in this category, which includes:
* All capitation or percent of premium payments made directly to licensed providers. Enter the amount of claims payments paid DIRECTLY to licensed providers on a capitated basis. Line (6) Category 3b - Capitated Payments to Regulated Intermediaries. There is a managed care credit of 60 percent for claims payments in this category, which includes:
* All capitation or percent of premium payments to regulated intermediaries that in turn pay licensed providers. Enter the amount of medical expense capitations paid to regulated intermediaries (see Appendix 1 for definition). In those cases where the capitated regulated intermediary employs providers and pays them non-contingent salaries or otherwise qualifies for Category 4, the insurer may include that portion of such capitated payments in Category 4. Line (7) Category 3c - Capitated Payments to Non-Regulated Intermediaries. There is a managed care credit of 60 percent for claims payments in this category, which includes:
* All capitated or percent of premium payments to non-affiliated intermediaries that in turn pay licensed providers. (Subject to a 5 percent limitation on payments to providers or other corporations that have no contractual relationship with such intermediary. Amounts greater than the 5 percent limitation should be reported in Category 0).
Enter the amount of medical expense capitations paid to non-regulated intermediaries not affiliated with the reporting company. Do not include the amount of medical expense capitations paid to non-regulated intermediaries that are affiliated with the reporting company. These amounts should be reported in Category 0. Non-regulated intermediaries are those organizations which meet the definition of Intermediary but not regulated intermediary in Appendix 1. In cases where the capitated non-regulated intermediary (even if affiliated) employs providers and pays them non-contingent salaries or otherwise qualifies for Category 4, the insurer may include that portion of such capitated payments in Category 4. IN ORDER TO QUALIFY FOR ANY OF THE CAPITATION CATEGORIES, SUCH CAPITATION MUST BE FIXED (AS A PERCENTAGE OF PREMIUM OR FIXED DOLLAR AMOUNT PER MEMBER) FOR A PERIOD OF AT LEAST 12 MONTHS. Where an arrangement contains a provision for prospective revision within a 12-month period, the entire arrangement shall be subject to a managed care credit that is calculated under Category 1 for a provider, and for an intermediary at the greater of Category 1 or a credit calculated using the underlying payment method(s) to the providers of care. Where an arrangement contains a provision for retroactive
Attachment B

revisions either within or beyond a 12-month period, the entire arrangement shall be subject to a managed care credit that is calculated under Category 0 for providers and intermediaries. Line (8) Category 4 - Medical & Hospital Expense Paid as Salary to Providers. There is a managed care credit of 75 percent for claims payments in this category. Once claims payments under this managed care category are totaled, any fee for service revenue from uninsured plans (i.e., ASO or ASC) that was included on Line (7) in the underwriting risk section should be deducted before applying the managed care credit factor.
* Non-contingent salaries to persons directly providing care. * The portion of payments to affiliated entities which is passed on as non-contingent salaries to persons directly providing care where the entity has a contract
only with the company. * All facilities related medical expenses and other non-provider medical costs generated within health facility that is owned and operated by the insurer. * Aggregate cost payments.
Salaries paid to doctors and nurses whose sole corporate purpose is utilization review are also included in this category if such payments are classified as “medical expense” payments (paid claims) rather than administrative expenses. The Aggregate Cost method of reimbursement means where a health plan has a reimbursement plan with a corporate entity that directly provides care, where (1) the health plan is contractually required to pay the total operating costs of the corporate entity, less any income to the entity from other users of services; and (2) there are mutual unlimited guarantees of solvency between the entity and the health plan, that put their respective capital and surplus at risk in guaranteeing each other. Line (10.1) Category 0 for Stand-Alone Medicare Part D Coverage would be all claims during a period where neither the reinsurance coverage or risk corridor protection is provided. Line (10.2) Category 1 for Stand-Alone Medicare Part D Coverage would be for all claims during a period when only the reinsurance coverage is provided. This is designed for some future time period and is not to be interpreted as including employer-based Part D coverage that is not subject to risk corridor protection. Line (10.3) Category 2a for Stand-Alone Medicare Part D Coverage would be for all claims during a period when only the risk corridor protection is provided. Line (10.4) Category 3a for Stand-Alone Medicare Part D Coverage would be for all claims during a period when both reinsurance coverage and risk corridor protection are provided. Line (10.6) Total Paid Claims – The total of Column (1) paid claims should equal the total claims paid for the year as reported in Schedule H, Part 5, Columns 1 and 2, Line D16 of the annual statement. Line (11) Weighted Average Managed Care Discount – This amount is calculated by dividing the total weighted claims (Line (9) Column (2)) by the total claim payments (Line (9) Column (1). Line (12)
Attachment B

Weighted Average Managed Care Risk Adjustment Factor - This is the credit factor that is carried back to the underwriting risk calculation. They are one minus the Weighted Average Managed Care Discount (Line (11)). Lines (13) through (19) Lines (13) through (19) are the calculation of the weighted average factor for the Category 2 claims payments subject to withholds and bonuses/incentives. This table requires data from the PRIOR YEAR to compute the current year’s discount factor. Line (13) Enter the prior year’s actual withhold and bonus/incentive payments. Line (14) Enter the prior year’s withholds and bonuses/incentives that were available for payment in the prior year. Line (15) Divides Line (13) by Line (14) to determine the portion of withholds and bonuses/incentives that were actually returned in the prior year. Line (16) Equal to Line (14) and is automatically pulled forward. Line (17) Claims payments that were subject to withholds and bonuses/incentives in the prior year. Equal to Line (3) + Line (4) of Underwriting Risk–Managed Care Credit FOR THE PRIOR YEAR. Line (18) Divides Line (16) by Line (17) to determine the average withhold rate for the prior year. Line (19) Multiplies Line (15) by Line (18) to determine the discount factor for Category 2 claims payments in the current year, based on the performance of the insurer’s withhold/bonus/incentive program in the prior year.
Attachment B

HEALTH, LIFE AND PROPERTY AND CASUALTY
APPENDIX 1 – COMMONLY USED TERMS The Definitions of Commonly Used Terms are frequently duplicates from the main body of the text. If there are any inconsistencies between the definitions in this section and the definitions in the main body of the instructions, the main body definition should be used. Incentives, Withhold and Bonus Amounts – Are amounts to be paid to providers by the Health entity as an incentive to achieve goals such as effective management of care. An incentive arrangement may involve paying an agreed-on amount for each claim (e.g. provider agrees practice in an underserved area). While a bonus arrangement may be paid at the end of a contact period after specific goals have been met. Withhold arrangements can involve a set amount to be withheld from each claim, and then paying a portion (which could be none or all) of the withheld amount at the end of the contract period. Incentive pool, withhold, and bonus amounts are defined as: amounts to be paid to providers by the Health entity as an incentive to achieve goals such as effective management of care. Some arrangements involve paying an agreed-on amount for each claim, and then paying a bonus at the end of the contract period. Other arrangements involve a set amount to be withheld from each claim, and then paying a portion (which could be none or all) of the withheld amount at the end of the contract period.
Formatted: Font: Bold
Commented [BC1]: This could also be worded as “(e.g. provider is paid on a per claim basis for practicing in an underserved area.)”
Commented [BC2]: This is directly from the A/S instructions. It used as a basis for the definition drafted above.
Attachment B

HealthUNDERWRITING RISK - Managed Care Credit Calculation
(1) (2) (3) (4)Part D
Paid Weighted Weighted Managed Care Claims Payments Annual Statement Source Factor Claims Claims† Claims‡
(1) Category 0 - Arrangements not Included in Other Categories Exhibit 7, Part 1, Column 1, Line 5, in part § 0
(2) Category 1 - Payments Made According to Contractual Arrangements Exhibit 7, Part 1, Column 1, Line 6, in part § 0.150
(3) Category 2a - Subject to Withholds or Bonuses/Incentives - Otherwise CategoExhibit 7, Part 1, Column 1, Line 7, in part § *
(4) Category 2b - Subject to Withholds or Bonuses/Incentives - Otherwise CategoExhibit 7, Part 1, Column 1, Line 8, in part § *
(5) Category 3a - Capitated Payments Directly to Providers 0.600(5.1) Capitation Payments - Medical Group - Category 3a Exhibit 7, Part 1, Column 1, Line 1, in part § (5.2) Capitation Payments - All Other Providers - Category 3a Exhibit 7, Part 1, Column 1, Line 3, in part §
(6) Category 3b - Capitated Payments to Regulated Intermediaries Included in Exhibit 7, Part 1, Column 1, Line 2 § 0.600 $0
(7) Category 3c - Capitated Payments to Non-Regulated Intermediaries Included in Exhibit 7, Part 1, Column 1, Line 2 § 0.600 $0
(8) Category 4 - Medical & Hospital Expense Paid as Salary to Providers 0.750(8.1) Non-Contingent Salaries - Category 4 Exhibit 7, Part 1, Column 1, Line 9, in part §(8.2) Aggregate Cost Arrangements - Category 4 Exhibit 7, Part 1, Column 1, Line 10, in part §(8.3) Less Fee For Service Revenue from ASC or ASO Company Records
(9) Sub-Total Paid Claims Exhibit 7, Part 1, Column 1, Lines 13 - 11 - (8.3)- (12) - (13)
Stand-Alone Medicare Part D Coverage Claim Payments
(10) Category 0 - No Federal Reinsurance or Risk Corridor Protection Company Records XXX XXX XXX(11) Category 1 - Federal Reinsurance but no Risk Corridor Protection Company Records XXX XXX XXX(12) Category 2a - No Federal Reinsurance but Risk Corridor Protection Company Records 0.667(13) Category 3a - Federal Reinsurance and Risk Corridor Protection Apply Company Records 0.767
(14) Sub-Total Paid Claims Sum of Lines (10) through (13)
(15) Total Paid Claims Sum of Lines (9) and (14)
(16) Weighted Average Managed Care Discount(17) Weighted Average Managed Care Risk Adjustment Factor
† This column is for a single result for the Comprehensive Medical & Hospital, Medicare Supplement and Dental/Vision Managed Care Discount factor.‡ This column is for the Medicare Part D Managed Care Discount factor.§ Stand-Alone Medicare Part D business reported in Lines (12) and (13) would be excluded from these amounts.* The factor is calculated on page XR018.
Denotes items that must be manually entered on filing software.
Attachment B

Health (1)Annual Statement Source Amount
* Calculation of Category 2 Managed Care Factor(18) Withhold & Bonus/Incentive Payments, Prior Year Company Records(19) Withhold & Bonuses/Incentives Available, Prior Year Company Records(20) MCC Multiplier - Average Withhold Returned [Line (18)/(19)](21) Withholds & Bonuses/Incentives Available, Prior Year Company Records(22) Claims Payments Subject to Withhold, Prior Year Company Records(23) Average Withhold Rate, Prior Year [Line (21)/(22)](24) MCC Discount Factor, Category 2 Min{.25,[Lines (20) x (23)]}
* The factor is pulled into Lines (3) and (4) on page XR017. Denotes items that must be manually entered on filing software.
Attachment B

LifeUNDERWRITING RISK – MANAGED CARE CREDIT
(2) (3) (4)Part D
Paid Weighted WeightedComprehensive Medical, Medicare Supplement and Dental Claim Payments Annual Statement Source Claims Factor Claims* Claims**
(1) Category 0 - Arrangements not Included in Other Categories Company records X 0.000 =(2) Category 1 - Payments Made According to Contractual Arrangements Company records X 0.150 =(3) Category 2a - Subject to Withholds or Bonuses/Incentives – Otherwise Category 0 Company records X † =(4) Category 2b - Subject to Withholds or Bonuses/Incentives – Otherwise Category 1 Company records X ‡ =(5) Category 3a - Capitated Payments Directly to Providers Company records X 0.600 =(6) Category 3b - Capitated Payments to Regulated Intermediaries Company records X 0.600 =(7) Category 3c - Capitated Payments to Non-Regulated Intermediaries Company records X 0.600 =(8) Category 4 - Medical & Hospital Expense Paid as Salary to Providers Company records X 0.750 =
(9) Subtotal Paid Claims Sum of Lines (1) through (8)
Stand-Alone Medicare Part D Coverage Claim Payments
(10) Category 0 - No Federal Reinsurance or Risk Corridor Protection Company records XXX X xxx = XXX(11) Category 1 - Federal Reinsurance but no Risk Corridor Protection Company records XXX X xxx = XXX(12) Category 2a - No Federal Reinsurance but Risk Corridor Protection Company records X 0.667 =(13) Category 3a - Federal Reinsurance and Risk Corridor Protection apply Company records X 0.767 =
(14) Subtotal Stand-Alone Medicare Part D Paid Claims Sum of Lines (10) through (13)
(15) Total Paid Claims Line (9) + Line (14)
(16) Weighted Average Managed Care Discount Column (3) = Column (3) Line (9) / Column (2) Line (9)Column (4) = Column (4) Line (14) / Column (2) Line (14)
(17) Weighted Average Managed Care Risk Adjustment Factor 1.0 - Line (16) (1)
Calculation of Category 2 Managed Care Factor (Comprehensive Medical and Dental only) Amount
(18) Withhold & bonus/incentive payments, prior year Company Records(19) Withhold & bonuses/incentives available, prior year Company Records(20) Managed Care Credit Multiplier – average withhold returned Line (18) / Line (19)(21) Withholds & bonuses/incentives available, prior year Line (19)(22) Claims payments subject to withhold, prior year Company Records(23) Average withhold rate, prior year Line (21) / Line (22)(24) Managed Care Credit Discount Factor, Category 2 Minimum of 0.25 or
Line (20) x Line (23)
† Category 2 Managed Care Factor calculated on Line (24).‡ Category 2 Managed Care Factor calculated on Line (24) with a minimum factor of 15 percent.* This column is for a single result for the Comprehensive Medical & Hospital, Medicare Supplement and Dental managed care discount factor.** This column is for the Stand-Alone Medicare Part D managed care discount factor.
Denotes items that must be manually entered on the filing software.
Attachment B

Property/CasualtyUNDERWRITING RISK - MANAGED CARE CREDIT PR021
(2) (3) (4)Part D
Comprehensive Medical, Medicare Supplement and Dental & Vision Paid Weighted WeightedClaim Payments Annual Statement Source Claims Factor Claims† Claims††
(1) Category 0 - Arrangements not Included in Other Categories Company records 0 0.000 0(2) Category 1 - Payments Made According to Contractual Arrangements Company records 0 0.150 0(3) Category 2a - Subject to Withholds or Bonuses/Incentives – Otherwise Category 0Company records 0 * 0(4) Category 2b - Subject to Withholds or Bonuses/Incentives – Otherwise Category 1Company records 0 ** 0(5) Category 3a - Capitated Payments Directly to Providers Company records 0 0.600 0(6) Category 3b - Capitated Payments to Regulated Intermediaries Company records 0 0.600 0(7) Category 3c - Capitated Payments to Non-Regulated Intermediaries Company records 0 0.600 0(8) Category 4 - Medical & Hospital Expense Paid as Salary to Providers Company records 0 0.750 0
(9) Sub-Total Paid Claims Sum of Lines (1) through (8) 0 0
Stand-Alone Medicare Part D Coverage Claim Payments
(10.1) Category 0 - No Federal Reinsurance or Risk Corridor Protection Company records XXX XXX XXX(10.2) Category 1 - Federal Reinsurance but no Risk Corridor Protection Company records XXX XXX XXX(10.3) Category 2a - No Federal Reinsurance but Risk Corridor Protection Company records 0 0.667 0(10.4) Category 3a - Federal Reinsurance and Risk Corridor Protection apply Company records 0 0.767 0
(10.5) Sub-Total Paid Claims Sum of Lines (10.1) through (10.4) 0 0
(10.6) Total Paid Claims Sum of Lines (9) and (10.5) 0
(11) Weighted Average Managed Care Discount Col (3) = Col (3) Line (9) / Col (2) Line (9) 0.000 0.000Col (4) = Col (4) Line (10.5) / Col (2) Line (10.5)
(12) Weighted Average Managed Care Risk Adjustment Factor Col (3) = 1.0 - Col (3) Line (11) 0.000 0.000 Col (4) = 1.0 - Col (4) Line (11)
(1)Calculation of Category 2 Managed Care Factor Amount
(13) Withhold & bonus/incentive payments, prior year Company Records 0(14) Withhold & bonuses/incentives available, prior year Company Records 0(15) Managed Care Credit Multiplier – average withhold returned Line (13) / Line (14) 0.000(16) Withholds & bonuses/incentives available, prior year Line (14) 0(17) Claims payments subject to withhold, prior year Company Records 0(18) Average withhold rate, prior year Line (16) / Line (17) 0.000(19) Managed Care Credit Discount Factor, Category 2 Minimum of 0.25 or
Line (15) x Line (18) 0.000* Category 2 Managed Care Factor calculated on Line (19)**Category 2 Managed Care Factor calculated on Line (19) with a minimum factor of 15 percent.† This column is for a single result for the Comprehensive Medical & Hospital, Medicare Supplement and Dental managed care discount factor.†† This column is for the Stand-Alone Medicare Part D managed care discount factor. Denotes items that must be manually entered on the filing software.
Attachment B