health practitioner bonuses and their impact on the
TRANSCRIPT

Health Practitioner Bonuses and Their Impact on the Availability and Utilization of Primary Care Services
Final Report
Prepared for Assistant Secretary for Planning and Evaluation Department of Health and Human Services
Submitted by The Lewin Group
January 2015
Health Practitioner Bonuses and Their Impact on the Availability and Utilization
of Primary Care Services
Final Report
Prepared for
Assistant Secretary for Planning and Evaluation Department of Health and Human Services
Submitted by
The Lewin Group Inc
January 2015
Final Report Health Practitioner Bonuses
Table of Contents
Executive Summary1
Overview 1
Key Findings 2
1 Impact of the Medicare Incentive Payment for Primary Care Providers (PCIP) 2
2 Impact of the Physician Shortage Area (PSA) bonus 43 Impact of the Health Professional Shortage Area (HPSA) Bonus 4
Conclusions 4
Introduction and Purpose Of The Study5
Literature Review 7
A Effect of Earnings on the Supply of Primary Care Services and Providers Role of Medicare Primary Care Bonuses 8
1 Effects of Earnings on Specialty Choice by Physicians 92 Effects of Earnings on Labor Supply of Health Care Workforce13
3 Effects of Earnings on the Volume of Primary Care Services14B Financial Incentives for Primary Care Providers in Underserved Areas 15
C Impact of the Increase in Medicaid Reimbursement Rate Relative to the Medicare Rate 18
1 Systemic Change in Medicaid Reimbursement Rates in All States 182 State-specific Experience on Changes in Medicaid Reimbursement Rates 20
Conclusions 21
Modeling the Impact of Medicare Incentive Payment for Primary Care Providers 22
A Study Design Overview 22
B Data Sources and Variables 24
1 Main Data Sets 24
2 Trends in Key Outcome Variables 24C Econometric Framework 30
D Main Results 31
1 Impact of PCIP Policy on Number of Eligible Providers33
2 Impact of PCIP Policy on Number of Claims for EampM Services 373 Impact of PCIP Policy on Allowed Charges for EampM Services 39
Analyzing the Impact of Financial Incentives for Primary Care Providers in Shortage Areas43
A Background 43
B Impact of the PSA Bonus on Primary Care Supply 46
C Impact of the HPSA Bonus on Primary Care Supply 49
Modeling the Impact of the Increase in Medicaid Reimbursement Rate Relative to the Medicare Rate53
A Study Design Overview 53
B Simulation Exercise 57
i
Final Report Health Practitioner Bonuses
Conclusions 59
Appendices 62
Appendix A Bibliography and Literature Matrix 62
Appendix B Additional Exhibits71
Additional Regression Results 78
Appendix C Differenceshyinshydifference (DID) Methodology80
C1 DID model and derivation for estimating the impact of PCIP policy 80
C2 DID model and derivation for estimating the impact of HPSA bonus 80
Appendix D Simulation Methodology83
Method of Calculating the Predicted Proportion of Officeshybased Physicians Accepting New Medicaid Patience as a Function of the MedicaidshytoshyMedicare Fee Index 83
Table of FiguresExhibits
Exhibit 1 Number of Physicians in Residency Programs 9Exhibit 2 Summary of Responsiveness of Specialty Choice to Changes in Earnings
(Earnings Elasticity) 12Exhibit 3 Number of PCIP Recipients under Medicare by Specialty 2011shy2012 23Exhibit 4 Number of Primary Care Providers under Medicare by Specialty 2005shy2011 25Exhibit 5 Total Number of PCIP Eligible EampM Claims submitted by All PCPs under
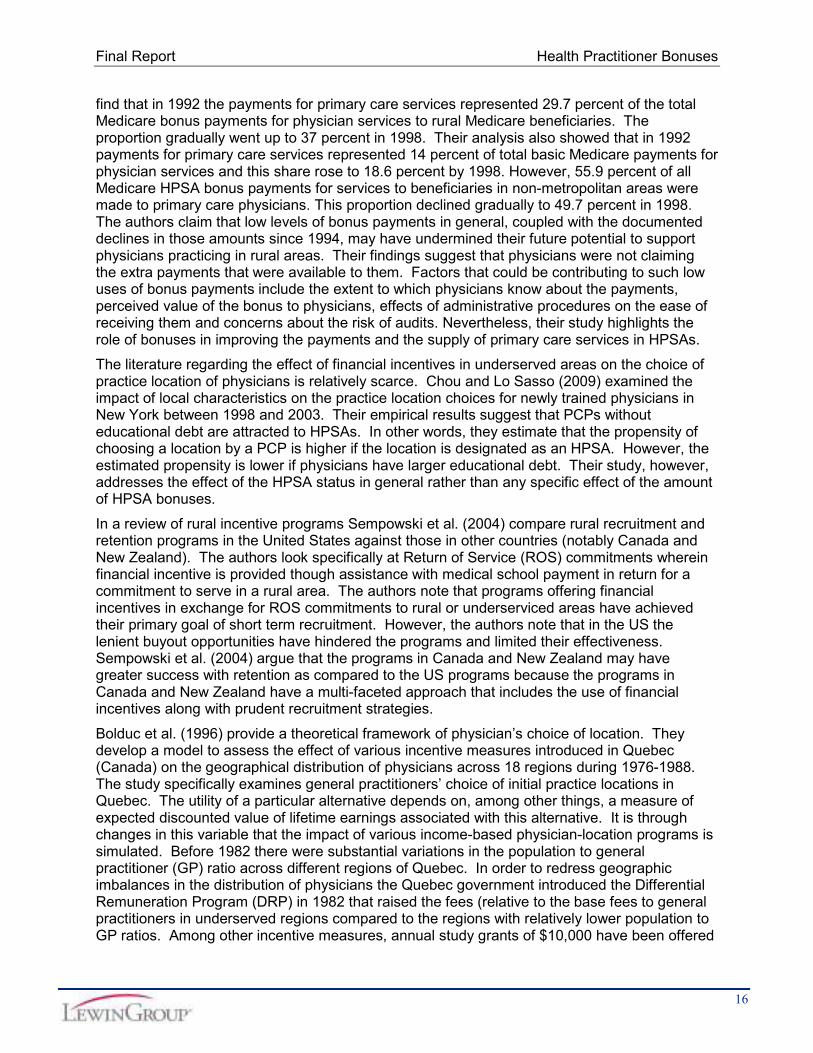
Medicare by PCP Specialty 2005shy2011 26Exhibit 6 Average Number of PCIP Eligible EampM Claims per PCP under Medicare by
Specialty 2005shy2011 27Exhibit 7 Total Allowed Charges (in million $) for the PCIP Eligible EampM Claims submitted
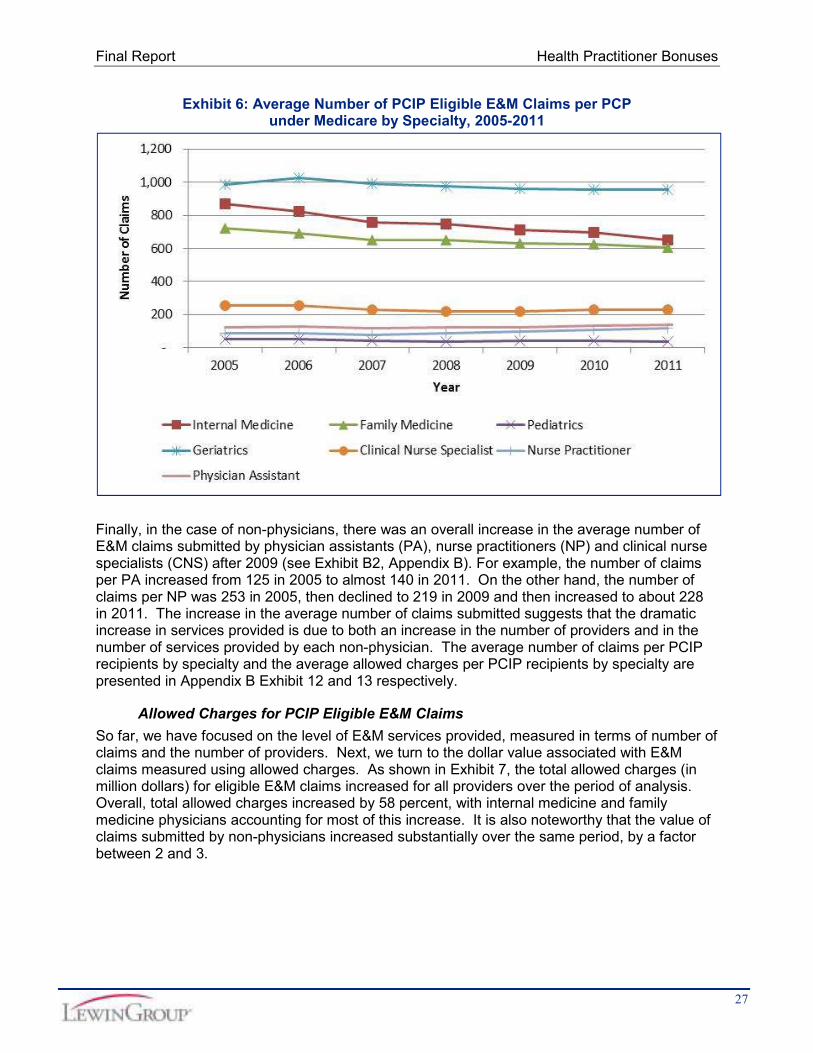
by All PCPs under Medicare 2005shy2011 28Exhibit 8 Average Allowed Charges ($) for the PCIP Eligible EampM Claims per PCP under
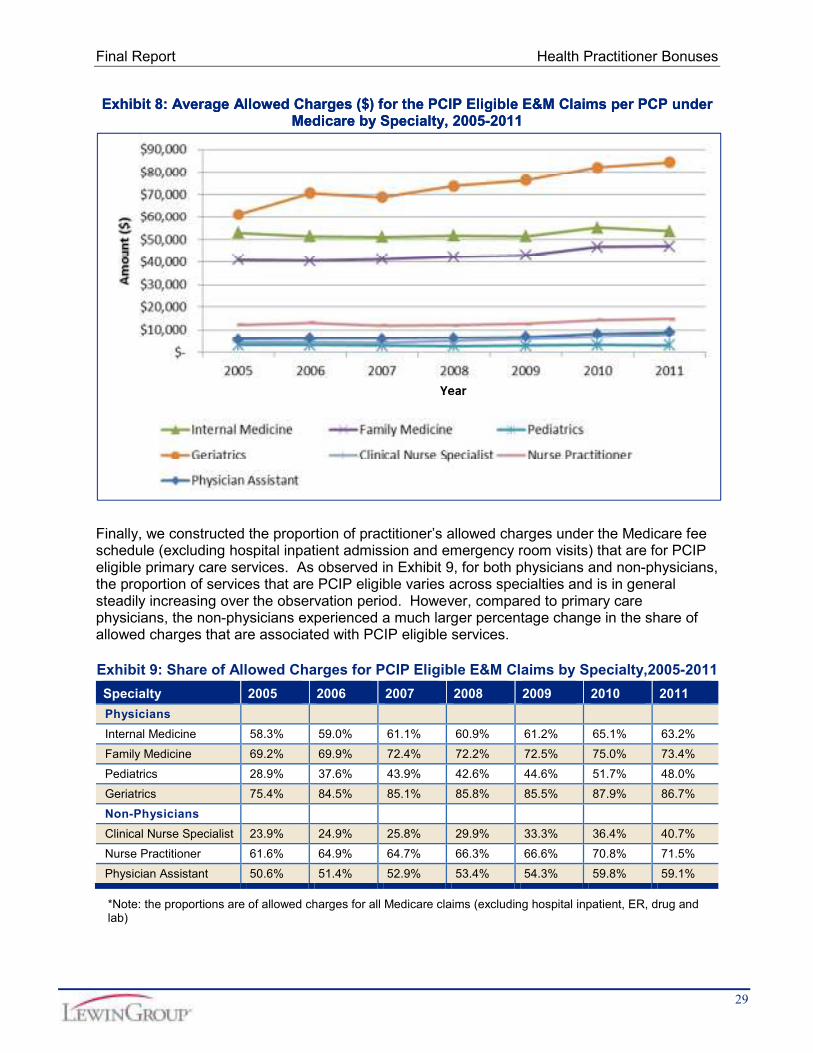
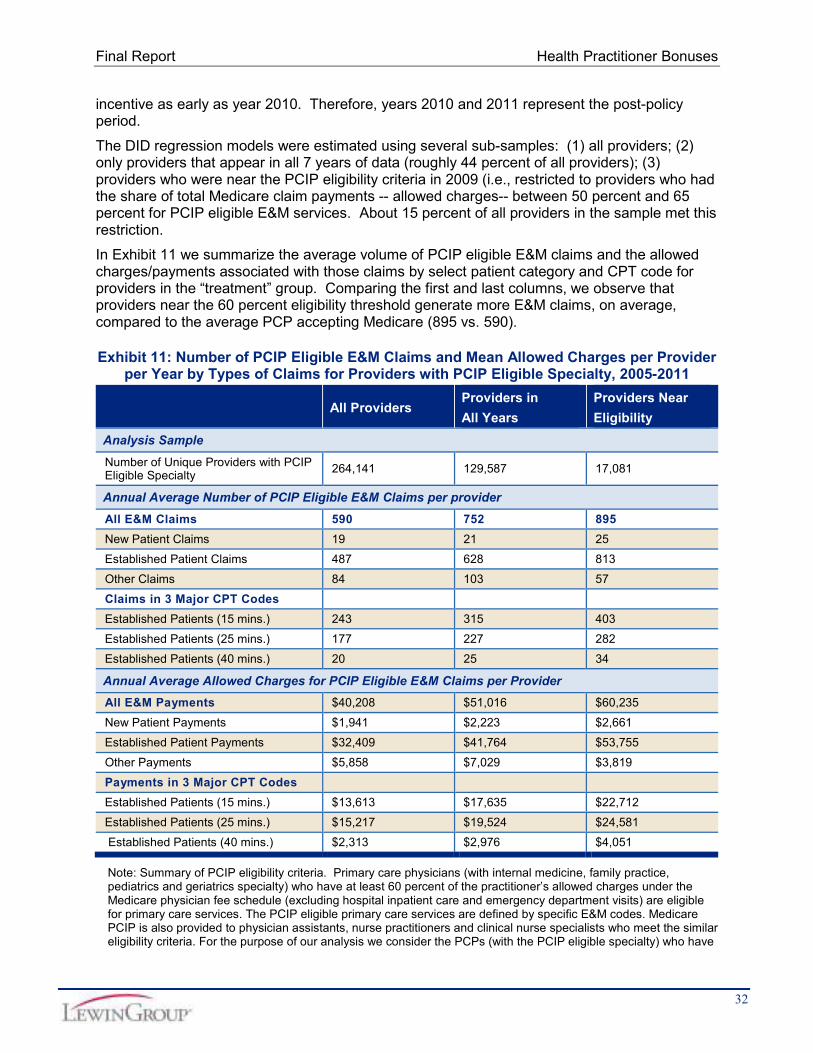
Medicare by Specialty 2005shy2011 29Exhibit 9 Share of Allowed Charges for PCIP Eligible EampM Claims by Specialty2005shy2011 29Exhibit 10 Share of PCIP Eligible EampM Claims by Specialty 2005shy2011 30Exhibit 11 Number of PCIP Eligible EampM Claims and Mean Allowed Charges per Provider
per Year by Types of Claims for Providers with PCIP Eligible Specialty 2005shy2011 32
Exhibit 12 Number of PCIP Eligible EampM Claims and Mean Allowed Charges per Providerper Year by Types of Claims for Providers with PCIP NonshyEligible Specialty 2005shy2011 33
Exhibit 13 Impact of Medicare PCIP on the Number of PCPs with Medicare Claims for PCIPEligible Services (2005shy2011) 34
Exhibit 14 Impact of Medicare PCIP on the Number of Providers Accepting New Medicare Patients and the Number of New Primary Care Providers under Medicare with Claims for PCIP Eligible Services (2005shy2011) 36
Exhibit 15 Impact of Medicare PCIP Policy on PCIP Eligible EampM Claims (2005shy2011) 38Exhibit 16 Impact of Medicare PCIP Policy on Allowed Charges for PCIP Eligible EampM
Claims (2005shy2011) 39Exhibit 17 Estimated Impact of Medicare PCIP Policy on the Number of PCIP Eligible EampM
Claims (2005shy2011) 41
ii
Final Report Health Practitioner Bonusesshy
Exhibit 18 Estimated Impact of Medicare PCIP on the Allowed Charges for PCIP Eligible EampM Claims (2005shy2011) 42
Exhibit 19 Distribution of Primary Care (PC) Providers by HPSA and PSA Regions 45Exhibit 20 Distribution of the Number of Internal Medicine and Family Practice Physicians
by HPSA and PSA regions 46Exhibit 21 Impact of PSA Bonus on the Number of EampM Claims under Medicare 2005shy
2010 48Exhibit 22 Impact of PSA Bonus on the Number of Primary Care Providers per County
(2005shy2010) 49Exhibit 23 Impact of HPSA Bonus on the Number of EampM Claims and Allowed Charges per
Physician under Medicare 2007shy2010 51Exhibit 24 MedicaidshytoshyMedicare Fee Index 55Exhibit 25 Proportion of US Officeshybased Physicians Accepting New Medicaid Patients 57Literature Matrix 66Exhibit B1 Distribution of Primary Care Providers with PCIP Eligible Specialty by Age Sex
and Year 71Exhibit B2 Average Number of PCIP Eligible EampM Claims per PCP under Medicare by
Specialty 2005shy2011 71Exhibit B3 Average Allowed Charges ($) for the PCIP Eligible EampM Claims per PCP under
Medicare 2005shy2011 72Exhibit B4 Proportion of PCIP Eligible EampM Claims per 2011 PCIP Recipients by Specialty
2005shy2011 72Exhibit B5 Average Number of PCIP Eligible EampM Claims per 2011 PCIP Recipients under
Medicare by Specialty 2005shy2011 72Exhibit B6 Average Allowed Charges for the PCIP Eligible EampM Claims per 2011 PCIP
Recipients under Medicare 2005shy2011 73Exhibit B7 Proportion of Allowed Charges for PCIP Eligible EampM Claims per 2011 PCIP
Recipients 2005shy2011 73Exhibit B8 Distribution of the Number of NPs and PAs across HPSA and PSA regions 74Exhibit B9a Distribution of Male Primary Care Physicians with PCIP Eligible Specialty by
Age and Year 74Exhibit B9b Distribution of Female Primary Care Physicians with PCIP Eligible Specialty by
Age and Year 75Exhibit B10 Distribution of Male Primary Care NonshyPhysicians with PCIP Eligible Specialty
by Age and Year 75Exhibit B11 Distribution of Female Primary Care NonshyPhysicians with PCIP Eligible
Specialty by Age and Year 76Exhibit B12 Average Number of PCIP Eligible EampM Claims Submitted by 2011 PCIP
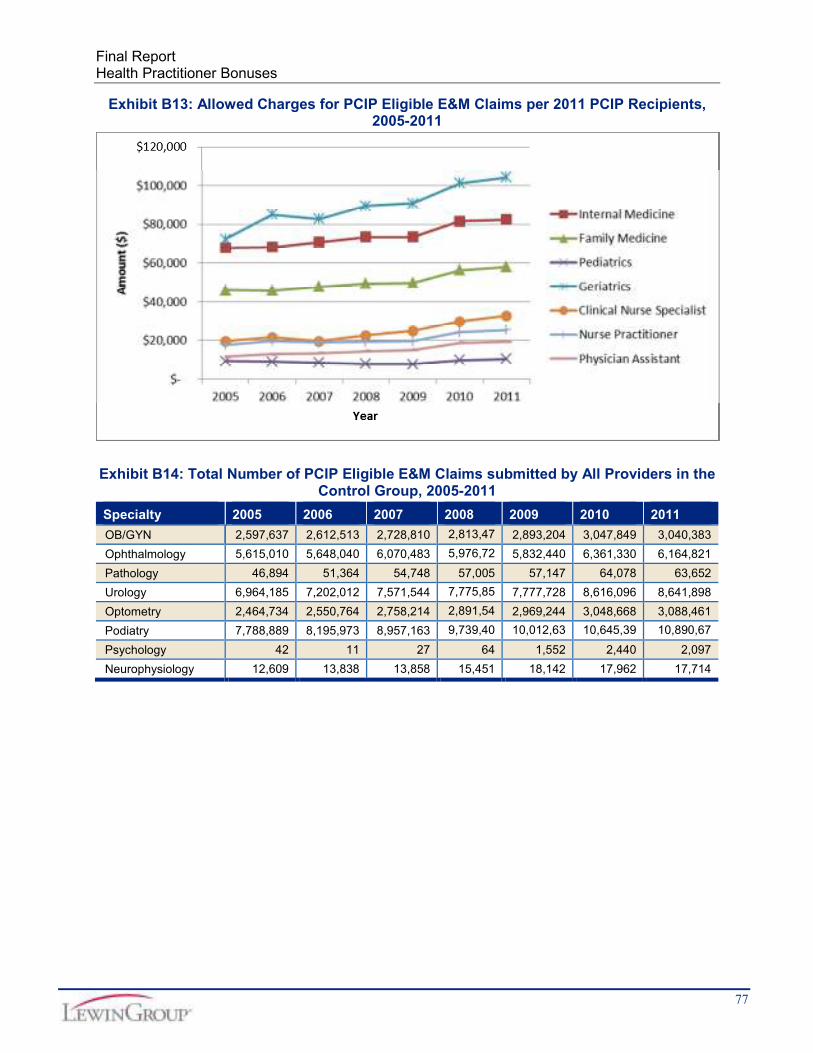
Recipients 2005 ndash 2011 76Exhibit B13 Allowed Charges for PCIP Eligible EampM Claims per 2011 PCIP Recipients
2005shy2011 77Exhibit B14 Total Number of PCIP Eligible EampM Claims submitted by All Providers in the
Control Group 2005shy2011 77Exhibit B15 Impact of Medicare PCIP Policy on the Number of Primary Care Providers Who
Have submitted any Medicare Claims (not necessarily under PCIP Eligible Services) (2005shy2011) 78
Exhibit B16 Impact of Medicare PCIP Policy on the Number of Primary Care Providers WhoMet 60 PCIP Eligibility Threshold Each Year (2005shy2011) 79
iii
Final Report Health Practitioner Bonuses
Acknowledgments Paul Hogan Brighita Negrusa PhD and Projesh Ghosh PhD contributed to this report We benefited greatly from discussions with members of our technical expert panel We also gratefully acknowledge the input from Caroline Taplin the ASPE Project Officer and her colleague Donald Cox This study was conducted by The Lewin Group under contract number HHSP23320095639WC task order number HHSP23337019T with the HHSrsquos Office of the Assistant Secretary for Planning and Evaluation The authors take full responsibility for the accuracy of material presented herein The views expressed are those of the authors and should not be attributed to ASPE or HHS
iv
Final Report Health Practitioner Bonuses
Executive Summary
Overview
In this study funded by The Assistant Secretary for Planning and Evaluation (ASPE) we analyze the impact of three different health practitioner incentives on the supply of primary care services (1) the Medicare primary care incentive payment (PCIP) (2) the physician shortage area (PSA) bonus and (3) the health professional shortage area (HPSA) bonus Section 5501(a) of The Affordable Care Act authorized a quarterly incentive payment program to augment the Medicare payment for primary care services when furnished by primary care practitioners beginning in 2011 and ending in 2015 Medicare has been paying a HPSA bonus since 1987 Initially the HPSA bonus was paid to physicians providing care in rural geographic HPSAs in 1991 it was extended to services provided by physicians in urban geographic HPSAs Subsequently section 413a of the Medicare Modernization Act put in place an additional 5 percent bonus payment for physicians practicing in PSAs PSAs were those counties and rural zip codes in MSAs with the lowest physician to population ratios The purpose of these incentives is to increase the supply of provider services both in general and for evaluation and management (EampM) in particular In the case of the PCIP it is to increase the supply of primary care services in Medicare In the case of the PSA and HPSA bonuses it is to increase the supply of services in certain locations designated as underserved
We first consider the PCIP program Under the PCIP program eligible providers in designated primary care specialties are offered a 10 percent reimbursement premium for primary care services The study addresses the following broad empirical issues surrounding the Medicare PCIP program
Experience to date with the Medicare primary care incentive payment in terms of the aggregate number of recipients and the distribution of those recipients by specialty and by geographic area
Proportion of primary care providers who qualify for the bonus and the characteristics of those primary care providers
Volume of eligible claims submitted by the PCIP eligible providers and the impact of Medicare PCIP policy on the primary CARE services provided and other outcome measures of interest
To explore these topics we used a customized data set constructed at the provider level This data set included all the claims submitted by the entire universe of Medicare providers each year from 2005 to 2011 Subsequently each provider was linked by National Provider Identification number (NPI) to Provider360 data (available from Lewin Grouprsquos parent company Optum Inc) and the AMA Physician Master File to add provider characteristics such as provider demographics (eg age gender) provider designation medical school and practice location We also added geographic locationshyspecific variables from the Area Resource File (ARF) based on the practice location information of providers The main advantage of this pooled data set is the ability to track providers over time and capture changes in their volume of services in response to financial incentives
We use a differenceshyinshydifference (DID) approach to identify the effect of the financial incentives associated with the Medicare PCIP policy on key outcomes of interest This method entails (1) inclusion of a treatment group which is likely to be affected by the PCIP policy and a relevant comparison group not likely to be affected by the policy (2) controls for yearshyspecific effects
1
Final Report Health Practitioner Bonuses
common to both groups and (3) an interaction of the treatment group and the year effects to capture the distinct impact of the policy on the treatment group The model also controls for provider demographics and regional characteristics One advantage of the DID estimation approach is that it enables us to disentangle the net impact of the 10 percent PCIP policy from changes that coincided with the PCIP policy affecting both the treatment and comparison group
Policy makers have long been concerned about patient access to health care particularly primary care in underserved or shortage areas We also focus on two additional financial incentive programs Health Professionals Shortage Area (HPSA) bonus and Physician Shortage Area (PSA) bonus implemented in an attempt to improve access in shortage areas These programs offer a higher rate of reimbursement in Medicare for eligible providers should they provide services in designated shortage areas More specifically we examine the following issues surrounding HPSA and PSA bonus
The distribution of HPSA bonus recipients the overlap between HPSA and Medicare primary care incentive payment (PCIP) and the overlap between the HPSA and PSA bonus recipients
Impact of HPSA bonus on the number of primary care providers and subsequent impact on the volume of primary care services
Impact of PSA bonus on the number of primary care physicians and subsequent impact on the volume of primary care services
Finally we examine the existing evidence from the literature on the variation in Medicaid reimbursement rates relative to the Medicare rates to inform the impact of the Medicaid parity provision in the ACA We describe the variation in Medicaid reimbursement rates relative to the Medicare rates both for primary care and for all services across US states during the period 2008shy2012 Based on the empirical results from the PCIP analysis we perform an exercise to simulate the effect of a 10 percent increase in the MedicaidshytoshyMedicare fee index on the proportion of US officeshybased physicians accepting new Medicaid patients across all states
Key Findings
1 Impact of the Medicare Incentive Payment for Primary Care Providers (PCIP)
Number of Medicare Providers
Our estimates suggest that the number of Medicare providers with a PCIP bonusshyeligible specialty and at least one PCIP eligible claim increased annually by about 28 providers per county per year due to the Medicare PCIP bonus policy This represents a sizeable increase of almost 19 percent since there were about 15 providers per county per specialty per year under a PCIP bonus eligible specialty during the 2005shy2011 period When restricted to primary care physicians with a PCIP eligible specialty the estimated increase in the number of physicians is approximately 10 percent in response to the PCIP policy (ie elasticity of the number of primary care physicians with respect to the payment is about 1)1
1 The increase in the number of physicians with a PCIP eligible specialty attributable to the policy is about 2 per
county per year This is almost 10 percent of the average number of primary care physicians in a given PCIP eligible specialty per county per year (average is almost 19) Therefore given that PCIP policy provides 10
2
Final Report Health Practitioner Bonuses
Evaluation amp Management (EampM) Eligible Claims
The estimated impact of the PCIP policy on the volume of primary care services measured by the volume of claims is somewhat mixed
More specifically there were more PCIP eligible EampM claims submitted per provider in a particular claim type 25 minute office visits for established patients Specifically on average there was a 7 percent increase in the number of 25 minute office visits claims due to the PCIP policy Thus the implied elasticity of the number of 25 minute office visits with respect to the incentive payment is about 07 Hence it appears that the PCIP may have induced a substitution toward slightly longer visits for established patients
For PCIP eligible EampM claims in general the estimates from the DID model indicate that on average primary care providers with PCIPshyeligible specialties submitted fewer claims (per provider per year) related to PCIPshyeligible EampM services in response to the Medicare PCIP policy23
The positive impact of the PCIP bonus policy on the volume of EampM claims associated with 25 minute office visits for established patients is much stronger for providers near the PCIP eligibility threshold4 For the primary care providers near the PCIP eligibility threshold there was almost a 15 percent increase in the number of claims for 25 minute visits due to the PCIP policy
Allowed Charges for EampM Services
We estimated no significant incentive payment impact on allowed charges per provider for the full sample of providers However for the sample of providers who were near the PCIP eligibility threshold in 20095 we found that per provider charges increased by about $5611 annually in response to the policy This estimated effect represents about 93 percent of the mean allowed charges ($60235) per provider per year (ie the implied elasticity of allowed charges which do not include the bonus payment with respect to the payment is about 093)
percent incentive payment the implied elasticity of the number of physicians in PCIP eligible specialty with respect to the payment is about 1
2 Not all primary care providers are eligible for Medicare primary care incentive payments In summary primary care
physicians (with internal medicine family practice pediatrics and geriatrics specialty) who have at least 60 percent of the practitionerrsquos allowed charges under the Medicare physician fee schedule (excluding hospital inpatient care and emergency department visits) are for primary care services The PCIP eligible primary care services are defined by specific EampM codes Medicare PCIP is also provided to physician assistants nurse practitioners and clinical nurse specialists who also meet the similar eligibility criteria
3 Note that total eligible claims increased Claims per provider declined potentially because additional providers
were induced to submit eligible claims 4
For the purpose of our analysis we consider the primary care physicians (with the PCIP eligible specialty) who have 50 percentshy65 percent of their services for PCIP eligible EampM services (defined by specific EampM codes) to be near the eligibility threshold We apply the similar method to select nonshyphysicians (physician assistants nurse practitioners and clinical nurse specialists) near the eligibility threshold
5 The determination of the eligibility of providers in the first year (2011) of the PCIP is based on the extent of their
PCIP eligible services in 2009 Besides the announcement of the PCIP program was made in 2010 Thus we assumed that the providers with Medicare PCIP eligible specialties would be potentially responsive to the PCIP program as early as year 2010 and alter their behavior Subsequently it is more meaningful to examine providers who were near the PCIP eligibility threshold in 2009 which is the year just before the policy effect is expected to influence
3
Final Report Health Practitioner Bonuses
2 Impact of the Physician Shortage Area (PSA) bonus
Number of Medicare Providers
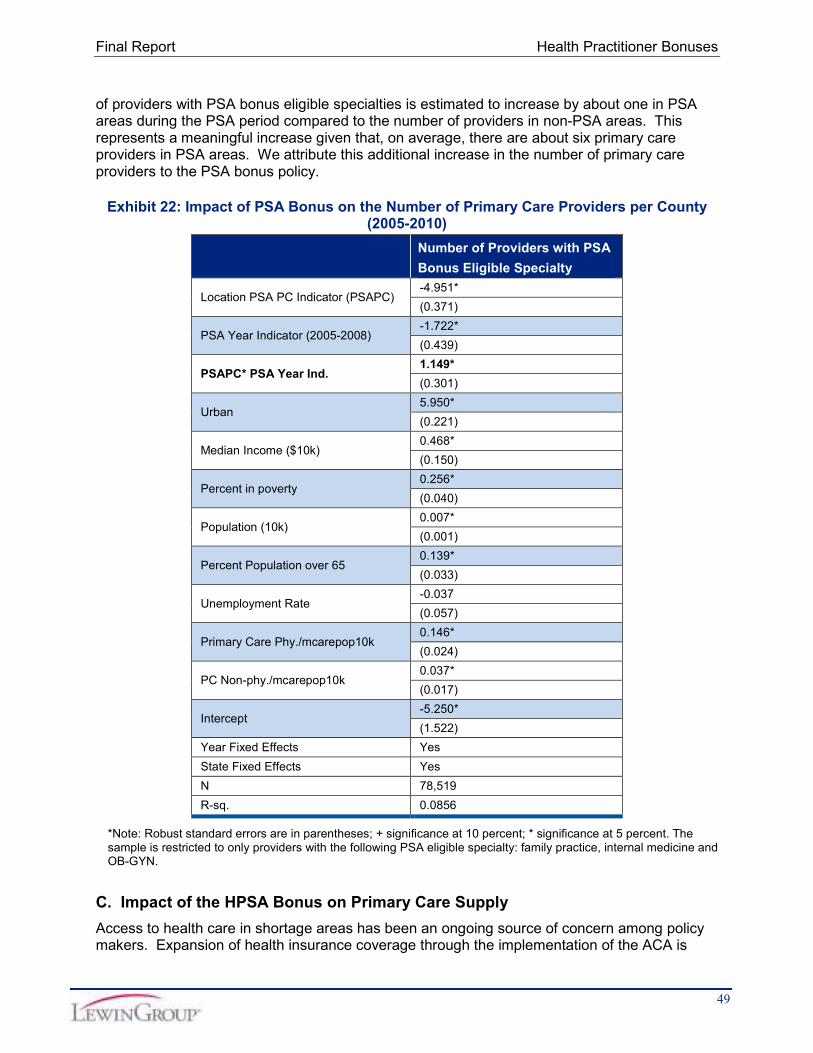
The number of providers with PSA bonusshyeligible specialties was estimated to increase by about 1 in PSA areas during the PSA period compared to the number of providers in nonshyPSA areas This represents a sizeable increase as there were about 6 primary care providers on average in PSA areas
EampMshyEligible Claims
We found that on average physicians with bonusshyeligible specialties who were located in PSA areas were estimated to have about 50 more claims submitted per year during the PSA period compared to providers with the same specialty who were located in nonshyPSA areas Given that these physicians have on average about 644 claims per year for primary care EampM services the impact of PSA bonus is not negligible
Allowed Charges for EampM Services
Our estimates indicate that on average physicians with PSA bonusshyeligible specialties located in PSA areas did not experience a statistically significant increase in total annual allowed charges per provider per year for EampM services compared to those in nonshyPSA
6 areas
3 Impact of the Health Professional Shortage Area (HPSA) Bonus
EampM Eligible Claims
We focused only on the behavior of primary care physicians who are eligible for a HPSA bonus We found that on average Medicare primary care physicians tend to submit about 17 more EampM claims annually specifically due to the gain of full HPSA status7
Allowed Charges for EampM Services
Medicare primary care physicians who are located in counties that ever lost primary care HPSA status tend to have about $1380 more allowed charges annually before the location lost full HPSA status
Conclusions
The Affordable Care Act includes two key provisions regarding reimbursement to primary care providers ) (a) it provides a 10 percent incentive payment under the Medicare PCIP program to eligible providers (effective January 1 2011) and (b) it raises the Medicaid primary care reimbursement rate at least up to 100 percent of the Medicare rate
We find that as a result of the Medicare incentive payment the number of Medicare PCPs has increased on average by about 28 providers per county annually in 2010 and 2011 Also the number of primary care physicians with PCIP eligible specialty increased by about 10 percent in
6 Although the number of EampM claims went up due to the PSA bonus it may be that within EampM services some
services experienced an increase in allowed charges due to the PSA bonus while others experienced a decrease accounting for the overall lack of impact
7 Health Resource and Services Administration (HRSA) publishes Area Health Resource File (ARF) that includes
HPSA status for each county within the US For the purpose of our analysis we focus on primary care HPSA status The ARF data classifies counties as full primary care HPSA if the whole county is considered as a HPSA
4
Final Report Health Practitioner Bonuses
response to the 10 percent incentive payment under the PCIP policy (ie elasticity of the number of primary care physicians with respect to the incentive payment is about 1) Eligible claims for some types of PCIP eligible EampM services and associated allowed charges have also increased For example on average there was a 7 percent increase in the number of claims for 25 minute office visits due to the PCIP policy On the other hand in response to the PCIP policy there was a 93 percent increase in the average allowed charges (for eligible services) among primary care providers with PCIP eligible specialties
The reader should exercise some caution in interpreting these results however The behavioral response to the PCIP was observed in our data only for one year The relatively short period may have resulted in insufficient time for a full provider behavioral response In addition the legislation provided for a program of only limited duration Some providers may have chosen explicitly or implicitly not to change their behavior for a program of limited duration
In addition we find that Medicare providers were attracted to PSA areas through the PSA bonus and submitted 78 percent more EampM claims annually during the PSA period Gaining HPSA status also generated an additional 17 EampM claims submitted by primary care physicians with HPSA bonusshyeligible specialties
The reader is again encouraged to exercise some caution in interpreting the results for the PSA bonus Because the criteria for the bonus include the actual supply of providers there is a risk that the results may be biased Though the methods we employ attempt to minimize the potential impact of this type of bias we cannot be completely sure that the results are unaffected by this
Finally we document the variation in Medicaid reimbursement rates relative to the Medicare rates both for primary care and for all services across US states during the period 2008shy2012 using the existing body of evidence Using the empirical results from our PCIP analysis we also perform an exercise to simulate the effect of a 10 percent increase in the MedicaidshytoshyMedicare fee index on the proportion of US officeshybased physicians accepting new Medicaid patients across all states The simulation suggests that a 10 percent increase in MedicaidshytoshyMedicare fee ratio would increase the US average of officeshybased primary care physicians accepting new Medicaid patients from 662 percent to 728 percent Again however caution is warranted in a literal interpretation of this result as it is based on an extrapolation from a different program
Introduction and Purpose Of The Study The Assistant Secretary for Planning and Evaluation (ASPE) has contracted with The Lewin Group to examine the role of physician bonus and supplemental payment programs in increasing the supply of primary care providers (PCP) and the access of patients to their services
The Congressional Budget Office has estimated that the implementation of the Patient Protection and Affordable Care Act (ACA) of 2010 will increase the number of nonelderly people who have health insurancemdashby about 13 million in 2014 20 million in 2015 and 25 million in each of the subsequent years through 2024 (CBO 2014)8 Because those with insurance typically use more services than those without insurance this increase in coverage will most likely result in additional pressure on a health care delivery system9 To address
8 CBO Report (February 2014) httpwwwcbogovsitesdefaultfilescbofilesattachments45010shybreakoutshy
AppendixBpdf 9
Manning WG Newhouse JP Duan N Keeler EB Benjamin B Liebowitz A et al (1988) Health insurance and the demand for medical care Evidence from a randomized experiment Santa Monica CA RAND Corporation
5
Final Report Health Practitioner Bonuses
concerns about maintaining an adequate supply and distribution of primary care services the ACA includes provisions that provide temporary financial incentives to primary care providers
1 Section 5501 provides that from January 1 2011 through December 31 2015 under Medicare eligible primary care practitioners will receive a 10 percent supplemental payment for primary care services they provide as defined by existing Evaluation and Management (EampM) codes under the new Medicare Primary Care Incentive Program (PCIP)
2 Section 1202 of the Act provides that for the period January 1 2013 to December 31 2014 under Medicaid primary care services provided by primary care physicians must be paid at rates no less than Medicare rates for primary care physicians
The Medicare primary care incentive payment is available to the eligible primary care practitioners for services provided under selected categories of EampM codes An eligible primary care practitioner is a physician nurse practitioner clinical nurse specialist or physician assistant who satisfies the following criteria (i) enrolled in Medicare with primary specialty designation of family practice internal medicine pediatrics and geriatrics and (ii) at least 60 percent of the practitionerrsquos allowed charges are for primary care services10 This temporary 10 percent incentive payment is made on a quarterly basis PCIP recipients with a family medicine Medicare specialty designation received an average incentive payment of $3450 ($212987540 61728) during the first year of the program11 This payment is equivalent to a two percent ($3450$201512) increase in annual income 12
In addition Medicaid payment rates for primary care services delivered by primary care physicians must be no less than Medicare rates for the same services in 2013 and 201413
Given the variability of Medicaid payments across states this could be a substantial boost in payments for physicians in some states and less so in others Medicare has been providing bonus payments to physicians in designated shortage areas to make these areas more attractive for physician practices The Health Professional Shortage Area (HPSA) bonus and the Physician Shortage Area (PSA) bonus are specifically intended to address the geographic distribution of physicians
The main purpose of this report is to present the key findings from our examination of the proposed research questions the main data sources used for the empirical analysis the methodologies used to identify the impact of payment incentives and detailed discussion of our analytical findings
10shyAllowed charges refer to all charges under the physician fee schedule excluding hospital inpatient care drug laboratory and emergency department visits (source httpwwwcmsgovMedicareMedicareshyFeeshyforshyServiceshyPaymentPhysicianFeeSchedDownloadsPCIPshy2011shyPaymentspdf)
11shySource httpwwwcmsgovMedicareMedicareshyFeeshyforshyServiceshyPaymentPhysicianFeeSchedDownloadsPCIPshy2011shyPaymentspdf
12shyACA Medicare PCIP Practitioners (MDs and Non‐MDs) with primary care specialty designation meeting a threshold of 60 percent of primary care serviceswill receive 10 percent bonus on the Medicare paid amount from CY 2011 to CY 2016 $558 million in 2011 translates to an average of 2 percent increase in annual income for primary care physicians
13shyThe Administration is proposing to extend this payment through Calendar Year 2015 and make it available to primary care nurse practitioners and physician assistants who practice independently (add citation to 2015 Budget in Brief when it becomes available)
6
Final Report Health Practitioner Bonuses
The report covers the three main categories of the empirical analysis
1 Examine the magnitude and the distribution of Medicare primary care incentive payments and quantitatively estimate the impact of the bonus on the supply of PCPs and their services
2 Assess the geographic distribution of HPSA bonus recipients understand the overlap between HPSA and Medicare primary care incentive payment (PCIP) and overlap between the HPSA and PSA bonus recipients and quantitatively estimate the impact of the bonuses on the supply of PCPs and their services
3 Explore any evidence of the impact of changes in state Medicaid primary careshyreimbursement rates on the supply of primary care servicesshy
A substantial portion of the empirical undertaking entailed analyzing existing Medicare claims data to understand the magnitude of these supplemental payments under Medicare and to estimate their impact on the supply of PCPs and their services In this report we provide a detailed description of the data we use our analytical approach and a thorough discussion of our analytical findings The discussion in the report is organized as follows section II presents findings from the review of relevant existing literature in section III we lay out the empirical methodology and main evidence related to the impact of the Medicare 10 percent primary care incentive payment section IV describes the empirical analysis of the HPSA and PSA bonuses section V presents the findings regarding the impact of higher primary care physician fees under Medicaid finally section VI is the conclusion
Literature Review The Lewin Group has reviewed the existing key health and labor economics literature for evidence regarding the potential impact of financial incentives on the supply of health care providers and services The objectives of the literature review were to (1) document the likely quantitative range of the effects of earnings increases (in the form of bonuses or other financial incentives) on the supply of primary care providers and services nationally or in underserved areas and (2) explore the likely impact of the increase in Medicaid reimbursement rates for primary care providers on the volume of these providers and their services under Medicaid This work can contribute to the broader understanding of provider behavior and the type and level of financial incentives that are likely to achieve the desired supply responses
The literature that directly examines the Medicare bonuses and resultant impact on the supply of primary care providers and services is very limited To address this limitation we expand our focus to include the labor economics literature This broadened search then includes studies that address the behavioral impact of earnings on medical workforce In what follows we discuss the major findings from the existing literature on the effects of financial incentives (such as Medicare bonuses and increased Medicaid reimbursement rates) on primary care workforce and services Overall the scope of the literature review can be classified under the following categories
1 Effects of earnings on (a) specialty choice by physicians (b) the labor supply of physicians and nurses in terms of work hours and labor force participation and (c) the volume of services
2 Effects of financial incentives on the supply and retention of primary care providers in designated underserved areas (HPSAPSA) and statesrsquo experiences thereof
7
Final Report Health Practitioner Bonuses
3 Impact of increases in Medicaid reimbursement rates on the supply of primary care providers and the volume of patient care under Medicaid on a state by state basis as well as systemic effects
There is considerable concern regarding a potential future primary care physician shortage and potential constriction of access to primary care The availability of primary care is particularly important for public payer programs such as Medicaid and Medicare A recent Medicare Payment Advisory Committee (MedPAC) data book indicates that six percent of Medicare beneficiaries were looking for a new primary care physician in 2011 In addition among those who tried to get an appointment with a new physician in 2011 35 percent reported having difficulties14
It is worth noting that several studies (Bodenheimer et al 2007 Vaughn et al 2010) illustrated the large income gap between primary care providers and other specialties Therefore whether a very small increase in annual income through the Medicare PCIP would significantly influence provider behavior remains unclear In addition the time limited nature of the provisions may prove to be a major deterrent to a change in provider behavior Any evidence around time‐limited bonus programs will likely show only a partial behavioral response from the targeted population Lower bound take up rates should be expected in these programs because medical students and early career providers are unlikely to base career choices on temporary policy changes
Historically the Medicaid program has reimbursed physicians at a much lower rate than Medicare paying just 66 percent of Medicare rates on average (Cunningham 2011) Cunningham (2011) also documents that due to the low Medicaid reimbursement rates in several states fewer physicians accept Medicaid patients In 2013 and 2014 ACA increases Medicaid reimbursement rates for certain services provided by primary care physicians to 100 percent of Medicare rates Given the variability of Medicaid payments across states this will be a substantial boost in payments for physicians in some states and less so in others Current differential payment levels across states and any changes in payments over time can be exploited to examine the effect of raising Medicaid primary care reimbursement rates on the provision of primary care providers and services
The discussion of the literature review is organized as follows section A reviews the literature on the effect of earnings on the supply of primary care providers and services section B discusses the evidence regarding the impact of financial incentives for primary care providers in underserved areas section C examines the empirical evidence on the impact of stateshyspecific changes in Medicaid reimbursement rates and section D concludes with a summary of the major findings from the literature and their implications for understanding the allocative effects of bonus payments and other financial incentives
A Effect of Earnings on the Supply of Primary Care Services and Providers Role of Medicare Primary Care Bonuses
The ACA stipulates multiple programs with the aim of increasing the supply and utilization of primary care services These programs all operate on the assumption that financial incentives specifically directed toward increased earnings are an effective way to promote an increase in primary care services and primary care providers While these assumptions are based upon established economic theory the evidence as to the programsrsquo effectiveness in practice is mixed
14 MedPAC ldquo A Data Book Health Care Spending and the Medicare Programrdquo June 2012 p 97
8
Final Report Health Practitioner Bonuses
While there is general consensus that expected earnings are a key driver of medical specialty choice (Bazzoli 1985 Nicholson and Propper 2011 Nicholson 2002 Vaughn et al 2010) the evidence regarding the effectiveness of programs designed to attract medical students in certain specialties is inconclusive Vaughn et al (2010) argue that programs designed to affect the number of medical students choosing primary care have largely failed while others (Fournier amp Henderson 2005 Lynch 1998 Ramsey 2001) argue that these programs have had a wide range of results that can be attributed to each programsrsquo individual composition
The effect of earnings on labor supply in relation to the healthcare workforce is also a complex issue There is wide consensus that increased earnings lead to an increase in the labor supply of health services providers (Askildsen and Baltagi 2002 Baltagi 2005 Rizzo and Blumenthal 1994) but the reported magnitude of this increase in labor supply varies widely Values reported for the wage elasticity of the primary care labor supply range from 023 to 08 Furthermore the effect of income on retirement decisions of physicians is not well understood
Finally the effect of earnings on the volume of primary care services is a related but distinct issue Much like its counterparts the effect of earnings on the volume of services is recognized to be significant and positive but reported effects range widely from a 10 percent reduction in Medicare fees leading to 18 percent to 66 percent reduction in the volume of office visits to 10 percent higher fees for primary care services raising the primary care EampM visits by 88 percent (Hadley et al 2009 Reschovsky et al 2012)
1 Effects of Earnings on Specialty Choice by Physicians
While the estimated effect of earnings on specialty choice is present and significant the magnitude of this income effect and its relative importance as compared to other factors in deciding a specialty is contentious Recent data from the residency match program in the US reveals that among 16875 US Medical school senior applicants in 2012 about 355 percent were matched to primary care specialties such as internal medicine family practice and pediatrics15 In 2010 the proportion matched to primary care (internal medicine family practice and pediatrics) was 341 percent of 16427 US Medical school senior applicants 16 Between 1995 and 2006 the total number of physician residents in the US in primary care training programs increased by 6 percent from 38753 to 40982 (Exhibit 1) Physician residents in specialty care increased by about 8 percent during the same period
Exhibit 1 Number of Physicians in Residency Programs17
Type of Resident Number of Resident Physicians
Percentage Change 1995 2006
Primary Care Residents 38753 40982 575
Specialty Care Residents 59282 63897 778
All Physician Residents 97416 104526 730
15 Source NRMP Results and Datashy2012 Main Residency Match (httpwwwnrmporgdataresultsanddata2012pdf)
16 US Medical school seniors who are matched into internal medicine can subspecialize later on in nonshyprimary care
specialty such as cardiology endocrinology oncology etc 17
Steinwald B Primary Care Professionals Recent Supply Trends Projections and Valuation of Services Statement in Testimony before the Senate Committee on Health Education Labor and Pensions Washington (DC) GAO 2008 Available from httpwwwgaogovnewitemsd08472tpdf
9
Final Report Health Practitioner Bonuses
Nicholson and Propper (2011) argue that the rate of return to medical training and specialization is the key driver of choosing medical occupation and the choice of specialty within the area of medicine The gap in median income between primary care physicians and specialists is wellshypublicized For instance using crossshysectional earnings data from 2008 Vaughn et al (2010) report that the average primary care physician could expect to earn $25 million over his lifetime net of income taxes living expenses and education costs versus $52 million for a cardiologist Berenson et al (2007) report that according to the Medical Group Management Association (MGMA) between 2000 and 2004 median physician income for all primary care increased by 99 percent while average incomes of all nonshyprimary care specialists increased by 158 percent Arguably given the income gap raising the payment rate for primary care services relative to other services would impact the number of primary care physicians and raise the amount of primary care services they provide Moreover if the reimbursement rates vary by geographic region this strategy can also affect the geographic distribution of services of primary care services
In a related study Bodenheimer (2007) attempts to explain this disparity in incomes The author notes that the ResourceshyBased Relative Value Scale which was initially designed to reduce the inequality between fees for office visits and for procedures has failed to reduce the primary carendashspecialty income gap He finds that this failure is due to four factors (1) the volume of diagnostic and imaging procedures has increased more rapidly than the volume of office visits (2) the process of updating the relative values units (RVUs) 18 associated with covered procedures is heavily influenced by the recommendations of the Relative Value Scale Update Committee (RUC) a majority of whose membership are specialists (3) Medicarersquos formula for controlling physician payments penalizes primary care physicians and (4) private insurers tend to pay for procedures at higher rates than office visits relative to Medicare They conclude that the program was designed with the correct motives but ultimately was weak and cannot achieve its purpose as currently formulated Furthermore incentives that favor specialists remain in the private market
Nicholson (2002) also provides econometric evidence that the disparity in the expected earnings between primary care and other specialties has a significant influence on medical studentsrsquo decisions to choose primary care or another specialty He observes that there is a persistent excess supply of residents to most specialties with relatively high lifetime earnings and a persistent excess demand for residents in primary care with relatively low lifetime earnings His main contribution is to examine how differences in expected earnings affect the number of students who desire to enter a specialty rather than the number who actually enter the specialty The study finds that the income elasticity ranges from 103 in family practicepediatrics to 220 in radiology19 In other words a 1 percent increase in the lifetime earnings of primary care providers such as family practitioners will increase the number of students ranking family practice as the most preferred choice by 1 percent which can be translated into an increase of equal magnitude in the supply of family practitioners
18 RVU is a key component of the formula used under Medicare Physician Fee Schedule (PFS) to calculate payment
rates for an individual service There are three different RVUs work RVU practice expense (PE) RVU and malpractice (MP) RVU Work RVU reflects the relative time and intensity associated with Medicare PFS service PE RVU reflects the costs of maintaining a practice and MP RVU reflects the cost of malpractice insurance Source httpwwwcmsgovOutreachshyandshyEducationMedicareshyLearningshyNetworkshyMLNMLNProductsdownloadsmedcrephysfeeschedfctshtpdf
19 Earlier studies of JW Hay (ldquoPhysiciansrsquo specialty choice and specialty incomerdquo Econometrics of Health Care
edited by G Duru and J Paelinck Netherland Klwer Academic 1991) and J Hurley (ldquoPhysician choices of specialty location and moderdquo Journal of Human Resources No 26 1991 pp 47shy71) did not account for uncertainty in entry to a specialty However they find that medical students are substantially responsive to expected income These studies report income elasticities that range from 1 to 3
10
Final Report Health Practitioner Bonuses
However there are studies that report comparatively less impact of expected earnings on the decision to choose primary care Bazzoli (1985) found that medical students are more likely to choose primary care when the expected earnings are relatively large but the effect is quite small More specifically a $10000 (about 20 percent of the mean earnings in 1981) increase in the expected earnings in primary care relative to the nonshyprimary care yields a 14 percentage point increase in the probability of choosing primary care
Gagne and Leger (2005) have studied the specialty choice decision of Canadian physicians who practiced between 1989 and 1998 They find that a 91 percent reduction in relative feeshypershyconsultation for a general practitioner in Quebec and Saskatchewan for example would lead to a 04 percent reduction in the proportion of medical students entering general practice The largest response is observed in Manitoba where the proportion of medical students entering general practice is estimated to decrease by 229 percent as a result of a 91 percent reduction in relative feeshypershyconsultation The implied responsiveness of specialty choice to changes in earnings from this study and from other studies discussed in this section is summarized in Exhibit 2
Vaughn et al (2010) bolster this point by noting that programs designed to affect the number of medical students choosing primary care have largely failed because of the programsrsquo inability to affect relative incomes By estimating career wealth accumulation across specialists primary care physicians physician assistants business school graduates and college graduates the authors try to elucidate the true difference between payment of physicians and nonshyphysicians and between specialists and generalists within the physician group They note that this result is to be expected as programs have done little and continue to do little to affect the disparity in expected lifetime earnings between primary care physicians and specialists The authors also find that for a primary care physicianrsquos lifetime earnings to equal those of a cardiologist the primary care physician would have to receive a bonus of $11 million upon completion of medical school
Sivey and Scott (2012) use an econometric approach to address the question of the effect of lifetime earnings on training specialty choice based on a sample of Australian postgraduate doctors Using a generalized multinomial logit model the authors find a statistically significant positive impact of earnings on the probability of choosing general practice training versus specialty training Subsequently they use the same model to simulate the effect of a $50000 increase in annual earnings of general practitioners (GPs) on the probability of junior doctors choosing GP training Specifically the simulation result suggests that $50000 additional earnings for GPs (a 278 percent increase over their current salary of $180000) would lead to a 263 percent increase in the propensity of junior doctors to choose GP training Therefore the implied earnings elasticity of the propensity to choose GP training is 095 which is consistent with previous findings (Nicholson 2002)
11
Final Report Health Practitioner Bonuses
Exhibit 2 Summary of Responsiveness of Specialty Choice to Changes in Earnings (Earnings Elasticity)
StudyArticle Description Earnings
Elasticity
Nicholson (2002) Elasticity of ranking Family Practice Pediatrics as the 1
st specialty choice with
respect to lifetime earnings (among US medical school residents) 103
Nicholson (2002) Elasticity of ranking Radiology as the 1
st specialty choice with respect to lifetime
earnings (among US medical school residents) 220
Gagne and Leger (2005)
Elasticity of proportion of medical students (in 8 Canadian provinces) entering General Practice with respect to relativeshyfeeshypershyconsultation
0044 to 025
Sivey and Scott (2012)
Elasticity of probability of junior doctors (in Australia) choosing General Practice with respect to annual earnings
095
Hogan and Bouchery (2010)
Elasticity of percentage of male US medical school Internal Medicine graduates choosing Cardiology subspecialty with respect to annual compensation
250
Note earnings elasticity gives the percentage change in the outcome measure of interest (eg proportion ofshystudents ranking family practice or radiology as the 1
st choice) due to 1 percent change in earningsshy
In an unpublished piece Hogan and Bouchery (2010) estimate a multinomial logit model of the choices of internal medicine residents to remain in internal medicine and practice primary care or to obtain a fellowship for further training in one of nine subspecialties of internal medicine and ultimately practice in that subspecialty20 The authors find that a 1 percent increase in earnings from one of the career paths holding earnings in other specialties constant increases entrants of male US medical graduates into that the examined specialty (Cardiology) by about 25 percent but increases female entrants by about only 03 percent They also find that increases in the length of additional training required for a subspecialty have a negative effect on the number of US medical graduates pursing that subspecialty and reduces the probability that US medical graduates pursue the specialty but increases the probability that international medical school graduates pursue that subspecialty21
Expected lifetime earnings are not the only factor that influences decision making during specialty choice Medical students assign a low level of prestige to a primary care career compared to other specialties Students surveyed associate primary care with low income expectation low class rank and high educational debt (Henderson 1996) Students often enter medical school with a positive perception of primary care but by the time they reach their fourth year they are increasingly likely to disagree with the assertions that primary practice is prestigious adequately compensated and allows more control over working hours (Lynch 1998) It appears that studentsrsquo positive perceptions concerning primary care may change as they experience the more realistic professional demands on primary care physicians that can develop during medical school and as they observe their peers and role models both within primary care and outside
20 Paul F Hogan and Ellen Bouchery ldquo A Model of Subspecialty Choice for Internal medicine Residentsrdquo prepared by
The Lewin Group for the American College of Cardiology 2010 21
After simulating the impact of decreasing cardiology training requirements from three years to two the study finds that oneshyyear decrease in training requirements would increase the percentage of male US medical school graduates choosing cardiology from 171 percent to 182 percent
12
Final Report Health Practitioner Bonuses
2 Effects of Earnings on Labor Supply of Health Care Workforce
Consistent with the economic theory a large number of studies find evidence in support of a positive correlation between earnings and the labor supply of the health care workforce This is in contrast to much earlier studies that relied only on aggregate time series data on physician services and fees to conclude that physician labor supply functions were backwardshybending and physicians responded negatively to wage increases22 For instance Steiger et al (2010) observe that inflationshyadjusted physician fees (weighted average of Medicare and private sector fees) decreased substantially between 1995 and 2005 The timing of the reduction in fees closely matched the observed decline in nonshyresident physician work hours The study finds that the mean hours worked per week by physicians practicing in the US decreased by almost 7 percent between 1996 and 2008 Additionally by 2006 physician fees were 25 percent lower than their inflationshyadjusted 1995 levels More recent studies which use micro data to estimate traditional labor supply equation generally find a small positive elasticity of physiciansrsquo work hours with respect to wage increases For instance Rizzo and Blumenthal (1994) use the instrumental variable approach to estimate the unbiased effect of physicianrsquos wage on the annual hours the physician spends on patient care Their results based on all physicians suggest that a 10 percent increase in the wage rate yields a 27 percent increase in the physicianrsquos annual work hours (ie wage elasticity of 027) When restricted to selfshyemployed male physicians they find a wage elasticity of 023 However for female physicians they find a higher elasticity with a 10 percent increase in the wage rate leading to a 49 percent increase in annual work hours This work is generally supported by Baltagi et al (2005) who find that a 10 percent wage increase would lead to a 3 percent increase in physician labor supply among hospital employed male physicians in Norway Baltagi et al (2005) note that the magnitude of the wage elasticity in this case may be relatively small because of hospital employed physiciansrsquo tendency to earn a lower wage relative to selfshyemployed physicians 23
There are few studies that examine the effect of earnings on a physicianrsquos decision to retire Using micro data from Norway over the period of 1990shy1992 Herneas et al (2000) estimated a model to predict retirement behavior and simulated the effect of financial incentives on retirement decisions among those who were eligible to retire early (during 1990 shy 1992) and who worked fullshytime in 1990 In their simulation the annual pension from 1993 onwards is increased by 72 percent if the retirement eligible individuals continue to work fullshytime through 1992 This increase is equivalent to a 723 percent increase of the annual disposable pension24 The simulation result suggests that the average estimated probability of continuing to work fullshytime throughout 1992 will increase by almost 100 percent (from 384 percent to 706 percent) in response to the 7234 percent hike in annual disposable pensions described above25 In other words in the absence of any pension hike after 1993 only 384 percent of physicians working full time in 1990 would still work full time through 1992 However if pension is raised by 723 percent from 1993 onwards for those who would continue to work full time through 1992 the
22 For an inshydepth exposition of the empirical evidence and lack of support for a backwardshybending physician labor
supply pleas e see Handbook of Health Economic Vol 2 Chapter 14 Section 310 23
The nature of labor supply for Physicians and nurses differ greatly There are some studies on the effect of wages on the labor supply of nurses For example Askildsen and Baltagi (2002) estimates a wage elasticity of nursesrsquo supply of labor between 07 and 08 depending upon the method of estimation The authors argue that while theirs is a larger effect than other estimations have suggested it is still not a large effect relative to other professions They also note that contract structure and type of work being performed significantly impact labor supply decisions and should not be ignored
24 Wealth is defined as the discounted value of future annual disposable pensions and the increase in wealth is
evaluated at the means of the data 25
The expected remaining lifetime was then set at 18 years which is close to the actual average for people in the relevant age groups in 1992
13
Final Report Health Practitioner Bonuses
simulation shows that 706 percent of physicians working full time in 1990 would still do so through 1992 They also estimated that the same financial incentives will lower the average estimated probability of partial retirement in 1992 (of retirement eligible workers) by about 547 percent (from 362 percent to 164 percent) Additionally they find that other decisive factors influencing retirement decisions are the level of education income and marital status
3 Effects of Earnings on the Volume of Primary Care Services
The effect of earnings on the volume of primary care services is related to the previous questions but is a distinct issue that incorporates the ability of providers to impact the demand for services as a result of changes in their income Dummit (2008) argues that as the largest single payer Medicare affects physician practice revenues directly through its payments and indirectly through its fee schedule which many private payers use Lower compensation for primary care physicians is one of the reasons that these specialties are less desirable Reschovsky et al (2012) report that over the past decade Medicare fees and spending for specialist services (such as diagnostic tests and procedures) have gone up more rapidly than fees for EampM services which primary care providers (PCPs) typically provide Those higher payments have contributed to faster growth in specialist services than in EampM patient visits Commercial insurers and state Medicaid plans often build their fee schedules on Medicarersquos further widening the income gap between PCPs and other physician specialists and contributing to the shrinking number of medical students choosing to enter primary care In this section we review how improvements in Medicare fees can influence the volume of health care services provided under Medicare
Hadley et al (2009) estimate the relationship between Medicare fees and the volume of eight specific services provided by physicians using data for 13000 physicians from 2000shy2001 and 2004shy2005 Community Tracking Study Physicians Surveys Since the fee schedule is one of the few policy tools that Medicare potentially has available to influence service volume it is critical to have a better understanding of how changes in Medicare fees affect Medicare service volume Their study finds that a 10 percent reduction in Medicare fees leads to 18 percent to 66 percent reduction in the volume of office visits (of various degrees of complexity) They argue that physicians may be more likely to respond to fee cuts by limiting their acceptance of new Medicare patients rather than limiting visits by established patients
Clemens and Gottlieb (2014) examine the changes in physiciansrsquo reimbursement rates under Medicare before and after year 1997 when consolidation of geographic regions across which Medicare adjusts physician payments led to area specific price shocks The study measures health care supply of all services using RVU They find that health care supplied to Medicare patients (RVUs per patient) exhibits a relatively large long run elasticity of around 15 with respect to reimbursement rates Their results are mostly driven by the stronger positive elasticity among elective procedures (eg eye and orthopedic procedures) When restricted to the analysis of the supply of EampM services their estimates lack precision and they find statistically insignificant short (1997shy98) and long run (2001 to 2005) impact of the price shock on the supply of EampM services However the medium run (1999 and 2000) elasticity is precisely estimated to be 097 for EampM They argue that the observed responses imply that the overall composition of services shifts toward more elective procedures as reimbursement rates increase Finally the number of patients and physicians per patient are almost unaffected by the change in the reimbursement rates
Reschovsky et al (2012) simulate the effect of a permanent 10 percent fee increase for primary care EampM services under Medicare Their estimated primary care supply model suggests that higher primary care fees lead to increases in both the likelihood that PCPs will treat Medicare beneficiaries and more importantly the quantity of EampM services PCPs provide to Medicare
14
Final Report Health Practitioner Bonuses
patients According to their analysis higher fees (10 percent increase permanently) for primary care beginning in 2011 raise the primary care EampM visits by 88 percent
Thus the likely range of changes in the volume of primary care visits in response to a longshyterm increase in Medicare primary care fees appears to be wide Based on Hadley et al (2009) and Reschovsky et al (2012) a 10 percent increase in Medicare fees for primary care can potentially increase the volume of primary care visits in the range of 18 percent to 88 percent However due to the shortshyterm nature of the Medicare PCIP (only 5 years) the observed impact of the incentive payment on the volume of EampM visits may be closer to the lower bound
B Financial Incentives for Primary Care Providers in Underserved Areas
Access to health care in areas with insufficient health professionals has been an ongoing source of concern among policy makers Expansion of health insurance coverage through the implementation of the ACA is likely to stimulate the demand for primary care in general including underserved areas Health Resources and Services Administration (HRSA) designates such areas HPSAs These geographic areas meet a defined threshold of primary care physician to population ratio Since 1987 Medicare has been paying bonuses to physicians providing primary care in rural HPSAs In 1991 the bonus payment was increased from 5 to 10 percent and eligibility extended to services provided by physicians in urban HPSAs Thus this particular form of bonus payment has been in place for almost 25 years Section 413(a) of the Medicare Modernization Act of 2003 put in place an additional 5 percent bonus payment for physicians practicing in Physician Scarcity Areas (PSAs) PSAs were those counties and rural zip codes in metropolitan statistical areas (MSAs) that represented the 20 percent of the Nationrsquos population with the lowest physician to population ratios These areas often coincided with geographic HPSAs so that physicians practicing in those areas received a 15 percent additional bonus payment during 2005shy2008 when the PSA bonuses were in effect (ie from January 2005 through June 2008)
In this section we review the literature related to the volume of these bonus programs and their potential effects on primary care services and providers Programs to address this issue have historically been implemented with the assumption that financial incentives to practice in rural areas are effective in addressing the health professional shortage in given areas This assumption is largely validated by the literature with the effect of financial incentives shown to influence the distribution of physicians and health professionals Importantly the literature generally suggests a multifaceted approach to incentives financial or otherwise Many of the most successful programs evaluated below use recruitment of medical students with specific demographic markers to influence the distribution of physicians Financial incentives have a broad range of reported specialty choice elasticities that range from 001 to 095 These discrepancies may also be somewhat determined by the type of financial incentive (eg grant loan postgraduate bonus)
In an early article on the HPSA bonus Shugarman et al (2001) estimate that in 1991 the total amount of HPSA bonus was almost 316 million dollars Their estimate shows that 583 percent of the total HPSA bonus payment went to the rural HPSAs while the remaining 417 percent went to urban HPSAs They also find that the total bonus payment grew to reach about 106 million dollars in 1996 but then gradually declined to almost 77 million dollars in 1998 The proportion of rural HPSA bonus decreased to 511 percent
In a more recent study Shugarman and Farley (2003) examined the trends in HPSA bonus payments for primary care specialties (family practice general practice and internal medicine) under Medicare over the period of 1992shy1998 using Medicare claims data for nonshymetropolitan area beneficiaries They argue that the bonus payments largely targeted primary care They
15
Final Report Health Practitioner Bonuses
find that in 1992 the payments for primary care services represented 297 percent of the total Medicare bonus payments for physician services to rural Medicare beneficiaries The proportion gradually went up to 37 percent in 1998 Their analysis also showed that in 1992 payments for primary care services represented 14 percent of total basic Medicare payments for physician services and this share rose to 186 percent by 1998 However 559 percent of all Medicare HPSA bonus payments for services to beneficiaries in nonshymetropolitan areas were made to primary care physicians This proportion declined gradually to 497 percent in 1998 The authors claim that low levels of bonus payments in general coupled with the documented declines in those amounts since 1994 may have undermined their future potential to support physicians practicing in rural areas Their findings suggest that physicians were not claiming the extra payments that were available to them Factors that could be contributing to such low uses of bonus payments include the extent to which physicians know about the payments perceived value of the bonus to physicians effects of administrative procedures on the ease of receiving them and concerns about the risk of audits Nevertheless their study highlights the role of bonuses in improving the payments and the supply of primary care services in HPSAs
The literature regarding the effect of financial incentives in underserved areas on the choice of practice location of physicians is relatively scarce Chou and Lo Sasso (2009) examined the impact of local characteristics on the practice location choices for newly trained physicians in New York between 1998 and 2003 Their empirical results suggest that PCPs without educational debt are attracted to HPSAs In other words they estimate that the propensity of choosing a location by a PCP is higher if the location is designated as an HPSA However the estimated propensity is lower if physicians have larger educational debt Their study however addresses the effect of the HPSA status in general rather than any specific effect of the amount of HPSA bonuses
In a review of rural incentive programs Sempowski et al (2004) compare rural recruitment and retention programs in the United States against those in other countries (notably Canada and New Zealand) The authors look specifically at Return of Service (ROS) commitments wherein financial incentive is provided though assistance with medical school payment in return for a commitment to serve in a rural area The authors note that programs offering financial incentives in exchange for ROS commitments to rural or underserviced areas have achieved their primary goal of short term recruitment However the authors note that in the US the lenient buyout opportunities have hindered the programs and limited their effectiveness Sempowski et al (2004) argue that the programs in Canada and New Zealand may have greater success with retention as compared to the US programs because the programs in Canada and New Zealand have a multishyfaceted approach that includes the use of financial incentives along with prudent recruitment strategies
Bolduc et al (1996) provide a theoretical framework of physicianrsquos choice of location They develop a model to assess the effect of various incentive measures introduced in Quebec (Canada) on the geographical distribution of physicians across 18 regions during 1976shy1988 The study specifically examines general practitionersrsquo choice of initial practice locations in Quebec The utility of a particular alternative depends on among other things a measure of expected discounted value of lifetime earnings associated with this alternative It is through changes in this variable that the impact of various incomeshybased physicianshylocation programs is simulated Before 1982 there were substantial variations in the population to general practitioner (GP) ratio across different regions of Quebec In order to redress geographic imbalances in the distribution of physicians the Quebec government introduced the Differential Remuneration Program (DRP) in 1982 that raised the fees (relative to the base fees to general practitioners in underserved regions compared to the regions with relatively lower population to GP ratios Among other incentive measures annual study grants of $10000 have been offered
16
Final Report Health Practitioner Bonuses
(since 1982) tied to a commitment to work in these underserved regions during a number of years equal to the number of grants received A settlement grant program has also been available since 1984 for physicians who choose to practice in these regions This program provides an annual allowance for a maximum of 4 years It varies from $5000 to $10000 (nontaxable) for a physician paid by unit of service depending on the shortage of physicians in the locality Whereas the differential remuneration program influences location choices through differential pricing of physiciansrsquo services by location the grant program affects location choices through a lump sum increase in income for a short duration (4 years)
Bolduc et al (1996) find that on average a 10 percent increase in the general practitioner fees for medical services in a region increases the propensity of a beginning GP to work in this region by 7 percent Thus the implied elasticity of location choice probability with respect to fee increases is about 07 However this elasticity varies across regions it is higher in remote regions (with a maximum of 128) On the other hand on average the elasticity of location choice probability with respect to nonshylabor incomes such as study grants is estimated to be about 111 In other words a 10 percent increase in the study grants tied to a commitment to work in the underserved regions leads to an 111 percent increase in the probability of GPs choosing these underserved regions as their starting practice location However their findings largely depict redistribution of GPs across regions within Quebec rather than showing any increase in the total number of GPs in Quebec
Despite differences in the institutional framework between the US and Canada the findings from Bolduc et al (1996) provide some valuable insights into the potential effects of financial incentives that vary across locations The remaining important issue is to identify how bonus payments affect the annual earnings of physicians in HPSAs Only then based on findings from the literature can one assess the potential impact of the earnings shock in HPSAs on primary care physiciansrsquo choice of practice location Holmes (2005) addresses this question directly Using a database containing the location of physicians at 5shyyear intervals the author compares the locations chosen by alumni and nonshyalumni of programs within the United States charged with increasing physician supply in underserved areas This analysis provides insight into the types of students that choose to enroll in programs such as the National Health Service Corps (NHSC) The author notes that participation in this program consists disproportionately of minorities from private expensive schools This suggests that scholarships (and hence the lack of debt burden) may be an influential factor in participation in the NHSC The multinomial logit model employed by Holmes (2005) shows that students which graduate from an institution with a focus on primary care are also more likely to enroll in the NHSC Using this model Holmes (2005) concludes that the elimination of the NHSC program would lead to a 10shy11 percent decrease in the supply of recent graduates in underserved communities
Rabinowitz et al (2001) examine the history and results of The Physician Shortage Area Program (PSAP) of Jefferson Medical College (Philadelphia PA) The PSAP is intended to address the shortage of primary care physicians in rural Pennsylvania The authorsrsquo analysis uses a cross section of Jefferson Medical College Graduates from 1978 to 1993 to determine which characteristics are predictive of becoming a rural primary care physician (PCP) Of the characteristic variables collected in the data freshman year plans for family practice being in PSAP having a NHSC scholarship male sex and taking elective senior family practice rural preceptorship were independently predictive of primary care in a rural area However among nonshyPSAP graduates with two key selection characteristics of PSAP students (having grown up in a rural area and freshman year plans for family practice) were 78 percent as likely as PSAP graduates to be a rural primary care physician and 75 percent to remain rural PCPs The authors note that this result suggests the most influential area of the program is the admissions component not the financial component Supporting evidence for this conclusion is provided by
17
Final Report Health Practitioner Bonuses
Brooks (2002) who found that rural upbringing and specialty preference were most strongly correlated with recruitment of physicians to rural areas Growing up in a rural area along with the studentrsquos expressed plan to become a primary care physician were associated with a 36 percent likelihood of a graduate practicing in a rural area compared with 7 percent for individuals without these preferences
Although most studies found that there was no correlation with age gender race or marital status (Horner 1993 Looney 1998 Rabinowitz 1999) a few studies determined that men have a greater likelihood of rural practice than women (Fryer 1997 West 1996) However women PSAP graduates were more than twice as likely as nonshyPSAP women to practice in rural areas (317 percent versus 123 percent) (Rabinowitz 2011) Importantly none of these articles list financial incentives as an important factor in recruitment and retention of primary care physicians in rural areas
C Impact of the Increase in Medicaid Reimbursement Rate Relative to the Medicare Rate
The availability of primary care is particularly important for public payer programs such as Medicaid and Medicare Historically Medicaid has been the lowest payer for primary care services relative to Medicare paying just 66 percent of Medicare rates on average26
Cunningham et al (2009) report that fewer physicians accept new Medicaid patients in response to the low Medicaid reimbursement rates in several states Zuckerman et al (2009) describe that in 2008 average primary care physician fees under Medicaid ranged from 57 percent of the national average in Rhode Island to 226 percent of national average in Alaska They also find that after a strong Medicaid fee growth during 1998shy2003 Medicaid fees fell relative to inflation during 2003shy2008 Despite the slowdown in overall fee growth Medicaid fees for primary care services kept pace with inflation ACA increases Medicaid reimbursement rates for certain services provided by primary care physicians to 100 percent of Medicare rates in 2013 and 2014 Given the variability of Medicaid payments across states this could be a substantial boost in payments for physicians in some states and less so in others
The findings in this section focus on the comprehensive effect of a relative rate increase both on services provided and patientrsquos utilization of those services While evidence is mixed the literature indicates significant effects of increased Medicare reimbursement on both the provision and utilization of primary care services Reported elasticities range between 041 in national estimates to shy006 in some state level analyses This broad range suggests varying evidence and a need for greater examination given the importance of this question
1 Systemic Change in Medicaid Reimbursement Rates in All States
Systemic Medicaid changes have the potential to alter the primary care environment across all states Cunningham (2011) considers a regressionshybased approach to identify the causal effect of increases in Medicaid reimbursement rates relative to the Medicare rate on the propensity of primary care physicians accepting new Medicaid patients He reported prior to the 2012 Supreme Court decision (National Federation of Independent Business et al vs Sebelius et al27) that once the ACA is implemented Medicaid eligibility will expand to cover as many as 16 million more poor and lowshyincome adults by 2019 (an increase of more than 25 percent) To
26 Small DM and T McGinnis (2012) ldquoLeveraging the Medicaid Primary Care Rate Increase The Role of
Performance Measurementrdquo Center for Health Care Strategies Inc 27
US Supreme Courtrsquos decision in the case challenging the constitutionality of the Affordable Care Act (ACA httpwwwsupremecourtgovopinions11pdf11shy393c3a2pdf
18
Final Report Health Practitioner Bonuses
meet the resultant surge in demand for primary care services ACA provides financial incentives to encourage higher participation of primary care physicians in Medicaid Specifically the ACA raises the Medicaid reimbursement rates for certain services provided by primary care physicians up to 100 percent of Medicare rates in 2013 and 2014 This study uses primary care physicians from the HSC 2008 Health Tracking Physician Survey and exploits the existing state level variation in Medicaid reimbursement rates (as a percentage of the Medicare rate) The author groups the states in three categories (low medium and high) based on PCPs to population ratios
This study shows that in 2008 the average Medicaid reimbursement rate for lowshyPCP states was about 816 percent of the Medicare rate while for medium and highshyPCP states the average rates were 643 percent and 548 percent respectively The national average of the Medicaid reimbursement rate was 662 percent of the Medicare rate Cunningham (2011) examines the effects of Medicaid reimbursement rates on PCP acceptance of Medicaid patients while accounting for differences in physician practice patient and health care market characteristics The results show that higher Medicaid reimbursement rates are associated with a greater probability of PCPs accepting all or most new Medicaid patients although the effects are relatively modest For PCPs a 10shypercentage point increase in the MedicaidMedicare fee ratio for primary care is associated with only a 21shypercentageshypoint increase in PCP Medicaid patient acceptance The study reports that the national average Medicaid reimbursement rate relative Medicare in 2008 was at 662 percent and the national average acceptance rate of new Medicaid patients by PCPs was 415 percent Therefore the implied elasticity of accepting primary care patients with respect to the payment rate is about 03328 In other words if the Medicaid fee relative to the Medicare rate goes up by 10 percent then the acceptance of new Medicaid patients by PCPs goes up by 33 percent Excluding pediatricians the effect of reimbursement on Medicaid acceptance is slightly higher the implied elasticity of accepting primary care patients with respect to the payment rate is about 041 In the context of the parity in Medicaid and Medicare reimbursement rate under the ACA empirical findings by Cunningham (2011) can serve as a benchmark for the likely positive effect of higher Medicaid reimbursement rates on the access to primary care services
Other studies bolster this finding Shen and Zuckerman (2005) study the effects of Medicaid payment generosity on access and care for adult and child Medicaid beneficiaries The authors use data comparing the experiences of Medicaid beneficiaries with groups that should not be affected by Medicaid payment policies (the uninsured) using a differenceshyinshydifferences model Shen and Zuckerman (2005) find that higher payments do increase the probability of having a usual source of care and the probability of having at least one visit to a doctor or other health professional Specifically they find that a one unit increase (equivalent to a 10 percent increase) in the payment generosity index29 leads to a 15 percentage point increase in the probability of having a usual source of care and a 16 percentage point increase in having at least one visit to a health professional30 Importantly payment generosity was noted to have no effect on the probability of receiving preventive care or the probability of having unmet needs The authors argue that this weak association between increased payments and utilization of services is due to the higher correlation between payment increases and participation by physicians with a secondary effect on utilization
28 Implied Elasticity is (21415)(10662) or 033 After excluding Pediatricians the acceptance rate of Medicaid
patients among PCPs is about 385 percent and a 10shypercentage point increase in the MedicaidMedicare fee ratio for primary care is associated with only a 24shypercentageshypoint increase in PCP Medicaid patient acceptance Therefore the implied elasticity is (24385)(10662) or 041
29 The Medicare payment generosity index is defined as the Medicare capitation rate in a county divided by the
median Medicare capitation rate in the nation in a given year Average is defined to be 10 30
These can be interpreted as elasticities Implied elasticity would be 015 and 016 respectively
19
Final Report Health Practitioner Bonuses
2 Stateshyspecific Experience on Changes in Medicaid Reimbursement Rates
To better understand the mechanism by which systemic changes in the Medicaid system will be implemented and the broad range of environments affected it is informative to review Medicaid changes at the state level Zuckerman et al (2004) illustrate that Medicaid physician fees increased on average by 274 percent between 1998 and 2003 with primary care fees growing the most On average the cumulative percentage change in the Medicaid primary care fee was about 412 percent between 1998 and 2003 The authors note that there was considerable variation in primary care fees across states Seven states (District of Columbia Georgia Indiana Kentucky Maine Rhode Island and South Dakota) left primary care fees almost unchanged while two states (Iowa and New York) raised them by more than 100 percent States with the lowest relative fees in 1998 increased their fees the most but almost no states changed their position relative to other states or Medicare since Medicare rates also increased over the period Subsequently the study finds that primary care physiciansrsquo acceptance of Medicaid patients in highshyfee states was about 18 percentage points higher than the lowshyfee states (61 percent versus 43 percent) in 1997 while in 2001 the gap is reduced to 11 percentage points (58 percent versus 47 percent) The national average of primary care physiciansrsquo acceptance of most or all new Medicaid patients was 53 percent in 1997 and 54 percent in 2001 Moreover large fee increases (eg lowshyfee states experienced the largest fee change on average) were associated with primary care physiciansrsquo greater willingness to accept new Medicaid patients the rate of primary care physiciansrsquo acceptance of new Medicaid patients in these lowshyfee states went up from 43 percent in 1997 to 47 percent in 2001 Although their study shows some evidence that a Medicaid fee increase is associated with increased Medicaid participation among primary care physicians it does not provide a direct link between Medicaid reimbursement rates relative to Medicare and physiciansrsquo acceptance of Medicaid patients
Bindman et al (2003) examine California in particular and focus on the relationship between Medicaid fee increases and the prevalence of managed care in the MedishyCal system The authors note that in August of 2000 a fee increase raised physician Medicaid reimbursement from an average of 577 percent to 652 percent of the average Medicare payment in California This amounts to a fee increase for a typical office visit from approximately $18 to $24 The study used crossshysectional surveys in 1996 and 2001 on both primary care physicians and specialists Controlling for physician demographics and specialties the authors found no increase in MedishyCal participation Their study notes that between 1996 and 2001 despite payment increases the number of MedishyCal primary care physician equivalents dropped from 57 to 46 per 100000 patients31
Mukamel et al (2012) address the effect of similar financial incentives in Californiarsquos Medicaid system but from the standpoint of nurse staffing levels Using separate models for three staffing types RNs LPNs and CNAs the authors determined that financial incentives were only a significant factor in increasing hours per resident day (hprd) for RNs They note that expected nursing home reimbursement rate increases in 2008 were associated with increased RN staffing levels in 2006 They estimate the effect at around a 2shyminute increase (0035 hrpd) for each $10 increase in payment rate This amounts to a 10 percent increase in staffing over 2005 base levels The authors explain that this relatively small increase in staffing might be partially explained by the financial incentives original intent that is to influence labor expenditures and
31 A physician equivalent is defined as one full time physician providing full time working hours per week (40 hrs) in a
given specialty For example a physician who provides 20 hours of Family Medicine is counted as 05 of a physician equivalent in Family Medicine
20
Final Report Health Practitioner Bonuses
not directly influence staffing levels The authors note there may have been a change in wages and benefits for all three groups but that it was not measured in this study
Finally Coburn et al (1999) examined the effect of Medicaid fee changes on physician participation and enrollee access in Maine and Michigan using multiple natural experiments The authors found that changes in Medicaid fees observed in either state over any observed period had no substantial impact on either physician participation or enrollee access and utilization32 In one case in Maine after an increase of 475 percent in Medicaid reimbursement rates primary care physician participation fell by 1 percent (from 477 to 471)33 After a second increase of 245 percent participation increased by only 2 percent34 This result is mirrored in Michigan where participation increased by only 2 percent after a reimbursement increase of 79 percent and decreased by 06 percent after a cut of 166 percent and fell again by 02 percent after a restoration of 196 percent The authors note that these small changes in physician participation hold even when adjusting for lagged responses in both cases The authors found similar results when examining the utilization of services Using ambulatory care as a proxy for utilization of services in general the authors found that changes in the proportion of beneficiaries with at least one visit in a month and in the average number of visits by beneficiaries with at least one visit are not in a direction consistent with the fee changes and are all very small in magnitude The authors note that these results also do not change when estimated in the long run However a major confounding factor in these results as the authors note is the relative size of Medicaid payment rate increases compared to those of the private sector fees The authors state that most gains relative to the private market were quickly eroded
Conclusions
In order to inform our empirical estimation the Lewin Group has explored the health and labor economics literature to understand the nature and the size of the impact of any financial incentives on the labor supply behavior of PCPs and the resultant impact on the availability of primary care services The main objective of this review is to document the prior empirical evidence of the impact of financial incentives on raising the supply of primary care workforce the volume of services impact on medical graduatesrsquo propensity to participate in primary care PCPsrsquo retirement decision etc This review also evaluates the past evidence on the effect of bonuses shortage areas and their effectiveness in redistributing and retaining primary care workforce Finally the review of the literature also focuses on the stateshyspecific experiences with changes in their respective Medicaid payment rates for primary care and the resultant impact on the supply of PCPs their rate of acceptance of Medicaid patients and the volume of primary care services such as office visits or visits for EampM services
Affecting the choice of specialty by a medical student is one way by which the supply of primary care services may be increased Several studies (eg Nicholson 2002 Sivey and Scott 2012) find that the propensity of medical graduates choosing primary care as their specialty would go up by 95shy10 percent in response to a 10 percent increase in their earnings (ie earnings elasticity of 095shy10) Thus even if bonus payments have the potential to influence the inflow of
32 The study has given due consideration to the changes in Medicaid payment relative to the payments by other
payers The authors use the ratio of Medicaid payments to charges as an index of changes in relative payments They have also confirmed with Blue Cross Blue Shield (BCBS) of Michigan (which serves 49 percent of the statersquos health insurance market) that BCBSrsquos paymentsshytoshycharge ratio for all physician services did not change substantially
33 The corresponding relative fee change (ie Medicare relative to charges) is 402 percent
34 The corresponding relative fee change (ie Medicare relative to charges) is 258 percent
21
Final Report Health Practitioner Bonuses
medical students into primary care the magnitude of that impact would depend largely on the size of actual bonus payments relative to PCPsrsquo earnings and how long such payments are in place These two factors will determine the contribution of the Medicare bonus to the lifeshytime earnings of primary care providers
Another way to affect the supply of primary care services is to provide financial incentives for existing providers with the aim of increasing their labor supply Past research (eg Rizzo and Blumenthal 1994 Baltagi et al 2005) estimates that a 10 percent increase in wage earnings would yield a 23 3 percent increase in their annual work hours This low wage elasticity suggests that influencing the supply of primary care labor with direct fee increases alone is likely to be costly The increased fee payments will also likely have an effect on the volume of primary care services However compared to the wage elasticity the change in volume of services in response to fee increases is relatively low Empirical evidence from the literature (eg Hadley et al 2009 Reschovsky et al 2012) suggests that a 10 percent change in Medicare fees would change the volume of office visits or EampM related visits by 18 to 88 percent in the same direction
The numerical estimates of the effect of financial incentives in underserved areas on the choice of practice location of physicians in the US are relatively scarce An important study based on Canadian data finds that on average a 10 percent increase in the general practitioner (GP) fees for medical services in a region increases the propensity of a beginning GP to work in this region by 7 percent (Bolduc et al 1996) Thus the implied elasticity of location choice probability with respect to fee increases is about 07 Several studies highlight the role of bonuses in improving the payments and the supply of primary care services in HPSAs in the US However estimating the true contribution of bonuses in underserved areas in boosting physiciansrsquo earnings would require additional research
Past research on stateshyspecific increases in Medicaid and their resultant impact is relatively sparse However several studies find a positive correlation between the Medicaid reimbursement rate and acceptance rate of Medicaid patients among PCPs Cunningham (2011) finds that the effect of increase in Medicaid reimbursement rate on the propensity of accepting primary care patients is positive but small in magnitude Coburn et al (1999) finds positive impact of Medicaid fee changes on physician participation and enrollee access in Maine and Michigan while Bindman et al (2003) did not find significant effect of Medicaid fee increase on the participation rate of primary care physicians in California
Despite several empirical results regarding the potential magnitude of the effect of different financial incentives the estimated effect of Medicare bonuses or improvement in Medicaid reimbursement rates under ACA may not be substantial This is primarily due to the size and the temporary nature of these positive earnings shocks The empirical evidence on the effect of this type of shortshyterm pay increase is almost nonshyexistent in the literature However the ranges of the effects of longshyterm earnings shocks from our review of the literature can inform policy makers about the likely magnitude of the impacts of these incomeshyaugmenting policies for PCPs if they are sustained for a longer duration
Modeling the Impact of Medicare Incentive Payment for Primary Care Providers
A Study Design Overview
The Medicare primary care incentive is available to eligible primary care practitioners for services provided under selected categories of EampM An eligible primary care practitioner is a
22
Final Report Health Practitioner Bonuses
physician nurse practitioner clinical nurse specialist or a physician assistant who satisfies the following criteria
1 Enrolled in Medicare with a primary specialty designation of family practice internal medicine pediatrics or geriatrics and
2 At least 60 percent of the practitionerrsquos allowed charges under the Medicare physician fee schedule (excluding hospital inpatient care and emergency department visits) are for primary care services
This temporary payment is available for primary care services furnished by an eligible primary care practitioner on or after January 1 2011 and before January 1 2016 The payment is made on a quarterly basis and it amounts to 10 percent of the payment amount for the Part Bshycovered primary care services furnished by the eligible provider
Based on data regarding all the Medicare PCIP recipients in 2011 and 2012 we observe that in 2011 there were 162342 providers that received the PCIP with the majority of physicians specialized in family medicine and internal medicine (Exhibit 3) Also nurse practitioners account for more than half of nonshyphysician recipients in both 2011 and 2012 Finally there was an increase in the number of physician PCIP recipients across all eligible specialties in the second year the payment was in effect The number of all eligible types of nonshyphysician PCIP recipients also increased These estimates are consistent with the statistics reported by CMS35
Exhibit 3 Number of PCIP Recipients under Medicare by Specialty 2011shy2012
Specialty Year 2011 Year 2012
Physicians 121140 133880
Internal Medicine 54062 62554
Family Medicine 63227 66560
Pediatrics 2711 3426
Geriatrics 1140 1340
NonshyPhysicians 41202 51432
Clinical Nurse Specialist 466
Nurse Practitioner 27698 33940
Physician Assistant 13038 16899
Total 162342 185312
Note Actual PCIP recipients eligibility based on conditions 2 years prior to the PCIP payment year
The specific PCIPshyeligible services and their corresponding Current Procedural Terminology (CPT) codes are as follows (1) office and other outpatient visits (99201 through 99215) (2) nursing facility domiciliary rest home or custodial care (99304 through 99340) and (3) home services (99341 through 99350)
Medicare claims data include the Healthcare Common Procedure Coding System (HCPCS) corresponding to each claim submitted by providers Since level I of HCPCS codes is comprised of CPT codes HCPCS codes associated with claims can be used to determine bonusshyeligible EampM services
35 Source Center for Medicare and Medicaid Services (httpwwwcmsgovMedicareMedicareshyFeeshyforshyServiceshy
PaymentPhysicianFeeSchedDownloadsPCIPshy2011shyPaymentspdf)
23
Final Reportshy Health Practitioner Bonuses
The key questions that we examined using the Medicare data include
What is the aggregate number of Medicare PCIP recipients
What proportion of primary care providers qualify for the PCIP
What are the characteristics of primary care providers who qualify for the PCIP
How many eligible claims were submitted by PCIP eligible providers
What is the impact of Medicare incentive payments on services provided patients seen providers accepting Medicare and other related outcome measures
B Data Sources and Variables
1 Main Data Sets
To explore these topics we used a customized data set constructed at the provider level This data set includes all the claims submitted by the entire universe of Medicare providers in each year from 2005 to 2011 The content of this customized data set is similar to the Limited Data Set (LDS) version of the Medicare Carrier File (which is also known as the PhysicianSupplier Part B Claims) available from CMS Research Data Assistance Center (RESDAC) Subsequently in the discussion that follows we will refer to the customized claims level data set for all Medicare providers as the Provider Carrier File (PCF) Most of the claims in our PCF are from nonshyinstitutional providers such as physicians physician assistants clinical social workers and nurse practitioners Key variables in this file include
Procedure codes (HCPCS) corresponding to each claim
Provider total allowable charges associated with all claims
Provider specialty place of service and geographic location (such as zip code)
We constructed a provider level pooled data set (PPD) from the claims level data in the PCF over the period 2005shy2011 This pooled data set includes information such as provider specialty volume of primary care services (based on HCPCS codes) volume of PCIP eligible services distribution of providers by volume of services their annual Medicare allowed charges their geographic location and other related information over a longer time horizon In addition the original PCF included a National Provider Identifier (NPI) for each provider Subsequently each provider was linked by NPI to Provider360 data (available from Lewin Grouprsquos parent company Optum Inc) and the AMA Physician Master File to add provider characteristics such as provider demographics (eg age gender) provider designation medical school practice group information specialty and practice location We also added geographic location specific characteristics by linking the provider level data with the Area Resource File (ARF) based on the practice location information of providers The ARF data are maintained by the Health Resources and Services Administration (HRSA) The main advantage of this pooled data set is the ability to track providers over time and capture changes in their volume of services in response to Medicare payment incentives using a preshyandshypost analysis design
2 Trends in Key Outcome Variables
We were interested in estimating the impact of the PCIP on the supply of PCPs and patientsrsquo access to their services We measured improvements in access to care by studying changes in the volume of primary care services provided and the number of PCP providers Both the supply of PCPs and volume of services are measures of access to care previously used in the
24
Final Report Health Practitioner Bonuses
literature36 In addition we investigated the impact of the PCIP on the allowed charges associated with eligible EampM claims
Primary Care Providers with PCIP Eligible Specialties
First we examined the trend in the number of eligible providers submitting Medicare claims An increase in the number of primary care providers relative to the population is expected to improve access to primary care As shown in Exhibit 4 the number of PCPs accepting Medicare patients increased steadily over the study period with an approximate 40 percent increase in the number of providers treating Medicare patients from 2005 to 2011 This trend is common to all four physician specialties under study37 In addition the number of nonshyphysician practitioners more than doubled over this period This significant increase in the number of nonshyphysician providers especially nurse practitioners has been documented elsewhere38
Exhibit 4 Number of Primary Care Providers under Medicare by Specialty 2005shy2011
Specialty 2005 2006 2007 2008 2009 2010 2011
Physicians 138356 147771 165150 173018 178784 185070 191930
Internal Medicine 69391 74411 83117 87090 90291 93904 97526
Family Medicine 61438 65205 72247 75132 77536 79891 82298
Pediatrics 6539 7045 8527 9447 9543 9757 10555
Geriatrics 988 1110 1259 1349 1414 1518 1551
NonshyPhysicians 46634 53823 68297 80041 88569 97789 109353
Clinical Nurse Specialist 1784 1934 2188 2304 2370 2446 2508
Nurse Practitioner 23610 27450 35286 42144 46973 52472 59505
Physician Assistant 21240 24439 30823 35593 39226 42871 47340
Total 184990 201594 233447 253059 267353 282859 301283
Volume of EampM PCIP Eligible Claims
Our second measure of supply of primary care services is the volume of claims submitted by primary care providers for EampM services As presented in Exhibit 5 the volume of EampM claims submitted by physicians increased by roughly 9 percent between 2005 and 2008 EampM claims took a slight dip in 2009 increased in 2010 and then stabilized in 2011 at roughly the levels in 2008 The same general increasing trend applied to each of the four eligible physician specialties with the exception of geriatrics which experienced a constant and substantial increase in EampM claims of 52 percent over the study period Internal medicine physicians provided the majority of services generating more than 50 percent of EampM claims each year over the study period Family physicians are the second largest group of providers to supply
36 For instance see Stensland et al 2013
37 In 2005 almost half of the primary care providers (PCPs) were male but the share of male PCPs declined to almost
40 percent in 2011 (Exhibit B1 Appendix B) On the other hand the share of PCPs aged 55 and above among all male PCPs increased from 24 percent in 2005 to 375 percent in 2011 (Exhibit B1 Appendix B) As observed in Appendix Exhibit B1 the physician population appears to be aging The share of male physicians aged 65 and above underwent the largest increase recently from 186 percent in 2010 to 21 percent in 2011 (Exhibit B9a Appendix B) A similar increasing trend is also observed among female physicians aged 55 and above (Exhibit B9b Appendix B) Finally in the case of nonshyphysicians we observe the same steady increase in the share of providers aged 55 and above for both male and female providers (Exhibit B10shy11 Appendix B)
38 Source GAO (2008) ndash ldquoPrimary care Professionals Recent Supply Trends Projections and Valuation of Services
ldquo GAO 08shy472T
25
Final Report Health Practitioner Bonuses
EampM services representing about 40 percent of the total followed by geriatricians and pediatricians
Consistent with the increase in the number of nonshyphysicians documented above we observe an even more dramatic increase in the total number of EampM claims submitted by nonshyphysicians (clinical nurses nurse practitioners and physician assistants) The volume of EampM claims more than doubled over the study period from roughly 9 million in 2005 to more than 20 million in 2011
Exhibit 5 Total Number of PCIP Eligible EampM Claims submitted by All PCPs under Medicare by PCP Specialty 2005shy2011
Specialty 2005 2006 2007 2008 2009 2010 2011
Physicians 105943390 107978615 111700420 115408741 114881401 117265160 115329828
Internal Medicine
60279101 61222893 63082429 64946744 64244760 65447440 63698392
Family Medicine
44352228 45264171 47011232 48776874 48891712 49977085 49767310
Pediatrics 334997 352594 360508 365170 387636 391312 377604
Geriatrics 977064 1138957 1246251 1319953 1357293 1449323 1486522
NonshyPhys 8885528 10366281 11979963 13710969 15376840 18008471 20477006
Clinical Nurse Specialist
6083315 7068153 8117610 9212329 10298679 11987059 13561380
Nurse Practitioner
153463 165033 168030 200074 228899 260618 296206
Physician Assistant
2648750 3133095 3694323 4298566 4849262 5760794 6619420
With both the aggregate number of EampM claims and the number of providers rising over time we further explore the change in the volume of claims per provider over time In other words we examined whether the increase in the aggregate number of claims could be due to the increase in claims per provider or whether it is just due to the increase in the number of providers
Inspection of Exhibit 6 reveals that in the case of all physicians the average number of eligible EampM claims per provider in 2011 was lower than in 2005 For instance the average number of eligible EampM claims for internal medicine was 653 in 2011 compared to the higher value of 869 in 2005 The decreasing trend in average claims per physicians may be due to the increase in the number of PCPs in the absence of a substantial increase in the patient population
26
Final Report Health Practitioner Bonuses
Exhibit 6 Average Number of PCIP Eligible EampM Claims per PCP under Medicare by Specialty 2005shy2011
Finally in the case of nonshyphysicians there was an overall increase in the average number of EampM claims submitted by physician assistants (PA) nurse practitioners (NP) and clinical nurse specialists (CNS) after 2009 (see Exhibit B2 Appendix B) For example the number of claims per PA increased from 125 in 2005 to almost 140 in 2011 On the other hand the number of claims per NP was 253 in 2005 then declined to 219 in 2009 and then increased to about 228 in 2011 The increase in the average number of claims submitted suggests that the dramatic increase in services provided is due to both an increase in the number of providers and in the number of services provided by each nonshyphysician The average number of claims per PCIP recipients by specialty and the average allowed charges per PCIP recipients by specialty are presented in Appendix B Exhibit 12 and 13 respectively
Allowed Charges for PCIP Eligible EampM Claims
So far we have focused on the level of EampM services provided measured in terms of number of claims and the number of providers Next we turn to the dollar value associated with EampM claims measured using allowed charges As shown in Exhibit 7 the total allowed charges (in million dollars) for eligible EampM claims increased for all providers over the period of analysis Overall total allowed charges increased by 58 percent with internal medicine and family medicine physicians accounting for most of this increase It is also noteworthy that the value of claims submitted by nonshyphysicians increased substantially over the same period by a factor between 2 and 3
27
Final Report Health Practitioner Bonuses
Exhibit 7 Total Allowed Charges (in million $) for the PCIP Eligible EampM Claims submitted by All PCPs under Medicare 2005shy2011
Specialty 2005 2006 2007 2008 2009 2010 2011
Physicians $6271 $6575 $7343 $7813 $8119 $9079 $9274
Internal Medicine $3671 $3830 $4251 $4506 $4644 $5182 $5231
Family Medicine $2520 $2645 $2982 $3183 $3340 $3742 $3881
Pediatrics $20 $21 $23 $24 $26 $30 $30
Geriatrics $61 $78 $87 $100 $108 $125 $131
NonshyPhysicians $416 $517 $617 $743 $871 $1114 $1316
Clinical Nurse Specialist $287 $358 $421 $507 $592 $749 $878
Nurse Practitioner $8 $9 $9 $11 $14 $17 $20
Physician Assistant $122 $150 $187 $225 $265 $349 $418
Total $6687 $7091 $7960 $8556 $8990 $10193 $10589
As shown in Exhibit 8 the average allowed charge per PCP for EampM claims increased slightly for internal medicine physicians and pediatricians after 2009 (also see Appendix B Exhibit B2) The average value of EampM claims increased for the other PCPs but not as fast as the total value of these claims Given the moderate increase in the average allowed charges for EampM claims the substantial increase in the aggregate allowed charges is likely due to the increase in the number of claims which in turn as discussed above may be driven by the increase in the number of providers Another important observation is that although the average number of claims submitted by physicians declined over the 2005shy2011 period the average allowed charges remained the same or even increased This observed increase in allowed charges per provider despite the documented decline in the number of claims may reflect changes in the composition of services that physicians are providing We hypothesize that this change in the composition is due to an increase in the supply of services that take more time and which are typically associated with higher charges We explore this hypothesis in the following section
28
Final Report Health Practitioner Bonuses
Exhibit 8 Average Allowed Charges ($) for the PCIP Eligible EampM Claims per PCP under Medicare by Specialty 2005shy2011
Finally we constructed the proportion of practitionerrsquos allowed charges under the Medicare fee schedule (excluding hospital inpatient admission and emergency room visits) that are for PCIP eligible primary care services As observed in Exhibit 9 for both physicians and nonshyphysicians the proportion of services that are PCIP eligible varies across specialties and is in general steadily increasing over the observation period However compared to primary care physicians the nonshyphysicians experienced a much larger percentage change in the share of allowed charges that are associated with PCIP eligible services
Exhibit 9 Share of Allowed Charges for PCIP Eligible EampM Claims by Specialty2005shy2011
Specialty 2005 2006 2007 2008 2009 2010 2011
Physicians
Internal Medicine 583 590 611 609 612 651 632
Family Medicine 692 699 724 722 725 750 734
Pediatrics 289 376 439 426 446 517 480
Geriatrics 754 845 851 858 855 879 867
NonshyPhysicians
Clinical Nurse Specialist 239 249 258 299 333 364 407
Nurse Practitioner 616 649 647 663 666 708 715
Physician Assistant 506 514 529 534 543 598 591
Note the proportions are of allowed charges for all Medicare claims (excluding hospital inpatient ER drug and lab)
29
Exhibit 8 Average Allowed Charges ($) for the PCIP Eligible EampM Claims per PCP under Medicare by Specialty 2005-2011
Final Report Health Practitioner Bonuses
While the proportion of services that are PCIP eligible is increasing over the observation period the opposite is true for the proportion of EampM claims (Exhibit 10) Consistent with the decrease in the aggregate number of EampM claims documented above we observe that the share of EampM claims out of the total Medicare claims is also slightly decreasing over the period For example in the case of providers specializing in internal medicine the share decreased from 411 percent in 2005 to 375 percent in 2011
Exhibit 10 Share of PCIP Eligible EampM Claims by Specialty 2005shy2011
Specialty 2005 2006 2007 2008 2009 2010 2011
Physicians
Internal Medicine 411 411 401 393 373 383 375
Family Medicine 432 430 419 409 386 392 384
Pediatrics 309 338 347 347 330 342 341
Geriatrics 648 696 677 641 610 600 603
NonshyPhysicians
Clinical Nurse Specialist 272 262 259 276 288 309 329
Nurse Practitioner 558 567 548 519 485 503 500
Physician Assistant 455 461 450 438 410 434 431
Note the proportions are calculated out of all Medicare claims (excluding hospital inpatient ER drug and lab)
The trends in primary care services and providers discussed above apply in general to the more restricted sample of PCIP recipients (Exhibits B4shy7 in Appendix B) When we limit the number of providers to 2011 PCIP recipients we observe a slight decrease in the average number of eligible claims submitted by physicians (Exhibit B5 Appendix B) and an overall increase in the average allowed charges over the study period (Exhibit B6 Appendix B)
C Econometric Framework
We used the providershylevel data to address the key research questions related to the Medicare PCIP We estimated several regressionshybased models using the DID method to obtain consistent estimates of the PCIP policy effect39 In order to implement the DID model we
1 Form a group of providers (treatment group) who are likely to be affected by the PCIP program including the following specialties family practice internal medicine pediatrics and geriatrics
2 Identify a natural relevant comparisoncontrol group (other nonshyprimary careshypractitioners) who are not likely to be affected by the PCIPshy
3 Assess the changes in our key outcomes of interest for the treatment group relative to the control group before and after the PCIP policy is in effect
We estimate the following econometric model to identify the effect of Medicare PCIP program on the magnitude of primary care EampM services
39 An alternative estimation method is a preshypost analysis but if there are unobserved factors that affect the
magnitude of EampM services supplied by any provider (primary or nonshyprimary care) and the effect of these unobserved factors varies over time a preshypost model would not yield an unbiased incentive effect
30
Final Report Health Practitioner Bonuses
Sit = + lowast Ti + lowast t + 8 lowast t lowast Ti + it lowast + Eit
We let Sit be the volume of eligible EampM services provided by provider i in period t Ti is anindicator for treatment group that takes the value 1 if the provider is a PCP and zero otherwise the variable Postt is an indicator variable taking the value of 1 in the years when the PCIP policyis likely to impact the behavior of the providers and 0 otherwise the vector Xit includes providercharacteristics such as age and gender The term Eit represents the net influence of randomunobserved factors affecting EampM services Importantly the estimated coefficient 8 (the coefficient of the interaction term between the treatment group indicator and the postshyPCIP policy period indicator) in equation (1) represents an unbiased estimate of the effect of the Medicare primary care incentive payment on the volume of primary care EampM services The derivation of this estimated effect is presented in Appendix C (C1) A similar methodology can be applied to estimate the effect of the incentive payment on other outcomes of interest
The choice of the control group for the DID model was based on several criteria Ideally we would have included providers with nonshyeligible specialties who also supplied EampM services In order to determine some preferred comparison group providers we
1 Evaluated the frequency of PCIP eligible and nonshyeligible providers by (primary) specialtyavailable in the Provider360 dataset after merging that data set with the list of NPIs of 2011PCIP recipients
2 Examined the volume of claims related to evaluation and management (EampM) servicesby specialty based on 2009 Medicare claims by service and specialty
3 Chose based on the volume of claims and the number of providers 8 PCIP nonshyeligiblespecialties These PCIP nonshyeligible specialties are (1) Psychiatry amp Neurology (2)Obstetrics amp Gynecology (3) Urology (4) Ophthalmology (5) Pathology (6)Psychologist (7) Podiatrist and (8) Optometrist Total number of PCIP eligible claimssubmitted by these providers with PCIP nonshyeligible specialties is presented in AppendixB Exhibit B14
D Main Results
The estimation of DID regression models is based on the number of eligible providers the volume of claims for PCIP eligible EampM services and the allowed chargespayments associated with those claims The volume of EampM claims and payments analyzed here excludes those for hospital inpatient ER drug and laboratory services As we explain above Medicare providers with a PCIPshyeligible specialty (ie family practice internal medicine geriatrics pediatrics NP PA and clinical nurse specialists) that have at least one Medicare claim are included in the ldquotreatmentrdquo group These are the providers who are likely to be affected by the Medicare PCIP policy Given that the announcement of the PCIP program was made in 201040 we assumed that the providers with Medicare PCIP eligible specialties would be potentially responsive to the
40 Source Patient Protection and Affordable Care Act (lsquolsquoPPACArsquorsquo Public Law 111ndash148) For our analysis we report a
single estimate of PCIP impact under each regression model where year 2010 and 2011 are considered as the postshypolicy periods We performed several sensitivity analyses to investigate if the estimated impact is significantly different between 2010 and 2011 we also checked if the results change once we consider 2011 as the only post period Based on such detailed analysis we did not find any systematic evidence that the estimated impact is different between these two years and they are not sensitive to the choice of postshypolicy period
31
Final Report Health Practitioner Bonuses
incentive as early as year 2010 Therefore years 2010 and 2011 represent the postshypolicy period
The DID regression models were estimated using several subshysamples (1) all providers (2) only providers that appear in all 7 years of data (roughly 44 percent of all providers) (3) providers who were near the PCIP eligibility criteria in 2009 (ie restricted to providers who had the share of total Medicare claim payments shyshy allowed chargesshyshy between 50 percent and 65 percent for PCIP eligible EampM services About 15 percent of all providers in the sample met this restriction
In Exhibit 11 we summarize the average volume of PCIP eligible EampM claims and the allowed chargespayments associated with those claims by select patient category and CPT code for providers in the ldquotreatmentrdquo group Comparing the first and last columns we observe that providers near the 60 percent eligibility threshold generate more EampM claims on average compared to the average PCP accepting Medicare (895 vs 590)
Exhibit 11 Number of PCIP Eligible EampM Claims and Mean Allowed Charges per Provider per Year by Types of Claims for Providers with PCIP Eligible Specialty 2005shy2011
All Providers Providers in
All Years
Providers Near
Eligibility
Analysis Sample
Number of Unique Providers with PCIP Eligible Specialty
264141 129587 17081
Annual Average Number of PCIP Eligible EampM Claims per provider
All EampM Claims 590 752 895
New Patient Claims 19 21 25
Established Patient Claims 487 628 813
Other Claims 84 103 57
Claims in 3 Major CPT Codes
Established Patients (15 mins) 243 315 403
Established Patients (25 mins) 177 227 282
Established Patients (40 mins) 20 25 34
Annual Average Allowed Charges for PCIP Eligible EampM Claims per Provider
All EampM Payments $40208 $51016 $60235
New Patient Payments $1941 $2223 $2661
Established Patient Payments $32409 $41764 $53755
Other Payments $5858 $7029 $3819
Payments in 3 Major CPT Codes
Established Patients (15 mins) $13613 $17635 $22712
Established Patients (25 mins) $15217 $19524 $24581
Established Patients (40 mins) $2313 $2976 $4051
Note Summary of PCIP eligibility criteria Primary care physicians (with internal medicine family practice pediatrics and geriatrics specialty) who have at least 60 percent of the practitionerrsquos allowed charges under the Medicare physician fee schedule (excluding hospital inpatient care and emergency department visits) are eligible for primary care services The PCIP eligible primary care services are defined by specific EampM codes Medicare PCIP is also provided to physician assistants nurse practitioners and clinical nurse specialists who meet the similar eligibility criteria For the purpose of our analysis we consider the PCPs (with the PCIP eligible specialty) who have
32
Final Report Health Practitioner Bonuses
50 percentshy65 percent of their services for PCIP eligible EampM services (defined by specific EampM codes) in 2009 are considered to be near the eligibility threshold
For the control group the number of providers the volume of their Medicare claims for EampM services and the associated allowed charges for the providers with the PCIP nonshyeligible specialties are presented in Exhibit 12 As expected providers in the control group generated much fewer EampM claims compared to providers in the treatment group Specifically providers in the control group supplied less than half the volume of EampM services compared to providers in the treatment group (ie 296 vs 590)
Exhibit 12 Number of PCIP Eligible EampM Claims and Mean Allowed Charges per Provider per Year by Types of Claims for Providers with PCIP NonshyEligible Specialty 2005shy2011
All Providers Providers in All Year
Analysis Sample
Number of Unique Providers with PCIP NonshyEligible Specialty
108302 70583
Annual Average Number of PCIP Eligible EampM Claims per Provider
All EampM Claims 296 333
New Patients Claims 35 38
Established Patients Claims 243 276
Other Claims 18 19
Claims in 3 Major CPT Codes
Established Patients (15 mins) 129 146
Established Patients (25 mins) 47 53
Established Patients (40 mins) 5 6
Annual Average Allowed Charges for PCIP Eligible EampM Claims per Provider
All EampM Payments $18618 $20868
New Patients Payments $3421 $3724
Established Patients Payments $14108 $15975
Other Payments $1089 $1169
Payments in 3 Major CPT Codes
Established Patients (15 mins) $7321 $8288
Established Patients (25 mins) $4048 $4578
Established Patients (40 mins) $641 $711
1 Impact of PCIP Policy on Number of Eligible Providers
We examined the changes in the number of providers with a Medicare PCIP eligible specialty in a county who have at least one claim for PCIP eligible services to identify the potential impact of the PCIP policy on these providers Exhibit 13 shows the results from the DID regression models in which we use the number of providers in a county and in a specific year as the outcome variable (Model 1) the number of physicians in each county and year (Model 2) and the number of nonshyphysicians (ie NP PA and CN) The key variable in each model is the interaction between the indicator for PCIP eligible specialty and the indicator for the period after 2009
33
shy
Final Report Health Practitioner Bonuses
In Model 1 the first estimated coefficient suggests that on average the number of Medicare providers with a PCIP eligible specialty and at least one PCIP eligible claim increased by about 28 providers per county in each year after 2009 due to the Medicare PCIP This represents an economically meaningful increase given that on average there were about 15 providers per county per year in a PCIP eligible specialty during the sample period This increase (almost 19 percent) in the number of providers in PCIP eligible specialties may be the primary reason for the estimated reduction in the number of EampM claims per provider due to the PCIP policy
In addition when we restrict the estimation to physicians (Model 2) the increase in the number of physicians with a PCIP eligible specialty attributable to the policy is about 2 per county per year This is almost 10 percent of the average number of primary care physicians in a given PCIP eligible specialty per county per year (average is almost 19) Furthermore the estimated policy impact in Model 3 indicates that the number of PCIP eligible nonshyphysicians increased by over 36 providers per county per year Thus all three models confirm that the introduction of the PCIP policy generated an increase in the number of PCIP eligible providers above and beyond the general increasing time trend Subsequently this increased number of providers may have resulted in the reduction in the average number of EampM claims submitted by these Medicare providers after 200941
Exhibit 13 Impact of Medicare PCIP on the Number of PCPs with Medicare Claims for PCIP Eligible Services (2005shy2011)
Dependent Variable Number of
Providers per county
All Providers
(1)
Physicians Only
(2)
Non Physicians Only
(3)
PCIP Elig Specialty Indicator 4247 3400 2721
(3133) (3647) (2078)
Elig Specialty Ind x Post 2009 2759 1950 3632
(0444) (0674) (0375)
Post 2009 2929 1884 2895
(0455) (0541) (0304)
Median Income ($10k) 1591 2218 1061
(0385) (0468) (0206)
Percent in poverty 0254 0339 0210
(00479) (00587) (00285)
Population (10k) 0536 0607 0317
(00280) (00339) (00128)
Percent Population over 65 shy0307 shy0196 shy0234
(00363) (00452) (00238)
Unemployment Rate shy0518 shy0510 shy0400
41 We have also estimated similar models for the primary care providers who have any Medicare claims (not
necessarily under PCIP eligible services) and the estimated effects of the PCIP policy are slightly larger in those cases These additional results are included in Appendix B Exhibit B 15 In addition we have estimated similar models of providers who met the 60 PCIP eligibility threshold in each year (2005shy2011) As expected the estimated impact of PCIP policy on the number of primary care providers is relatively lower for this restricted set of providers However if we focus on this restricted set of providers then we are likely to lose those providers who may have been induced to provide PCIP eligible services in response to the policy but may not have reached the 60 threshold Similarly we would lose the information on the providers who have reduced the proportion to below 60 The estimated results on this restricted set of providers are presented in Appendix B Exhibit B16
34
-
shy
Final Report Health Practitioner Bonuses
Dependent Variable Number of
Providers per county
All Providers
(1)
Physicians Only
(2)
Non-Physicians Only
(3)
(00461) (00557) (00324)
Intercept shy4970 shy5988 shy3006
(3489) (3996) (2344)
Specialty Fixed Effects Yes Yes Yes
Year Fixed Effects Yes Yes Yes
State Fixed Effects Yes Yes Yes
N 140192 107526 95647
Adj Rshysq 0310 0338 0365
Note Robust standard errors are in parentheses + significance at 10 percent significance at 5 percent Thenumber of observation is based on the number of counties the number of years and the number of providerspecialties in each model (ie physicians include 4 primary care specialties and nonshyphysicians include 3 subshyspecialties)shy
The PCIP policy could impact the number of Medicare providers submitting PCIP eligible claims through several channels First the policy may induce an established PCP to start to treat Medicare patients (new or established patient) under PCIP eligible services that they may not have done before In addition the policy may also encourage new providers fresh out of their completion of residency training to provide PCIP eligible services under Medicare Lastly one can also argue that the PCIP policy may encourage providers with a PCIP nonshyeligible specialty to switch to a PCIPshyeligible specialty and increase their chance to receive the incentive payment This last scenario could be especially relevant for internal medicine subshyspecialties such as cardiology pulmonary disease nephrology and endocrinology which are not PCIPshyeligible although the internal medicine specialty is PCIPshyeligible Without judging whether such specialty switching is a desired outcome under the PCIP policy we first examine to what extent such switching of specialty is prevalent in our dataset and second whether such phenomenon is large enough to influence the impact of the PCIP policy on the number of providers who submit at least one Medicare claim under PCIP eligible services
Based on our 2005shy2011 claims data we have estimated that during the postshyPCIP policy period (2010 and 2011) there are about 30864 new primary care physicians (family practice internal medicine pediatrics and geriatrics) and 27927 new primary care nonshyphysicians who have submitted at least one claim under Medicare (Note that in this accounting we do not attempt to distinguish between ldquonewrdquo providers who were induced by the PCIP to participate and providers that would have entered the Medicare program anyway) Based on our Medicare data we have estimated that 3057 physicians with at least one Medicare claim switched their specialty to a PCIP eligible specialty during the postshypolicy period Over 50 percent (1645) of these specialty switches are switches into internal medicine mainly from internal medicine subshyspecialties The number of specialty switchers is substantially smaller than the number of total new Medicare physicians with a PCIP eligible specialty in the postshypolicy periods Thus switching of specialty could not account for the estimated impact of the PCIP policy on the number of primary care physicians
Based on our claims data we estimate that during the postshyPCIP policy period (2010 and 2011) there are 17662 new primary care physicians (family practice internal medicine pediatrics and geriatrics) who have submitted at least one PCIP eligible claim Additionally we have estimated from published sources that during the post policy period there are about 10000 residency
35
Final Report Health Practitioner Bonuses
positions filled under primary care annually from 2009 to 201142 If the Medicare PCIP policy attracts part of these providers under Medicare to provide PCIP eligible services then such evidence would be consistent with our estimated impact of the PCIP policy in Exhibit 13
Exhibit 14 shows the impact of the PCIP policy on the number of providers accepting new Medicare patients (Model 1) and on the number of new Medicare providers (Model 2) The estimated coefficient on the main variable of interest mdash the interaction between the PCIP eligibility indicator and the postshy2009 indicator mdash suggests that due to the PCIP policy on average the number of PCPs accepting new Medicare patients increased by about 1 provider per county per year for a given PCIP eligible specialty This estimated impact is not negligible given that there are about 9 Medicare PCPs for a given primary care specialty who accept new Medicare patients per county per year during the sample period
Similarly Model (2) in Exhibit 14 shows the impact of the PCIP policy on the number of new Medicare providers who have submitted Medicare claims for PCIP eligible services The estimated coefficient on the main variable of interest suggests that due to the PCIP policy on average the number of new Medicare primary care providers with at least one claim submitted for PCIP eligible services increased by 0148 per county per year for a given PCIP eligible specialty Given that on average there are about 14 new Medicare primary care providers per county per year in a PCIP eligible specialty with at least one PCIP eligible claim during the sample period the estimated impact is again not negligible
Exhibit 14 Impact of Medicare PCIP on the Number of Providers Accepting New Medicare Patients and the Number of New Primary Care Providers under Medicare with Claims for
PCIP Eligible Services (2005shy2011)
Number of Providers Accepting
New Medicare Patients (1)
Number of New
Medicare Providers (2)
PCIP Elig Specialty Indicator 2819 4367
(1959) (0297)
Elig Specialty Ind x Post 2009 0883 0148
(0345) (00440)
Post 2009 1605 0293
(0369) (00460)
Median Income ($10k) 1455 00508
(0295) (00445)
Percent in poverty 0143 00160
(00366) (000545)
Population (10k) 0351 00482
(00204) (000328)
Percent Population over 65 shy0177 shy00443
(00295) (000436)
Unemployment Rate shy0314 shy00512
(00374) (000544)
Intercept shy3432 shy3926
42 Estimates include the following primary care specialties family practice internal medicine (including pediatrics)
pediatrics Source National Resident Matching Program Results and Data 2011 Main Residency Match National Resident Matching Program Washington DC 2011
36
Final Report Health Practitioner Bonuses
Number of Providers Accepting
New Medicare Patients (1)
Number of New
Medicare Providers (2)
(2461) (0330)
Specialty Fixed Effects Yes Yes
Year Fixed Effects Yes Yes
State Fixed Effects Yes Yes
N
Adj Rshysq
140192
0250
121084
0255
Note Robust standard errors are in parentheses + significance at 10 percent significance at 5 percent
2 Impact of PCIP Policy on Number of Claims for EampM Services
The DID estimates from the model using the volume of EampM claims as the outcome variable are presented in Exhibit 15 The estimated coefficient of that interaction term in the first column of Exhibit 15 (ie column (1)) indicates that in response to the Medicare PCIP policy PCPs with PCIP eligible specialties reduced their number of PCIP eligible EampM claims by about 52 on average 43 This represents a reduction in the volume of claims per provider of a little less than 9 percent Furthermore we estimate that on average providers with PCIP eligible specialties had about 187 more EampM claims submitted under Medicare during the sample period than the providers with PCIP nonshyeligible specialties Also for the providers with both PCIP eligible and nonshyeligible specialties the average number of EampM claims submitted went down by 70 claims after 2009
In addition we find that as the number of primary care providers per 10000 population increases the number of claims per provider decreases Finally the volume of claims per provider increases with the providerrsquos age and with the increase in the size of the Medicare population The effect of unemployment on the number of EampM claims per provider is also positive and statistically significant
When the sample is restricted to providers who were near the PCIP eligibility threshold in 2009 (column (3)) the estimated reduction in the number of claims per provider due to the PCIP policy is smaller only about 33 claims44 The reduction in the number of claims per provider in response to the PCIP policy may appear counterintuitive However the total number and value of claims may still increase as a result of the policy as long the number of providers with a PCIP
43 The postshypost policy period in our analysis comprises of two years 2010 and 2011 We have also estimated the
impact of the PCIP policy on the volume of claims and other outcomes discussed later for each postshypolicy year separately and the effects in these two years are not statistically different for a given outcome of interest
44 We focus on the primary care providers who are near the PCIP eligibility threshold because these providers are at
the margin to improve the volume of their PCIP eligible services by incurring a relatively low cost and gain the PCIP incentive payment (ie marginal benefit is much higher relative to the marginal cost) Therefore we would expect the impact of PCIP policy (if there is any) would be more substantial among the providers near the eligibility threshold However if we only focus on those who met the 60 criteria then we would lose the behavioral changes among the providers who are below the threshold may have tried to reach the 60 threshold in response to PCIP This may bias the PCIP impact By focusing only on those providers who met the 60 eligibility criteria we would face the typical problem of selection bias Hence focusing on those providers who are near the eligibility threshold circumvents this problem but captures the essence of the hypothesis that we are referring to In addition we have estimated several models with different ranges (50shy65 50shy70 55shy65 and 40shy80) of the proportion of allowed charges on PCIP eligible primary care services and tested the sensitivity of our results At least for the first three ranges mentioned we find that results are not sensitive to those three ranges However once we broaden the analysis to 40shy80 the estimated impact is in between the effects we observed for all providers and the providers in 50shy65 threshold (as expected) Also the mean value of this proportion in the sample is about 53
37
Final Report Health Practitioner Bonuses
eligible specialty increases at a higher rate than the decline in the number of claims submitted per provider Thus a reduction in the number of claims per provider should not be interpreted as evidence of decreased access to primary care services if the number of providers is increasing at the same time
Exhibit 15 Impact of Medicare PCIP Policy on PCIP Eligible EampM Claims (2005shy2011)
Dependent Variable PCIP Eligible
EampM Claims per Provider
Analysis Sample
(1) EampM
Claims
(2) EampM Claims
(Providers in All Years)
(3) EampM Claims
(Near Eligib 09)
PCIP Elig Specialty Indicator 1869 1166 1176
(1293) (1838) (1246)
Elig Specialty Ind x Post 2009 shy5173 shy3696 shy3259
(1814) (2412) (5762)
Post 2009 shy7442 shy7727 shy3728
(2692) (3423) (3155)
Age 8450 6980 2241
(00450) (00637) (00547)
Male 1657 1989 9039
(0965) (1243) (1162)
Urban shy3978 shy5101 shy4900
(1712) (2153) (2190)
Median Income ($10k) shy7296 shy5815 00475
(0886) (1137) (1057)
Percent in poverty shy4678 shy4105 1523
(0222) (0283) (0272)
Population (10k) shy0107 shy0134 shy00710
(000441) (000576) (000531)
Percent Population over 65 1784 2072 1844
(0256) (0319) (0322)
Unemployment Rate 1307 1766 6838
(0425) (0560) (0522)
Primary Care Phypop10k shy0156 shy0172 shy0258
(000716) (00102) (00146)
PC Nonshyphypop10k shy0452 shy0627 shy0208
(00154) (00234) (00228)
Intercept shy34610 shy30330 shy11460
(1669) (2263) (1734)
Specialty Fixed Effects Yes Yes Yes
Year Fixed Effects Yes Yes Yes
State Fixed Effects Yes Yes Yes
N 2014835 1397760 746845
Adj Rshysq 0222 0241 0380
Note Robust standard errors are in parentheses + significance at 10 percent significance at 5 percent
38
Final Report Health Practitioner Bonuses
3 Impact of PCIP Policy on Allowed Charges for EampM Services
The estimated effect of the PCIP policy on the allowed charges associated with the EampM claims is in general positive and statistically significant (Exhibit 16) While we estimate no significant policy impact on charges for our full sample of providers (Model 1) we do find a significant policy effect when we restrict the sample to those providers most likely to change their behavior in response to the PCIP ie the providers that were near eligibility More specifically for the sample of providers who were near the PCIP eligibility threshold in 2009 (ie Model 3) the estimated coefficient of the interaction term in the last column of Exhibit 16 shows that in response to the Medicare PCIP policy on average the allowed charges of primary care providers with a PCIP eligible specialty increased by about $5611 The estimated effect represents about 93 percent of the mean allowed charges ($60235) per provider per year for the providers with PCIP eligible specialties who were near the eligibility threshold in 2009 This estimated effect on the allowed charges in response to a 10 percent Medicare PCIP program suggests an implied elasticity of the allowed charges per provider per year with respect to the payment is about 1 (ie 9310) The effect is smaller if we restrict the sample to all the providers who submitted EampM claims under Medicare in all seven years The mean allowed charges per provider per year for these providers were $51016 Thus due to the Medicare PCIP policy they experienced an additional 56 percent increase ($2839$51016) in allowed charges One caveat surrounding these results is that since the actual Medicare payment may be smaller in magnitude compared to the allowed charges the increase in actual Medicare payments may be lower than our estimated increases in allowed charges
Exhibit 16 Impact of Medicare PCIP Policy on Allowed Charges for PCIP Eligible EampM Claims (2005shy2011)
Dependent Variable Allowed
Charges for PCIP Eligible EampM
Claims per Provider (EampM
Payments)
Analysis Sample
(1)
EampM Charges
(2)
EampM Charges
(Providers in All Years)
(3)
EampM Charges
(Near Eligib 09)
PCIP Elig Specialty Indicator 74741 11382 7518
(10776) (15832) (10475)
Elig Specialty Ind x Post 2009 5944 28393 56109
(1328) (1769) (4206)
Post 2009 8285 12090 24180
(1835) (2327) (2120)
Age 5501 4099 1234
(3093) (4324) (3721)
Male 110676 131571 61031
(6897) (8780) (8071)
Urban shy10435 shy15097 shy19719
(1116) (1389) (1394)
Median Income ($10k) 8678 12737 9787
(6178) (7872) (7147)
Percent in poverty shy2473 shy1804 1343
(1470) (1862) (1750)
Population (10k) shy2646 shy3481 shy0464
(0322) (0416) (0384)
39
Final Report Health Practitioner Bonuses
Dependent Variable Allowed
Charges for PCIP Eligible EampM
Claims per Provider (EampM
Payments)
Analysis Sample
(1)
EampM Charges
(2)
EampM Charges
(Providers in All Years)
(3)
EampM Charges
(Near Eligib 09)
Percent Population over 65 12427 14194 12150
(1764) (2177) (2170)
Unemployment Rate 12175 15928 7567
(2998) (3869) (3632)
Primary Care Phypop10k shy7423 shy7227 shy1433
(0503) (0703) (0952)
PC Nonshyphypop10k shy3412 shy4836 shy1718
(1082) (1629) (1540)
Intercept shy371778 shy337862 shy158347
(12927) (18147) (13208)
Specialty Fixed Effects Yes Yes Yes
Year Fixed Effects Yes Yes Yes
State Fixed Effects Yes Yes Yes
N 2014835 1397760 746845
Adj Rshysq 0222 0246 0367
Note Robust standard errors are in parentheses + significance at 10 percent significance at 5 percent
So far we have found that the PCIP program resulted in increased allowed charges for EampM services per provider despite some decline in the corresponding number of EampM claims We have already discussed that one potential reason for the decline in the average volume of claims could be due the increase in the number of providers under PCIP eligible specialties that can be specifically attributed to the PCIP policy However the question still remains regarding a shift in the composition of services that may have resulted in increased allowed charges or payments despite the decline in the number of claims per provider
In order to gain a deeper understanding of this issue we estimate the impact of the Medicare PCIP policy on each key component of EampM services (Exhibit 17) More specifically we examine the impact of the policy on the volume of claims associated with services for new patients established patients and EampM claims for all other services EampM claims associated with services for established patients account for more than 80 percent of all the EampM claims (and allowed charges) submitted by providers with PCIP eligible specialties45 Furthermore 15 and 25 minute visits account for 40 percent and 30 percent of all EampM claims for established patients respectively Moreover the 25 minute visits account for a slightly higher share of allowed charges ie 38 percent relative to 34 percent for 15 minute visits
In Exhibit 17 we present the estimated impact of the PCIP on the average number of EampM claims per provider for three relevant samples of providers We find that the introduction of the Medicare PCIP policy reduced the average number of EampM claims submitted for both new and established patients The estimated impact suggests that on average the number of EampM claims per provider for 15 minute visits declined by an additional 46 among PCIPshyeligible providers compared to nonshyeligible providers Similarly results using the sample of all providers
45 For the providers near the PCIP eligibility threshold this share of EampM claims is almost 90 percent
40
lsquo
Final Report Health Practitioner Bonuses
suggest that EampM claims per provider for 25 minute visits increased by an additional 13 among PCIPshyeligible providers compared to nonshyeligible providers When we restrict the sample to providers near the PCIP eligibility threshold in 2009 the decline for EampM claims for 15 minutes visits due to PCIP policy is about 57 claims while the EampM claims associated with 25 minute visits increased by about 42 claims due to the PCIP policy
Exhibit 17 Estimated Impact of Medicare PCIP Policy on the Number of PCIP Eligible EampM Claims (2005shy2011)
Estimated coefficient of variable Elig Specialty Ind x Post 2009 from each DID Model
Dependent Variable Analysis Sample
All Providers in All Years Providers Near Eligibility lsquo09
All EampM Claims shy5173 shy3696 shy3259
New Patient Claims shy1354 shy1591 shy1172
Established Patient Claims shy3525 shy2091 shy2224
Other Claims shy2941 shy0150 1369
Claims by Duration (Minutes)
New Patient Visits
10 00673 00850 00551
20 0160 00269 0209+
30 shy5102 shy5894 shy4607
45 shy7697 shy8930 shy6854
60 shy0966 shy1194 shy0528
Established Patient Visits
5 shy3926 shy3621 shy6227
10 1611 1702 shy2487
15 shy4554 shy4716 shy5649
25 1257 2679 4155
40 00347 1382 1417
Note Robust standard errors are in parentheses + significance at 10 percent significance at 5 percent
The above findings raise the question of whether the policyshyinduced net decrease in the number of EampM claims will be reflected in the corresponding allowed charges To answer this question we estimated the potential impact of the PCIP policy on the allowed charges associated with the each component of the EampM claims (Exhibit 18)
The estimated impact of the PCIP policy on allowed charges associated with 15 minute visits for established patients suggests that on average the policy additionally reduced the total allowed charges by about $1577 per provider per year after 2009 However the estimated policy induced reduction in allowed charges is smaller for providers near the PCIP eligibility threshold ie a reduction of about $602
Moreover the PCIP policy additionally increased the total annual allowed charges by about $2740 per provider after 2009 for 25 minute visits for established patients This is a substantial increase considering that providers with PCIP eligible specialties had about $15217 in allowed charges per year for 25 minute visits for established patients The impact is even larger once the sample is restricted to providers near the PCIP eligibility threshold increase in
41
lsquo
Final Report Health Practitioner Bonuses
total annual allowed charges by about $6807 a 28 percent increase Similarly allowed charges associated with all EampM services for all established patients increased substantially by about $6544 or 12 percent for providers near the PCIP eligibility threshold In the case of all providers the estimated increase in total annual allowed charges for established patients was $1245 per provider We find that the PCIP policy resulted in increased Medicare allowed charges across all providers with PCIP eligible specialties This increase in allowed charges is likely to have also resulted in increased payments for these primary care EampM services
Exhibit 18 Estimated Impact of Medicare PCIP on the Allowed Charges for PCIP Eligible EampM Claims (2005shy2011)
Estimated coefficient of the variable Elig Specialty Ind x Post 2009 from each DID Model
Dependent Variable Analysis Sample
All Providers in All Years Providers Near Eligibility lsquo09
All EampM Payments 5944 28393 56109
New Patient Payments shy19109 shy22065 shy16024
Established Patient Payments 12446 39059 65439
Other Payments 7258 11400 6694
Payments by Duration (Minutes)
New Patient Payments
10 0951 1407+ 0706
20 shy1710 shy2891 shy1237+
30 shy5445 shy6203 shy4922
45 shy11845 shy13594 shy10331
60 shy1658 shy1993 shy6551
Established Patient Payments
5 shy7515 shy7066 shy1223
10 shy3412 shy3594+ shy1183
15 shy15772 shy10952 shy6017
25 27404 46709 68070
40 1906 4367 5792
Note Robust standard errors are in parentheses + significance at 10 percent significance at 5 percent
42
Final Report Health Practitioner Bonuses
Analyzing the Impact of Financial Incentives for Primary Care Providers in Shortage Areas
A Background
Access to health care in underserved areas has been an ongoing source of concern among policy makers A 2013 CRS report for the congress (Physician Supply and the ACA by EJ Heisler) indicates that the expansion of health insurance coverage under the ACA is likely to stimulate the demand for primary care in general and also in the underserved areas HRSA designates certain underserved areas as primary care Health Profession Shortage Areas (HPSAs) These areas meet a defined threshold of physicians to population ratio46 HPSA designations are currently limited to primary medical care HPSAs dental HPSAs and mental health HPSAs In this section we focus on only primary care HPSAs All nonshyfederal Doctors of Medicine (MD) and Doctors of Osteopathy (DO) providing direct patient care and who practice principally in one of the four primary care specialties shy general or family practice general internal medicine pediatrics and obstetricsgynecology shy will be counted under the definition of primary care HPSA As previously noted since 1987 Medicare has been paying bonus payments initially five percent to physicians providing care in rural geographic HPSAs In 1991 the bonus payment was increased to 10 percent and eligibility extended to services provided by physicians in urban geographic HPSAs Thus this particular form of bonus payment has been in place for almost 25 years Although the HPSA bonus is available to nonshyprimary care providers such as dentists and mental health care providers for the purpose of this study we focus only on primary care providers eligible for primary care HPSA bonus
Section 413a of the Medicare Modernization Act put in place an additional 5 percent bonus payment for physicians practicing in Physician Scarcity Areas (PSAs)47 PSAs were those counties and rural zip codes in MSAs with the lowest physician to population ratios These areas often coincided with geographic HPSAs so that physicians practicing in those areas received a 15 percent additional bonus payment during 2005shy2008 when the PSA bonuses were in effect
Some key points to note regarding the PSA bonus are the following
Medicare paid the 5 percent PSA bonus on a quarterly basis and the bonus was based on what Medicare actually paid not the Medicareshyapproved payment amount
The same service could be eligible for the PSA bonus and the HPSA bonus
The payment was based on where the service is performed not on the address of the beneficiary
46 Health Professionals Shortage Areas (HPSAs) are based upon criteria set forth under Section 332 of the Public
Health Service Act HPSAs are defined to include 1) urban and rural geographic areas 2) population groups and 3) facilities with shortages of health professionals HPSA designations are currently limited to primary medicalcare HPSAs dental HPSAs and mental health HPSAs in the past similar designations identified shortages in a wide variety of health professions including podiatry pharmacy and veterinary medicine (Salinsky 2010) For primary care HPSAs one of the following two conditions must prevail within the area a) a ratio of population to fullshytimeshyequivalent primary care physician of at least 35001 or b) a ratio of population to fullshytimeshyequivalent primary care physician of less than 35001 but greater than 30001 and an unusually high need for primary care services or insufficient capacity of existing primary care providers
47 The expiration of the PSA bonus in 2008 was likely a result of Medicare expenditures being capped by law In
House Bill HR 6331 of 2008 the cut was equivalent to 106 percent In order to avoid the 106 percent loss PSA designations were allowed to expire which automatically led to the expiration of the PSA bonus Source httpwwwgrahamshycenterorgonlineetcmedialibgrahamdocumentsmedicareshypaymentmaPar0001Filetmpmapdf
43
Final Report Health Practitioner Bonuses
The PSA bonus was paid on services rendered on or after January 1 2005 through June 30 2008
Only the physician designations of General Practice Family Practice Internal Medicine and ObstetricsGynecology were paid the bonus for the ZIP code areas designated as primary care PSAs All other physician provider specialties were eligible for the specialty PSA area bonus for the ZIP codes areas designated as specialty PSAs48 Once again for the purpose of this study we focus only on the primary care physicians with PSA bonus eligible specialties
Our main claimsshylevel data includes a variable that indicates the location of each provider Additionally CMS provides the list of HPSA and PSA areas In this section we review the PSA geographic areas and the extent of overlap with HPSAs Physicians practicing in these overlap areas received a 15 percent additional bonus payment during 2005shy2008 when the PSA bonuses were in effect
In the exhibits below we present the distribution of primary care providers across HPSA and PSA areas Due to limited data we do not present provider counts for HPSA areas prior to 2007 while the PSA bonus was no longer in place after 2008 Moreover we do not use data from 2011 for the DID analysis as it will include the confounding effect of Medicare PCIP49
Although the PSA bonus does not apply to nonshyphysicians we report the number of nonshyphysicians in PSA areas (in italics) for comparison purposes
We consider only those counties that have a full rather than partial primary care HPSA designation In 2011 we identified 1279 full HPSA counties covering 40 percent of the total US population Exhibits 19 amp 20 show the distribution of PCPs and 2011 PCIP recipients across HPSA and PSA areas over the 2005shy2011 period
48 Dentist Podiatrists Optometrists and Chiropractors were not eligible for PSA bonus Source
httpwwwcmsgovMedicareMedicareshyFeeshyforshyServiceshyPaymentHPSAPSAPhysicianBonusesPSAhtml For zip codes that are not in CMS PSA zip code list the bonus payment cannot be made automatically In these cases physicians have to check whether the county where service is provided is included in CMS PSA county list If the county is included in the PSA county list then physicians need to include ldquoARrdquo modifier in their claims to collect PSA bonus
49 If a region switched its HPSA status in 2011 which is also the first year Medicare PCIP was available
econometrically it would be difficult to disentangle the effects of these two changes The indicator variables showing change in HPSA status and availability of PCIP would be perfectly collinear
44
Final Report Health Practitioner Bonuses
Exhibit 19 Distribution of Primary Care (PC) Providers by HPSA and PSA Regions
2005 2006 2007 2008 2009 2010 2011
PC Physicians Total Total Total Total Total Total Total
All Providers 13835 6
100 14777 1
100 16515 0
100 17301 8
100 17878 4
100 18507 0
100 19193 0
100
in HPSA x x x x 72804 441 77656 449 79620 445 82101 444 81855 426
in PSA 14446 104 15336 104 17026 103 17323 10 NA NA NA NA NA NA
Both in HPSA amp PSA x x x x 6267 38 6461 37 NA NA NA NA NA NA
PCIP 2011 Recipients 93886 100 99359 100 10896 6
100 11505 0
100 12114 0
100 11749 0
100 11400 2
100
in HPSA x x x x 46578 427 50451 439 52871 436 50762 432 47458 416
in PSA 9771 104 10282 103 11290 104 11605 101 NA NA NA NA NA NA
Both in PSA amp HPSA x x x x 3927 36 4143 36 NA NA NA NA NA NA
PC NonshyPhysicians
All Providers 46634 100 53823 100 68297 100 80041 100 88569 100 97789 100 10935 3
100
in HPSA x x x x 28248 414 33148 414 36700 414 40411 413 43902 401
in PSA 5221 112 5894 11 7379 108 8301 104 NA NA NA NA NA NA
Both in HPSA amp PSA x x x x 2919 43 3270 41 NA NA NA NA NA NA
PCIP 2011 Recipients 18681 100 21456 100 27188 100 34363 100 41202 100 37756 100 35380 100
in HPSA x x x x 11310 416 14279 416 17150 416 15614 414 14256 403
in PSA 2328 125 2603 121 3214 118 3802 111 NA NA NA NA NA NA
Both in PSA amp HPSA x x x x 1273 47 1527 44 NA NA NA NA NA NA
Note HPSA includes only full HPSA areas (data from Area Resource File and HPSA status data are not available prior to 2007) PSA status after 2008 is not applicable as 2008 was the final year of the PSA bonus
45
Final Report Health Practitioner Bonuses
Around 40 percent of all primary care providers supplied services in primary care HPSA counties while roughly 10 percent did so in PSA counties The extent of overlap between these two designations amounts to approximately 3 to 4 percent of providers working in dualshydesignation areas We do not observe important differences in these distributions between all providers and PCIP recipients The same general observations apply to the two most represented specialties ie family practice and internal medicine (Exhibit 20)
Exhibit 20 Distribution of the Number of Internal Medicine and Family Practice Physicians by HPSA and PSA regions
Practice Area 2005 2006 2007 2008 2009 2010 2011
Internal Medicine
All Physicians 69391 74411 83117 87090 90291 93904 97526
in HPSA x x 38011 40382 41411 43461 43188
in PSA 5428 5770 6390 6521 NA NA NA
in HPSA amp PSA x x 2304 2372 NA NA NA
PCIP 2011 Recipients 43188 45502 49451 51813 54062 52576 51007
in HPSA x x 22166 23824 24682 24113 22537
in PSA 3423 3585 3915 4009 NA NA NA
in PSA amp HPSA x x 1303 1386 NA NA NA
Family Practice
All Physicians 61438 65205 72247 75132 77536 79891 82298
in HPSA x x 29652 31700 32602 32954 32834
in PSA 8673 9168 10181 10361 NA NA NA
in HPSA amp PSA x x 3776 3921 NA NA NA
PCIP 2011 Recipients 48448 51377 56622 59902 63227 61584 59931
in HPSA x x 22979 24971 26284 24998 23450
in PSA 6220 6546 7199 7417 NA NA NA
in PSA amp HPSA x x 2561 2695 NA NA NA
Note HPSA includes only full primary care HPSA areas (data from Area Resource File and HPSA status data are not available prior to 2007) PSA status after 2008 is not applicable as 2008 was the final year of the PSA bonus
In the case of nonshyphysicians in 2008 around 40 percent were practicing in primary care HPSA areas (Exhibit B8 in Appendix B) Nurse practitioners and physician assistants alike were distributed almost equally between shortage and nonshyshortage areas in 2008 The same is true whether we look across all providers or only 2011 PCIP recipients
B Impact of the PSA Bonus on Primary Care Supply
Since the PSA bonus was in effect from 2005 to 2008 we applied a DID estimation method to identify the effect of elimination of PSA bonus on the following outcome variables number of eligible providers practitionersrsquo volume of services and their total payments We used the provider level data on the number of EampM claims and allowed charges associated with those claims from 2005 to 2011 The data from 2005 to June 2008 show the scenarios in the preshyelimination (of PSA bonus) period and the data from 2009 to 2010 provide outlook on the postshyelimination period Data from 2011 will not be used for the DID analysis as it will include the confounding effect of the Medicare PCIP bonus The sample is restricted to physicians with the
46
τ
Final Report Health Practitioner Bonuses
following PSA bonus eligible primary care specialties family practice internal medicine and OBshyGYN
Equation (1) below shows the econometric model we estimated to assess the impact of PSA bonus policy
lowast = + lowast + + lowast lowast + lowast + + (1)
The model in equation (I) is specified based on the provider level data in each year Here the dependent variable Sit is the volume of primary care (EampM) services provided by primary or nonshyprimary care practitioner i at time t Ti is an indicator for the treatment group that takes a value of 1 if the provider is in a primary care PSA area and zero otherwise PREt is an indicator variable taking the value of 1 if the services are provided during 2005shy2008 period (when PSA bonus program was in effect) and zero otherwise the vector Xit includes variables reflecting the provider characteristics features of their geographic locations etc and is a timeshyspecific fixed effect term The term εit represents random unobserved factors affecting services
If elimination of the PSA bonus was associated with a reduction in the volume of primary care EampM services provided by practitioners in those areas then we should expect the estimated value of 8 to be positive A positive estimated value of 8 would imply higher volume of services during the period when the PSA bonus was in effect In addition the interpretation of the first four terms in equation (I) is as follows
(α + β + θ + δ) = the average number of EampM claims during the PSA period (PRE) for providers located in the PSA regions
(α + β) = the average number of EampM claims during the PostshyPSA period for providers located in the PSA regions
(θ + δ) = the difference in the average number of EampM claims between the PSA and PostshyPSA period for providers located in the PSA regions
θ = the difference in the average number of EampM claims between the PSA and PostshyPSA period for providers regardless of location
Exhibit 21 shows the results from the estimated DID model to identify the impact of the PSA bonus policy on the supply of primary care services We found that on average providers with PSA bonus eligible specialties irrespective of location were estimated to have about 153 more claims submitted during the PSA period compared to the postshyPSA period However bonusshyeligible providers located in PSA areas had on average an additional 50 claims per year compared to those located in nonshyPSA areas We attribute this additional increase in the volume of primary care EampM services to the PSA bonus policy On the other hand we do not find a statistically significant impact of the PSA bonus policy on the total annual allowed charges per physician (column 2)
47
Final Report Health Practitioner Bonuses
Exhibit 21 Impact of PSA Bonus on the Number of EampM Claims under Medicare 2005shy2010
Number of EampM Claims(1) Allowed Charges for
EampM Claims ($)(2)
Location PSA PC Indicator (PSAPC) 7055 56220
(6177) (4154)
PSA Year Indicator (2005shy2008) 1526 8709
(4405) (2964)
PSAPC PSA Year Ind 4984 shy2412
(7276) (4765)
Age 1376 8845
(00757) (5104)
Male 2069 134952
(1453) (1026)
Urban shy3192 shy4230
(2892) (1849)
Median Income ($10k) shy1047 9267
(1430) (9766)
Percent under poverty shy6671 shy3527
(0359) (2332)
shy0144 shy4476
(000680) (0483)
Percent Population over 65 1936 13894
(0424) (2815)
Unemployment Rate 1574 13370
(0720) (4964)
Primary Care Phymcarepop10k shy0110 shy2049
(00139) (0939)
PC Nonshyphymcarepop10k shy0977 shy7510
(00390) (2675)
Intercept shy6872 shy560014
(1898) (12556)
Specialty Fixed Effects Yes Yes
Year Fixed Effects Yes Yes
State Fixed Effects Yes Yes
N 1006453 1006453
Adj Rshysq 0182 0175
Note Robust standard errors are in parentheses + significance at 10 percent significance at 5 percent The sample is restricted to only providers with the following PSA eligible specialty family practice internal medicine and OBshyGYN
Exhibit 22 shows the results from the estimated DID model to identify the impact of the PSA bonus policy on the number of primary care providers at the zip code level As explained above our primary focus is the estimated coefficient of the interaction term between the PSA status indicator of the location of physicians and the PSA period (ie 2005shy2008) The number
48
Population (10k)
Final Report Health Practitioner Bonuses
of providers with PSA bonus eligible specialties is estimated to increase by about one in PSA areas during the PSA period compared to the number of providers in nonshyPSA areas This represents a meaningful increase given that on average there are about six primary care providers in PSA areas We attribute this additional increase in the number of primary care providers to the PSA bonus policy
Exhibit 22 Impact of PSA Bonus on the Number of Primary Care Providers per County (2005shy2010)
Number of Providers with PSA
Bonus Eligible Specialty
Location PSA PC Indicator (PSAPC) shy4951
(0371)
PSA Year Indicator (2005shy2008) shy1722
(0439)
PSAPC PSA Year Ind 1149
(0301)
Urban 5950
(0221)
Median Income ($10k) 0468
(0150)
Percent in poverty 0256
(0040)
Population (10k) 0007
(0001)
Percent Population over 65 0139
(0033)
Unemployment Rate shy0037
(0057)
Primary Care Phymcarepop10k 0146
(0024)
PC Nonshyphymcarepop10k 0037
(0017)
Intercept shy5250
(1522)
Year Fixed Effects Yes
State Fixed Effects Yes
N 78519
Rshysq 00856
Note Robust standard errors are in parentheses + significance at 10 percent significance at 5 percent The sample is restricted to only providers with the following PSA eligible specialty family practice internal medicine and OBshyGYN
C Impact of the HPSA Bonus on Primary Care Supply
Access to health care in shortage areas has been an ongoing source of concern among policy makers Expansion of health insurance coverage through the implementation of the ACA is
49
Final Report Health Practitioner Bonuses
likely to stimulate the demand for primary care in general and specifically in these shortage areas HRSA designates these shortage areas as primary care Health Profession Shortage Areas (HPSAs) using a defined threshold of primary care physicians to population ratio The HPSA bonus has been in place since 1987 and since 1991 the bonus payment remained at 10 percent of the fees associated with the bonus eligible Medicare claims50
In the absence of any variation in the HPSA bonus percentage in the recent past we rely on the change in the primary care HPSA status of different counties in the US over the period between 2007 and 2010 In other words we rely on the variation in HPSA status over time and across counties to identify the effect of the policy We detail the econometric model and exact interpretation of estimated coefficients in Appendix C2 Our analysis of the Area Resource File indicates that 205 US counties gained primary care HPSA status during 2007shy2011 while 257 counties lost their HPSA status51 Subsequently we analyze the changes in the outcomes of interest among primary care providers over time due to changes in the countyrsquos HPSA status during this period It is important to note that although HPSA bonus applies to physicians generally in this section we only focus on primary care physicians with primary care HPSA bonus eligible specialties described earlier The primary outcome variables that we analyzed to identify the changes in physiciansrsquo practice behavior are the volume of primary care services and total Medicare allowed charges associated with those services as captured in Medicare claims data In this framework we have assumed that the HPSA status of an area is exogenous to an individual providerrsquos decision to serve a certain number of patients or provide a given volume of services or any other individualshylevel outcomes However the HPSA status of an area may not be exogenous in models where the outcome of interest is the number of providers relative to the size of population in a given geographic area at the aggregate level This is specifically due to the fact that the HPSA status is designated based on the physicianshy toshypopulation ratio in the area as a whole
The coefficient of the interaction term between the county primary care HPSA status indicator (HPSAPC) and the indicator of whether the county ever gained the HPSA status shows the additional impact of HPSA status on the average number of claims per physician in column 1 (or payments in column 2) in the counties that ever gained the HPSA status (full model specification detailed in Appendix C2) As shown in Exhibit 23 we found that on average Medicare physicians with primary care specialties who are located in counties that ever gained the HPSA status tend to have about 17 more EampM claims submitted annually specifically due to the gain of full HPSA status The effect is statistically significant at 10 percent significance level On the other hand the loss of HPSA status does not seem to have any statistically significant impact on the number of EampM claims
50 Physicians who furnish services to Medicare beneficiaries in areas designated as primary care geographic HPSAs by HRSA as of December 31 of the prior year are eligible for the Medicare HPSA bonus during the current year Since 2005 the HPSA physician bonus payment has been automatically made to physicians who furnish services to Medicare beneficiaries in a ZIP code on the list of ZIP codes eligible for automatic HPSA bonus payment This list is updated annually and is effective for services furnished on and after January 1 of each calendar year Physicians who furnish services to Medicare beneficiaries in a geographic HPSA that is not on the list of ZIP codes eligible for automatic payment must use the AQ modifier ldquoPhysician providing a service in an unlisted Health Professional Shortage Area (HPSA)rdquo on the claim to receive the bonus payment Services that are submitted with the AQ modifier are subject to validation by Medicare The bonus is paid quarterly and is based on the amount paid for professional services
51 Area Resource File (ARF) or Area Health Resource File is an extensive county level database assembled annually
by Health Resources and Services Administration (HRSA) from over 50 sources Source httparfhrsagov
50
Final Report Health Practitioner Bonuses
Exhibit 23 Impact of HPSA Bonus on the Number of EampM Claims and Allowed Charges per Physician under Medicare 2007shy2010
Number of EampM Claims
per Physician(1)
Allowed Charges for
EampM Claims per
Physician ($)(2)
County HPSA PC Indicator (HPSAPC) shy4386 shy30245
(2500) (1721)
Ever Gained HPSA Status Indicator (ToHPSA) shy3991 shy25934
(6900) (4593)
Ever Lost HPSA Status Indicator (ToNonHPSA) shy6122 shy51496
(6772) (4673)
HPSAPCToHPSA 1741+ 4070
(9500) (6491)
HPSAPCToNonHPSA 1137 13804
(8005) (5506)
Age 1268 8544
(00845) (5927)
Male 1927 131368
(1645) (1208)
Urban shy4187 shy6167
(3324) (2220)
Median Income ($10k) shy6798 10347
(1636) (1162)
Percent under poverty shy5469 shy3003
(0416) (2838)
Population (10k) shy0116 shy3253
(000808) (0591)
Percent Population over 65 2129 15447
(0481) (3361)
Unemployment Rate 2043 16501
(0803) (5655)
Primary Care Phymcarepop10k shy000218 4187
(00126) (0881)
PC Nonshyphymcarepop10k shy0951 shy6878
(00362) (2535)
Intercept shy5943 shy578914
(2007) (13846)
Specialty Fixed Effects Yes Yes
Year Fixed Effects Yes Yes
State Fixed Effects Yes Yes
N 743907 743907
Adj Rshysq 0188 0184
Note Robust standard errors are in parentheses + significance at 10 percent significance at 5 percent The sample is restricted to only providers with HPSA eligible specialty family practice internal medicine pediatrics and OBshyGYN
51
Final Report Health Practitioner Bonuses
Next we focus on the impact of primary care HPSA status on the Medicare allowed charges per physicians associated with EampM claims (Exhibit 23 column 2) Column 2 indicates that Medicare primary care physicians who are located in counties that ever gained HPSA status do not experience significant changes in annual allowed charges per physician for EampM claims specifically due to the gain of full HPSA status However Medicare physicians with primary care who are located in counties that ever lost HPSA status tend to have about $1380 more allowed charges annually when the location has the full HPSA status This effect is statistically significant at 5 percent significance level
For our analysis of the impact of HPSA status on the volume of services in terms of EampM claims we focused only on the behavior of primary care physicians We found that on average Medicare primary care physicians tend to submit about 17 more EampM claims annually specifically due to the gain of full HPSA status This may suggest that HPSA bonus may encourage primary care providers to increase access to primary care services In addition based on our analysis of allowed charges for EampM Services we find that the Medicare primary care physicians who are located in counties that ever lost primary care HPSA status tend to have about $1380 more allowed charges annually before the location lost full HPSA status Thus gaining HPSA status is also associated with gain in additional earnings for primary care physicians Hence our analysis finds supportive evidence that HPSA bonus may improve access to primary care services in shortage areas
Finally when the outcome of interest is the PCP to population ratio at the county level relying on the change in primary care HPSA status as the primary source of variation to identify an effect of HPSA status poses additional estimation challenges The phenomena that cause decision makers to change the status may be highly correlated with our outcome of interest In this sense the HPSA status would be an endogenous variable in the regression model where the outcome of interest is the number of primary care providers per county Specifically this endogeneity problem may bias the effect of HPSA status on the number of primary care physicians toward zero One potential way to circumvent the issue of endogeneity of the HPSA status above would be to use the instrumental variable (IV) approach The IV approach relies on the identification of variables ie instruments that would be correlated with HPSA status and that would affect the providershytoshypopulation ratio only through the HPSA status variable These IVs will then be used in the regression framework to tease out the unbiased effect of the HPSA status on the providershytoshypopulation ratio However IVs are not always readily available In future upon availability of appropriate IVs a more inshydepth study can be carried out to resolve the problem of this endogeneity to estimate the unbiased effect of HPSA status on the providershytoshypopulation ratio52
52 Despite the issue of endogeneity of HPSA status we analyze the changes in the number of Medicare primary care
physicians per 10 thousand Medicare populations and the changes in the absolute number of Medicare primary care physicians over time due to changes in the countyrsquos HPSA status during the period of 2007shy2011 using the same DID framework laid out earlier The results from these estimated models are available upon request
52
Final Report Health Practitioner Bonuses
Modeling the Impact of the Increase in Medicaid Reimbursement Rate Relative to the Medicare Rate
A Study Design Overview
The availability of primary care is particularly important for public payer programs such as Medicaid and Medicare Historically Medicaid has been the less generous payer for primary care services relative to Medicare paying just 66 percent of Medicare rates on average53 In this section we first describe the variation in Medicaid reimbursement rates relative to those for Medicare both for primary care and for all services across US states during the period 2008shy2012 and second simulate the effect of a 10 percent increase in the MedicaidshytoshyMedicare fee index on the proportion of US officeshybased physicians accepting new Medicaid patients across all states
Cunningham et al (2011) report that fewer physicians accept new Medicaid patients in response to the low Medicaid reimbursement rates in several states Decker (2012) used data on officeshybased physicians from the 2011 National Ambulatory Medical Care Survey Electronic Medical Records Supplement to summarize the percentage of physicians currently accepting any new patients She finds that 694 percent of physicians in the sample accepted new patients with Medicaid This was lower than the percentage accepting new selfshypay (917 percent) Medicare (830 percent) or privately insured patients (817 percent) Logit regression model estimates showed that raising Medicaid fees to Medicare levels for all physicians a 258 percentageshypoint (35 percent) increase in the current average ratio of 742 would increase the acceptance rate of new Medicaid patients by 86 percentage points (12 percent) shy from an average of 694 percent across physicians to an average of 786 percent
Zuckerman et al (2009) reported that in 2008 stateshylevel average primary care physician fees under Medicaid ranged from 57 percent of the national average Medicaid fees in Rhode Island to 226 percent of national average in Alaska They also found that after strong Medicaid fee growth during 1998shy2003 Medicaid fees fell relative to inflation during 2003shy2008 Despite the slowdown in overall fee growth Medicaid fees for primary care services kept pace with inflation The ACA increases Medicaid reimbursement rates for certain services provided by primary care physicians to 100 percent of Medicare rates in 2013 and 2014 Given the variability of Medicaid payments across states this could be a substantial boost in payments for physicians in some states and less so in others
Zuckerman et al (2009 2012) provided stateshylevel MedicaidshytoshyMedicare fee indices for 2008 and 2012 These studies show that the national average Medicaid reimbursement rate for primary care services declined from 66 percent of the Medicare rate in 2008 to 59 percent in 2012 (about 106 percent decline) However the national average MedicaidshytoshyMedicare fee index for all services declined by about 83 percent (from 72 percent in 2008 to 66 percent in 2012) during the same period
Exhibit 24 reveals wide stateshytoshystate variation in the Medicaid fee relative to the Medicare rate in both 2008 and 2012 In several states including California Florida Michigan New York and Rhode Island the Medicaid primary care fee in 2012 was less than 50 percent of the Medicare rate In several other states including Alaska Delaware Montana North Dakota Oklahoma and Wyoming the Medicaid primary care fee was above 90 percent of the Medicare rate in the same year
53 Small DM and T McGinnis (2012) ldquoLeveraging the Medicaid Primary Care Rate Increase The Role of
Performance Measurementrdquo Center for Health Care Strategies Inc
53
Final Report Health Practitioner Bonuses
There is substantial variation in the percentage change in the MedicaidshytoshyMedicare fee index across these states too During 2008shy2012 most of the states except Maine Mississippi New Jersey New York North Dakota and DC experienced a decline in the MedicaidshytoshyMedicare fee index for all services and for primary care services Another exception is Minnesota where the MedicaidshytoshyMedicare fee index for all services declined by 66 percent during the same period but the index for primary care services increased by about 259 percent In Arizona Georgia Louisiana Michigan Nevada Virginia and Wyoming the decline in MedicaidshytoshyMedicare fee index for primary care is more than 15 percent
Decker (2012) and Cunningham (2011) exploit the stateshylevel variation in the Medicaid reimbursement rates and they examine the impact of an increase in Medicaid fee relative to Medicare on physiciansrsquo propensity to accept Medicaid patients
Cunningham (2011) uses 2008 Health Tracking Physician Survey on 1748 primary care physicians (PCPs) The empirical analysis includes the estimation of a linear probability regression model of whether a PCP is accepting new Medicaid patients using the stateshylevel Medicaid reimbursement rate relative to Medicare rate as one of the independent variables The key findings of this study can be summarized as follows
Average MedicaidshytoshyMedicare fee ratio for primary care in 2008 was 662 percent
On average PCPs accepting all or new Medicaid patients in the US in 2008 was 415 percent
One percentage point increase in MedicaidshytoshyMedicare fee ratio increases theshyproportion of PCPs accepting Medicaid patients by 0214shy
Thus based on the findings in Cunningham (2011) the implied elasticity of accepting primary care patients with respect to the MedicaidshytoshyMedicare fee is about 03454 In other words a 10 percent increase in the Medicaid fee relative to Medicare across all states would imply an increase in the acceptance rate of Medicaid patients from 415 percent to 429 percent nationally The estimated elasticity also suggests that under MedicaidshyMedicare payment parity the national average acceptance rate would go up from 415 percent to 487 percent55
The analytical findings presented here can be improved further if the data on proportion of physicians accepting new Medicaid patients in 2012 are available for each state Similarly availability of the stateshylevel MedicaidshytoshyMedicare fee index in 2011 can also refine the simulation results
54 The implied elasticity is calculated by The Lewin Group and it is based on the following statistics reported in the
study the national average MedicaidshytoshyMedicare fee ratio in 2008 (662 percent) the national average of PCPs accepting all or new Medicaid patients (415 percent) in 2008 and the estimated coefficient of MedicaidshytoshyMedicare fee ratio (0214) The estimated coefficient of 0214 implies that if the MedicaidshytoshyMedicare fee ratio increases by 1 percent from the national average (ie from 662 to 6686) then national average proportion of PCPs accepting Medicaid patients goes up by 0214(6686shy662) asymp 014 This is about 034 percent (100014415) increase in the proportion of PCPs accepting Medicaid patients Therefore the implied elasticity = ( percent change in proportion of PCPs accepting Medicaid patients) ( percent change in MedicareshytoshyMedicare fee ratio) = 0341 = 034
55 Lewinrsquos calculation of the new acceptance rate under MedicaidshyMedicare payment parity = [034(100shy
662)662+1]415 asymp 487
54
shy shy
shy shy
shy shy
shy
Final Report Health Practitioner Bonuses
Exhibit 24 MedicaidshytoshyMedicare Fee Index
States Medicare Fee Index Medicare Fee Index
Medicare Fee Index 2008
2012
All Services Primary care
All Services Primary care
All Services Primary care
US 072 066 066 059 shy83 shy106
AL 089 078 078 070 shy124 shy103
AK 140 140 124 127 shy114 shy93
AZ 106 097 082 075 shy226 shy227
AR 089 078 079 070 shy112 shy103
CA 056 047 051 043 shy89 shy85
CO 086 087 071 074 shy174 shy149
CT 099 078 087 071 shy121 shy90
DE 100 100 097 098 shy30 shy20
DC 058 047 080 080 379 702
FL 063 055 057 049 shy95 shy109
GA 090 086 075 070 shy167 shy186
HI 073 064 062 057 shy151 shy109
ID 103 103 088 089 shy146 shy136
IL 063 057 062 054 shy16 shy53
IN 069 061 062 055 shy101 shy98
IA 096 089 082 077 shy146 shy135
KS 093 094 078 082 shy161 shy128
KY 086 080 077 072 shy105 shy100
LA 092 090 075 075 shy185 shy167
ME 063 053 065 063 32 189
MD 087 082 073 070 shy161 shy146
MA 088 078 077 068 shy125 shy128
MI 063 059 051 046 shy190 shy220
MN 076 058 071 073 shy66 259
MS 087 084 090 090 34 71
MO 072 065 059 057 shy181 shy123
MT 103 096 097 094 shy58 shy21
NE 101 082 087 076 shy139 shy73
NV 104 093 074 068 shy288 shy269
NH 073 067 058 060 shy205 shy104
NJ 037 041 045 050 216 220
NM 107 098 092 085 shy140 shy133
NY 043 036 055 042 279 167
NC 095 095 082 085 shy137 shy105
ND 102 101 134 135 314 337
OH 069 066 061 059 shy116 shy106
OK 100 100 097 097 shy30 shy30
55
2008 Medicaid-to- 2012 Medicaid-to- Change in Medicaid-to-
-
shy shy
shy shy
shy shy
shy
Final Report Health Practitioner Bonuses
States Medicare Fee Index Medicare Fee Index
Medicare Fee Index 2008
2012
All Services Primary care
All Services Primary care
All Services Primary care
OR 090 078 081 072 shy100 shy77
PA 073 062 070 056 shy41 shy97
RI 042 036 037 033 shy119 shy83
SC 093 086 081 074 shy129 shy140
SD 095 085 076 069 shy200 shy188
TX 074 068 065 061 shy122 shy103
UT 082 076 074 074 shy98 shy26
VT 095 091 080 081 shy158 shy110
VA 090 088 080 074 shy111 shy159
WA 093 092 076 066 shy183 shy283
WV 085 077 080 074 shy59 shy39
WI 085 067 077 060 shy94 shy104
WY 143 117 116 096 shy189 shy179
Source Zuckerman et al (2009 and 2012) data on Tennessee were not available
Decker (2012) used data from the 2011 National Ambulatory Medical Care Survey Electronic Medical Records Supplement of 3979 officeshybased physicians (PCPs and nonshyPCPs) The studyrsquos empirical analysis included estimation of a logit regression model of whether an officeshybased physician is accepting new Medicaid patients A key variable in this analysis was the stateshylevel MedicaidshytoshyMedicare fee index of 200856 The key findings of this analysis were
Average MedicaidshytoshyMedicare fee ratio for all services (2008) was 72 percent
The average officeshybased physician new Medicaid patient acceptance rate for 2011 was 694 percent
Among PCPs the acceptance rate was 662 percent among nonshyPCPs the acceptance rate was 717 percent
Based on the logit parameter estimates she finds that an increase in the fee ratio from 742 to 100 would be expected to increase acceptance of new Medicaid patients from 694 percent to 786 percent
In other words a 10 percent increase in MedicaidshytoshyMedicare fee index for all services across all states would suggest a rise in the acceptance rate from 694 percent to 723 percent nationally57 Thus the implied elasticity of officeshybased physicians accepting new Medicaid patients with respect to the MedicaidshytoshyMedicare fee is about 04358 The study also finds that
56 One of the key limitations of the study is that the MedicaidshytoshyMedicare fee index is not available for year 2011
There may be substantial difference in stateshywide variation in these indices between 2008 and 2011 period In that case 2008 indices may not explain well the variation in the proportion of physicians accepting Medicaid patients
57 Lewinrsquos method of calculating the predicted proportion of accepting new Medicaid patients based on the estimated
logit model is explained in Appendix D 58
Lewinrsquos method of calculating the predicted proportion of accepting new Medicaid patients based on the estimated logit model is explained in Appendix D Using that method a 1 percent change in the 2008 national average
56
2008 Medicaid-to- 2012 Medicaid-to- Change in Medicaid-to-
-
shy shy
shy
shy shy
shy
Final Report Health Practitioner Bonuses
holding other things constant primary care officeshybased physicians are about 73 percentage point less likely to accept new Medicaid patients Decker also estimated the impact on the primary care physicians only and she found that the estimated impact is similar to the one reported above for all physicians More specifically she found that an increase in the MedicaidshytoshyMedicare fee ratio for primary care to 100 was predicted to increase acceptance of new Medicaid patients among primary care physicians from 647 percent to 717 percent
B Simulation Exercise
We simulated the effect of a 10 percent increase in the stateshylevel MedicaidshytoshyMedicare fee indices (for all services) from their 2008 level on the proportion of US officeshybased physicians accepting new Medicaid patients in each state59 A detailed description of the simulation methodology used to predict the proportion of officeshybased physicians accepting Medicaid patients is presented in Appendix D The simulation exercise is based on the empirical findings of Decker (2012) and the data on the proportion of US officeshybased physicians accepting new Medicaid patients for each state reported in the same study
Exhibit 25 summarizes the predicted proportion of US officeshybased physicians accepting new Medicaid patients by state For example in California the MedicaidshytoshyMedicare fee ratio in 2008 was substantially lower than the national average Subsequently only 571 percent of the officeshybased physicians in California were accepting new Medicaid patients Based on the simulation we find that a 10 percent increase in the MedicaidshytoshyMedicare fee index in California (from 056 to 062) would increase the proportion of officeshybased physicians accepting new Medicaid patients in California from 571 percent to 597 percent (about 46 percent increase)
Exhibit 25 Proportion of US Officeshybased Physicians Accepting New Medicaid Patients
States Medicare Fee Index
All Services 2008
physicians accepting
new Medicaid patients
2011
Predicted acceptance rate under
Fee Index (Based on Decker 2012)
(Non -Linear Projection)
US 072 694 722
AL 089 685 720
AK 140 821 857
AZ 106 785 817
AR 089 907 920
CA 056 571 597
CO 086 661 696
CT 099 607 650
DE 100 783 813
DC 058 752 772
MedicaidshytoshyMedicare fee index reported in the study (from 742 percent to 7492 percent) increases the proportion of officeshybased physicians accepting new Medicaid patients from 694 percent to 697 percent Therefore the implied elasticity = ( percent change in proportion of PCPs accepting Medicaid patients) ( percent change in MedicareshytoshyMedicare fee ratio) = ((697shy694)694)1 = 043
59 At this point stateshylevel MedicaidshytoshyMedicare fee index are not available for 2011 and the proportion of physicians
accepting new Medicaid patients are not readily available to Lewin by state in any year other than 2011 In future Lewin Group will explore the availability of such data to strengthen the analysis
57
Medicaid-to- of US office-based
10 rise in Medicaid-to-Medicare
shy
shy shy
shy
Final Report Health Practitioner Bonuses
States
Medicaid-to-
Medicare Fee Index
All Services 2008
of US office based
physicians accepting
new Medicaid patients
2011
Predicted acceptance rate under
10 rise in Medicaid-to-Medicare
Fee Index (Based on Decker 2012)
(Non Linear Projection)
FL 063 591 619
GA 090 674 710
HI 073 699 727
ID 103 847 870
IL 063 649 676
IN 069 706 732
IA 096 876 894
KS 093 682 719
KY 086 794 819
LA 092 621 661
ME 063 740 762
MD 087 659 695
MA 088 806 831
MI 063 811 829
MN 076 963 968
MS 087 796 821
MO 072 676 705
MT 103 899 915
NE 101 870 890
NV 104 752 787
NH 073 817 837
NJ 037 404 421
NM 107 863 885
NY 043 616 635
NC 095 764 795
ND 102 946 955
OH 069 720 745
OK 100 673 713
OR 090 795 821
PA 073 680 709
RI 042 689 706
SC 093 841 863
SD 095 941 950
TN 614
TX 074 699 727
UT 082 835 855
58
-
-
shy shy
shy
shy shy
shy
Final Report Health Practitioner Bonuses
States
Medicaid to
Medicare Fee Index
All Services 2008
of US office based
physicians accepting
new Medicaid patients
2011
Predicted acceptance rate under
10 rise in Medicaid to Medicare
Fee Index (Based on Decker 2012)
(Non Linear Projection)
VT 095 784 813
VA 090 760 790
WA 093 764 794
WV 085 809 833
WI 085 930 940
WY 143 993 995
Note The predicted proportions are based on the estimated logit model in Decker (2012)
Next we analyzed the implication of our findings from the Medicare PCIP policy analysis in the context of the MedicaidshyMedicare payment parity We have already discussed that based on our analysis the number of Medicare primary care providers accepting new Medicare patients increased by almost 10 percent in response to the Medicare 10 percent PCIP policy (Exhibit 14) According to Zuckerman et al (2012) the US average MedicaidshytoshyMedicare fee ratio for primary care services in 2012 was about 059 Thus MedicaidshyMedicare payment parity would imply almost a 70 percent increase in Medicaid fees over the 2012 US average Further the findings by Decker (2012) suggest that in 2011 almost 662 percent officeshybased primary care physicians accepted new Medicaid patients
Given the magnitude of the impact of the Medicare PCIP policy if the MedicaidshyMedicare payment parity policy at least triggers a 10 percent increase in MedicaidshytoshyMedicare fee ratio then we would expect the US average of officeshybased primary care physicians accepting new Medicaid patients to go up to at least 728 percent However considering the 2012 US average MedicaidshyMedicare payment parity would imply a much bigger percentage increase in payments than 10 percent payment increase under the Medicare PCIP policy It is challenging to use the estimated impact of PCIP program to extrapolate the impact of MedicaidshytoshyMedicare parity This is because (1) in general parity would require a much bigger change in MedicaidshytoshyMedicare fee ratio (compared to the 10 percent PCIP payment) and (2) our PCIP analysis is limited in the sense that it is not capturing continuous variation in the incentive payment due to the nature of the program Finally the actual increase in the absolute value of payment under the Medicare and Medicaid payment policies would depend on the volume of primary care services and the current state MedicaidshyMedicare fee index
Conclusions The Affordable Care Act includes two key provisions regarding reimbursement to primary care providers (a) it provides a 10 percent supplemental payment under the Medicare PCIP program to eligible providers (effective January 1 2011) and (b) it raises the Medicaid primary care reimbursement rate at least up to 100 percent of the Medicare rate ASPE has contracted with the Lewin Group to examine the role of Medicare PCIP and supplemental payment programs including the HPSA and PSA incentives in increasing the supply of primary care providers (PCP) and the access of patients to their services
We reviewed the health and labor economics literature to understand the nature and the size of the impact of any financial incentives on the labor supply behavior of PCPs and the resultant impact on the availability of primary care services estimated in the existing body of research
59
-- -
--
-
Final Report Health Practitioner Bonuses
We documented the prior empirical evidence of the impact of financial incentives on raising the supply of primary care workforce the volume of services impact on medical graduatesrsquo propensity to participate in primary care PCPsrsquo retirement decision etc This review also evaluated the past evidence on the effect of bonuses in shortage areas and their effectiveness to redistribute and retain primary care workforce Finally the review of the literature also focused on the stateshyspecific experiences with changes in their respective Medicaid payment rates for primary care and the resultant impact on the supply of PCPs their rate of acceptance of Medicaid patients and the volume of primary care services such as office visits or visits for EampM services
To explore these topics we constructed a provider level data set including all the claims submitted by the entire universe of Medicare providers in each year from 2005 to 2011 We linked Provider360 data (available from Lewin Grouprsquos parent company Optum Inc) and the AMA Physician Master File to add provider characteristics such as demographics (eg age gender) provider designation medical school and practice location We also added geographic location specific variables from the Area Resource File (ARF) based on the practice location information of providers
We find that as a result of the Medicare incentive payment the number of Medicare primary care providers has increased on average annually by about 28 providers per county from 2009 to 2011 The number of primary care physicians with PCIP eligible specialty increased by about 10 percent in response to the 10 percent incentive payment under the PCIP policy (ie elasticity of the number of primary care physicians with respect to the incentive payment is about 1) Eligible claims for some types of PCIP eligible EampM services and associated allowed charges have also increased For example on average there was a 7 percent increase in the number of 25 minute office visits claims due to the PCIP policy On the other hand in response to the PCIP policy there was a 93 percent increase in the average allowed charges (for the eligible services) among primary care provider with PCIP eligible specialties Our results regarding the PCIP impact should be interpreted with caution due to several reasons First we only observe one year after the PCIP was in effect and as data becomes available for the full 2011shy2015 period the magnitude and precision of our estimates may change Second given the limited timeframe of this incentive providers may not be willing to make longshylasting adjustments in their decision to supply primary care services Finally as Medicare providers become more familiar PCIP users in time and adjust their behavior the full impact of the incentive on provider behavior may change
In addition we find that Medicare providers were attracted to PSA areas through the PSA bonus and submitted 78 percent more EampM claims annually during the PSA period Gaining HPSA status also generated an additional 17 EampM claims submitted by primary care physicians with HPSA bonusshyeligible specialties Estimation of HPSA and PSA bonuses impact on primary care supply has been hindered by the existence of biases rising from the fact that the HPSA and PSA designation is a function of the current supply of providers While we try to mitigate some of these sources of bias future research is needed to provide a causal estimate of these bonuses
Finally we document the variation in Medicaid reimbursement rates relative to the Medicare rates both for primary care and for all services across US states during the period 2008shy2012 using the existing body of evidence Using the empirical results from our PCIP analysis we also perform an exercise to simulate the effect of a 10 percent increase in the MedicaidshytoshyMedicare fee index on the proportion of US officeshybased physicians accepting new Medicaid patients across all states The simulation suggests that a 10 percent increase in MedicaidshytoshyMedicare fee ratio would increase the US average of officeshybased primary care physicians accepting new Medicaid patients from 662 to 728 percent We caution against using the
60
Final Report Health Practitioner Bonuses
estimated impact of PCIP program to extrapolate the impact of MedicaidshytoshyMedicare parity This is because (1) in general parity would require a much bigger change in MedicaidshytoshyMedicare fee ratio (compared to the 10 percent PCIP payment) and (2) our PCIP analysis is limited in the sense that it is not capturing continuous variation in the incentive payment due to the nature of the program
61
Final Report Health Practitioner Bonuses
Appendices
Appendix A Bibliography and Literature Matrix Askildsen Jan Erik and Badi H Baltagi 2002 ldquoWill Increased Wages Reduce Shortage of Nurses A
Panel Data Analysis of Nursesrsquo Labour Supplyrdquo Health San Francisco 1ndash28 httpovidsptxovidcomspshy331aovidwebcgiampS=HIBGFPGCKJDDJIGINCCLIAGCBOJCAA00amp Complete+Reference=Ssh36|2|1
Aurlien H G Falck and G Jacobsen 1991 ldquoThe Physicianrsquos Choice of a Specialtyrdquo Tidsskrift for Den Norske Laegeforening Tidsskrift for Praktisk Medicin Ny Raekke 111 (17) 2133ndash2136
Bazzoli G J 1985 ldquoDoes Educational Indebtedness Affect Physician Specialty Choicerdquo Journal of Health Economics 4 (1) 1ndash19
Bindman Andrew B Jean Yoon and Kevin Grumbach 2003 ldquoTrends in Physician Participation in Medicaid The California Experiencerdquo The Journal of Ambulatory Care Management 26 (4) 334ndash43 httpwwwncbinlmnihgovpubmed14567277
Bloom Matt and George T Milkovich 1998 ldquoRelationships Among Risk Incentive Pay and Organizational Performancerdquo Academy of Management Journal 41 (3) 283ndash297 doi102307256908 httpconnectionebscohostcoman953549
Bodenheimer Thomas 2007 ldquoThe Primary Careshyspecialty Income Gap Why It Mattersrdquo Annals of Internal Medicine httpwebmailwendellmurraytaxescomhealthcarepolicypay_gappdf
Bolduc Denis B Fortin and MA Fournier 1996 ldquoThe Effect of Incentive Policies on the Practice Location of Doctors a Multinomial Probit Analysisrdquo Journal of Labor Economics httpwwwjstororgstable1023072535445
ChaixshyCouturier C I DurandshyZaleski D Jolly and P Durieux 2000 ldquoEffects of Financial Incentives on Medical Practice Results from a Systematic Review of the Literature and Methodological Issuesrdquo International Journal for Quality in Health Care Journal of the International Society for Quality in Health Care ISQua 12 (2) 133ndash142 httpwwwncbinlmnihgovpubmed10830670
Chou ChiushyFang and Anthony T Lo Sasso 2009 ldquoPractice Location Choice by New Physicians The Importance of Malpractice Premiums Damage Caps and Health Professional Shortage Area Designationrdquo Health Services Research 44 (4) (August) 1271ndash89 doi101111j1475shy6773200900976x httpwwwpubmedcentralnihgovarticlerenderfcgiartid=2739028amptool= pmcentrezamprendertype=abstract
Clemens Jeffrey and Joshua D Gottlieb 2014 ldquoDo Physicians Financial Incentives Affect Medical Treatment and Patient Healthrdquo American Economic Review 104(4) pp 1320shy1349
Coburn A F S H Long and M S Marquis 1999 ldquoEffects of Changing Medicaid Fees on Physician Participation and Enrollee Accessrdquo Inquiry a Journal of Medical Care Organization Provision and Financing 36 (3) 265ndash279
Cunningham Peter J 2011 ldquoState Variation in Primary Care Physician Supply Implications for Health Reform Medicaid Expansionsrdquo Research Briefs Center for Studying Health System Change (19) 1ndash 11 httpsfolioiupuieduhandle102441004
Cunningham Peter J and Ann S OrsquoMalley 2008 ldquoDo Reimbursement Delays Discourage Medicaid Participation by Physiciansrdquo Health Affairs 28 (1) w17ndashw28 httpwwwncbinlmnihgovpubmed19017679
Decker S 2012 ldquoIn 2011 Nearly OneshyThird of Physicians Said They Would Not Accept New Medicaid Patients but Rising Fees May Helprdquo Health Affairs 31 no8 pp 1673shy1679
Doran Tim Catherine Fullwood Hugh Gravelle David Reeves Evangelos Kontopantelis Urara Hiroeh and Martin Roland 2006 ldquoPayshyforshyperformance Programs in Family Practices in the United
62
thinsp
Final Report Health Practitioner Bonuses
Kingdomrdquo The New England Journal of Medicine 355 (4) (July 27) 375ndash84 doi101056NEJMsa055505 httpwwwncbinlmnihgovpubmed16870916
Dummit LA 2008 ldquoPrimary Care Physician Supply Physician Compensation and Medicare Fees What Is the Connectionrdquo Issue Brief Natl Health Policy Forum (827) http7612169157libraryissueshybriefsIB827_Physician_Income_11shy03shy08pdf
Fournier Gary M and Cheryl Henderson 2005 ldquoIncentives and Physician Specialty Choice a Case Study of Floridarsquos Program in Medical Sciencesrdquo Inquiry a Journal of Medical Care Organization Provision and Financing 42 (2) 160ndash170
Gagneacute Robert and Pierre Thomas Leacuteger 2005 ldquoDeterminants of Physiciansrsquo Decisions to Specializerdquo Health Economics 14 (7) 721ndash735 httpwwwncbinlmnihgovpubmed15678516
Gibbons Robert and Kevin J Murphy 1992 ldquoOptimal Incentive Contracts in the Presence of Career Concerns Theory and Evidencerdquo Journal of Political Economy (3792) (September) httpwwwnberorgpapersw3792
Gosden T F Forland I S Kristiansen M Sutton B Leese A Giuffrida M Sergison and L Pedersen 2001 ldquoImpact of Payment Method on Behaviour of Primary Care Physicians a Systematic Reviewrdquo Journal of Health Services Research Policy 6 (1) 44ndash55 httpeprintswhiteroseacuk52996
Grobler Liesl Ben J Marais S A Mabunda P N Marindi Helmuth Reuter and Jimmy Volmink 2009 ldquoInterventions for Increasing the Proportion of Health Professionals Practising in Rural and Other Underserved Areasrdquo Cochrane Database of Systematic Reviews Online 2 (1) CD005314 doi10100214651858CD005314pub2 httpwwwncbinlmnihgovpubmed19160251
Hadley J J Reschovsky C Corey and S Zuckerman 2009 ldquoMedicare Fees and the Volume of physiciansrsquo Servicesrdquo Inquiry 1Vol 46 No 4 Winter 2009shy2010 372shy390
Henderson M C D K Hunt and J W Williams 1996 ldquoGeneral Internists Influence Students to Choose Primary Care Careers The Power of Role Modelingrdquo The American Journal of Medicine 101 (6) 648ndash653
Hernoes E Marte Sollie and S Stroslashm 2000 ldquoEarly Retirement and Economic Incentivesrdquo The Scandinavian Journal of 102 (3) 481ndash502 httponlinelibrarywileycomdoi1011111467shy944200211abstract
Hogan F Paul and Ellen Bouchery 2010 ldquo A Model of Subspecialty Choice for Internal medicine Residentsrdquo prepared by The Lewin Group for the American College of Cardiology
Holmes George M 2005 ldquoIncreasing Physician Supply in Medically Underserved Areasrdquo Labour Economics 12 (5) (October) 697ndash725 doi101016jlabeco200402003 httplinkinghubelseviercomretrievepiiS0927537104000284
Kuhmerker K and T Hartman 2007 ldquoPayshyforshyperformance in State Medicaid Programsrdquo New York (NY) Commonwealth Fund
Lynch D C D A Newton M S Grayson and T W Whitley 1998 ldquoInfluence of Medical School on Medical Studentsrsquo Opinions About Primary Care Practicerdquo AAMC Academic Medicine Journal of the Association of American Medical Colleges 73 (4) 433ndash435
Manning WG Newhouse JP Duan N Keeler EB Benjamin B Liebowitz A et al 1988 ldquoHealth insurance and the demand for medical care Evidence from a randomized experimentrdquo Santa Monica CA RAND Corporation
McDonald Ruth and Martin Roland 2009 ldquoPay for Performance in Primary Care in England and California Comparison of Unintended Consequencesrdquo Annals Of Family Medicine 7 (2) 121ndash127 httpwwwpubmedcentralnihgovarticlerenderfcgiartid=2653973amptool=pmcentrezamprendertype=abs tract
Midtsundstad Tove 2012 ldquoEffects of Companiesrsquo Initiatives to Reduce Early Retirement Among Older Workersrdquo Nordic Journal of Working Life Studies 2(3) 89-108
63
thinsp
Final Report Health Practitioner Bonuses
Morrow R W A D Gooding and C Clark 1995 ldquoImproving Physiciansrsquo Preventive Health Care Behavior Through Peer Review and Financial Incentivesrdquo Archives of Family Medicine 4 (2) 165ndash169
Nicholson S 2002 ldquoPhysician Specialty Choice Under Uncertaintyrdquo Journal of Labor Economics 20 (4) 816ndash847
Nicholson Sean and C Propper 2011 ldquoMedical Workforcerdquo In Handbook of Health Economics 873ndash 923
Petersen Laura A LeChauncy D Woodard Tracy Urech Christina Daw and Supicha Sookanan 2006 ldquoDoes Payshyforshyperformance Improve the Quality of Health Carerdquo Annals of Internal Medicine 145 (1 Suppl) 538 author reply 538ndash539 httpwwwncbinlmnihgovpubmed16908917
Petterson Stephen M and Andrew W Bazemore 2012 ldquoProjecting US Primary Care Physician Workforce Needs 2010shy2025rdquo Annals of Family Medicine Vol 10 (No 6) 503ndash509 doi101370afm1431INTRODUCTION httpwwwannfammedorgcontent106503abstract
Piper Kip and Sellers Dorsey 2009 Global Payments to Improve Quality and Efficiency in Medicaid
Rabinowitz H K J J Diamond F W Markham and N P Paynter 2001 ldquoCritical Factors for Designing Programs to Increase the Supply and Retention of Rural Primary Care Physiciansrdquo Jama The Journal Of The American Medical Association 286 (9) 1041ndash1048 httpjamaamashyassnorgcgidoi101001jama28691041
Ramsey P G J B Coombs D D Hunt S G Marshall and M D Wenrich 2001 ldquoFrom Concept to Culture The WWAMI Program at the University of Washington School of Medicinerdquo Academic Medicine 76 (8) 765ndash775
Reschovsky J A Ghosh and K Stewart 2012 Paying More for Primary Care Can It Help Bend the Medicare Cost Curve The Commonwealth Fund httpwwwcommonwealthfundorg~mediaFilesPublicationsIssueBrief2012Mar1585_Reschovsky _paying_more_for_primary_care_FINALv2pdf
Rizzo J A and D Blumenthal 1994 ldquoPhysician Labor Supply Do Income Effects Matterrdquo Journal of Health Economics 13 (4) 433ndash453 httpwwwncbinlmnihgovpubmed10140533
Rosenthal MB Li Z Epstein AM Frank R G 2005 ldquoEarly Experience with Payshyforshyperformance From Concept to Practicerdquo JAMA The Journal of the American Medical Association 294 (14) (October 12) 1788ndash1793 httpdxdoiorg101001jama294141788
Rosenthal Meredith B and R Adams Dudley 2007 ldquoPayshyforshyperformance Will the Latest Payment Trend Improve Carerdquo Jama The Journal Of The American Medical Association 297 (7) 740ndash744 httpwwwncbinlmnihgovpubmed17312294
Salinsky E 2010 ldquoHealth Care Shortage Designations HPSA MUA and TBDrdquo National Health Policy Forum Background Paper No 75 pp 1shy36
Saether Erik Magnus 2005 ldquoPhysiciansrsquo Labour Supply The Wage Impact on Hours and Practice Combinationsrdquo Labour 19 (4) (December) 673ndash703 doi101111j1467shy9914200500317x httpdoiwileycom101111j1467shy9914200500317x
Scott Anthony Peter Sivey Driss Ait Ouakrim Lisa Willenberg Lucio Naccarella John Furler and Doris Young 2011 ldquoThe Effect of Financial Incentives on the Quality of Health Care Provided by Primary Care Physiciansrdquo Cochrane Database of Systematic Reviews Online 9 (9) CD008451 httpwwwncbinlmnihgovpubmed21901722
Sempowski Ian P 2004 ldquoEffectiveness of Financial Incentives in Exchange for Rural and Underserviced Area Returnshyofshyservice Commitments Systematic Review of the Literaturerdquo Canadian Journal of Rural Medicine the Official Journal of the Society of Rural Physicians of Canada Journal Canadien De La Medecine Rurale Le Journal Officiel De La Societe De Medecine Rurale Du Canada 9 (2) 82ndash88 httpwwwncbinlmnihgovpubmed15603680
Shen YushyChu and Stephen Zuckerman 2005 ldquoThe Effect of Medicaid Payment Generosity on Access and Use Among Beneficiariesrdquo Health Services Research 40 (3) (June) 723ndash44 doi101111j1475shy
64
Final Report Health Practitioner Bonuses
6773200500382x httpwwwpubmedcentralnihgovarticlerenderfcgiartid=1361165amptool= pmcentrezamprendertype=abstract
Shugarman Lisa R and Donna O Farley 2003 ldquoShortcomings In Medicare Bonus Payments For Physicians In Underserved Areasrdquo Health Affairs 22 (4) (July 1) 173ndash178 doi101377hlthaff224173 httpcontenthealthaffairsorgcontent224173abstract
Shurgman Lisa R Donna O Farley Pat Taylor and J Scott Ashwood 2001 Trends in Bonus Payments for Physician Services to Rural Medicare Beneficiaries
Sivey Peter Anthony Scott Julia Witt Catherine Joyce and John Humphreys 2012 ldquoJunior Doctorsrsquo Preferences for Specialty Choicerdquo Journal of Health Economics 31 (6) (December) 813ndash23 doi101016jjhealeco201207001 httpwwwncbinlmnihgovpubmed22940638
Sloan Frank 1970 ldquoLifetime Earnings and Physiciansrsquo Choice of Specialtyrdquo Industrial and Labor Relations Review Vol 24 (No 1) (October 13) pp 47ndash56 httpdukespacelibdukeedudspacehandle101612547
Small David Marc and Tricia McGinnis 2014 Leveraging the Medicaid Primary Care Rate Increase The Role of Performance Measurement
Staiger Douglas O David I Auerbach and Peter I Buerhaus 2010 ldquoTrends in the Work Hours of Physicians in the United Statesrdquo The Journal of the American Medical Association 303 (8) (February 24) 747ndash53 doi101001jama2010168 httpwwwpubmedcentralnihgovarticlerenderfcgiartid=2915438amptool=pmcentrezamprendertype= abstract
Town Robert Robert Kane Paul Johnson and Mary Butler 2005 ldquoEconomic Incentives and Physiciansrsquo Delivery of Preventive Care a Systematic Reviewrdquo American Journal of Preventive Medicine 28 (2) (February) 234ndash40 doi101016jamepre200410013 httpwwwncbinlmnihgovpubmed15710282
Vaughn Bryan T Steven R DeVrieze Shelby D Reed and Kevin a Schulman 2010 ldquoCan We Close the Income and Wealth Gap Between Specialists and Primary Care Physiciansrdquo Health Affairs 29 (5) (May) 933ndash40 doi101377hlthaff20090675 httpwwwncbinlmnihgovpubmed20439883
Verby J E J P Newell S A Andresen and W M Swentko 1991 ldquoChanging the Medical School Curriculum to Improve Patient Access to Primary Carerdquo Jama The Journal Of The American Medical Association 266 (1) 110ndash113 httpjamaamashyassnorgcontent2661110short
Zuckerman Stephen 2004 ldquoChanges in Medicaid Physician Fees 1998shy2003 Implications for Physician Participationrdquo Health Affairs (June) 1998ndash2003 doi101377hlthaffW4374 httpwwwhealthaffairsorgRWJZuckerman_June04pdf
Zuckerman Stephen Aimee F Williams and Karen E Stockley 2009 ldquoTrends in Medicaid Physician Fees 2003shy2008rdquo Health Affairs 28 (3) w510ndashw519 httpwwwncbinlmnihgovpubmed19401290
Zuckerman S and D Goin 2012 ldquoHow Much Will Medicaid Physician Fees for Primary Care Rise in 2013 Evidence from a 2012 Survey of Medicaid Physician Feesrdquo Kaiser Commission on the Medicaid and the Uninsured Issue Paper December 2012
65
Final Report Health Practitioner Bonuses
Literature Matrix
Study Goal Results Data Type of Study Reference
Topic Effect of Earnings on the Supply of Primary Care Services and Providers Role of Medicare Primary Care Bonuses (Section III)
Estimate a model where medical Data set with the Econometric students consider entry The income elasticity estimates range from 103 in family preferred and realized model Nicholson probabilities when selecting a practicepediatrics to 220 in radiology specialties for 7200 (conditional 2002 specialty medical students logit)
Estimated career wealth The present value of career wealth from college accumulation across specialists primary care physicians physician assistants business school graduates and college graduates Comparing specialists represented by cardiologists to
graduation through age sixtyshyfive was estimated at $5171407 for cardiologists $2475838 for primary care physicians $1725171 for MBA graduates $846735 for physician assistants and $340628 for college graduates For a primary care physicianrsquos lifetime earnings to equal that of a cardiologist the primary care
Data from multiple sources included income income taxes living expenses and graduate school
Compound interest wealth accumulation model
Vaughn et al 2010
primary care physicians in physician would have to receive a bonus of $11 million expenses
scenarios upon completion of medical school
Determine effect of educational indebtedness on the specialty choices of new physicians especially in light of the perceived shortage of primary care physicians
Medical students are more likely to choose primary care when the expected earnings are relatively large A $10000 (20 percent of the mean earnings) increase in expected earnings in primary care relative to the nonshyprimary care yields a 14 percentage point increase in the probability of choosing primary care
Data set from American Medical Associationrsquos 1983 lsquoSurvey of Resident Physiciansrsquo
Econometric model (utility maximization)
Bazzoli 1985
Estimation of career choice and medical studentrsquos decision to specialize given lifetime utility maximization
In response to 91 percent reduction in relative feeshypershyconsultation for a general practitioner would lead to between a 04 percent reduction and a 229 percent reduction in the proportion of Medical students entering general practice
Data from multiple sources Model estimated from sample of 30184 physicians who practiced in Canada between 1989 and 1998 and whose year of graduation from medical school is between 1975 and 1991
Econometric model (multinomial logit)
Gagne and Leger 2005
Determine the causes of the primary careshyspecialist income gap why the ResourceshyBased Relative Value Scale failed to prevent the income gap
The RBSVS failed due to four factors (1) the volume of diagnostic and imaging procedures has increased more rapidly than the volume of office visits (2) the process of updating fees every five years is heavily influenced by the Relative Value Scale Update Committee which is composed of a majority of specialists (3) Medicarersquos formula for controlling physician payments penalizes primary care physicians and (4) private insurers tend to pay for procedures at higher rates than office visits relative to Medicare
Data from multiple sources income information between 1995 and 2005
Literature review Bodenheimer 2007
66
Final Report Health Practitioner Bonuses
Study Goal Results Data Type of Study Reference
Determine the effects of expected future earnings and other attributes on specialty choice
Simulated policy changes indicate increasing general practitioners earnings by $50000 or increasing opportunities for procedural or academic work (specifically limiting the amount of onshycall hours) can increase the number of junior doctors choosing general practice by between 8 and 13 percentage points This implies an earnings elasticity of specialty choice of 095
Data from the Medicine in Australia Balancing Employment and Life (MABEL) survey
Econometric model (logit)
Sivey amp Scott 2012
Estimate a model of physician labor supply focusing on the impacts of wage and nonshywage income
Evidence of significant income effects For male physicians the income effect of a wage change on labor supply is negative with an elasticity of shy 026 The pure substitution effect of a wage change increases labor supply a 1 percent increase in wages leads to a 049 percent increase in labor supply controlling for income effects
Data from the 1987 Practice Patterns of Young Physicians Survey (YPS)
Econometric model (log linear regression)
Rizzo and Blumenthal 1994
Estimate the labor supply of physicians employed at hospitals in Norway using personnel register data merged with other public records
Research indicates a 10 percent wage increase would lead to a 3 percent increase in physician labor supply (wage elasticity of 03) The magnitude of the wage elasticity in this case may be relatively small because of hospital employed physicians tendency to have a lower wage than selfshyemployed physicians though still larger than previous estimates
Data set used is a sample of 1303 male physicians observed over the period 1993 and 1997
Econometric model (GMM system GMM)
Baltagi et al 2005
Estimate wage elasticities for Norwegian nurses
40 percent of PCC students returned to New Mexico to practice compared to 32 percent of traditional students
Data includes detailed information on 18066 individuals over 5 years totaling 56832 observations between 1993 and 1997
Econometric model (fixed effects)
Askildsen amp Baltagi 2002
Effect of a permanent 10 percent increase in fees for primary care ambulatory visits on volume of services and cost to Medicare
Analysis shows the fee increase would increase primary care visits by 88 percent and raise the overall cost of primary care visits by 17 percent However these increases would yield more than a sixshyfold annual return in lower Medicare costs for other servicesmdashmostly inpatient and postshyacute caremdashonce the full effects on treatment patterns are realized The net result would be a drop in Medicare costs of nearly 2 percent These
Data set contains Medicare claims data (2004 to 2006) as well as physician data from the Community Tracking Study (CTS) Physician Survey (2004 to 2005)
Econometric model
Reschovsky et al 2012
Estimates the relationship between Medicare fees and quantities provided by physicians for eight specific services
Results show that Medicare fees are positively related to quantity provided for all eight services and are significantly different from zero and elastic for five Estimates are that a 10 percent reduction in Medicare fees would lead to 18 percent to 66 percent reduction in the volume of office visits
Data set contains 13707 physicians who responded to surveys in 20002001 andor 20042005 and were linked to all Medicare claims for their Medicare patients
Econometric model (GLM)
Hadley et al 2009
67
Final Report Health Practitioner Bonuses
Study Goal Results Data Type of Study Reference
Estimate trends in hours worked by US physicians and assess for association with physician fees
After remaining stable through the early 1990s mean hours worked per week decreased by 72 percent between 1996 and 2008 among all physicians (from 549 hours per week in 1996shy1998 to 510 hours per week in 2006shy2008 Excluding resident physicians whose hours decreased by 98 percent the last decade due to duty hour limits imposed in 2003 nonresident physician hours decreased by 57 percent
Data set from US Census Bureau Current Population Survey between 1976 and 2008 (N=116733)
Outcomes of a Problemshybased learning model (specialty and practice location)
Steiger et al 2010
Study Goal Results Data Type of Study Reference
Topic Financial Incentives for Primary Care Providers in Underserved Areas (Section IV)
Evaluate effectiveness and developing trends in bonus payments to rural physicians
In 1991 the total amount of HPSA bonus was almost 316 million dollars Estimates show that 583 percent of the total HPSA bonus payment went to rural HPSAs while the remaining 417 percent went to urban HPSAs They also observed that the total bonus payment grew to reach about 106 million dollars in 1996 but then gradually declined to almost 77 million dollars in 1998 The rural proportion of HPSA bonus payments decreased to 511 percent
Data set includes Area Resource File (ARF) and Medicare Part B claims data for multiple years
Trend examination
Shugarman et al 2001
Examine trends in Medicare spending for basic payments and bonus payments for physician services provided to beneficiaries residing in nonmetropolitan counties
Payments under the Congressionallyshymandated bonus payment program accounted for less than 1 percent of expenditures for physician services in nonmetropolitan underserved counties Physician payments increased from 1992 to 1998 while bonus payments increased through 1996 but then declined by 13 percent by 1998 The share of bonus payments to primary care physicians declined throughout the decade but the share for primary care services increased
Data set includes Area Resource File (ARF) and Medicare Part B claims data for multiple years
Trend examination
Shugarman and Farley 2003
Evaluate the effectiveness of programs that provide financial incentives to physicians in exchange for a rural or underserviced area returnshyofshyservice (ROS) commitment
The majority of studies reported effective recruitment despite high buyshyout rates in some USshybased programs Increasing Canadian tuition and debt among medical students may make these programs attractive The one prospective cohort study on retention showed that physicians who chose voluntarily to go to a rural area were far more likely to stay long term than those who located there as an ROS commitment Multidimensional programs appeared to be more successful than those relying on financial incentives alone
Limited literature available given quality limitations
Literature Review
Sempowski et al 2004
Assess the effect of various On average a 10 percent increase in the general practitioner Data for physicians come Econometric incentive measures fees for medical services in a region increases the propensity from la Corporation model (spatial Bolduc et introduced in Quebec of a beginning GP to work in this region by 7 percent Thus the Professionnelle des autoregressive al 1996 (Canada) to influence the implied elasticity of location choice probability with respect to Medecins du Qu6bec multinomial
68
Final Report Health Practitioner Bonuses
Study Goal Results Data Type of Study Reference geographical distribution of fee increases is about 07 However this elasticity varies Population data come probit) physicians across regions it is higher in remote regions (with a maximum from Canada Census
of 128) On the other hand on average the elasticity of (various years) and intershylocation choice probability with respect to nonshylabor incomes census estimations from such as study grants is estimated to be about 111 le Bureau de la Statistique
du Qu6bec (unpublished data)
Compare the types of locations chosen by alumni and nonshyalumni of a United States program charged with increasing physician supply
Eliminating the program would decrease the supply of physicians in medically underserved communities by roughly 10 percent
Data from multiple sources primarily the
American Medical Association (AMA) master file for 1981 1986 1991 and 1996
Econometric (multinomial logit)
Holmes 2005
Examine the history and results of The Physician Shortage Area Program (PSAP) of Jefferson Medical College and identify factors independently predictive of rural primary care supply and retention
Freshmanshyyear plan for family practice being in the PSAP having a National Health Service Corps scholarship male sex and taking an elective senior family practice rural preceptorship were independently predictive of physicians practicing rural primary care Among PSAP graduates taking a senior rural preceptorship was independently predictive of rural primary care However nonshyPSAP graduates with 2 key selection characteristics of PSAP students (having grown up in a rural area and freshmanshyyear plans for family practice) were 78 percent as likely as PSAP graduates to be rural primary care physicians and 75 percent as likely to remain suggesting that the admissions component of the PSAP is the most important reason for its success
Data includes a total of 3414 Jefferson Medical College graduates from the classes of 1978shy1993 including 220 PSAP graduates
Retrospective cohort study
Rabinowitz et al 2001
69
Final Report Health Practitioner Bonuses
Study Goal Results Data Type of Study Reference
Topic Impact of the Increase in Medicaid Reimbursement Rate Relative to the Medicare Rate (Section V)
Identify the causal effect of increases in Medicaid reimbursement rates relative to the Medicare rate on the propensity of primary care physicians accepting new Medicaid patients
For primary care physicians a 10 percentage point increase in the MedicaidMedicare fee ratio for primary care is associated with only a 21 percentageshypoint increase in Medicaid patient acceptance The average Medicaid reimbursement rate relative Medicare in 2008 was at 662 percent and the national average acceptance rate of new Medicaid patients by PCPs was 415 percent Therefore the implied elasticity of accepting primary care patients with respect to the payment rate is about 033 Excluding pediatricians it is 041
Data acquired from HSC 2008 Health Tracking Physician Survey and American Medical Association (AMA) master file
Econometric model (OLS)
Cunningha m 2011
Examine the effects of Medicaid payment generosity on access and care for adult and child Medicaid beneficiaries
Higher payments increase the probability of having a usual source of care and the probability of having at least one visit to a doctor and other health professional for Medicaid adults and produce more positive assessments of the health care received by adults and children However payment generosity has no effect on the other measures that we examined such as the probability of receiving preventive care or the probability of having unmet needs
Data from the National Surveys of Americarsquos Families (1997 1999 2002) and are linked to the Urban Institute Medicaid capitation rate surveys the Area Resource File and the American Hospital Association survey files
Econometric model (differenceshyinshydifference)
Shen amp Zuckerman 2005
Evaluation in California of whether the expansion of Medicaid managed care and a physician payment increase were associated with an increase over time in the percentage of physicians caring for Medicaid patients
Despite large increases in the use of MedishyCal
managed care and the implementation of MedishyCal physician fee increases between 1996 and 2001 there was no significant inshy crease in the percentage of primary care physicians accepting new MedishyCal patients or having any MedishyCal patients in practice over time
Dataset comprised of surveys of probability samples of primary care and specialist physicians in California in 1996 1998 and 2001 and AMA master file data
Chishysquare tests
Bindman et al 2003
Examine the impact of Californiarsquos Medicaid reshy imbursement for nursing homes which includes incentives directed at staffing
Consistent with the rate incentives and rational expectation behavior expected nursing home reimbursement rates in 2008 were associated with increased RN staffing levels in 2006 but had no relationship with licensed practical nurse and certified nursing assistant staffing The effect was estimated at 2 minutes per $10 increase in rate
Data from Medicaid master file for a total of 927 California freeshystanding nursing homes in 2006
Econometric model (twoshystage MLE)
Mukamel et al 2012
Assess the effects of Medicaid fee changes on physician participation enrollee access and shifts in the site of ambulatory care using several natural experiments in Maine and Michigan
The reimbursement changes included substantial percentage changes in fees however the value of the Medicaid fee improvements relative to the private market eroded very rapidly in the months following the interventions Implied elasticities ranged between 039 and shy0021
Dataset from Medicaid claims and enrollment data between 1988 and 1992
Program Overview amp Outcomes of communityshybased training
Coburn et al 1999
70
Final Report Health Practitioner Bonuses
Appendix B Additional Exhibits
Exhibit B1 Distribution of Primary Care Providers with PCIP Eligible Specialty by Age Sex and Year
Sex Age 2005 2006 2007 2008 2009 2010 2011
Male lt35 114 104 102 98 94 88 79
Male 35shy44 299 295 288 282 276 271 265
Male 45shy54 347 338 323 311 299 287 281
Male 55shy64 186 204 220 235 250 263 275
Male 65+ 53 59 66 74 82 90 100
Male Total 95911 101781 111971 116133 118868 121264 122048
Female lt35 215 205 206 204 201 197 189
Female 35shy44 368 367 359 353 347 342 340
Female 45shy54 315 312 304 298 291 284 278
Female 55shy64 91 104 117 128 142 155 168
Female 65+ 10 12 14 17 19 22 24
Female Total 59446 66054 78531 86972 93905 100930 106003
Missing SexAge
29633 33759 42945 49954 54580 60665 73232
Total 184990 201594 233447 253059 267353 282859 301283
Exhibit B2 Average Number of PCIP Eligible EampM Claims per PCP under Medicare by Specialty 2005shy2011
Specialty 2005 2006 2007 2008 2009 2010 2011
Internal Medicine 869 823 759 746 712 697 653
Family Medicine 722 694 651 649 631 626 605
Pediatrics 51 50 42 39 41 40 36
Geriatrics 989 1026 990 978 960 955 958
Clinical Nurse Specialist 86 85 77 87 97 107 118
Nurse Practitioner 258 257 230 219 219 228 228
Physician Assistant 125 128 120 121 124 134 140
71
Final Report Health Practitioner Bonuses
Exhibit B3 Average Allowed Charges ($) for the PCIP Eligible EampM Claims per PCP under Medicare 2005shy2011
Specialty 2005 2006 2007 2008 2009 2010 2011
Physicians
Internal Medicine $52896 $51477 $51149 $51737 $51438 $55188 $53641
Family Medicine $41019 $40557 $41279 $42369 $43075 $46833 $47163
Pediatrics $3008 $3028 $2705 $2533 $2771 $3055 $2835
Geriatrics $61243 $70593 $68845 $73829 $76317 $82230 $84453
NonshyPhysicians
Clinical Nurse Specialist $4219 $4446 $3974 $4883 $5824 $6841 $7890
Nurse Practitioner $12139 $13055 $11929 $12019 $12600 $14274 $14752
Physician Assistant $5724 $6122 $6064 $6333 $6765 $8133 $8831
Exhibit B4 Proportion of PCIP Eligible EampM Claims per 2011 PCIP Recipients by Specialty 2005shy2011
Specialty 2005 2006 2007 2008 2009 2010 2011
Physicians
Internal Medicine 45 45 44 44 41 42 41
Family Medicine 45 45 44 44 41 42 40
Pediatrics 45 47 47 47 45 41 39
Geriatrics 67 72 70 68 64 62 64
NonshyPhysicians
Clinical Nurse Specialist 64 66 64 60 57 57 56
Nurse Practitioner 66 66 69 68 65 67 68
Physician Assistant 55 56 56 55 51 52 50
Note the proportions are calculated out of all Medicare claims (excluding hospital inpatient ER drug and lab)
Exhibit B5 Average Number of PCIP Eligible EampM Claims per 2011 PCIP Recipients under Medicare by Specialty 2005shy2011
Specialty 2005 2006 2007 2008 2009 2010 2011
Physicians
Internal Medicine 1113 1088 1050 1057 1015 1035 1011
Family Medicine 808 785 752 756 729 752 743
Pediatrics 157 149 130 118 111 129 132
Geriatrics 1168 1237 1191 1187 1145 1181 1193
NonshyPhysicians
Clinical Nurse Specialist 375 384 361 346 335 382 389
Nurse Practitioner 384 403 369 392 405 457 492
Physician Assistant 251 266 260 268 266 301 301
72
Final Report Health Practitioner Bonuses
Exhibit B6 Average Allowed Charges for the PCIP Eligible EampM Claims per 2011 PCIP Recipients under Medicare 2005shy2011
Specialty 2005 2006 2007 2008 2009 2010 2011
Physicians
Internal Medicine $67863 $68281 $70869 $73505 $73494 $81629 $82500
Family Medicine $45958 $45878 $47781 $49440 $49827 $56350 $58004
Pediatrics $9336 $9051 $8460 $7864 $7631 $9836 $10450
Geriatrics $72412 $85046 $82732 $89548 $90821 $101283 $104284
NonshyPhysicians
Clinical Nurse Specialist $17795 $19741 $18922 $19279 $19557 $24141 $25405
Nurse Practitioner $19633 $21605 $19496 $22516 $24830 $29740 $32837
Physician Assistant $11628 $12949 $13457 $14496 $15128 $18717 $19363
Exhibit B7 Proportion of Allowed Charges for PCIP Eligible EampM Claims per 2011 PCIP Recipients 2005shy2011
Specialty 2005 2006 2007 2008 2009 2010 2011
Physicians
Internal Medicine 71 72 74 76 77 79 76
Family Medicine 73 75 77 77 78 80 77
Pediatrics 70 73 75 75 77 77 76
Geriatrics 77 87 88 89 89 90 89
NonshyPhysicians
Clinical Nurse Specialist 76 80 81 83 85 86 85
Nurse Practitioner 68 71 75 79 82 87 87
Physician Assistant 72 74 76 78 81 83 82
Note the proportions are of allowed charges for all Medicare claims (excluding hospital inpatient ER drug and lab)
73
Final Report Health Practitioner Bonuses
Exhibit B8 Distribution of the Number of NPs and PAs across HPSA and PSA regions
Profession Type 2005 2006 2007 2008 2009 2010 2011
Nurse Practitioners
Total Providers 23610 27450 35286 42144 46973 52472 59505
in HPSA x X 14171 16978 18858 20929 23045
in PSA 2946 3331 4139 4694 NA NA NA
in HPSA amp PSA x X 1638 1855 NA NA NA
PCIP 2011 Recipients 12267 14146 18008 23070 27698 25369 23707
in HPSA x X 7335 9344 11148 10178 9312
in PSA 1558 1754 2168 2571 NA NA NA
in PSA amp HPSA x X 861 1027 NA NA NA
Physician Assistants
Total Providers 21240 24439 30823 35593 39226 42871 47340
in HPSA x X 13246 15236 16889 18489 19828
in PSA 2166 2436 3098 3467 NA NA NA
in HPSA amp PSA x X 1230 1363 NA NA NA
PCIP 2011 Recipients 6168 7033 8852 10898 13038 11961 11288
in HPSA x X 3830 4732 5760 5226 4755
in PSA 760 839 1034 1217 NA NA NA
in PSA amp HPSA x X 408 494 NA NA NA
Note HPSA includes only full HPSA areas (data from Area Resource File and HPSA status data are not available prior to 2007) PSA status after 2008 is not applicable as 2008 was the final year of the PSA bonus
Exhibit B9a Distribution of Male Primary Care Physicians with PCIP Eligible Specialty by Age and Year
Note Primary care physicians include following specialties internal medicine family practice pediatrics geriatrics
74
Final Report Health Practitioner Bonuses
Exhibit B9b Distribution of Female Primary Care Physicians with PCIP Eligible Specialty by Age and Year
Note Primary care physicians include following specialties internal medicine family practice pediatrics geriatrics
Exhibit B10 Distribution of Male Primary Care NonshyPhysicians with PCIP Eligible Specialty by Age and Year
Note Primary care nonshyphysicians include following specialties PA NP and CNS
75
Final Report Health Practitioner Bonuses
Exhibit B11 Distribution of Female Primary Care NonshyPhysicians with PCIP Eligible Specialty by Age and Year
Note Primary care nonshyphysicians include following specialties PA NP and CNS
Exhibit B12 Average Number of PCIP Eligible EampM Claims Submitted by 2011 PCIP Recipients 2005 ndash 2011
76
2
0
7
3
4 0 4 6
Final Report Health Practitioner Bonuses
Exhibit B13 Allowed Charges for PCIP Eligible EampM Claims per 2011 PCIP Recipients 2005shy2011
Exhibit B14 Total Number of PCIP Eligible EampM Claims submitted by All Providers in the Control Group 2005shy2011
Specialty 2005 2006 2007 2008 2009 2010 2011
OBGYN 2597637 2612513 2728810 281347 2893204 3047849 3040383
Ophthalmology 5615010 5648040 6070483 597672 5832440 6361330 6164821
Pathology 46894 51364 54748 57005 57147 64078 63652
Urology 6964185 7202012 7571544 777585 7777728 8616096 8641898
Optometry 2464734 2550764 2758214 289154 2969244 3048668 3088461
Podiatry 7788889 8195973 8957163 973940 1001263 1064539 1089067
Psychology 42 11 27 64 1552 2440 2097
Neurophysiology 12609 13838 13858 15451 18142 17962 17714
77
shy
Final Report Health Practitioner Bonuses
Additional Regression Results
Exhibit B15 Impact of Medicare PCIP Policy on the Number of Primary Care Providers Who Have submitted any Medicare Claims (not necessarily under PCIP Eligible Services)
(2005shy2011)
Dependent Variable Number
of Providers per county All Providers (1) Physicians Only (2) Non Physicians Only (3)
PCIP Elig Specialty Indicator 6550 4054 4859
(3929) (4449) (2759)
Elig Specialty Ind x Post 2009 4408 3255 5710
(0503) (0758) (0482)
Post 2009 4588 3314 4187
(0505) (0593) (0350)
Median Income ($10k) 2306 2728 1643
(0424) (0513) (0241)
Percent in poverty 0466 0541 0360
(00535) (00653) (00332)
Population (10k) 0727 0771 0487
(00298) (00359) (00144)
Percent Population over 65 shy0406 shy0262 shy0337
(00407) (00502) (00280)
Unemployment Rate shy0660 shy0652 shy0493
(00522) (00621) (00392)
Intercept shy7242 shy7909 shy490
(4371) (4812) (3069)
Specialty Fixed Effects Yes Yes Yes
Year Fixed Effects Yes Yes Yes
State Fixed Effects Yes Yes Yes
N 140192 107526 95647
Adj Rshysq 0391 0396 0480
Note Robust standard errors are in parentheses + significance at 10 significance at 5 The number of observation is based on the number of counties the number of years and the number of provider specialties in each model (ie physicians include 4 primary care specialties and nonshyphysicians include 3 subshy specialties)
78
-
shy
Final Report Health Practitioner Bonuses
Exhibit B16 Impact of Medicare PCIP Policy on the Number of Primary Care Providers Who Met 60 PCIP Eligibility Threshold Each Year (2005shy2011)
Dependent Variable Number of
Providers per county
All Providers
(1)
Physicians Only
(2)
Non Physicians
Only (3)
PCIP Elig Specialty Indicator 2062 2194 6540
(1769) (2050) (0642)
Elig Specialty Ind x Post 2009 2322 1841 2776
(0341) (0543) (0243)
Post 2009 1252 0750+ 0994
(0348) (0427) (0143)
Median Income ($10k) 0549+ 0847 00118
(0305) (0380) (00942)
Percent in poverty 00663+ 00965 00165
(00379) (00473) (00137)
Population (10k) 0264 0298 00610
(00229) (00284) (000579)
Percent Population over 65 shy0155 shy0105 shy0127
(00277) (00355) (00111)
Unemployment Rate shy0252 shy0259 shy00864
(00357) (00444) (00166)
Intercept shy2281 shy2717 shy3777
(2029) (2419) (0775)
Specialty Fixed Effects Yes Yes Yes
Year Fixed Effects Yes Yes Yes
State Fixed Effects Yes Yes Yes
N 140192 107526 95647
Adj Rshysq 0174 0184 0119
Note Robust standard errors are in parentheses + significance at 10 significance at 5 The number of observation is based on the number of counties the number of years and the number of provider specialties in each model (ie physicians include 4 primary care specialties and nonshyphysicians include 3 subshy specialties)
79
-
Final Report Health Practitioner Bonuses
Appendix C Differenceshyinshydifference (DID) Methodology
C1 DID model and derivation for estimating the impact of PCIP policy
The following equation (Equation (1)) shows the econometric model to identify the effect of Medicare PCIP program on the magnitude of primary care EampM services
= + lowast + lowast 13 + lowast 13 lowast + lowast + (1)
We let Sit be the volume of eligible EampM services provided by provider i in period t Ti is an indicator for treatment group that takes the value 1 if the provider is a PCP and zero otherwise the variable is an indicator variable taking the value of 1 in the years when the PCIP policy is likely to impact the behavior of the providers and 0 otherwise the vector includes provider characteristics such as age and gender etc The term Eit represents random unobserved factors affecting EampM services
The DID methodology that we use here to identify the unbiased effect of PCIP policy on the volume of primary care EampM services is illustrated by considering two time periods preshyPCIP (pre) and postshyPCIP (post) periods with the latter being the years when the PCIP policy is likely to impact the behavior of the providers Equation (2) below shows the change in the volume of EampM services provided by PCPs between preshyPCIP and postshyPCIP periods holding other things constant
(2)
Similarly equation (3) below shows the change in the volume of EampM services provided by nonshyPCPs between preshyPCIP and postshyPCIP periods
(3)
Holding other provider characteristics (embedded in Xs) constant and assuming the changes in random shocks are zero in the limit for both the groups equation (4) below shows that the change in the magnitude of the primary care EampM services provided by PCPs due to the introduction of the Medicare PCIP program is 8
(4)
Thus the coefficient 8 from equation (1) represents an unbiased estimate of the effect of the Medicare PCIP policy on the volume of primary care EampM services Similar methodology can also be applied to estimate the effect of the PCIP policy on other outcomes of interest
C2 DID model and derivation for estimating the impact of HPSA bonus
Equation (5) below shows the empirical specification that we used to estimate the effect of HPSA status on the outcome variables discussed above
80
-0 minus -23 = + + 4 -0 minus -235 lowast + -0 minus -23
minus = + 466-0 66-23 66-0 minus
66-235 lowast + 66-0 minus 66-23
(-0 minus -23) minus (66-0 minus 66-23) =
13tit
7- = +
7- =
7- = + + +
7- = +
Final Report Health Practitioner Bonuses
The model is specified based on the physician level data in each year Here the dependent variable Dict is one of the other potential outcomes of interest of a primary care physician i in county c at time t H SA ict is an indicator of whether physician irsquos county is a HPSA at time t
is an indicator variable taking the value of 1 if the physicianrsquos county ever gained the HPSA status (from a nonshyHPSA) during the sample period and zero otherwise is an indicator variable taking the value of 1 if the physicianrsquos county ever lost the HPSA designation during the sample period and zero otherwise the vector ict includes variables
reflecting the physician characteristics their geographic locations etc and t is a vector of timeshyspecific fixed effect terms
The term Eict represents random unobserved factors affecting outcomes If the change of HPSA status is associated with any changes in the volume of services provided by primary care physicians in those areas then we should expect estimated values of 82 and λ2 in equation (5) will reflect them If the outcome of interest is the volume of services then a positive significant estimated value of 82 would imply higher volume of services due to gaining HPSA designation
For simplicity assume that we have physicians in the following four types of counties counties that are always HPSA (type C1) counties that are always nonshyHPSA (type C2) counties that gained HPSA status and remained HPSA afterwards (C3) and counties that lost HPSA status and remained nonshyHPSA afterwards (C4) Also consider the number of EampM claims submitted under Medicare as the outcome variable of interest Now for given values of and E let us focus on the first 7 terms of the above equation for a representative provider in each of these 4 types of counties
Equation (6) shows the expression of the model excluding the last three terms for County Type C1 (always HPSA)
(6)
Equation (7) shows the expression of the model excluding the last three terms for County Type C2 (always nonshyHPSA)
(7)
Equation (8) shows the expression of the model excluding the last three terms for County Type C3 (gained HPSA status) when these counties have HPSA status
(8)
Equation (9) shows the expression of the model excluding the last three terms for County Type C3 (gained HPSA status) when these counties have NonshyHPSA status
(9)
81
7- = + lowast 89- + lowast 1389- + lowast 89- lowast 1389- + lt lowast 13=13gt89- + lt lowast89- lowast 13=13gt89- +
lowast + lowast + -(5)
1389ic 13=13gt8Aic
Final Report Health Practitioner Bonuses
Thus ( + ) in equation (6) shows the estimated average number of claims per physician in HPSA counties (after controlling for other factors) while in equation (7) represents the estimated average number of claims per physician in nonshyHPSA counties Thus captures the persistent difference in the average number of claims between the HPSA and nonshyHPSA counties
On the other hand comparing equation (8) and (9) the model indicates that in counties that gained the HPSA status ( + 82) shows the difference between the estimated average number of claims per physician when the counties have the HPSA status and the average number of claims when they do not have the HPSA status However already captures the persistent difference in the average number of claims between the HPSA and nonshyHPSA counties Therefore the parameter 82 shows the additional impact of HPSA status on the average number of claims per physician in the counties that gained HPSA status If gaining HPSA status encourages physicians to increase the availability of primary care services then we expect 82 to be positive
Similarly equation (10) shows the expression of the model excluding the last three terms for County Type C4 (lost HPSA status) when these counties have HPSA status
Type C4 and HPSA
Dict = + + A1 + A2 (10)
Equation (11) shows the expression of the model excluding the last three terms for County Type C4 (lost HPSA status) when these counties have NonshyHPSA status
Dict = + A1 (11)
Once again comparing equation (10) and (11) the model indicates that in counties that lost the HPSA status ( + A2) shows the difference between the estimated average number of claims per physician when they have the HPSA status and the average claims when they do not have the HPSA status However already captures the persistent difference in the average number of claims between the HPSA and nonshyHPSA counties Therefore the parameter A2 shows the additional impact of HPSA status on the average number of claims per physician in the counties that lost HPSA status If losing the HPSA status induces physicians to decrease the availability of primary care services then we expect A2 to be positive implying higher average claims when the counties had the HPSA status
82
1 = A1( lowast (1 minus )) = 04( lowast (1 minus ))
7 = Fgt(0(1 minus 0)) minus 1 lowast G0
HIJKLIJM13N7JJ = Fgt(1(1 minus 1)) = 7 + 1 lowast G1
Final Report Health Practitioner Bonuses
Appendix D Simulation Methodology
Method of Calculating the Predicted Proportion of Officeshybased Physicians Accepting New Medicaid Patience as a Function of the MedicaidshytoshyMedicare Fee Index
Consider that
I0 is the observed value of the MedicaidshytoshyMedicare fee index 2008
I1 is the new value of the MedicaidshytoshyMedicare fee index (eg I1 could be 1 percent or 10 percent or x percent higher than I0 where x is a chosen value)
P0 is the observed proportion of officeshybased physicians accepting Medicaid patients in 2011
P1 is the predicted proportion of officeshybased physicians accepting Medicaid patients after the x percent increase in MedicaidshytoshyMedicare fee index
M1 is the estimated marginal effect of the MedicaidshytoshyMedicare fee ratio (2008) = 04 (reported in the study)
B1 is the estimated logit coefficient of the MedicaidshytoshyMedicare fee ratio (2008)
Given the fact that marginal is equal to the estimated logit coefficient times P times (1shyP) where P is the mean proportion of officeshybased physicians accepting Medicaid patients in the sample equation (12) shows the estimated logit coefficient of the MedicaidshytoshyMedicare fee ratio (2008)
(12)
Since Decker (2012) reports that P is 0694 this implies B1 is equal to 04(0694(1shy0694)) which is approximately equal to 188
Letrsquos name the part of the estimated logit model which incorporates the effect of other independent variables (other than MedicaidshytoshyMedicare fee ratio) and the intercept term in the model as ldquoOther Effectsrdquo or OE Equation (13) below shows the expression of ldquoOther Effectsrdquo (OE) based on a given value of P0 and a known value of B1 (where ldquolnrdquo is the natural log)
(13)
Then based on the estimated logit model we can predict the logshyodds of the proportion of officeshybased physicians accepting new Medicaid patients for a new value of the MedicaidshytoshyMedicare index (say I1) Equation (14) shows the logshyodds of the proportion of officeshybased physicians accepting new Medicaid patients
(14)
83
1HIJKLIJOH13O13HK13gt = 1 = [1 + X QI(RSTUlowastV ]Z)W
Final Report Health Practitioner Bonuses
Therefore equation (15) shows the implied predicted proportion of officeshybased physicians accepting new Medicaid patients (where ldquoexprdquo is the exponential function operation)
(15)
Example Based on Decker (2012)
(i) The national average of observed proportion of officeshybased physicians accepting Medicaid patients in 2011 (P0) is 0694
(ii) The Observed value of the MedicaidshytoshyMedicare fee index (I0) 2008 is 0742
We have already derived that the logit coefficient of the MedicaidshytoshyMedicare fee ratio (B1) is 188 This implies that OE is approximately 0576 (based on equation (13))
Now consider a 10 percent increase in the MedicaidshytoshyMedicare fee index from the national average in 2008 This implies that the new value of the MedicaidshytoshyMedicare fee index (I1) is 08162
This further implies that the predicted logshyodds of the proportion of officeshybased physicians accepting new Medicaid patients is equal to about 0958 (using equation (14))
Thus using the expression in equation (15) the predicted proportion of officeshybased physicians accepting new Medicaid patients (P1) is equal to 0723 or 723 percent
The same methodology is applied while calculating the predicted proportions for each state and the US in Exhibit 25
84
- Health Practitioner Bonuses and Their Impact on the Availability and Utilization of Primary Care Services Final Report
-
- Table of Contents
- Table of FiguresExhibits
- Acknowledgments
- Executive Summary
-
- Overview
- Key Findings
-
- 1 Impact of the Medicare Incentive Payment for Primary Care Providers (PCIP)
- 2 Impact of the Physician Shortage Area (PSA) bonus
- 3 Impact of the Health Professional Shortage Area (HPSA) Bonus
-
- Conclusions
-
- Introduction and Purpose Of The Study
- Literature Review
-
- A Effect of Earnings on the Supply of Primary Care Services and Providers Role of Medicare Primary Care Bonuses
-
- 1 Effects of Earnings on Specialty Choice by Physicians
- 2 Effects of Earnings on Labor Supply of Health Care Workforce
- 3 Effects of Earnings on the Volume of Primary Care Services
-
- B Financial Incentives for Primary Care Providers in Underserved Areas
- C Impact of the Increase in Medicaid Reimbursement Rate Relative to the Medicare Rate
-
- 1 Systemic Change in Medicaid Reimbursement Rates in All States
- 2 Stateshyspecific Experience on Changes in Medicaid Reimbursement Rates
-
- Conclusions
-
- Modeling the Impact of Medicare Incentive Payment for Primary Care Providers
-
- A Study Design Overview
- B Data Sources and Variables
-
- 1 Main Data Sets
- 2 Trends in Key Outcome Variables
-
- C Econometric Framework
- D Main Results
-
- 1 Impact of PCIP Policy on Number of Eligible Providers
- 2 Impact of PCIP Policy on Number of Claims for EampM Services
- 3 Impact of PCIP Policy on Allowed Charges for EampM Services
-
- Analyzing the Impact of Financial Incentives for Primary Care Providers in Shortage Areas
-
- A Background
- B Impact of the PSA Bonus on Primary Care Supply
- C Impact of the HPSA Bonus on Primary Care Supply
-
- Modeling the Impact of the Increase in Medicaid Reimbursement Rate Relative to the Medicare Rate
-
- A Study Design Overview
- B Simulation Exercise
-
- Conclusions
- Appendices
- Appendix A Bibliography and Literature Matrix
- Appendix B Additional Exhibits
-
- Additional Regression Results
-
- Appendix C Differenceshyinshydifference (DID) Methodology
-
- C1 DID model and derivation for estimating the impact of PCIP policy
- C2 DID model and derivation for estimating the impact of HPSA bonus
-
- Appendix D Simulation Methodology
-
- Example
-

Health Practitioner Bonuses and Their Impact on the Availability and Utilization
of Primary Care Services
Final Report
Prepared for
Assistant Secretary for Planning and Evaluation Department of Health and Human Services
Submitted by
The Lewin Group Inc
January 2015
Final Report Health Practitioner Bonuses
Table of Contents
Executive Summary1
Overview 1
Key Findings 2
1 Impact of the Medicare Incentive Payment for Primary Care Providers (PCIP) 2
2 Impact of the Physician Shortage Area (PSA) bonus 43 Impact of the Health Professional Shortage Area (HPSA) Bonus 4
Conclusions 4
Introduction and Purpose Of The Study5
Literature Review 7
A Effect of Earnings on the Supply of Primary Care Services and Providers Role of Medicare Primary Care Bonuses 8
1 Effects of Earnings on Specialty Choice by Physicians 92 Effects of Earnings on Labor Supply of Health Care Workforce13
3 Effects of Earnings on the Volume of Primary Care Services14B Financial Incentives for Primary Care Providers in Underserved Areas 15
C Impact of the Increase in Medicaid Reimbursement Rate Relative to the Medicare Rate 18
1 Systemic Change in Medicaid Reimbursement Rates in All States 182 State-specific Experience on Changes in Medicaid Reimbursement Rates 20
Conclusions 21
Modeling the Impact of Medicare Incentive Payment for Primary Care Providers 22
A Study Design Overview 22
B Data Sources and Variables 24
1 Main Data Sets 24
2 Trends in Key Outcome Variables 24C Econometric Framework 30
D Main Results 31
1 Impact of PCIP Policy on Number of Eligible Providers33
2 Impact of PCIP Policy on Number of Claims for EampM Services 373 Impact of PCIP Policy on Allowed Charges for EampM Services 39
Analyzing the Impact of Financial Incentives for Primary Care Providers in Shortage Areas43
A Background 43
B Impact of the PSA Bonus on Primary Care Supply 46
C Impact of the HPSA Bonus on Primary Care Supply 49
Modeling the Impact of the Increase in Medicaid Reimbursement Rate Relative to the Medicare Rate53
A Study Design Overview 53
B Simulation Exercise 57
i
Final Report Health Practitioner Bonuses
Conclusions 59
Appendices 62
Appendix A Bibliography and Literature Matrix 62
Appendix B Additional Exhibits71
Additional Regression Results 78
Appendix C Differenceshyinshydifference (DID) Methodology80
C1 DID model and derivation for estimating the impact of PCIP policy 80
C2 DID model and derivation for estimating the impact of HPSA bonus 80
Appendix D Simulation Methodology83
Method of Calculating the Predicted Proportion of Officeshybased Physicians Accepting New Medicaid Patience as a Function of the MedicaidshytoshyMedicare Fee Index 83
Table of FiguresExhibits
Exhibit 1 Number of Physicians in Residency Programs 9Exhibit 2 Summary of Responsiveness of Specialty Choice to Changes in Earnings
(Earnings Elasticity) 12Exhibit 3 Number of PCIP Recipients under Medicare by Specialty 2011shy2012 23Exhibit 4 Number of Primary Care Providers under Medicare by Specialty 2005shy2011 25Exhibit 5 Total Number of PCIP Eligible EampM Claims submitted by All PCPs under
Medicare by PCP Specialty 2005shy2011 26Exhibit 6 Average Number of PCIP Eligible EampM Claims per PCP under Medicare by
Specialty 2005shy2011 27Exhibit 7 Total Allowed Charges (in million $) for the PCIP Eligible EampM Claims submitted
by All PCPs under Medicare 2005shy2011 28Exhibit 8 Average Allowed Charges ($) for the PCIP Eligible EampM Claims per PCP under
Medicare by Specialty 2005shy2011 29Exhibit 9 Share of Allowed Charges for PCIP Eligible EampM Claims by Specialty2005shy2011 29Exhibit 10 Share of PCIP Eligible EampM Claims by Specialty 2005shy2011 30Exhibit 11 Number of PCIP Eligible EampM Claims and Mean Allowed Charges per Provider
per Year by Types of Claims for Providers with PCIP Eligible Specialty 2005shy2011 32
Exhibit 12 Number of PCIP Eligible EampM Claims and Mean Allowed Charges per Providerper Year by Types of Claims for Providers with PCIP NonshyEligible Specialty 2005shy2011 33
Exhibit 13 Impact of Medicare PCIP on the Number of PCPs with Medicare Claims for PCIPEligible Services (2005shy2011) 34
Exhibit 14 Impact of Medicare PCIP on the Number of Providers Accepting New Medicare Patients and the Number of New Primary Care Providers under Medicare with Claims for PCIP Eligible Services (2005shy2011) 36
Exhibit 15 Impact of Medicare PCIP Policy on PCIP Eligible EampM Claims (2005shy2011) 38Exhibit 16 Impact of Medicare PCIP Policy on Allowed Charges for PCIP Eligible EampM
Claims (2005shy2011) 39Exhibit 17 Estimated Impact of Medicare PCIP Policy on the Number of PCIP Eligible EampM
Claims (2005shy2011) 41
ii
Final Report Health Practitioner Bonusesshy
Exhibit 18 Estimated Impact of Medicare PCIP on the Allowed Charges for PCIP Eligible EampM Claims (2005shy2011) 42
Exhibit 19 Distribution of Primary Care (PC) Providers by HPSA and PSA Regions 45Exhibit 20 Distribution of the Number of Internal Medicine and Family Practice Physicians
by HPSA and PSA regions 46Exhibit 21 Impact of PSA Bonus on the Number of EampM Claims under Medicare 2005shy
2010 48Exhibit 22 Impact of PSA Bonus on the Number of Primary Care Providers per County
(2005shy2010) 49Exhibit 23 Impact of HPSA Bonus on the Number of EampM Claims and Allowed Charges per
Physician under Medicare 2007shy2010 51Exhibit 24 MedicaidshytoshyMedicare Fee Index 55Exhibit 25 Proportion of US Officeshybased Physicians Accepting New Medicaid Patients 57Literature Matrix 66Exhibit B1 Distribution of Primary Care Providers with PCIP Eligible Specialty by Age Sex
and Year 71Exhibit B2 Average Number of PCIP Eligible EampM Claims per PCP under Medicare by
Specialty 2005shy2011 71Exhibit B3 Average Allowed Charges ($) for the PCIP Eligible EampM Claims per PCP under
Medicare 2005shy2011 72Exhibit B4 Proportion of PCIP Eligible EampM Claims per 2011 PCIP Recipients by Specialty
2005shy2011 72Exhibit B5 Average Number of PCIP Eligible EampM Claims per 2011 PCIP Recipients under
Medicare by Specialty 2005shy2011 72Exhibit B6 Average Allowed Charges for the PCIP Eligible EampM Claims per 2011 PCIP
Recipients under Medicare 2005shy2011 73Exhibit B7 Proportion of Allowed Charges for PCIP Eligible EampM Claims per 2011 PCIP
Recipients 2005shy2011 73Exhibit B8 Distribution of the Number of NPs and PAs across HPSA and PSA regions 74Exhibit B9a Distribution of Male Primary Care Physicians with PCIP Eligible Specialty by
Age and Year 74Exhibit B9b Distribution of Female Primary Care Physicians with PCIP Eligible Specialty by
Age and Year 75Exhibit B10 Distribution of Male Primary Care NonshyPhysicians with PCIP Eligible Specialty
by Age and Year 75Exhibit B11 Distribution of Female Primary Care NonshyPhysicians with PCIP Eligible
Specialty by Age and Year 76Exhibit B12 Average Number of PCIP Eligible EampM Claims Submitted by 2011 PCIP
Recipients 2005 ndash 2011 76Exhibit B13 Allowed Charges for PCIP Eligible EampM Claims per 2011 PCIP Recipients
2005shy2011 77Exhibit B14 Total Number of PCIP Eligible EampM Claims submitted by All Providers in the
Control Group 2005shy2011 77Exhibit B15 Impact of Medicare PCIP Policy on the Number of Primary Care Providers Who
Have submitted any Medicare Claims (not necessarily under PCIP Eligible Services) (2005shy2011) 78
Exhibit B16 Impact of Medicare PCIP Policy on the Number of Primary Care Providers WhoMet 60 PCIP Eligibility Threshold Each Year (2005shy2011) 79
iii
Final Report Health Practitioner Bonuses
Acknowledgments Paul Hogan Brighita Negrusa PhD and Projesh Ghosh PhD contributed to this report We benefited greatly from discussions with members of our technical expert panel We also gratefully acknowledge the input from Caroline Taplin the ASPE Project Officer and her colleague Donald Cox This study was conducted by The Lewin Group under contract number HHSP23320095639WC task order number HHSP23337019T with the HHSrsquos Office of the Assistant Secretary for Planning and Evaluation The authors take full responsibility for the accuracy of material presented herein The views expressed are those of the authors and should not be attributed to ASPE or HHS
iv
Final Report Health Practitioner Bonuses
Executive Summary
Overview
In this study funded by The Assistant Secretary for Planning and Evaluation (ASPE) we analyze the impact of three different health practitioner incentives on the supply of primary care services (1) the Medicare primary care incentive payment (PCIP) (2) the physician shortage area (PSA) bonus and (3) the health professional shortage area (HPSA) bonus Section 5501(a) of The Affordable Care Act authorized a quarterly incentive payment program to augment the Medicare payment for primary care services when furnished by primary care practitioners beginning in 2011 and ending in 2015 Medicare has been paying a HPSA bonus since 1987 Initially the HPSA bonus was paid to physicians providing care in rural geographic HPSAs in 1991 it was extended to services provided by physicians in urban geographic HPSAs Subsequently section 413a of the Medicare Modernization Act put in place an additional 5 percent bonus payment for physicians practicing in PSAs PSAs were those counties and rural zip codes in MSAs with the lowest physician to population ratios The purpose of these incentives is to increase the supply of provider services both in general and for evaluation and management (EampM) in particular In the case of the PCIP it is to increase the supply of primary care services in Medicare In the case of the PSA and HPSA bonuses it is to increase the supply of services in certain locations designated as underserved
We first consider the PCIP program Under the PCIP program eligible providers in designated primary care specialties are offered a 10 percent reimbursement premium for primary care services The study addresses the following broad empirical issues surrounding the Medicare PCIP program
Experience to date with the Medicare primary care incentive payment in terms of the aggregate number of recipients and the distribution of those recipients by specialty and by geographic area
Proportion of primary care providers who qualify for the bonus and the characteristics of those primary care providers
Volume of eligible claims submitted by the PCIP eligible providers and the impact of Medicare PCIP policy on the primary CARE services provided and other outcome measures of interest
To explore these topics we used a customized data set constructed at the provider level This data set included all the claims submitted by the entire universe of Medicare providers each year from 2005 to 2011 Subsequently each provider was linked by National Provider Identification number (NPI) to Provider360 data (available from Lewin Grouprsquos parent company Optum Inc) and the AMA Physician Master File to add provider characteristics such as provider demographics (eg age gender) provider designation medical school and practice location We also added geographic locationshyspecific variables from the Area Resource File (ARF) based on the practice location information of providers The main advantage of this pooled data set is the ability to track providers over time and capture changes in their volume of services in response to financial incentives
We use a differenceshyinshydifference (DID) approach to identify the effect of the financial incentives associated with the Medicare PCIP policy on key outcomes of interest This method entails (1) inclusion of a treatment group which is likely to be affected by the PCIP policy and a relevant comparison group not likely to be affected by the policy (2) controls for yearshyspecific effects
1
Final Report Health Practitioner Bonuses
common to both groups and (3) an interaction of the treatment group and the year effects to capture the distinct impact of the policy on the treatment group The model also controls for provider demographics and regional characteristics One advantage of the DID estimation approach is that it enables us to disentangle the net impact of the 10 percent PCIP policy from changes that coincided with the PCIP policy affecting both the treatment and comparison group
Policy makers have long been concerned about patient access to health care particularly primary care in underserved or shortage areas We also focus on two additional financial incentive programs Health Professionals Shortage Area (HPSA) bonus and Physician Shortage Area (PSA) bonus implemented in an attempt to improve access in shortage areas These programs offer a higher rate of reimbursement in Medicare for eligible providers should they provide services in designated shortage areas More specifically we examine the following issues surrounding HPSA and PSA bonus
The distribution of HPSA bonus recipients the overlap between HPSA and Medicare primary care incentive payment (PCIP) and the overlap between the HPSA and PSA bonus recipients
Impact of HPSA bonus on the number of primary care providers and subsequent impact on the volume of primary care services
Impact of PSA bonus on the number of primary care physicians and subsequent impact on the volume of primary care services
Finally we examine the existing evidence from the literature on the variation in Medicaid reimbursement rates relative to the Medicare rates to inform the impact of the Medicaid parity provision in the ACA We describe the variation in Medicaid reimbursement rates relative to the Medicare rates both for primary care and for all services across US states during the period 2008shy2012 Based on the empirical results from the PCIP analysis we perform an exercise to simulate the effect of a 10 percent increase in the MedicaidshytoshyMedicare fee index on the proportion of US officeshybased physicians accepting new Medicaid patients across all states
Key Findings
1 Impact of the Medicare Incentive Payment for Primary Care Providers (PCIP)
Number of Medicare Providers
Our estimates suggest that the number of Medicare providers with a PCIP bonusshyeligible specialty and at least one PCIP eligible claim increased annually by about 28 providers per county per year due to the Medicare PCIP bonus policy This represents a sizeable increase of almost 19 percent since there were about 15 providers per county per specialty per year under a PCIP bonus eligible specialty during the 2005shy2011 period When restricted to primary care physicians with a PCIP eligible specialty the estimated increase in the number of physicians is approximately 10 percent in response to the PCIP policy (ie elasticity of the number of primary care physicians with respect to the payment is about 1)1
1 The increase in the number of physicians with a PCIP eligible specialty attributable to the policy is about 2 per
county per year This is almost 10 percent of the average number of primary care physicians in a given PCIP eligible specialty per county per year (average is almost 19) Therefore given that PCIP policy provides 10
2
Final Report Health Practitioner Bonuses
Evaluation amp Management (EampM) Eligible Claims
The estimated impact of the PCIP policy on the volume of primary care services measured by the volume of claims is somewhat mixed
More specifically there were more PCIP eligible EampM claims submitted per provider in a particular claim type 25 minute office visits for established patients Specifically on average there was a 7 percent increase in the number of 25 minute office visits claims due to the PCIP policy Thus the implied elasticity of the number of 25 minute office visits with respect to the incentive payment is about 07 Hence it appears that the PCIP may have induced a substitution toward slightly longer visits for established patients
For PCIP eligible EampM claims in general the estimates from the DID model indicate that on average primary care providers with PCIPshyeligible specialties submitted fewer claims (per provider per year) related to PCIPshyeligible EampM services in response to the Medicare PCIP policy23
The positive impact of the PCIP bonus policy on the volume of EampM claims associated with 25 minute office visits for established patients is much stronger for providers near the PCIP eligibility threshold4 For the primary care providers near the PCIP eligibility threshold there was almost a 15 percent increase in the number of claims for 25 minute visits due to the PCIP policy
Allowed Charges for EampM Services
We estimated no significant incentive payment impact on allowed charges per provider for the full sample of providers However for the sample of providers who were near the PCIP eligibility threshold in 20095 we found that per provider charges increased by about $5611 annually in response to the policy This estimated effect represents about 93 percent of the mean allowed charges ($60235) per provider per year (ie the implied elasticity of allowed charges which do not include the bonus payment with respect to the payment is about 093)
percent incentive payment the implied elasticity of the number of physicians in PCIP eligible specialty with respect to the payment is about 1
2 Not all primary care providers are eligible for Medicare primary care incentive payments In summary primary care
physicians (with internal medicine family practice pediatrics and geriatrics specialty) who have at least 60 percent of the practitionerrsquos allowed charges under the Medicare physician fee schedule (excluding hospital inpatient care and emergency department visits) are for primary care services The PCIP eligible primary care services are defined by specific EampM codes Medicare PCIP is also provided to physician assistants nurse practitioners and clinical nurse specialists who also meet the similar eligibility criteria
3 Note that total eligible claims increased Claims per provider declined potentially because additional providers
were induced to submit eligible claims 4
For the purpose of our analysis we consider the primary care physicians (with the PCIP eligible specialty) who have 50 percentshy65 percent of their services for PCIP eligible EampM services (defined by specific EampM codes) to be near the eligibility threshold We apply the similar method to select nonshyphysicians (physician assistants nurse practitioners and clinical nurse specialists) near the eligibility threshold
5 The determination of the eligibility of providers in the first year (2011) of the PCIP is based on the extent of their
PCIP eligible services in 2009 Besides the announcement of the PCIP program was made in 2010 Thus we assumed that the providers with Medicare PCIP eligible specialties would be potentially responsive to the PCIP program as early as year 2010 and alter their behavior Subsequently it is more meaningful to examine providers who were near the PCIP eligibility threshold in 2009 which is the year just before the policy effect is expected to influence
3
Final Report Health Practitioner Bonuses
2 Impact of the Physician Shortage Area (PSA) bonus
Number of Medicare Providers
The number of providers with PSA bonusshyeligible specialties was estimated to increase by about 1 in PSA areas during the PSA period compared to the number of providers in nonshyPSA areas This represents a sizeable increase as there were about 6 primary care providers on average in PSA areas
EampMshyEligible Claims
We found that on average physicians with bonusshyeligible specialties who were located in PSA areas were estimated to have about 50 more claims submitted per year during the PSA period compared to providers with the same specialty who were located in nonshyPSA areas Given that these physicians have on average about 644 claims per year for primary care EampM services the impact of PSA bonus is not negligible
Allowed Charges for EampM Services
Our estimates indicate that on average physicians with PSA bonusshyeligible specialties located in PSA areas did not experience a statistically significant increase in total annual allowed charges per provider per year for EampM services compared to those in nonshyPSA
6 areas
3 Impact of the Health Professional Shortage Area (HPSA) Bonus
EampM Eligible Claims
We focused only on the behavior of primary care physicians who are eligible for a HPSA bonus We found that on average Medicare primary care physicians tend to submit about 17 more EampM claims annually specifically due to the gain of full HPSA status7
Allowed Charges for EampM Services
Medicare primary care physicians who are located in counties that ever lost primary care HPSA status tend to have about $1380 more allowed charges annually before the location lost full HPSA status
Conclusions
The Affordable Care Act includes two key provisions regarding reimbursement to primary care providers ) (a) it provides a 10 percent incentive payment under the Medicare PCIP program to eligible providers (effective January 1 2011) and (b) it raises the Medicaid primary care reimbursement rate at least up to 100 percent of the Medicare rate
We find that as a result of the Medicare incentive payment the number of Medicare PCPs has increased on average by about 28 providers per county annually in 2010 and 2011 Also the number of primary care physicians with PCIP eligible specialty increased by about 10 percent in
6 Although the number of EampM claims went up due to the PSA bonus it may be that within EampM services some
services experienced an increase in allowed charges due to the PSA bonus while others experienced a decrease accounting for the overall lack of impact
7 Health Resource and Services Administration (HRSA) publishes Area Health Resource File (ARF) that includes
HPSA status for each county within the US For the purpose of our analysis we focus on primary care HPSA status The ARF data classifies counties as full primary care HPSA if the whole county is considered as a HPSA
4
Final Report Health Practitioner Bonuses
response to the 10 percent incentive payment under the PCIP policy (ie elasticity of the number of primary care physicians with respect to the incentive payment is about 1) Eligible claims for some types of PCIP eligible EampM services and associated allowed charges have also increased For example on average there was a 7 percent increase in the number of claims for 25 minute office visits due to the PCIP policy On the other hand in response to the PCIP policy there was a 93 percent increase in the average allowed charges (for eligible services) among primary care providers with PCIP eligible specialties
The reader should exercise some caution in interpreting these results however The behavioral response to the PCIP was observed in our data only for one year The relatively short period may have resulted in insufficient time for a full provider behavioral response In addition the legislation provided for a program of only limited duration Some providers may have chosen explicitly or implicitly not to change their behavior for a program of limited duration
In addition we find that Medicare providers were attracted to PSA areas through the PSA bonus and submitted 78 percent more EampM claims annually during the PSA period Gaining HPSA status also generated an additional 17 EampM claims submitted by primary care physicians with HPSA bonusshyeligible specialties
The reader is again encouraged to exercise some caution in interpreting the results for the PSA bonus Because the criteria for the bonus include the actual supply of providers there is a risk that the results may be biased Though the methods we employ attempt to minimize the potential impact of this type of bias we cannot be completely sure that the results are unaffected by this
Finally we document the variation in Medicaid reimbursement rates relative to the Medicare rates both for primary care and for all services across US states during the period 2008shy2012 using the existing body of evidence Using the empirical results from our PCIP analysis we also perform an exercise to simulate the effect of a 10 percent increase in the MedicaidshytoshyMedicare fee index on the proportion of US officeshybased physicians accepting new Medicaid patients across all states The simulation suggests that a 10 percent increase in MedicaidshytoshyMedicare fee ratio would increase the US average of officeshybased primary care physicians accepting new Medicaid patients from 662 percent to 728 percent Again however caution is warranted in a literal interpretation of this result as it is based on an extrapolation from a different program
Introduction and Purpose Of The Study The Assistant Secretary for Planning and Evaluation (ASPE) has contracted with The Lewin Group to examine the role of physician bonus and supplemental payment programs in increasing the supply of primary care providers (PCP) and the access of patients to their services
The Congressional Budget Office has estimated that the implementation of the Patient Protection and Affordable Care Act (ACA) of 2010 will increase the number of nonelderly people who have health insurancemdashby about 13 million in 2014 20 million in 2015 and 25 million in each of the subsequent years through 2024 (CBO 2014)8 Because those with insurance typically use more services than those without insurance this increase in coverage will most likely result in additional pressure on a health care delivery system9 To address
8 CBO Report (February 2014) httpwwwcbogovsitesdefaultfilescbofilesattachments45010shybreakoutshy
AppendixBpdf 9
Manning WG Newhouse JP Duan N Keeler EB Benjamin B Liebowitz A et al (1988) Health insurance and the demand for medical care Evidence from a randomized experiment Santa Monica CA RAND Corporation
5
Final Report Health Practitioner Bonuses
concerns about maintaining an adequate supply and distribution of primary care services the ACA includes provisions that provide temporary financial incentives to primary care providers
1 Section 5501 provides that from January 1 2011 through December 31 2015 under Medicare eligible primary care practitioners will receive a 10 percent supplemental payment for primary care services they provide as defined by existing Evaluation and Management (EampM) codes under the new Medicare Primary Care Incentive Program (PCIP)
2 Section 1202 of the Act provides that for the period January 1 2013 to December 31 2014 under Medicaid primary care services provided by primary care physicians must be paid at rates no less than Medicare rates for primary care physicians
The Medicare primary care incentive payment is available to the eligible primary care practitioners for services provided under selected categories of EampM codes An eligible primary care practitioner is a physician nurse practitioner clinical nurse specialist or physician assistant who satisfies the following criteria (i) enrolled in Medicare with primary specialty designation of family practice internal medicine pediatrics and geriatrics and (ii) at least 60 percent of the practitionerrsquos allowed charges are for primary care services10 This temporary 10 percent incentive payment is made on a quarterly basis PCIP recipients with a family medicine Medicare specialty designation received an average incentive payment of $3450 ($212987540 61728) during the first year of the program11 This payment is equivalent to a two percent ($3450$201512) increase in annual income 12
In addition Medicaid payment rates for primary care services delivered by primary care physicians must be no less than Medicare rates for the same services in 2013 and 201413
Given the variability of Medicaid payments across states this could be a substantial boost in payments for physicians in some states and less so in others Medicare has been providing bonus payments to physicians in designated shortage areas to make these areas more attractive for physician practices The Health Professional Shortage Area (HPSA) bonus and the Physician Shortage Area (PSA) bonus are specifically intended to address the geographic distribution of physicians
The main purpose of this report is to present the key findings from our examination of the proposed research questions the main data sources used for the empirical analysis the methodologies used to identify the impact of payment incentives and detailed discussion of our analytical findings
10shyAllowed charges refer to all charges under the physician fee schedule excluding hospital inpatient care drug laboratory and emergency department visits (source httpwwwcmsgovMedicareMedicareshyFeeshyforshyServiceshyPaymentPhysicianFeeSchedDownloadsPCIPshy2011shyPaymentspdf)
11shySource httpwwwcmsgovMedicareMedicareshyFeeshyforshyServiceshyPaymentPhysicianFeeSchedDownloadsPCIPshy2011shyPaymentspdf
12shyACA Medicare PCIP Practitioners (MDs and Non‐MDs) with primary care specialty designation meeting a threshold of 60 percent of primary care serviceswill receive 10 percent bonus on the Medicare paid amount from CY 2011 to CY 2016 $558 million in 2011 translates to an average of 2 percent increase in annual income for primary care physicians
13shyThe Administration is proposing to extend this payment through Calendar Year 2015 and make it available to primary care nurse practitioners and physician assistants who practice independently (add citation to 2015 Budget in Brief when it becomes available)
6
Final Report Health Practitioner Bonuses
The report covers the three main categories of the empirical analysis
1 Examine the magnitude and the distribution of Medicare primary care incentive payments and quantitatively estimate the impact of the bonus on the supply of PCPs and their services
2 Assess the geographic distribution of HPSA bonus recipients understand the overlap between HPSA and Medicare primary care incentive payment (PCIP) and overlap between the HPSA and PSA bonus recipients and quantitatively estimate the impact of the bonuses on the supply of PCPs and their services
3 Explore any evidence of the impact of changes in state Medicaid primary careshyreimbursement rates on the supply of primary care servicesshy
A substantial portion of the empirical undertaking entailed analyzing existing Medicare claims data to understand the magnitude of these supplemental payments under Medicare and to estimate their impact on the supply of PCPs and their services In this report we provide a detailed description of the data we use our analytical approach and a thorough discussion of our analytical findings The discussion in the report is organized as follows section II presents findings from the review of relevant existing literature in section III we lay out the empirical methodology and main evidence related to the impact of the Medicare 10 percent primary care incentive payment section IV describes the empirical analysis of the HPSA and PSA bonuses section V presents the findings regarding the impact of higher primary care physician fees under Medicaid finally section VI is the conclusion
Literature Review The Lewin Group has reviewed the existing key health and labor economics literature for evidence regarding the potential impact of financial incentives on the supply of health care providers and services The objectives of the literature review were to (1) document the likely quantitative range of the effects of earnings increases (in the form of bonuses or other financial incentives) on the supply of primary care providers and services nationally or in underserved areas and (2) explore the likely impact of the increase in Medicaid reimbursement rates for primary care providers on the volume of these providers and their services under Medicaid This work can contribute to the broader understanding of provider behavior and the type and level of financial incentives that are likely to achieve the desired supply responses
The literature that directly examines the Medicare bonuses and resultant impact on the supply of primary care providers and services is very limited To address this limitation we expand our focus to include the labor economics literature This broadened search then includes studies that address the behavioral impact of earnings on medical workforce In what follows we discuss the major findings from the existing literature on the effects of financial incentives (such as Medicare bonuses and increased Medicaid reimbursement rates) on primary care workforce and services Overall the scope of the literature review can be classified under the following categories
1 Effects of earnings on (a) specialty choice by physicians (b) the labor supply of physicians and nurses in terms of work hours and labor force participation and (c) the volume of services
2 Effects of financial incentives on the supply and retention of primary care providers in designated underserved areas (HPSAPSA) and statesrsquo experiences thereof
7
Final Report Health Practitioner Bonuses
3 Impact of increases in Medicaid reimbursement rates on the supply of primary care providers and the volume of patient care under Medicaid on a state by state basis as well as systemic effects
There is considerable concern regarding a potential future primary care physician shortage and potential constriction of access to primary care The availability of primary care is particularly important for public payer programs such as Medicaid and Medicare A recent Medicare Payment Advisory Committee (MedPAC) data book indicates that six percent of Medicare beneficiaries were looking for a new primary care physician in 2011 In addition among those who tried to get an appointment with a new physician in 2011 35 percent reported having difficulties14
It is worth noting that several studies (Bodenheimer et al 2007 Vaughn et al 2010) illustrated the large income gap between primary care providers and other specialties Therefore whether a very small increase in annual income through the Medicare PCIP would significantly influence provider behavior remains unclear In addition the time limited nature of the provisions may prove to be a major deterrent to a change in provider behavior Any evidence around time‐limited bonus programs will likely show only a partial behavioral response from the targeted population Lower bound take up rates should be expected in these programs because medical students and early career providers are unlikely to base career choices on temporary policy changes
Historically the Medicaid program has reimbursed physicians at a much lower rate than Medicare paying just 66 percent of Medicare rates on average (Cunningham 2011) Cunningham (2011) also documents that due to the low Medicaid reimbursement rates in several states fewer physicians accept Medicaid patients In 2013 and 2014 ACA increases Medicaid reimbursement rates for certain services provided by primary care physicians to 100 percent of Medicare rates Given the variability of Medicaid payments across states this will be a substantial boost in payments for physicians in some states and less so in others Current differential payment levels across states and any changes in payments over time can be exploited to examine the effect of raising Medicaid primary care reimbursement rates on the provision of primary care providers and services
The discussion of the literature review is organized as follows section A reviews the literature on the effect of earnings on the supply of primary care providers and services section B discusses the evidence regarding the impact of financial incentives for primary care providers in underserved areas section C examines the empirical evidence on the impact of stateshyspecific changes in Medicaid reimbursement rates and section D concludes with a summary of the major findings from the literature and their implications for understanding the allocative effects of bonus payments and other financial incentives
A Effect of Earnings on the Supply of Primary Care Services and Providers Role of Medicare Primary Care Bonuses
The ACA stipulates multiple programs with the aim of increasing the supply and utilization of primary care services These programs all operate on the assumption that financial incentives specifically directed toward increased earnings are an effective way to promote an increase in primary care services and primary care providers While these assumptions are based upon established economic theory the evidence as to the programsrsquo effectiveness in practice is mixed
14 MedPAC ldquo A Data Book Health Care Spending and the Medicare Programrdquo June 2012 p 97
8
Final Report Health Practitioner Bonuses
While there is general consensus that expected earnings are a key driver of medical specialty choice (Bazzoli 1985 Nicholson and Propper 2011 Nicholson 2002 Vaughn et al 2010) the evidence regarding the effectiveness of programs designed to attract medical students in certain specialties is inconclusive Vaughn et al (2010) argue that programs designed to affect the number of medical students choosing primary care have largely failed while others (Fournier amp Henderson 2005 Lynch 1998 Ramsey 2001) argue that these programs have had a wide range of results that can be attributed to each programsrsquo individual composition
The effect of earnings on labor supply in relation to the healthcare workforce is also a complex issue There is wide consensus that increased earnings lead to an increase in the labor supply of health services providers (Askildsen and Baltagi 2002 Baltagi 2005 Rizzo and Blumenthal 1994) but the reported magnitude of this increase in labor supply varies widely Values reported for the wage elasticity of the primary care labor supply range from 023 to 08 Furthermore the effect of income on retirement decisions of physicians is not well understood
Finally the effect of earnings on the volume of primary care services is a related but distinct issue Much like its counterparts the effect of earnings on the volume of services is recognized to be significant and positive but reported effects range widely from a 10 percent reduction in Medicare fees leading to 18 percent to 66 percent reduction in the volume of office visits to 10 percent higher fees for primary care services raising the primary care EampM visits by 88 percent (Hadley et al 2009 Reschovsky et al 2012)
1 Effects of Earnings on Specialty Choice by Physicians
While the estimated effect of earnings on specialty choice is present and significant the magnitude of this income effect and its relative importance as compared to other factors in deciding a specialty is contentious Recent data from the residency match program in the US reveals that among 16875 US Medical school senior applicants in 2012 about 355 percent were matched to primary care specialties such as internal medicine family practice and pediatrics15 In 2010 the proportion matched to primary care (internal medicine family practice and pediatrics) was 341 percent of 16427 US Medical school senior applicants 16 Between 1995 and 2006 the total number of physician residents in the US in primary care training programs increased by 6 percent from 38753 to 40982 (Exhibit 1) Physician residents in specialty care increased by about 8 percent during the same period
Exhibit 1 Number of Physicians in Residency Programs17
Type of Resident Number of Resident Physicians
Percentage Change 1995 2006
Primary Care Residents 38753 40982 575
Specialty Care Residents 59282 63897 778
All Physician Residents 97416 104526 730
15 Source NRMP Results and Datashy2012 Main Residency Match (httpwwwnrmporgdataresultsanddata2012pdf)
16 US Medical school seniors who are matched into internal medicine can subspecialize later on in nonshyprimary care
specialty such as cardiology endocrinology oncology etc 17
Steinwald B Primary Care Professionals Recent Supply Trends Projections and Valuation of Services Statement in Testimony before the Senate Committee on Health Education Labor and Pensions Washington (DC) GAO 2008 Available from httpwwwgaogovnewitemsd08472tpdf
9
Final Report Health Practitioner Bonuses
Nicholson and Propper (2011) argue that the rate of return to medical training and specialization is the key driver of choosing medical occupation and the choice of specialty within the area of medicine The gap in median income between primary care physicians and specialists is wellshypublicized For instance using crossshysectional earnings data from 2008 Vaughn et al (2010) report that the average primary care physician could expect to earn $25 million over his lifetime net of income taxes living expenses and education costs versus $52 million for a cardiologist Berenson et al (2007) report that according to the Medical Group Management Association (MGMA) between 2000 and 2004 median physician income for all primary care increased by 99 percent while average incomes of all nonshyprimary care specialists increased by 158 percent Arguably given the income gap raising the payment rate for primary care services relative to other services would impact the number of primary care physicians and raise the amount of primary care services they provide Moreover if the reimbursement rates vary by geographic region this strategy can also affect the geographic distribution of services of primary care services
In a related study Bodenheimer (2007) attempts to explain this disparity in incomes The author notes that the ResourceshyBased Relative Value Scale which was initially designed to reduce the inequality between fees for office visits and for procedures has failed to reduce the primary carendashspecialty income gap He finds that this failure is due to four factors (1) the volume of diagnostic and imaging procedures has increased more rapidly than the volume of office visits (2) the process of updating the relative values units (RVUs) 18 associated with covered procedures is heavily influenced by the recommendations of the Relative Value Scale Update Committee (RUC) a majority of whose membership are specialists (3) Medicarersquos formula for controlling physician payments penalizes primary care physicians and (4) private insurers tend to pay for procedures at higher rates than office visits relative to Medicare They conclude that the program was designed with the correct motives but ultimately was weak and cannot achieve its purpose as currently formulated Furthermore incentives that favor specialists remain in the private market
Nicholson (2002) also provides econometric evidence that the disparity in the expected earnings between primary care and other specialties has a significant influence on medical studentsrsquo decisions to choose primary care or another specialty He observes that there is a persistent excess supply of residents to most specialties with relatively high lifetime earnings and a persistent excess demand for residents in primary care with relatively low lifetime earnings His main contribution is to examine how differences in expected earnings affect the number of students who desire to enter a specialty rather than the number who actually enter the specialty The study finds that the income elasticity ranges from 103 in family practicepediatrics to 220 in radiology19 In other words a 1 percent increase in the lifetime earnings of primary care providers such as family practitioners will increase the number of students ranking family practice as the most preferred choice by 1 percent which can be translated into an increase of equal magnitude in the supply of family practitioners
18 RVU is a key component of the formula used under Medicare Physician Fee Schedule (PFS) to calculate payment
rates for an individual service There are three different RVUs work RVU practice expense (PE) RVU and malpractice (MP) RVU Work RVU reflects the relative time and intensity associated with Medicare PFS service PE RVU reflects the costs of maintaining a practice and MP RVU reflects the cost of malpractice insurance Source httpwwwcmsgovOutreachshyandshyEducationMedicareshyLearningshyNetworkshyMLNMLNProductsdownloadsmedcrephysfeeschedfctshtpdf
19 Earlier studies of JW Hay (ldquoPhysiciansrsquo specialty choice and specialty incomerdquo Econometrics of Health Care
edited by G Duru and J Paelinck Netherland Klwer Academic 1991) and J Hurley (ldquoPhysician choices of specialty location and moderdquo Journal of Human Resources No 26 1991 pp 47shy71) did not account for uncertainty in entry to a specialty However they find that medical students are substantially responsive to expected income These studies report income elasticities that range from 1 to 3
10
Final Report Health Practitioner Bonuses
However there are studies that report comparatively less impact of expected earnings on the decision to choose primary care Bazzoli (1985) found that medical students are more likely to choose primary care when the expected earnings are relatively large but the effect is quite small More specifically a $10000 (about 20 percent of the mean earnings in 1981) increase in the expected earnings in primary care relative to the nonshyprimary care yields a 14 percentage point increase in the probability of choosing primary care
Gagne and Leger (2005) have studied the specialty choice decision of Canadian physicians who practiced between 1989 and 1998 They find that a 91 percent reduction in relative feeshypershyconsultation for a general practitioner in Quebec and Saskatchewan for example would lead to a 04 percent reduction in the proportion of medical students entering general practice The largest response is observed in Manitoba where the proportion of medical students entering general practice is estimated to decrease by 229 percent as a result of a 91 percent reduction in relative feeshypershyconsultation The implied responsiveness of specialty choice to changes in earnings from this study and from other studies discussed in this section is summarized in Exhibit 2
Vaughn et al (2010) bolster this point by noting that programs designed to affect the number of medical students choosing primary care have largely failed because of the programsrsquo inability to affect relative incomes By estimating career wealth accumulation across specialists primary care physicians physician assistants business school graduates and college graduates the authors try to elucidate the true difference between payment of physicians and nonshyphysicians and between specialists and generalists within the physician group They note that this result is to be expected as programs have done little and continue to do little to affect the disparity in expected lifetime earnings between primary care physicians and specialists The authors also find that for a primary care physicianrsquos lifetime earnings to equal those of a cardiologist the primary care physician would have to receive a bonus of $11 million upon completion of medical school
Sivey and Scott (2012) use an econometric approach to address the question of the effect of lifetime earnings on training specialty choice based on a sample of Australian postgraduate doctors Using a generalized multinomial logit model the authors find a statistically significant positive impact of earnings on the probability of choosing general practice training versus specialty training Subsequently they use the same model to simulate the effect of a $50000 increase in annual earnings of general practitioners (GPs) on the probability of junior doctors choosing GP training Specifically the simulation result suggests that $50000 additional earnings for GPs (a 278 percent increase over their current salary of $180000) would lead to a 263 percent increase in the propensity of junior doctors to choose GP training Therefore the implied earnings elasticity of the propensity to choose GP training is 095 which is consistent with previous findings (Nicholson 2002)
11
Final Report Health Practitioner Bonuses
Exhibit 2 Summary of Responsiveness of Specialty Choice to Changes in Earnings (Earnings Elasticity)
StudyArticle Description Earnings
Elasticity
Nicholson (2002) Elasticity of ranking Family Practice Pediatrics as the 1
st specialty choice with
respect to lifetime earnings (among US medical school residents) 103
Nicholson (2002) Elasticity of ranking Radiology as the 1
st specialty choice with respect to lifetime
earnings (among US medical school residents) 220
Gagne and Leger (2005)
Elasticity of proportion of medical students (in 8 Canadian provinces) entering General Practice with respect to relativeshyfeeshypershyconsultation
0044 to 025
Sivey and Scott (2012)
Elasticity of probability of junior doctors (in Australia) choosing General Practice with respect to annual earnings
095
Hogan and Bouchery (2010)
Elasticity of percentage of male US medical school Internal Medicine graduates choosing Cardiology subspecialty with respect to annual compensation
250
Note earnings elasticity gives the percentage change in the outcome measure of interest (eg proportion ofshystudents ranking family practice or radiology as the 1
st choice) due to 1 percent change in earningsshy
In an unpublished piece Hogan and Bouchery (2010) estimate a multinomial logit model of the choices of internal medicine residents to remain in internal medicine and practice primary care or to obtain a fellowship for further training in one of nine subspecialties of internal medicine and ultimately practice in that subspecialty20 The authors find that a 1 percent increase in earnings from one of the career paths holding earnings in other specialties constant increases entrants of male US medical graduates into that the examined specialty (Cardiology) by about 25 percent but increases female entrants by about only 03 percent They also find that increases in the length of additional training required for a subspecialty have a negative effect on the number of US medical graduates pursing that subspecialty and reduces the probability that US medical graduates pursue the specialty but increases the probability that international medical school graduates pursue that subspecialty21
Expected lifetime earnings are not the only factor that influences decision making during specialty choice Medical students assign a low level of prestige to a primary care career compared to other specialties Students surveyed associate primary care with low income expectation low class rank and high educational debt (Henderson 1996) Students often enter medical school with a positive perception of primary care but by the time they reach their fourth year they are increasingly likely to disagree with the assertions that primary practice is prestigious adequately compensated and allows more control over working hours (Lynch 1998) It appears that studentsrsquo positive perceptions concerning primary care may change as they experience the more realistic professional demands on primary care physicians that can develop during medical school and as they observe their peers and role models both within primary care and outside
20 Paul F Hogan and Ellen Bouchery ldquo A Model of Subspecialty Choice for Internal medicine Residentsrdquo prepared by
The Lewin Group for the American College of Cardiology 2010 21
After simulating the impact of decreasing cardiology training requirements from three years to two the study finds that oneshyyear decrease in training requirements would increase the percentage of male US medical school graduates choosing cardiology from 171 percent to 182 percent
12
Final Report Health Practitioner Bonuses
2 Effects of Earnings on Labor Supply of Health Care Workforce
Consistent with the economic theory a large number of studies find evidence in support of a positive correlation between earnings and the labor supply of the health care workforce This is in contrast to much earlier studies that relied only on aggregate time series data on physician services and fees to conclude that physician labor supply functions were backwardshybending and physicians responded negatively to wage increases22 For instance Steiger et al (2010) observe that inflationshyadjusted physician fees (weighted average of Medicare and private sector fees) decreased substantially between 1995 and 2005 The timing of the reduction in fees closely matched the observed decline in nonshyresident physician work hours The study finds that the mean hours worked per week by physicians practicing in the US decreased by almost 7 percent between 1996 and 2008 Additionally by 2006 physician fees were 25 percent lower than their inflationshyadjusted 1995 levels More recent studies which use micro data to estimate traditional labor supply equation generally find a small positive elasticity of physiciansrsquo work hours with respect to wage increases For instance Rizzo and Blumenthal (1994) use the instrumental variable approach to estimate the unbiased effect of physicianrsquos wage on the annual hours the physician spends on patient care Their results based on all physicians suggest that a 10 percent increase in the wage rate yields a 27 percent increase in the physicianrsquos annual work hours (ie wage elasticity of 027) When restricted to selfshyemployed male physicians they find a wage elasticity of 023 However for female physicians they find a higher elasticity with a 10 percent increase in the wage rate leading to a 49 percent increase in annual work hours This work is generally supported by Baltagi et al (2005) who find that a 10 percent wage increase would lead to a 3 percent increase in physician labor supply among hospital employed male physicians in Norway Baltagi et al (2005) note that the magnitude of the wage elasticity in this case may be relatively small because of hospital employed physiciansrsquo tendency to earn a lower wage relative to selfshyemployed physicians 23
There are few studies that examine the effect of earnings on a physicianrsquos decision to retire Using micro data from Norway over the period of 1990shy1992 Herneas et al (2000) estimated a model to predict retirement behavior and simulated the effect of financial incentives on retirement decisions among those who were eligible to retire early (during 1990 shy 1992) and who worked fullshytime in 1990 In their simulation the annual pension from 1993 onwards is increased by 72 percent if the retirement eligible individuals continue to work fullshytime through 1992 This increase is equivalent to a 723 percent increase of the annual disposable pension24 The simulation result suggests that the average estimated probability of continuing to work fullshytime throughout 1992 will increase by almost 100 percent (from 384 percent to 706 percent) in response to the 7234 percent hike in annual disposable pensions described above25 In other words in the absence of any pension hike after 1993 only 384 percent of physicians working full time in 1990 would still work full time through 1992 However if pension is raised by 723 percent from 1993 onwards for those who would continue to work full time through 1992 the
22 For an inshydepth exposition of the empirical evidence and lack of support for a backwardshybending physician labor
supply pleas e see Handbook of Health Economic Vol 2 Chapter 14 Section 310 23
The nature of labor supply for Physicians and nurses differ greatly There are some studies on the effect of wages on the labor supply of nurses For example Askildsen and Baltagi (2002) estimates a wage elasticity of nursesrsquo supply of labor between 07 and 08 depending upon the method of estimation The authors argue that while theirs is a larger effect than other estimations have suggested it is still not a large effect relative to other professions They also note that contract structure and type of work being performed significantly impact labor supply decisions and should not be ignored
24 Wealth is defined as the discounted value of future annual disposable pensions and the increase in wealth is
evaluated at the means of the data 25
The expected remaining lifetime was then set at 18 years which is close to the actual average for people in the relevant age groups in 1992
13
Final Report Health Practitioner Bonuses
simulation shows that 706 percent of physicians working full time in 1990 would still do so through 1992 They also estimated that the same financial incentives will lower the average estimated probability of partial retirement in 1992 (of retirement eligible workers) by about 547 percent (from 362 percent to 164 percent) Additionally they find that other decisive factors influencing retirement decisions are the level of education income and marital status
3 Effects of Earnings on the Volume of Primary Care Services
The effect of earnings on the volume of primary care services is related to the previous questions but is a distinct issue that incorporates the ability of providers to impact the demand for services as a result of changes in their income Dummit (2008) argues that as the largest single payer Medicare affects physician practice revenues directly through its payments and indirectly through its fee schedule which many private payers use Lower compensation for primary care physicians is one of the reasons that these specialties are less desirable Reschovsky et al (2012) report that over the past decade Medicare fees and spending for specialist services (such as diagnostic tests and procedures) have gone up more rapidly than fees for EampM services which primary care providers (PCPs) typically provide Those higher payments have contributed to faster growth in specialist services than in EampM patient visits Commercial insurers and state Medicaid plans often build their fee schedules on Medicarersquos further widening the income gap between PCPs and other physician specialists and contributing to the shrinking number of medical students choosing to enter primary care In this section we review how improvements in Medicare fees can influence the volume of health care services provided under Medicare
Hadley et al (2009) estimate the relationship between Medicare fees and the volume of eight specific services provided by physicians using data for 13000 physicians from 2000shy2001 and 2004shy2005 Community Tracking Study Physicians Surveys Since the fee schedule is one of the few policy tools that Medicare potentially has available to influence service volume it is critical to have a better understanding of how changes in Medicare fees affect Medicare service volume Their study finds that a 10 percent reduction in Medicare fees leads to 18 percent to 66 percent reduction in the volume of office visits (of various degrees of complexity) They argue that physicians may be more likely to respond to fee cuts by limiting their acceptance of new Medicare patients rather than limiting visits by established patients
Clemens and Gottlieb (2014) examine the changes in physiciansrsquo reimbursement rates under Medicare before and after year 1997 when consolidation of geographic regions across which Medicare adjusts physician payments led to area specific price shocks The study measures health care supply of all services using RVU They find that health care supplied to Medicare patients (RVUs per patient) exhibits a relatively large long run elasticity of around 15 with respect to reimbursement rates Their results are mostly driven by the stronger positive elasticity among elective procedures (eg eye and orthopedic procedures) When restricted to the analysis of the supply of EampM services their estimates lack precision and they find statistically insignificant short (1997shy98) and long run (2001 to 2005) impact of the price shock on the supply of EampM services However the medium run (1999 and 2000) elasticity is precisely estimated to be 097 for EampM They argue that the observed responses imply that the overall composition of services shifts toward more elective procedures as reimbursement rates increase Finally the number of patients and physicians per patient are almost unaffected by the change in the reimbursement rates
Reschovsky et al (2012) simulate the effect of a permanent 10 percent fee increase for primary care EampM services under Medicare Their estimated primary care supply model suggests that higher primary care fees lead to increases in both the likelihood that PCPs will treat Medicare beneficiaries and more importantly the quantity of EampM services PCPs provide to Medicare
14
Final Report Health Practitioner Bonuses
patients According to their analysis higher fees (10 percent increase permanently) for primary care beginning in 2011 raise the primary care EampM visits by 88 percent
Thus the likely range of changes in the volume of primary care visits in response to a longshyterm increase in Medicare primary care fees appears to be wide Based on Hadley et al (2009) and Reschovsky et al (2012) a 10 percent increase in Medicare fees for primary care can potentially increase the volume of primary care visits in the range of 18 percent to 88 percent However due to the shortshyterm nature of the Medicare PCIP (only 5 years) the observed impact of the incentive payment on the volume of EampM visits may be closer to the lower bound
B Financial Incentives for Primary Care Providers in Underserved Areas
Access to health care in areas with insufficient health professionals has been an ongoing source of concern among policy makers Expansion of health insurance coverage through the implementation of the ACA is likely to stimulate the demand for primary care in general including underserved areas Health Resources and Services Administration (HRSA) designates such areas HPSAs These geographic areas meet a defined threshold of primary care physician to population ratio Since 1987 Medicare has been paying bonuses to physicians providing primary care in rural HPSAs In 1991 the bonus payment was increased from 5 to 10 percent and eligibility extended to services provided by physicians in urban HPSAs Thus this particular form of bonus payment has been in place for almost 25 years Section 413(a) of the Medicare Modernization Act of 2003 put in place an additional 5 percent bonus payment for physicians practicing in Physician Scarcity Areas (PSAs) PSAs were those counties and rural zip codes in metropolitan statistical areas (MSAs) that represented the 20 percent of the Nationrsquos population with the lowest physician to population ratios These areas often coincided with geographic HPSAs so that physicians practicing in those areas received a 15 percent additional bonus payment during 2005shy2008 when the PSA bonuses were in effect (ie from January 2005 through June 2008)
In this section we review the literature related to the volume of these bonus programs and their potential effects on primary care services and providers Programs to address this issue have historically been implemented with the assumption that financial incentives to practice in rural areas are effective in addressing the health professional shortage in given areas This assumption is largely validated by the literature with the effect of financial incentives shown to influence the distribution of physicians and health professionals Importantly the literature generally suggests a multifaceted approach to incentives financial or otherwise Many of the most successful programs evaluated below use recruitment of medical students with specific demographic markers to influence the distribution of physicians Financial incentives have a broad range of reported specialty choice elasticities that range from 001 to 095 These discrepancies may also be somewhat determined by the type of financial incentive (eg grant loan postgraduate bonus)
In an early article on the HPSA bonus Shugarman et al (2001) estimate that in 1991 the total amount of HPSA bonus was almost 316 million dollars Their estimate shows that 583 percent of the total HPSA bonus payment went to the rural HPSAs while the remaining 417 percent went to urban HPSAs They also find that the total bonus payment grew to reach about 106 million dollars in 1996 but then gradually declined to almost 77 million dollars in 1998 The proportion of rural HPSA bonus decreased to 511 percent
In a more recent study Shugarman and Farley (2003) examined the trends in HPSA bonus payments for primary care specialties (family practice general practice and internal medicine) under Medicare over the period of 1992shy1998 using Medicare claims data for nonshymetropolitan area beneficiaries They argue that the bonus payments largely targeted primary care They
15
Final Report Health Practitioner Bonuses
find that in 1992 the payments for primary care services represented 297 percent of the total Medicare bonus payments for physician services to rural Medicare beneficiaries The proportion gradually went up to 37 percent in 1998 Their analysis also showed that in 1992 payments for primary care services represented 14 percent of total basic Medicare payments for physician services and this share rose to 186 percent by 1998 However 559 percent of all Medicare HPSA bonus payments for services to beneficiaries in nonshymetropolitan areas were made to primary care physicians This proportion declined gradually to 497 percent in 1998 The authors claim that low levels of bonus payments in general coupled with the documented declines in those amounts since 1994 may have undermined their future potential to support physicians practicing in rural areas Their findings suggest that physicians were not claiming the extra payments that were available to them Factors that could be contributing to such low uses of bonus payments include the extent to which physicians know about the payments perceived value of the bonus to physicians effects of administrative procedures on the ease of receiving them and concerns about the risk of audits Nevertheless their study highlights the role of bonuses in improving the payments and the supply of primary care services in HPSAs
The literature regarding the effect of financial incentives in underserved areas on the choice of practice location of physicians is relatively scarce Chou and Lo Sasso (2009) examined the impact of local characteristics on the practice location choices for newly trained physicians in New York between 1998 and 2003 Their empirical results suggest that PCPs without educational debt are attracted to HPSAs In other words they estimate that the propensity of choosing a location by a PCP is higher if the location is designated as an HPSA However the estimated propensity is lower if physicians have larger educational debt Their study however addresses the effect of the HPSA status in general rather than any specific effect of the amount of HPSA bonuses
In a review of rural incentive programs Sempowski et al (2004) compare rural recruitment and retention programs in the United States against those in other countries (notably Canada and New Zealand) The authors look specifically at Return of Service (ROS) commitments wherein financial incentive is provided though assistance with medical school payment in return for a commitment to serve in a rural area The authors note that programs offering financial incentives in exchange for ROS commitments to rural or underserviced areas have achieved their primary goal of short term recruitment However the authors note that in the US the lenient buyout opportunities have hindered the programs and limited their effectiveness Sempowski et al (2004) argue that the programs in Canada and New Zealand may have greater success with retention as compared to the US programs because the programs in Canada and New Zealand have a multishyfaceted approach that includes the use of financial incentives along with prudent recruitment strategies
Bolduc et al (1996) provide a theoretical framework of physicianrsquos choice of location They develop a model to assess the effect of various incentive measures introduced in Quebec (Canada) on the geographical distribution of physicians across 18 regions during 1976shy1988 The study specifically examines general practitionersrsquo choice of initial practice locations in Quebec The utility of a particular alternative depends on among other things a measure of expected discounted value of lifetime earnings associated with this alternative It is through changes in this variable that the impact of various incomeshybased physicianshylocation programs is simulated Before 1982 there were substantial variations in the population to general practitioner (GP) ratio across different regions of Quebec In order to redress geographic imbalances in the distribution of physicians the Quebec government introduced the Differential Remuneration Program (DRP) in 1982 that raised the fees (relative to the base fees to general practitioners in underserved regions compared to the regions with relatively lower population to GP ratios Among other incentive measures annual study grants of $10000 have been offered
16
Final Report Health Practitioner Bonuses
(since 1982) tied to a commitment to work in these underserved regions during a number of years equal to the number of grants received A settlement grant program has also been available since 1984 for physicians who choose to practice in these regions This program provides an annual allowance for a maximum of 4 years It varies from $5000 to $10000 (nontaxable) for a physician paid by unit of service depending on the shortage of physicians in the locality Whereas the differential remuneration program influences location choices through differential pricing of physiciansrsquo services by location the grant program affects location choices through a lump sum increase in income for a short duration (4 years)
Bolduc et al (1996) find that on average a 10 percent increase in the general practitioner fees for medical services in a region increases the propensity of a beginning GP to work in this region by 7 percent Thus the implied elasticity of location choice probability with respect to fee increases is about 07 However this elasticity varies across regions it is higher in remote regions (with a maximum of 128) On the other hand on average the elasticity of location choice probability with respect to nonshylabor incomes such as study grants is estimated to be about 111 In other words a 10 percent increase in the study grants tied to a commitment to work in the underserved regions leads to an 111 percent increase in the probability of GPs choosing these underserved regions as their starting practice location However their findings largely depict redistribution of GPs across regions within Quebec rather than showing any increase in the total number of GPs in Quebec
Despite differences in the institutional framework between the US and Canada the findings from Bolduc et al (1996) provide some valuable insights into the potential effects of financial incentives that vary across locations The remaining important issue is to identify how bonus payments affect the annual earnings of physicians in HPSAs Only then based on findings from the literature can one assess the potential impact of the earnings shock in HPSAs on primary care physiciansrsquo choice of practice location Holmes (2005) addresses this question directly Using a database containing the location of physicians at 5shyyear intervals the author compares the locations chosen by alumni and nonshyalumni of programs within the United States charged with increasing physician supply in underserved areas This analysis provides insight into the types of students that choose to enroll in programs such as the National Health Service Corps (NHSC) The author notes that participation in this program consists disproportionately of minorities from private expensive schools This suggests that scholarships (and hence the lack of debt burden) may be an influential factor in participation in the NHSC The multinomial logit model employed by Holmes (2005) shows that students which graduate from an institution with a focus on primary care are also more likely to enroll in the NHSC Using this model Holmes (2005) concludes that the elimination of the NHSC program would lead to a 10shy11 percent decrease in the supply of recent graduates in underserved communities
Rabinowitz et al (2001) examine the history and results of The Physician Shortage Area Program (PSAP) of Jefferson Medical College (Philadelphia PA) The PSAP is intended to address the shortage of primary care physicians in rural Pennsylvania The authorsrsquo analysis uses a cross section of Jefferson Medical College Graduates from 1978 to 1993 to determine which characteristics are predictive of becoming a rural primary care physician (PCP) Of the characteristic variables collected in the data freshman year plans for family practice being in PSAP having a NHSC scholarship male sex and taking elective senior family practice rural preceptorship were independently predictive of primary care in a rural area However among nonshyPSAP graduates with two key selection characteristics of PSAP students (having grown up in a rural area and freshman year plans for family practice) were 78 percent as likely as PSAP graduates to be a rural primary care physician and 75 percent to remain rural PCPs The authors note that this result suggests the most influential area of the program is the admissions component not the financial component Supporting evidence for this conclusion is provided by
17
Final Report Health Practitioner Bonuses
Brooks (2002) who found that rural upbringing and specialty preference were most strongly correlated with recruitment of physicians to rural areas Growing up in a rural area along with the studentrsquos expressed plan to become a primary care physician were associated with a 36 percent likelihood of a graduate practicing in a rural area compared with 7 percent for individuals without these preferences
Although most studies found that there was no correlation with age gender race or marital status (Horner 1993 Looney 1998 Rabinowitz 1999) a few studies determined that men have a greater likelihood of rural practice than women (Fryer 1997 West 1996) However women PSAP graduates were more than twice as likely as nonshyPSAP women to practice in rural areas (317 percent versus 123 percent) (Rabinowitz 2011) Importantly none of these articles list financial incentives as an important factor in recruitment and retention of primary care physicians in rural areas
C Impact of the Increase in Medicaid Reimbursement Rate Relative to the Medicare Rate
The availability of primary care is particularly important for public payer programs such as Medicaid and Medicare Historically Medicaid has been the lowest payer for primary care services relative to Medicare paying just 66 percent of Medicare rates on average26
Cunningham et al (2009) report that fewer physicians accept new Medicaid patients in response to the low Medicaid reimbursement rates in several states Zuckerman et al (2009) describe that in 2008 average primary care physician fees under Medicaid ranged from 57 percent of the national average in Rhode Island to 226 percent of national average in Alaska They also find that after a strong Medicaid fee growth during 1998shy2003 Medicaid fees fell relative to inflation during 2003shy2008 Despite the slowdown in overall fee growth Medicaid fees for primary care services kept pace with inflation ACA increases Medicaid reimbursement rates for certain services provided by primary care physicians to 100 percent of Medicare rates in 2013 and 2014 Given the variability of Medicaid payments across states this could be a substantial boost in payments for physicians in some states and less so in others
The findings in this section focus on the comprehensive effect of a relative rate increase both on services provided and patientrsquos utilization of those services While evidence is mixed the literature indicates significant effects of increased Medicare reimbursement on both the provision and utilization of primary care services Reported elasticities range between 041 in national estimates to shy006 in some state level analyses This broad range suggests varying evidence and a need for greater examination given the importance of this question
1 Systemic Change in Medicaid Reimbursement Rates in All States
Systemic Medicaid changes have the potential to alter the primary care environment across all states Cunningham (2011) considers a regressionshybased approach to identify the causal effect of increases in Medicaid reimbursement rates relative to the Medicare rate on the propensity of primary care physicians accepting new Medicaid patients He reported prior to the 2012 Supreme Court decision (National Federation of Independent Business et al vs Sebelius et al27) that once the ACA is implemented Medicaid eligibility will expand to cover as many as 16 million more poor and lowshyincome adults by 2019 (an increase of more than 25 percent) To
26 Small DM and T McGinnis (2012) ldquoLeveraging the Medicaid Primary Care Rate Increase The Role of
Performance Measurementrdquo Center for Health Care Strategies Inc 27
US Supreme Courtrsquos decision in the case challenging the constitutionality of the Affordable Care Act (ACA httpwwwsupremecourtgovopinions11pdf11shy393c3a2pdf
18
Final Report Health Practitioner Bonuses
meet the resultant surge in demand for primary care services ACA provides financial incentives to encourage higher participation of primary care physicians in Medicaid Specifically the ACA raises the Medicaid reimbursement rates for certain services provided by primary care physicians up to 100 percent of Medicare rates in 2013 and 2014 This study uses primary care physicians from the HSC 2008 Health Tracking Physician Survey and exploits the existing state level variation in Medicaid reimbursement rates (as a percentage of the Medicare rate) The author groups the states in three categories (low medium and high) based on PCPs to population ratios
This study shows that in 2008 the average Medicaid reimbursement rate for lowshyPCP states was about 816 percent of the Medicare rate while for medium and highshyPCP states the average rates were 643 percent and 548 percent respectively The national average of the Medicaid reimbursement rate was 662 percent of the Medicare rate Cunningham (2011) examines the effects of Medicaid reimbursement rates on PCP acceptance of Medicaid patients while accounting for differences in physician practice patient and health care market characteristics The results show that higher Medicaid reimbursement rates are associated with a greater probability of PCPs accepting all or most new Medicaid patients although the effects are relatively modest For PCPs a 10shypercentage point increase in the MedicaidMedicare fee ratio for primary care is associated with only a 21shypercentageshypoint increase in PCP Medicaid patient acceptance The study reports that the national average Medicaid reimbursement rate relative Medicare in 2008 was at 662 percent and the national average acceptance rate of new Medicaid patients by PCPs was 415 percent Therefore the implied elasticity of accepting primary care patients with respect to the payment rate is about 03328 In other words if the Medicaid fee relative to the Medicare rate goes up by 10 percent then the acceptance of new Medicaid patients by PCPs goes up by 33 percent Excluding pediatricians the effect of reimbursement on Medicaid acceptance is slightly higher the implied elasticity of accepting primary care patients with respect to the payment rate is about 041 In the context of the parity in Medicaid and Medicare reimbursement rate under the ACA empirical findings by Cunningham (2011) can serve as a benchmark for the likely positive effect of higher Medicaid reimbursement rates on the access to primary care services
Other studies bolster this finding Shen and Zuckerman (2005) study the effects of Medicaid payment generosity on access and care for adult and child Medicaid beneficiaries The authors use data comparing the experiences of Medicaid beneficiaries with groups that should not be affected by Medicaid payment policies (the uninsured) using a differenceshyinshydifferences model Shen and Zuckerman (2005) find that higher payments do increase the probability of having a usual source of care and the probability of having at least one visit to a doctor or other health professional Specifically they find that a one unit increase (equivalent to a 10 percent increase) in the payment generosity index29 leads to a 15 percentage point increase in the probability of having a usual source of care and a 16 percentage point increase in having at least one visit to a health professional30 Importantly payment generosity was noted to have no effect on the probability of receiving preventive care or the probability of having unmet needs The authors argue that this weak association between increased payments and utilization of services is due to the higher correlation between payment increases and participation by physicians with a secondary effect on utilization
28 Implied Elasticity is (21415)(10662) or 033 After excluding Pediatricians the acceptance rate of Medicaid
patients among PCPs is about 385 percent and a 10shypercentage point increase in the MedicaidMedicare fee ratio for primary care is associated with only a 24shypercentageshypoint increase in PCP Medicaid patient acceptance Therefore the implied elasticity is (24385)(10662) or 041
29 The Medicare payment generosity index is defined as the Medicare capitation rate in a county divided by the
median Medicare capitation rate in the nation in a given year Average is defined to be 10 30
These can be interpreted as elasticities Implied elasticity would be 015 and 016 respectively
19
Final Report Health Practitioner Bonuses
2 Stateshyspecific Experience on Changes in Medicaid Reimbursement Rates
To better understand the mechanism by which systemic changes in the Medicaid system will be implemented and the broad range of environments affected it is informative to review Medicaid changes at the state level Zuckerman et al (2004) illustrate that Medicaid physician fees increased on average by 274 percent between 1998 and 2003 with primary care fees growing the most On average the cumulative percentage change in the Medicaid primary care fee was about 412 percent between 1998 and 2003 The authors note that there was considerable variation in primary care fees across states Seven states (District of Columbia Georgia Indiana Kentucky Maine Rhode Island and South Dakota) left primary care fees almost unchanged while two states (Iowa and New York) raised them by more than 100 percent States with the lowest relative fees in 1998 increased their fees the most but almost no states changed their position relative to other states or Medicare since Medicare rates also increased over the period Subsequently the study finds that primary care physiciansrsquo acceptance of Medicaid patients in highshyfee states was about 18 percentage points higher than the lowshyfee states (61 percent versus 43 percent) in 1997 while in 2001 the gap is reduced to 11 percentage points (58 percent versus 47 percent) The national average of primary care physiciansrsquo acceptance of most or all new Medicaid patients was 53 percent in 1997 and 54 percent in 2001 Moreover large fee increases (eg lowshyfee states experienced the largest fee change on average) were associated with primary care physiciansrsquo greater willingness to accept new Medicaid patients the rate of primary care physiciansrsquo acceptance of new Medicaid patients in these lowshyfee states went up from 43 percent in 1997 to 47 percent in 2001 Although their study shows some evidence that a Medicaid fee increase is associated with increased Medicaid participation among primary care physicians it does not provide a direct link between Medicaid reimbursement rates relative to Medicare and physiciansrsquo acceptance of Medicaid patients
Bindman et al (2003) examine California in particular and focus on the relationship between Medicaid fee increases and the prevalence of managed care in the MedishyCal system The authors note that in August of 2000 a fee increase raised physician Medicaid reimbursement from an average of 577 percent to 652 percent of the average Medicare payment in California This amounts to a fee increase for a typical office visit from approximately $18 to $24 The study used crossshysectional surveys in 1996 and 2001 on both primary care physicians and specialists Controlling for physician demographics and specialties the authors found no increase in MedishyCal participation Their study notes that between 1996 and 2001 despite payment increases the number of MedishyCal primary care physician equivalents dropped from 57 to 46 per 100000 patients31
Mukamel et al (2012) address the effect of similar financial incentives in Californiarsquos Medicaid system but from the standpoint of nurse staffing levels Using separate models for three staffing types RNs LPNs and CNAs the authors determined that financial incentives were only a significant factor in increasing hours per resident day (hprd) for RNs They note that expected nursing home reimbursement rate increases in 2008 were associated with increased RN staffing levels in 2006 They estimate the effect at around a 2shyminute increase (0035 hrpd) for each $10 increase in payment rate This amounts to a 10 percent increase in staffing over 2005 base levels The authors explain that this relatively small increase in staffing might be partially explained by the financial incentives original intent that is to influence labor expenditures and
31 A physician equivalent is defined as one full time physician providing full time working hours per week (40 hrs) in a
given specialty For example a physician who provides 20 hours of Family Medicine is counted as 05 of a physician equivalent in Family Medicine
20
Final Report Health Practitioner Bonuses
not directly influence staffing levels The authors note there may have been a change in wages and benefits for all three groups but that it was not measured in this study
Finally Coburn et al (1999) examined the effect of Medicaid fee changes on physician participation and enrollee access in Maine and Michigan using multiple natural experiments The authors found that changes in Medicaid fees observed in either state over any observed period had no substantial impact on either physician participation or enrollee access and utilization32 In one case in Maine after an increase of 475 percent in Medicaid reimbursement rates primary care physician participation fell by 1 percent (from 477 to 471)33 After a second increase of 245 percent participation increased by only 2 percent34 This result is mirrored in Michigan where participation increased by only 2 percent after a reimbursement increase of 79 percent and decreased by 06 percent after a cut of 166 percent and fell again by 02 percent after a restoration of 196 percent The authors note that these small changes in physician participation hold even when adjusting for lagged responses in both cases The authors found similar results when examining the utilization of services Using ambulatory care as a proxy for utilization of services in general the authors found that changes in the proportion of beneficiaries with at least one visit in a month and in the average number of visits by beneficiaries with at least one visit are not in a direction consistent with the fee changes and are all very small in magnitude The authors note that these results also do not change when estimated in the long run However a major confounding factor in these results as the authors note is the relative size of Medicaid payment rate increases compared to those of the private sector fees The authors state that most gains relative to the private market were quickly eroded
Conclusions
In order to inform our empirical estimation the Lewin Group has explored the health and labor economics literature to understand the nature and the size of the impact of any financial incentives on the labor supply behavior of PCPs and the resultant impact on the availability of primary care services The main objective of this review is to document the prior empirical evidence of the impact of financial incentives on raising the supply of primary care workforce the volume of services impact on medical graduatesrsquo propensity to participate in primary care PCPsrsquo retirement decision etc This review also evaluates the past evidence on the effect of bonuses shortage areas and their effectiveness in redistributing and retaining primary care workforce Finally the review of the literature also focuses on the stateshyspecific experiences with changes in their respective Medicaid payment rates for primary care and the resultant impact on the supply of PCPs their rate of acceptance of Medicaid patients and the volume of primary care services such as office visits or visits for EampM services
Affecting the choice of specialty by a medical student is one way by which the supply of primary care services may be increased Several studies (eg Nicholson 2002 Sivey and Scott 2012) find that the propensity of medical graduates choosing primary care as their specialty would go up by 95shy10 percent in response to a 10 percent increase in their earnings (ie earnings elasticity of 095shy10) Thus even if bonus payments have the potential to influence the inflow of
32 The study has given due consideration to the changes in Medicaid payment relative to the payments by other
payers The authors use the ratio of Medicaid payments to charges as an index of changes in relative payments They have also confirmed with Blue Cross Blue Shield (BCBS) of Michigan (which serves 49 percent of the statersquos health insurance market) that BCBSrsquos paymentsshytoshycharge ratio for all physician services did not change substantially
33 The corresponding relative fee change (ie Medicare relative to charges) is 402 percent
34 The corresponding relative fee change (ie Medicare relative to charges) is 258 percent
21
Final Report Health Practitioner Bonuses
medical students into primary care the magnitude of that impact would depend largely on the size of actual bonus payments relative to PCPsrsquo earnings and how long such payments are in place These two factors will determine the contribution of the Medicare bonus to the lifeshytime earnings of primary care providers
Another way to affect the supply of primary care services is to provide financial incentives for existing providers with the aim of increasing their labor supply Past research (eg Rizzo and Blumenthal 1994 Baltagi et al 2005) estimates that a 10 percent increase in wage earnings would yield a 23 3 percent increase in their annual work hours This low wage elasticity suggests that influencing the supply of primary care labor with direct fee increases alone is likely to be costly The increased fee payments will also likely have an effect on the volume of primary care services However compared to the wage elasticity the change in volume of services in response to fee increases is relatively low Empirical evidence from the literature (eg Hadley et al 2009 Reschovsky et al 2012) suggests that a 10 percent change in Medicare fees would change the volume of office visits or EampM related visits by 18 to 88 percent in the same direction
The numerical estimates of the effect of financial incentives in underserved areas on the choice of practice location of physicians in the US are relatively scarce An important study based on Canadian data finds that on average a 10 percent increase in the general practitioner (GP) fees for medical services in a region increases the propensity of a beginning GP to work in this region by 7 percent (Bolduc et al 1996) Thus the implied elasticity of location choice probability with respect to fee increases is about 07 Several studies highlight the role of bonuses in improving the payments and the supply of primary care services in HPSAs in the US However estimating the true contribution of bonuses in underserved areas in boosting physiciansrsquo earnings would require additional research
Past research on stateshyspecific increases in Medicaid and their resultant impact is relatively sparse However several studies find a positive correlation between the Medicaid reimbursement rate and acceptance rate of Medicaid patients among PCPs Cunningham (2011) finds that the effect of increase in Medicaid reimbursement rate on the propensity of accepting primary care patients is positive but small in magnitude Coburn et al (1999) finds positive impact of Medicaid fee changes on physician participation and enrollee access in Maine and Michigan while Bindman et al (2003) did not find significant effect of Medicaid fee increase on the participation rate of primary care physicians in California
Despite several empirical results regarding the potential magnitude of the effect of different financial incentives the estimated effect of Medicare bonuses or improvement in Medicaid reimbursement rates under ACA may not be substantial This is primarily due to the size and the temporary nature of these positive earnings shocks The empirical evidence on the effect of this type of shortshyterm pay increase is almost nonshyexistent in the literature However the ranges of the effects of longshyterm earnings shocks from our review of the literature can inform policy makers about the likely magnitude of the impacts of these incomeshyaugmenting policies for PCPs if they are sustained for a longer duration
Modeling the Impact of Medicare Incentive Payment for Primary Care Providers
A Study Design Overview
The Medicare primary care incentive is available to eligible primary care practitioners for services provided under selected categories of EampM An eligible primary care practitioner is a
22
Final Report Health Practitioner Bonuses
physician nurse practitioner clinical nurse specialist or a physician assistant who satisfies the following criteria
1 Enrolled in Medicare with a primary specialty designation of family practice internal medicine pediatrics or geriatrics and
2 At least 60 percent of the practitionerrsquos allowed charges under the Medicare physician fee schedule (excluding hospital inpatient care and emergency department visits) are for primary care services
This temporary payment is available for primary care services furnished by an eligible primary care practitioner on or after January 1 2011 and before January 1 2016 The payment is made on a quarterly basis and it amounts to 10 percent of the payment amount for the Part Bshycovered primary care services furnished by the eligible provider
Based on data regarding all the Medicare PCIP recipients in 2011 and 2012 we observe that in 2011 there were 162342 providers that received the PCIP with the majority of physicians specialized in family medicine and internal medicine (Exhibit 3) Also nurse practitioners account for more than half of nonshyphysician recipients in both 2011 and 2012 Finally there was an increase in the number of physician PCIP recipients across all eligible specialties in the second year the payment was in effect The number of all eligible types of nonshyphysician PCIP recipients also increased These estimates are consistent with the statistics reported by CMS35
Exhibit 3 Number of PCIP Recipients under Medicare by Specialty 2011shy2012
Specialty Year 2011 Year 2012
Physicians 121140 133880
Internal Medicine 54062 62554
Family Medicine 63227 66560
Pediatrics 2711 3426
Geriatrics 1140 1340
NonshyPhysicians 41202 51432
Clinical Nurse Specialist 466
Nurse Practitioner 27698 33940
Physician Assistant 13038 16899
Total 162342 185312
Note Actual PCIP recipients eligibility based on conditions 2 years prior to the PCIP payment year
The specific PCIPshyeligible services and their corresponding Current Procedural Terminology (CPT) codes are as follows (1) office and other outpatient visits (99201 through 99215) (2) nursing facility domiciliary rest home or custodial care (99304 through 99340) and (3) home services (99341 through 99350)
Medicare claims data include the Healthcare Common Procedure Coding System (HCPCS) corresponding to each claim submitted by providers Since level I of HCPCS codes is comprised of CPT codes HCPCS codes associated with claims can be used to determine bonusshyeligible EampM services
35 Source Center for Medicare and Medicaid Services (httpwwwcmsgovMedicareMedicareshyFeeshyforshyServiceshy
PaymentPhysicianFeeSchedDownloadsPCIPshy2011shyPaymentspdf)
23
Final Reportshy Health Practitioner Bonuses
The key questions that we examined using the Medicare data include
What is the aggregate number of Medicare PCIP recipients
What proportion of primary care providers qualify for the PCIP
What are the characteristics of primary care providers who qualify for the PCIP
How many eligible claims were submitted by PCIP eligible providers
What is the impact of Medicare incentive payments on services provided patients seen providers accepting Medicare and other related outcome measures
B Data Sources and Variables
1 Main Data Sets
To explore these topics we used a customized data set constructed at the provider level This data set includes all the claims submitted by the entire universe of Medicare providers in each year from 2005 to 2011 The content of this customized data set is similar to the Limited Data Set (LDS) version of the Medicare Carrier File (which is also known as the PhysicianSupplier Part B Claims) available from CMS Research Data Assistance Center (RESDAC) Subsequently in the discussion that follows we will refer to the customized claims level data set for all Medicare providers as the Provider Carrier File (PCF) Most of the claims in our PCF are from nonshyinstitutional providers such as physicians physician assistants clinical social workers and nurse practitioners Key variables in this file include
Procedure codes (HCPCS) corresponding to each claim
Provider total allowable charges associated with all claims
Provider specialty place of service and geographic location (such as zip code)
We constructed a provider level pooled data set (PPD) from the claims level data in the PCF over the period 2005shy2011 This pooled data set includes information such as provider specialty volume of primary care services (based on HCPCS codes) volume of PCIP eligible services distribution of providers by volume of services their annual Medicare allowed charges their geographic location and other related information over a longer time horizon In addition the original PCF included a National Provider Identifier (NPI) for each provider Subsequently each provider was linked by NPI to Provider360 data (available from Lewin Grouprsquos parent company Optum Inc) and the AMA Physician Master File to add provider characteristics such as provider demographics (eg age gender) provider designation medical school practice group information specialty and practice location We also added geographic location specific characteristics by linking the provider level data with the Area Resource File (ARF) based on the practice location information of providers The ARF data are maintained by the Health Resources and Services Administration (HRSA) The main advantage of this pooled data set is the ability to track providers over time and capture changes in their volume of services in response to Medicare payment incentives using a preshyandshypost analysis design
2 Trends in Key Outcome Variables
We were interested in estimating the impact of the PCIP on the supply of PCPs and patientsrsquo access to their services We measured improvements in access to care by studying changes in the volume of primary care services provided and the number of PCP providers Both the supply of PCPs and volume of services are measures of access to care previously used in the
24
Final Report Health Practitioner Bonuses
literature36 In addition we investigated the impact of the PCIP on the allowed charges associated with eligible EampM claims
Primary Care Providers with PCIP Eligible Specialties
First we examined the trend in the number of eligible providers submitting Medicare claims An increase in the number of primary care providers relative to the population is expected to improve access to primary care As shown in Exhibit 4 the number of PCPs accepting Medicare patients increased steadily over the study period with an approximate 40 percent increase in the number of providers treating Medicare patients from 2005 to 2011 This trend is common to all four physician specialties under study37 In addition the number of nonshyphysician practitioners more than doubled over this period This significant increase in the number of nonshyphysician providers especially nurse practitioners has been documented elsewhere38
Exhibit 4 Number of Primary Care Providers under Medicare by Specialty 2005shy2011
Specialty 2005 2006 2007 2008 2009 2010 2011
Physicians 138356 147771 165150 173018 178784 185070 191930
Internal Medicine 69391 74411 83117 87090 90291 93904 97526
Family Medicine 61438 65205 72247 75132 77536 79891 82298
Pediatrics 6539 7045 8527 9447 9543 9757 10555
Geriatrics 988 1110 1259 1349 1414 1518 1551
NonshyPhysicians 46634 53823 68297 80041 88569 97789 109353
Clinical Nurse Specialist 1784 1934 2188 2304 2370 2446 2508
Nurse Practitioner 23610 27450 35286 42144 46973 52472 59505
Physician Assistant 21240 24439 30823 35593 39226 42871 47340
Total 184990 201594 233447 253059 267353 282859 301283
Volume of EampM PCIP Eligible Claims
Our second measure of supply of primary care services is the volume of claims submitted by primary care providers for EampM services As presented in Exhibit 5 the volume of EampM claims submitted by physicians increased by roughly 9 percent between 2005 and 2008 EampM claims took a slight dip in 2009 increased in 2010 and then stabilized in 2011 at roughly the levels in 2008 The same general increasing trend applied to each of the four eligible physician specialties with the exception of geriatrics which experienced a constant and substantial increase in EampM claims of 52 percent over the study period Internal medicine physicians provided the majority of services generating more than 50 percent of EampM claims each year over the study period Family physicians are the second largest group of providers to supply
36 For instance see Stensland et al 2013
37 In 2005 almost half of the primary care providers (PCPs) were male but the share of male PCPs declined to almost
40 percent in 2011 (Exhibit B1 Appendix B) On the other hand the share of PCPs aged 55 and above among all male PCPs increased from 24 percent in 2005 to 375 percent in 2011 (Exhibit B1 Appendix B) As observed in Appendix Exhibit B1 the physician population appears to be aging The share of male physicians aged 65 and above underwent the largest increase recently from 186 percent in 2010 to 21 percent in 2011 (Exhibit B9a Appendix B) A similar increasing trend is also observed among female physicians aged 55 and above (Exhibit B9b Appendix B) Finally in the case of nonshyphysicians we observe the same steady increase in the share of providers aged 55 and above for both male and female providers (Exhibit B10shy11 Appendix B)
38 Source GAO (2008) ndash ldquoPrimary care Professionals Recent Supply Trends Projections and Valuation of Services
ldquo GAO 08shy472T
25
Final Report Health Practitioner Bonuses
EampM services representing about 40 percent of the total followed by geriatricians and pediatricians
Consistent with the increase in the number of nonshyphysicians documented above we observe an even more dramatic increase in the total number of EampM claims submitted by nonshyphysicians (clinical nurses nurse practitioners and physician assistants) The volume of EampM claims more than doubled over the study period from roughly 9 million in 2005 to more than 20 million in 2011
Exhibit 5 Total Number of PCIP Eligible EampM Claims submitted by All PCPs under Medicare by PCP Specialty 2005shy2011
Specialty 2005 2006 2007 2008 2009 2010 2011
Physicians 105943390 107978615 111700420 115408741 114881401 117265160 115329828
Internal Medicine
60279101 61222893 63082429 64946744 64244760 65447440 63698392
Family Medicine
44352228 45264171 47011232 48776874 48891712 49977085 49767310
Pediatrics 334997 352594 360508 365170 387636 391312 377604
Geriatrics 977064 1138957 1246251 1319953 1357293 1449323 1486522
NonshyPhys 8885528 10366281 11979963 13710969 15376840 18008471 20477006
Clinical Nurse Specialist
6083315 7068153 8117610 9212329 10298679 11987059 13561380
Nurse Practitioner
153463 165033 168030 200074 228899 260618 296206
Physician Assistant
2648750 3133095 3694323 4298566 4849262 5760794 6619420
With both the aggregate number of EampM claims and the number of providers rising over time we further explore the change in the volume of claims per provider over time In other words we examined whether the increase in the aggregate number of claims could be due to the increase in claims per provider or whether it is just due to the increase in the number of providers
Inspection of Exhibit 6 reveals that in the case of all physicians the average number of eligible EampM claims per provider in 2011 was lower than in 2005 For instance the average number of eligible EampM claims for internal medicine was 653 in 2011 compared to the higher value of 869 in 2005 The decreasing trend in average claims per physicians may be due to the increase in the number of PCPs in the absence of a substantial increase in the patient population
26
Final Report Health Practitioner Bonuses
Exhibit 6 Average Number of PCIP Eligible EampM Claims per PCP under Medicare by Specialty 2005shy2011
Finally in the case of nonshyphysicians there was an overall increase in the average number of EampM claims submitted by physician assistants (PA) nurse practitioners (NP) and clinical nurse specialists (CNS) after 2009 (see Exhibit B2 Appendix B) For example the number of claims per PA increased from 125 in 2005 to almost 140 in 2011 On the other hand the number of claims per NP was 253 in 2005 then declined to 219 in 2009 and then increased to about 228 in 2011 The increase in the average number of claims submitted suggests that the dramatic increase in services provided is due to both an increase in the number of providers and in the number of services provided by each nonshyphysician The average number of claims per PCIP recipients by specialty and the average allowed charges per PCIP recipients by specialty are presented in Appendix B Exhibit 12 and 13 respectively
Allowed Charges for PCIP Eligible EampM Claims
So far we have focused on the level of EampM services provided measured in terms of number of claims and the number of providers Next we turn to the dollar value associated with EampM claims measured using allowed charges As shown in Exhibit 7 the total allowed charges (in million dollars) for eligible EampM claims increased for all providers over the period of analysis Overall total allowed charges increased by 58 percent with internal medicine and family medicine physicians accounting for most of this increase It is also noteworthy that the value of claims submitted by nonshyphysicians increased substantially over the same period by a factor between 2 and 3
27
Final Report Health Practitioner Bonuses
Exhibit 7 Total Allowed Charges (in million $) for the PCIP Eligible EampM Claims submitted by All PCPs under Medicare 2005shy2011
Specialty 2005 2006 2007 2008 2009 2010 2011
Physicians $6271 $6575 $7343 $7813 $8119 $9079 $9274
Internal Medicine $3671 $3830 $4251 $4506 $4644 $5182 $5231
Family Medicine $2520 $2645 $2982 $3183 $3340 $3742 $3881
Pediatrics $20 $21 $23 $24 $26 $30 $30
Geriatrics $61 $78 $87 $100 $108 $125 $131
NonshyPhysicians $416 $517 $617 $743 $871 $1114 $1316
Clinical Nurse Specialist $287 $358 $421 $507 $592 $749 $878
Nurse Practitioner $8 $9 $9 $11 $14 $17 $20
Physician Assistant $122 $150 $187 $225 $265 $349 $418
Total $6687 $7091 $7960 $8556 $8990 $10193 $10589
As shown in Exhibit 8 the average allowed charge per PCP for EampM claims increased slightly for internal medicine physicians and pediatricians after 2009 (also see Appendix B Exhibit B2) The average value of EampM claims increased for the other PCPs but not as fast as the total value of these claims Given the moderate increase in the average allowed charges for EampM claims the substantial increase in the aggregate allowed charges is likely due to the increase in the number of claims which in turn as discussed above may be driven by the increase in the number of providers Another important observation is that although the average number of claims submitted by physicians declined over the 2005shy2011 period the average allowed charges remained the same or even increased This observed increase in allowed charges per provider despite the documented decline in the number of claims may reflect changes in the composition of services that physicians are providing We hypothesize that this change in the composition is due to an increase in the supply of services that take more time and which are typically associated with higher charges We explore this hypothesis in the following section
28
Final Report Health Practitioner Bonuses
Exhibit 8 Average Allowed Charges ($) for the PCIP Eligible EampM Claims per PCP under Medicare by Specialty 2005shy2011
Finally we constructed the proportion of practitionerrsquos allowed charges under the Medicare fee schedule (excluding hospital inpatient admission and emergency room visits) that are for PCIP eligible primary care services As observed in Exhibit 9 for both physicians and nonshyphysicians the proportion of services that are PCIP eligible varies across specialties and is in general steadily increasing over the observation period However compared to primary care physicians the nonshyphysicians experienced a much larger percentage change in the share of allowed charges that are associated with PCIP eligible services
Exhibit 9 Share of Allowed Charges for PCIP Eligible EampM Claims by Specialty2005shy2011
Specialty 2005 2006 2007 2008 2009 2010 2011
Physicians
Internal Medicine 583 590 611 609 612 651 632
Family Medicine 692 699 724 722 725 750 734
Pediatrics 289 376 439 426 446 517 480
Geriatrics 754 845 851 858 855 879 867
NonshyPhysicians
Clinical Nurse Specialist 239 249 258 299 333 364 407
Nurse Practitioner 616 649 647 663 666 708 715
Physician Assistant 506 514 529 534 543 598 591
Note the proportions are of allowed charges for all Medicare claims (excluding hospital inpatient ER drug and lab)
29
Exhibit 8 Average Allowed Charges ($) for the PCIP Eligible EampM Claims per PCP under Medicare by Specialty 2005-2011
Final Report Health Practitioner Bonuses
While the proportion of services that are PCIP eligible is increasing over the observation period the opposite is true for the proportion of EampM claims (Exhibit 10) Consistent with the decrease in the aggregate number of EampM claims documented above we observe that the share of EampM claims out of the total Medicare claims is also slightly decreasing over the period For example in the case of providers specializing in internal medicine the share decreased from 411 percent in 2005 to 375 percent in 2011
Exhibit 10 Share of PCIP Eligible EampM Claims by Specialty 2005shy2011
Specialty 2005 2006 2007 2008 2009 2010 2011
Physicians
Internal Medicine 411 411 401 393 373 383 375
Family Medicine 432 430 419 409 386 392 384
Pediatrics 309 338 347 347 330 342 341
Geriatrics 648 696 677 641 610 600 603
NonshyPhysicians
Clinical Nurse Specialist 272 262 259 276 288 309 329
Nurse Practitioner 558 567 548 519 485 503 500
Physician Assistant 455 461 450 438 410 434 431
Note the proportions are calculated out of all Medicare claims (excluding hospital inpatient ER drug and lab)
The trends in primary care services and providers discussed above apply in general to the more restricted sample of PCIP recipients (Exhibits B4shy7 in Appendix B) When we limit the number of providers to 2011 PCIP recipients we observe a slight decrease in the average number of eligible claims submitted by physicians (Exhibit B5 Appendix B) and an overall increase in the average allowed charges over the study period (Exhibit B6 Appendix B)
C Econometric Framework
We used the providershylevel data to address the key research questions related to the Medicare PCIP We estimated several regressionshybased models using the DID method to obtain consistent estimates of the PCIP policy effect39 In order to implement the DID model we
1 Form a group of providers (treatment group) who are likely to be affected by the PCIP program including the following specialties family practice internal medicine pediatrics and geriatrics
2 Identify a natural relevant comparisoncontrol group (other nonshyprimary careshypractitioners) who are not likely to be affected by the PCIPshy
3 Assess the changes in our key outcomes of interest for the treatment group relative to the control group before and after the PCIP policy is in effect
We estimate the following econometric model to identify the effect of Medicare PCIP program on the magnitude of primary care EampM services
39 An alternative estimation method is a preshypost analysis but if there are unobserved factors that affect the
magnitude of EampM services supplied by any provider (primary or nonshyprimary care) and the effect of these unobserved factors varies over time a preshypost model would not yield an unbiased incentive effect
30
Final Report Health Practitioner Bonuses
Sit = + lowast Ti + lowast t + 8 lowast t lowast Ti + it lowast + Eit
We let Sit be the volume of eligible EampM services provided by provider i in period t Ti is anindicator for treatment group that takes the value 1 if the provider is a PCP and zero otherwise the variable Postt is an indicator variable taking the value of 1 in the years when the PCIP policyis likely to impact the behavior of the providers and 0 otherwise the vector Xit includes providercharacteristics such as age and gender The term Eit represents the net influence of randomunobserved factors affecting EampM services Importantly the estimated coefficient 8 (the coefficient of the interaction term between the treatment group indicator and the postshyPCIP policy period indicator) in equation (1) represents an unbiased estimate of the effect of the Medicare primary care incentive payment on the volume of primary care EampM services The derivation of this estimated effect is presented in Appendix C (C1) A similar methodology can be applied to estimate the effect of the incentive payment on other outcomes of interest
The choice of the control group for the DID model was based on several criteria Ideally we would have included providers with nonshyeligible specialties who also supplied EampM services In order to determine some preferred comparison group providers we
1 Evaluated the frequency of PCIP eligible and nonshyeligible providers by (primary) specialtyavailable in the Provider360 dataset after merging that data set with the list of NPIs of 2011PCIP recipients
2 Examined the volume of claims related to evaluation and management (EampM) servicesby specialty based on 2009 Medicare claims by service and specialty
3 Chose based on the volume of claims and the number of providers 8 PCIP nonshyeligiblespecialties These PCIP nonshyeligible specialties are (1) Psychiatry amp Neurology (2)Obstetrics amp Gynecology (3) Urology (4) Ophthalmology (5) Pathology (6)Psychologist (7) Podiatrist and (8) Optometrist Total number of PCIP eligible claimssubmitted by these providers with PCIP nonshyeligible specialties is presented in AppendixB Exhibit B14
D Main Results
The estimation of DID regression models is based on the number of eligible providers the volume of claims for PCIP eligible EampM services and the allowed chargespayments associated with those claims The volume of EampM claims and payments analyzed here excludes those for hospital inpatient ER drug and laboratory services As we explain above Medicare providers with a PCIPshyeligible specialty (ie family practice internal medicine geriatrics pediatrics NP PA and clinical nurse specialists) that have at least one Medicare claim are included in the ldquotreatmentrdquo group These are the providers who are likely to be affected by the Medicare PCIP policy Given that the announcement of the PCIP program was made in 201040 we assumed that the providers with Medicare PCIP eligible specialties would be potentially responsive to the
40 Source Patient Protection and Affordable Care Act (lsquolsquoPPACArsquorsquo Public Law 111ndash148) For our analysis we report a
single estimate of PCIP impact under each regression model where year 2010 and 2011 are considered as the postshypolicy periods We performed several sensitivity analyses to investigate if the estimated impact is significantly different between 2010 and 2011 we also checked if the results change once we consider 2011 as the only post period Based on such detailed analysis we did not find any systematic evidence that the estimated impact is different between these two years and they are not sensitive to the choice of postshypolicy period
31
Final Report Health Practitioner Bonuses
incentive as early as year 2010 Therefore years 2010 and 2011 represent the postshypolicy period
The DID regression models were estimated using several subshysamples (1) all providers (2) only providers that appear in all 7 years of data (roughly 44 percent of all providers) (3) providers who were near the PCIP eligibility criteria in 2009 (ie restricted to providers who had the share of total Medicare claim payments shyshy allowed chargesshyshy between 50 percent and 65 percent for PCIP eligible EampM services About 15 percent of all providers in the sample met this restriction
In Exhibit 11 we summarize the average volume of PCIP eligible EampM claims and the allowed chargespayments associated with those claims by select patient category and CPT code for providers in the ldquotreatmentrdquo group Comparing the first and last columns we observe that providers near the 60 percent eligibility threshold generate more EampM claims on average compared to the average PCP accepting Medicare (895 vs 590)
Exhibit 11 Number of PCIP Eligible EampM Claims and Mean Allowed Charges per Provider per Year by Types of Claims for Providers with PCIP Eligible Specialty 2005shy2011
All Providers Providers in
All Years
Providers Near
Eligibility
Analysis Sample
Number of Unique Providers with PCIP Eligible Specialty
264141 129587 17081
Annual Average Number of PCIP Eligible EampM Claims per provider
All EampM Claims 590 752 895
New Patient Claims 19 21 25
Established Patient Claims 487 628 813
Other Claims 84 103 57
Claims in 3 Major CPT Codes
Established Patients (15 mins) 243 315 403
Established Patients (25 mins) 177 227 282
Established Patients (40 mins) 20 25 34
Annual Average Allowed Charges for PCIP Eligible EampM Claims per Provider
All EampM Payments $40208 $51016 $60235
New Patient Payments $1941 $2223 $2661
Established Patient Payments $32409 $41764 $53755
Other Payments $5858 $7029 $3819
Payments in 3 Major CPT Codes
Established Patients (15 mins) $13613 $17635 $22712
Established Patients (25 mins) $15217 $19524 $24581
Established Patients (40 mins) $2313 $2976 $4051
Note Summary of PCIP eligibility criteria Primary care physicians (with internal medicine family practice pediatrics and geriatrics specialty) who have at least 60 percent of the practitionerrsquos allowed charges under the Medicare physician fee schedule (excluding hospital inpatient care and emergency department visits) are eligible for primary care services The PCIP eligible primary care services are defined by specific EampM codes Medicare PCIP is also provided to physician assistants nurse practitioners and clinical nurse specialists who meet the similar eligibility criteria For the purpose of our analysis we consider the PCPs (with the PCIP eligible specialty) who have
32
Final Report Health Practitioner Bonuses
50 percentshy65 percent of their services for PCIP eligible EampM services (defined by specific EampM codes) in 2009 are considered to be near the eligibility threshold
For the control group the number of providers the volume of their Medicare claims for EampM services and the associated allowed charges for the providers with the PCIP nonshyeligible specialties are presented in Exhibit 12 As expected providers in the control group generated much fewer EampM claims compared to providers in the treatment group Specifically providers in the control group supplied less than half the volume of EampM services compared to providers in the treatment group (ie 296 vs 590)
Exhibit 12 Number of PCIP Eligible EampM Claims and Mean Allowed Charges per Provider per Year by Types of Claims for Providers with PCIP NonshyEligible Specialty 2005shy2011
All Providers Providers in All Year
Analysis Sample
Number of Unique Providers with PCIP NonshyEligible Specialty
108302 70583
Annual Average Number of PCIP Eligible EampM Claims per Provider
All EampM Claims 296 333
New Patients Claims 35 38
Established Patients Claims 243 276
Other Claims 18 19
Claims in 3 Major CPT Codes
Established Patients (15 mins) 129 146
Established Patients (25 mins) 47 53
Established Patients (40 mins) 5 6
Annual Average Allowed Charges for PCIP Eligible EampM Claims per Provider
All EampM Payments $18618 $20868
New Patients Payments $3421 $3724
Established Patients Payments $14108 $15975
Other Payments $1089 $1169
Payments in 3 Major CPT Codes
Established Patients (15 mins) $7321 $8288
Established Patients (25 mins) $4048 $4578
Established Patients (40 mins) $641 $711
1 Impact of PCIP Policy on Number of Eligible Providers
We examined the changes in the number of providers with a Medicare PCIP eligible specialty in a county who have at least one claim for PCIP eligible services to identify the potential impact of the PCIP policy on these providers Exhibit 13 shows the results from the DID regression models in which we use the number of providers in a county and in a specific year as the outcome variable (Model 1) the number of physicians in each county and year (Model 2) and the number of nonshyphysicians (ie NP PA and CN) The key variable in each model is the interaction between the indicator for PCIP eligible specialty and the indicator for the period after 2009
33
shy
Final Report Health Practitioner Bonuses
In Model 1 the first estimated coefficient suggests that on average the number of Medicare providers with a PCIP eligible specialty and at least one PCIP eligible claim increased by about 28 providers per county in each year after 2009 due to the Medicare PCIP This represents an economically meaningful increase given that on average there were about 15 providers per county per year in a PCIP eligible specialty during the sample period This increase (almost 19 percent) in the number of providers in PCIP eligible specialties may be the primary reason for the estimated reduction in the number of EampM claims per provider due to the PCIP policy
In addition when we restrict the estimation to physicians (Model 2) the increase in the number of physicians with a PCIP eligible specialty attributable to the policy is about 2 per county per year This is almost 10 percent of the average number of primary care physicians in a given PCIP eligible specialty per county per year (average is almost 19) Furthermore the estimated policy impact in Model 3 indicates that the number of PCIP eligible nonshyphysicians increased by over 36 providers per county per year Thus all three models confirm that the introduction of the PCIP policy generated an increase in the number of PCIP eligible providers above and beyond the general increasing time trend Subsequently this increased number of providers may have resulted in the reduction in the average number of EampM claims submitted by these Medicare providers after 200941
Exhibit 13 Impact of Medicare PCIP on the Number of PCPs with Medicare Claims for PCIP Eligible Services (2005shy2011)
Dependent Variable Number of
Providers per county
All Providers
(1)
Physicians Only
(2)
Non Physicians Only
(3)
PCIP Elig Specialty Indicator 4247 3400 2721
(3133) (3647) (2078)
Elig Specialty Ind x Post 2009 2759 1950 3632
(0444) (0674) (0375)
Post 2009 2929 1884 2895
(0455) (0541) (0304)
Median Income ($10k) 1591 2218 1061
(0385) (0468) (0206)
Percent in poverty 0254 0339 0210
(00479) (00587) (00285)
Population (10k) 0536 0607 0317
(00280) (00339) (00128)
Percent Population over 65 shy0307 shy0196 shy0234
(00363) (00452) (00238)
Unemployment Rate shy0518 shy0510 shy0400
41 We have also estimated similar models for the primary care providers who have any Medicare claims (not
necessarily under PCIP eligible services) and the estimated effects of the PCIP policy are slightly larger in those cases These additional results are included in Appendix B Exhibit B 15 In addition we have estimated similar models of providers who met the 60 PCIP eligibility threshold in each year (2005shy2011) As expected the estimated impact of PCIP policy on the number of primary care providers is relatively lower for this restricted set of providers However if we focus on this restricted set of providers then we are likely to lose those providers who may have been induced to provide PCIP eligible services in response to the policy but may not have reached the 60 threshold Similarly we would lose the information on the providers who have reduced the proportion to below 60 The estimated results on this restricted set of providers are presented in Appendix B Exhibit B16
34
-
shy
Final Report Health Practitioner Bonuses
Dependent Variable Number of
Providers per county
All Providers
(1)
Physicians Only
(2)
Non-Physicians Only
(3)
(00461) (00557) (00324)
Intercept shy4970 shy5988 shy3006
(3489) (3996) (2344)
Specialty Fixed Effects Yes Yes Yes
Year Fixed Effects Yes Yes Yes
State Fixed Effects Yes Yes Yes
N 140192 107526 95647
Adj Rshysq 0310 0338 0365
Note Robust standard errors are in parentheses + significance at 10 percent significance at 5 percent Thenumber of observation is based on the number of counties the number of years and the number of providerspecialties in each model (ie physicians include 4 primary care specialties and nonshyphysicians include 3 subshyspecialties)shy
The PCIP policy could impact the number of Medicare providers submitting PCIP eligible claims through several channels First the policy may induce an established PCP to start to treat Medicare patients (new or established patient) under PCIP eligible services that they may not have done before In addition the policy may also encourage new providers fresh out of their completion of residency training to provide PCIP eligible services under Medicare Lastly one can also argue that the PCIP policy may encourage providers with a PCIP nonshyeligible specialty to switch to a PCIPshyeligible specialty and increase their chance to receive the incentive payment This last scenario could be especially relevant for internal medicine subshyspecialties such as cardiology pulmonary disease nephrology and endocrinology which are not PCIPshyeligible although the internal medicine specialty is PCIPshyeligible Without judging whether such specialty switching is a desired outcome under the PCIP policy we first examine to what extent such switching of specialty is prevalent in our dataset and second whether such phenomenon is large enough to influence the impact of the PCIP policy on the number of providers who submit at least one Medicare claim under PCIP eligible services
Based on our 2005shy2011 claims data we have estimated that during the postshyPCIP policy period (2010 and 2011) there are about 30864 new primary care physicians (family practice internal medicine pediatrics and geriatrics) and 27927 new primary care nonshyphysicians who have submitted at least one claim under Medicare (Note that in this accounting we do not attempt to distinguish between ldquonewrdquo providers who were induced by the PCIP to participate and providers that would have entered the Medicare program anyway) Based on our Medicare data we have estimated that 3057 physicians with at least one Medicare claim switched their specialty to a PCIP eligible specialty during the postshypolicy period Over 50 percent (1645) of these specialty switches are switches into internal medicine mainly from internal medicine subshyspecialties The number of specialty switchers is substantially smaller than the number of total new Medicare physicians with a PCIP eligible specialty in the postshypolicy periods Thus switching of specialty could not account for the estimated impact of the PCIP policy on the number of primary care physicians
Based on our claims data we estimate that during the postshyPCIP policy period (2010 and 2011) there are 17662 new primary care physicians (family practice internal medicine pediatrics and geriatrics) who have submitted at least one PCIP eligible claim Additionally we have estimated from published sources that during the post policy period there are about 10000 residency
35
Final Report Health Practitioner Bonuses
positions filled under primary care annually from 2009 to 201142 If the Medicare PCIP policy attracts part of these providers under Medicare to provide PCIP eligible services then such evidence would be consistent with our estimated impact of the PCIP policy in Exhibit 13
Exhibit 14 shows the impact of the PCIP policy on the number of providers accepting new Medicare patients (Model 1) and on the number of new Medicare providers (Model 2) The estimated coefficient on the main variable of interest mdash the interaction between the PCIP eligibility indicator and the postshy2009 indicator mdash suggests that due to the PCIP policy on average the number of PCPs accepting new Medicare patients increased by about 1 provider per county per year for a given PCIP eligible specialty This estimated impact is not negligible given that there are about 9 Medicare PCPs for a given primary care specialty who accept new Medicare patients per county per year during the sample period
Similarly Model (2) in Exhibit 14 shows the impact of the PCIP policy on the number of new Medicare providers who have submitted Medicare claims for PCIP eligible services The estimated coefficient on the main variable of interest suggests that due to the PCIP policy on average the number of new Medicare primary care providers with at least one claim submitted for PCIP eligible services increased by 0148 per county per year for a given PCIP eligible specialty Given that on average there are about 14 new Medicare primary care providers per county per year in a PCIP eligible specialty with at least one PCIP eligible claim during the sample period the estimated impact is again not negligible
Exhibit 14 Impact of Medicare PCIP on the Number of Providers Accepting New Medicare Patients and the Number of New Primary Care Providers under Medicare with Claims for
PCIP Eligible Services (2005shy2011)
Number of Providers Accepting
New Medicare Patients (1)
Number of New
Medicare Providers (2)
PCIP Elig Specialty Indicator 2819 4367
(1959) (0297)
Elig Specialty Ind x Post 2009 0883 0148
(0345) (00440)
Post 2009 1605 0293
(0369) (00460)
Median Income ($10k) 1455 00508
(0295) (00445)
Percent in poverty 0143 00160
(00366) (000545)
Population (10k) 0351 00482
(00204) (000328)
Percent Population over 65 shy0177 shy00443
(00295) (000436)
Unemployment Rate shy0314 shy00512
(00374) (000544)
Intercept shy3432 shy3926
42 Estimates include the following primary care specialties family practice internal medicine (including pediatrics)
pediatrics Source National Resident Matching Program Results and Data 2011 Main Residency Match National Resident Matching Program Washington DC 2011
36
Final Report Health Practitioner Bonuses
Number of Providers Accepting
New Medicare Patients (1)
Number of New
Medicare Providers (2)
(2461) (0330)
Specialty Fixed Effects Yes Yes
Year Fixed Effects Yes Yes
State Fixed Effects Yes Yes
N
Adj Rshysq
140192
0250
121084
0255
Note Robust standard errors are in parentheses + significance at 10 percent significance at 5 percent
2 Impact of PCIP Policy on Number of Claims for EampM Services
The DID estimates from the model using the volume of EampM claims as the outcome variable are presented in Exhibit 15 The estimated coefficient of that interaction term in the first column of Exhibit 15 (ie column (1)) indicates that in response to the Medicare PCIP policy PCPs with PCIP eligible specialties reduced their number of PCIP eligible EampM claims by about 52 on average 43 This represents a reduction in the volume of claims per provider of a little less than 9 percent Furthermore we estimate that on average providers with PCIP eligible specialties had about 187 more EampM claims submitted under Medicare during the sample period than the providers with PCIP nonshyeligible specialties Also for the providers with both PCIP eligible and nonshyeligible specialties the average number of EampM claims submitted went down by 70 claims after 2009
In addition we find that as the number of primary care providers per 10000 population increases the number of claims per provider decreases Finally the volume of claims per provider increases with the providerrsquos age and with the increase in the size of the Medicare population The effect of unemployment on the number of EampM claims per provider is also positive and statistically significant
When the sample is restricted to providers who were near the PCIP eligibility threshold in 2009 (column (3)) the estimated reduction in the number of claims per provider due to the PCIP policy is smaller only about 33 claims44 The reduction in the number of claims per provider in response to the PCIP policy may appear counterintuitive However the total number and value of claims may still increase as a result of the policy as long the number of providers with a PCIP
43 The postshypost policy period in our analysis comprises of two years 2010 and 2011 We have also estimated the
impact of the PCIP policy on the volume of claims and other outcomes discussed later for each postshypolicy year separately and the effects in these two years are not statistically different for a given outcome of interest
44 We focus on the primary care providers who are near the PCIP eligibility threshold because these providers are at
the margin to improve the volume of their PCIP eligible services by incurring a relatively low cost and gain the PCIP incentive payment (ie marginal benefit is much higher relative to the marginal cost) Therefore we would expect the impact of PCIP policy (if there is any) would be more substantial among the providers near the eligibility threshold However if we only focus on those who met the 60 criteria then we would lose the behavioral changes among the providers who are below the threshold may have tried to reach the 60 threshold in response to PCIP This may bias the PCIP impact By focusing only on those providers who met the 60 eligibility criteria we would face the typical problem of selection bias Hence focusing on those providers who are near the eligibility threshold circumvents this problem but captures the essence of the hypothesis that we are referring to In addition we have estimated several models with different ranges (50shy65 50shy70 55shy65 and 40shy80) of the proportion of allowed charges on PCIP eligible primary care services and tested the sensitivity of our results At least for the first three ranges mentioned we find that results are not sensitive to those three ranges However once we broaden the analysis to 40shy80 the estimated impact is in between the effects we observed for all providers and the providers in 50shy65 threshold (as expected) Also the mean value of this proportion in the sample is about 53
37
Final Report Health Practitioner Bonuses
eligible specialty increases at a higher rate than the decline in the number of claims submitted per provider Thus a reduction in the number of claims per provider should not be interpreted as evidence of decreased access to primary care services if the number of providers is increasing at the same time
Exhibit 15 Impact of Medicare PCIP Policy on PCIP Eligible EampM Claims (2005shy2011)
Dependent Variable PCIP Eligible
EampM Claims per Provider
Analysis Sample
(1) EampM
Claims
(2) EampM Claims
(Providers in All Years)
(3) EampM Claims
(Near Eligib 09)
PCIP Elig Specialty Indicator 1869 1166 1176
(1293) (1838) (1246)
Elig Specialty Ind x Post 2009 shy5173 shy3696 shy3259
(1814) (2412) (5762)
Post 2009 shy7442 shy7727 shy3728
(2692) (3423) (3155)
Age 8450 6980 2241
(00450) (00637) (00547)
Male 1657 1989 9039
(0965) (1243) (1162)
Urban shy3978 shy5101 shy4900
(1712) (2153) (2190)
Median Income ($10k) shy7296 shy5815 00475
(0886) (1137) (1057)
Percent in poverty shy4678 shy4105 1523
(0222) (0283) (0272)
Population (10k) shy0107 shy0134 shy00710
(000441) (000576) (000531)
Percent Population over 65 1784 2072 1844
(0256) (0319) (0322)
Unemployment Rate 1307 1766 6838
(0425) (0560) (0522)
Primary Care Phypop10k shy0156 shy0172 shy0258
(000716) (00102) (00146)
PC Nonshyphypop10k shy0452 shy0627 shy0208
(00154) (00234) (00228)
Intercept shy34610 shy30330 shy11460
(1669) (2263) (1734)
Specialty Fixed Effects Yes Yes Yes
Year Fixed Effects Yes Yes Yes
State Fixed Effects Yes Yes Yes
N 2014835 1397760 746845
Adj Rshysq 0222 0241 0380
Note Robust standard errors are in parentheses + significance at 10 percent significance at 5 percent
38
Final Report Health Practitioner Bonuses
3 Impact of PCIP Policy on Allowed Charges for EampM Services
The estimated effect of the PCIP policy on the allowed charges associated with the EampM claims is in general positive and statistically significant (Exhibit 16) While we estimate no significant policy impact on charges for our full sample of providers (Model 1) we do find a significant policy effect when we restrict the sample to those providers most likely to change their behavior in response to the PCIP ie the providers that were near eligibility More specifically for the sample of providers who were near the PCIP eligibility threshold in 2009 (ie Model 3) the estimated coefficient of the interaction term in the last column of Exhibit 16 shows that in response to the Medicare PCIP policy on average the allowed charges of primary care providers with a PCIP eligible specialty increased by about $5611 The estimated effect represents about 93 percent of the mean allowed charges ($60235) per provider per year for the providers with PCIP eligible specialties who were near the eligibility threshold in 2009 This estimated effect on the allowed charges in response to a 10 percent Medicare PCIP program suggests an implied elasticity of the allowed charges per provider per year with respect to the payment is about 1 (ie 9310) The effect is smaller if we restrict the sample to all the providers who submitted EampM claims under Medicare in all seven years The mean allowed charges per provider per year for these providers were $51016 Thus due to the Medicare PCIP policy they experienced an additional 56 percent increase ($2839$51016) in allowed charges One caveat surrounding these results is that since the actual Medicare payment may be smaller in magnitude compared to the allowed charges the increase in actual Medicare payments may be lower than our estimated increases in allowed charges
Exhibit 16 Impact of Medicare PCIP Policy on Allowed Charges for PCIP Eligible EampM Claims (2005shy2011)
Dependent Variable Allowed
Charges for PCIP Eligible EampM
Claims per Provider (EampM
Payments)
Analysis Sample
(1)
EampM Charges
(2)
EampM Charges
(Providers in All Years)
(3)
EampM Charges
(Near Eligib 09)
PCIP Elig Specialty Indicator 74741 11382 7518
(10776) (15832) (10475)
Elig Specialty Ind x Post 2009 5944 28393 56109
(1328) (1769) (4206)
Post 2009 8285 12090 24180
(1835) (2327) (2120)
Age 5501 4099 1234
(3093) (4324) (3721)
Male 110676 131571 61031
(6897) (8780) (8071)
Urban shy10435 shy15097 shy19719
(1116) (1389) (1394)
Median Income ($10k) 8678 12737 9787
(6178) (7872) (7147)
Percent in poverty shy2473 shy1804 1343
(1470) (1862) (1750)
Population (10k) shy2646 shy3481 shy0464
(0322) (0416) (0384)
39
Final Report Health Practitioner Bonuses
Dependent Variable Allowed
Charges for PCIP Eligible EampM
Claims per Provider (EampM
Payments)
Analysis Sample
(1)
EampM Charges
(2)
EampM Charges
(Providers in All Years)
(3)
EampM Charges
(Near Eligib 09)
Percent Population over 65 12427 14194 12150
(1764) (2177) (2170)
Unemployment Rate 12175 15928 7567
(2998) (3869) (3632)
Primary Care Phypop10k shy7423 shy7227 shy1433
(0503) (0703) (0952)
PC Nonshyphypop10k shy3412 shy4836 shy1718
(1082) (1629) (1540)
Intercept shy371778 shy337862 shy158347
(12927) (18147) (13208)
Specialty Fixed Effects Yes Yes Yes
Year Fixed Effects Yes Yes Yes
State Fixed Effects Yes Yes Yes
N 2014835 1397760 746845
Adj Rshysq 0222 0246 0367
Note Robust standard errors are in parentheses + significance at 10 percent significance at 5 percent
So far we have found that the PCIP program resulted in increased allowed charges for EampM services per provider despite some decline in the corresponding number of EampM claims We have already discussed that one potential reason for the decline in the average volume of claims could be due the increase in the number of providers under PCIP eligible specialties that can be specifically attributed to the PCIP policy However the question still remains regarding a shift in the composition of services that may have resulted in increased allowed charges or payments despite the decline in the number of claims per provider
In order to gain a deeper understanding of this issue we estimate the impact of the Medicare PCIP policy on each key component of EampM services (Exhibit 17) More specifically we examine the impact of the policy on the volume of claims associated with services for new patients established patients and EampM claims for all other services EampM claims associated with services for established patients account for more than 80 percent of all the EampM claims (and allowed charges) submitted by providers with PCIP eligible specialties45 Furthermore 15 and 25 minute visits account for 40 percent and 30 percent of all EampM claims for established patients respectively Moreover the 25 minute visits account for a slightly higher share of allowed charges ie 38 percent relative to 34 percent for 15 minute visits
In Exhibit 17 we present the estimated impact of the PCIP on the average number of EampM claims per provider for three relevant samples of providers We find that the introduction of the Medicare PCIP policy reduced the average number of EampM claims submitted for both new and established patients The estimated impact suggests that on average the number of EampM claims per provider for 15 minute visits declined by an additional 46 among PCIPshyeligible providers compared to nonshyeligible providers Similarly results using the sample of all providers
45 For the providers near the PCIP eligibility threshold this share of EampM claims is almost 90 percent
40
lsquo
Final Report Health Practitioner Bonuses
suggest that EampM claims per provider for 25 minute visits increased by an additional 13 among PCIPshyeligible providers compared to nonshyeligible providers When we restrict the sample to providers near the PCIP eligibility threshold in 2009 the decline for EampM claims for 15 minutes visits due to PCIP policy is about 57 claims while the EampM claims associated with 25 minute visits increased by about 42 claims due to the PCIP policy
Exhibit 17 Estimated Impact of Medicare PCIP Policy on the Number of PCIP Eligible EampM Claims (2005shy2011)
Estimated coefficient of variable Elig Specialty Ind x Post 2009 from each DID Model
Dependent Variable Analysis Sample
All Providers in All Years Providers Near Eligibility lsquo09
All EampM Claims shy5173 shy3696 shy3259
New Patient Claims shy1354 shy1591 shy1172
Established Patient Claims shy3525 shy2091 shy2224
Other Claims shy2941 shy0150 1369
Claims by Duration (Minutes)
New Patient Visits
10 00673 00850 00551
20 0160 00269 0209+
30 shy5102 shy5894 shy4607
45 shy7697 shy8930 shy6854
60 shy0966 shy1194 shy0528
Established Patient Visits
5 shy3926 shy3621 shy6227
10 1611 1702 shy2487
15 shy4554 shy4716 shy5649
25 1257 2679 4155
40 00347 1382 1417
Note Robust standard errors are in parentheses + significance at 10 percent significance at 5 percent
The above findings raise the question of whether the policyshyinduced net decrease in the number of EampM claims will be reflected in the corresponding allowed charges To answer this question we estimated the potential impact of the PCIP policy on the allowed charges associated with the each component of the EampM claims (Exhibit 18)
The estimated impact of the PCIP policy on allowed charges associated with 15 minute visits for established patients suggests that on average the policy additionally reduced the total allowed charges by about $1577 per provider per year after 2009 However the estimated policy induced reduction in allowed charges is smaller for providers near the PCIP eligibility threshold ie a reduction of about $602
Moreover the PCIP policy additionally increased the total annual allowed charges by about $2740 per provider after 2009 for 25 minute visits for established patients This is a substantial increase considering that providers with PCIP eligible specialties had about $15217 in allowed charges per year for 25 minute visits for established patients The impact is even larger once the sample is restricted to providers near the PCIP eligibility threshold increase in
41
lsquo
Final Report Health Practitioner Bonuses
total annual allowed charges by about $6807 a 28 percent increase Similarly allowed charges associated with all EampM services for all established patients increased substantially by about $6544 or 12 percent for providers near the PCIP eligibility threshold In the case of all providers the estimated increase in total annual allowed charges for established patients was $1245 per provider We find that the PCIP policy resulted in increased Medicare allowed charges across all providers with PCIP eligible specialties This increase in allowed charges is likely to have also resulted in increased payments for these primary care EampM services
Exhibit 18 Estimated Impact of Medicare PCIP on the Allowed Charges for PCIP Eligible EampM Claims (2005shy2011)
Estimated coefficient of the variable Elig Specialty Ind x Post 2009 from each DID Model
Dependent Variable Analysis Sample
All Providers in All Years Providers Near Eligibility lsquo09
All EampM Payments 5944 28393 56109
New Patient Payments shy19109 shy22065 shy16024
Established Patient Payments 12446 39059 65439
Other Payments 7258 11400 6694
Payments by Duration (Minutes)
New Patient Payments
10 0951 1407+ 0706
20 shy1710 shy2891 shy1237+
30 shy5445 shy6203 shy4922
45 shy11845 shy13594 shy10331
60 shy1658 shy1993 shy6551
Established Patient Payments
5 shy7515 shy7066 shy1223
10 shy3412 shy3594+ shy1183
15 shy15772 shy10952 shy6017
25 27404 46709 68070
40 1906 4367 5792
Note Robust standard errors are in parentheses + significance at 10 percent significance at 5 percent
42
Final Report Health Practitioner Bonuses
Analyzing the Impact of Financial Incentives for Primary Care Providers in Shortage Areas
A Background
Access to health care in underserved areas has been an ongoing source of concern among policy makers A 2013 CRS report for the congress (Physician Supply and the ACA by EJ Heisler) indicates that the expansion of health insurance coverage under the ACA is likely to stimulate the demand for primary care in general and also in the underserved areas HRSA designates certain underserved areas as primary care Health Profession Shortage Areas (HPSAs) These areas meet a defined threshold of physicians to population ratio46 HPSA designations are currently limited to primary medical care HPSAs dental HPSAs and mental health HPSAs In this section we focus on only primary care HPSAs All nonshyfederal Doctors of Medicine (MD) and Doctors of Osteopathy (DO) providing direct patient care and who practice principally in one of the four primary care specialties shy general or family practice general internal medicine pediatrics and obstetricsgynecology shy will be counted under the definition of primary care HPSA As previously noted since 1987 Medicare has been paying bonus payments initially five percent to physicians providing care in rural geographic HPSAs In 1991 the bonus payment was increased to 10 percent and eligibility extended to services provided by physicians in urban geographic HPSAs Thus this particular form of bonus payment has been in place for almost 25 years Although the HPSA bonus is available to nonshyprimary care providers such as dentists and mental health care providers for the purpose of this study we focus only on primary care providers eligible for primary care HPSA bonus
Section 413a of the Medicare Modernization Act put in place an additional 5 percent bonus payment for physicians practicing in Physician Scarcity Areas (PSAs)47 PSAs were those counties and rural zip codes in MSAs with the lowest physician to population ratios These areas often coincided with geographic HPSAs so that physicians practicing in those areas received a 15 percent additional bonus payment during 2005shy2008 when the PSA bonuses were in effect
Some key points to note regarding the PSA bonus are the following
Medicare paid the 5 percent PSA bonus on a quarterly basis and the bonus was based on what Medicare actually paid not the Medicareshyapproved payment amount
The same service could be eligible for the PSA bonus and the HPSA bonus
The payment was based on where the service is performed not on the address of the beneficiary
46 Health Professionals Shortage Areas (HPSAs) are based upon criteria set forth under Section 332 of the Public
Health Service Act HPSAs are defined to include 1) urban and rural geographic areas 2) population groups and 3) facilities with shortages of health professionals HPSA designations are currently limited to primary medicalcare HPSAs dental HPSAs and mental health HPSAs in the past similar designations identified shortages in a wide variety of health professions including podiatry pharmacy and veterinary medicine (Salinsky 2010) For primary care HPSAs one of the following two conditions must prevail within the area a) a ratio of population to fullshytimeshyequivalent primary care physician of at least 35001 or b) a ratio of population to fullshytimeshyequivalent primary care physician of less than 35001 but greater than 30001 and an unusually high need for primary care services or insufficient capacity of existing primary care providers
47 The expiration of the PSA bonus in 2008 was likely a result of Medicare expenditures being capped by law In
House Bill HR 6331 of 2008 the cut was equivalent to 106 percent In order to avoid the 106 percent loss PSA designations were allowed to expire which automatically led to the expiration of the PSA bonus Source httpwwwgrahamshycenterorgonlineetcmedialibgrahamdocumentsmedicareshypaymentmaPar0001Filetmpmapdf
43
Final Report Health Practitioner Bonuses
The PSA bonus was paid on services rendered on or after January 1 2005 through June 30 2008
Only the physician designations of General Practice Family Practice Internal Medicine and ObstetricsGynecology were paid the bonus for the ZIP code areas designated as primary care PSAs All other physician provider specialties were eligible for the specialty PSA area bonus for the ZIP codes areas designated as specialty PSAs48 Once again for the purpose of this study we focus only on the primary care physicians with PSA bonus eligible specialties
Our main claimsshylevel data includes a variable that indicates the location of each provider Additionally CMS provides the list of HPSA and PSA areas In this section we review the PSA geographic areas and the extent of overlap with HPSAs Physicians practicing in these overlap areas received a 15 percent additional bonus payment during 2005shy2008 when the PSA bonuses were in effect
In the exhibits below we present the distribution of primary care providers across HPSA and PSA areas Due to limited data we do not present provider counts for HPSA areas prior to 2007 while the PSA bonus was no longer in place after 2008 Moreover we do not use data from 2011 for the DID analysis as it will include the confounding effect of Medicare PCIP49
Although the PSA bonus does not apply to nonshyphysicians we report the number of nonshyphysicians in PSA areas (in italics) for comparison purposes
We consider only those counties that have a full rather than partial primary care HPSA designation In 2011 we identified 1279 full HPSA counties covering 40 percent of the total US population Exhibits 19 amp 20 show the distribution of PCPs and 2011 PCIP recipients across HPSA and PSA areas over the 2005shy2011 period
48 Dentist Podiatrists Optometrists and Chiropractors were not eligible for PSA bonus Source
httpwwwcmsgovMedicareMedicareshyFeeshyforshyServiceshyPaymentHPSAPSAPhysicianBonusesPSAhtml For zip codes that are not in CMS PSA zip code list the bonus payment cannot be made automatically In these cases physicians have to check whether the county where service is provided is included in CMS PSA county list If the county is included in the PSA county list then physicians need to include ldquoARrdquo modifier in their claims to collect PSA bonus
49 If a region switched its HPSA status in 2011 which is also the first year Medicare PCIP was available
econometrically it would be difficult to disentangle the effects of these two changes The indicator variables showing change in HPSA status and availability of PCIP would be perfectly collinear
44
Final Report Health Practitioner Bonuses
Exhibit 19 Distribution of Primary Care (PC) Providers by HPSA and PSA Regions
2005 2006 2007 2008 2009 2010 2011
PC Physicians Total Total Total Total Total Total Total
All Providers 13835 6
100 14777 1
100 16515 0
100 17301 8
100 17878 4
100 18507 0
100 19193 0
100
in HPSA x x x x 72804 441 77656 449 79620 445 82101 444 81855 426
in PSA 14446 104 15336 104 17026 103 17323 10 NA NA NA NA NA NA
Both in HPSA amp PSA x x x x 6267 38 6461 37 NA NA NA NA NA NA
PCIP 2011 Recipients 93886 100 99359 100 10896 6
100 11505 0
100 12114 0
100 11749 0
100 11400 2
100
in HPSA x x x x 46578 427 50451 439 52871 436 50762 432 47458 416
in PSA 9771 104 10282 103 11290 104 11605 101 NA NA NA NA NA NA
Both in PSA amp HPSA x x x x 3927 36 4143 36 NA NA NA NA NA NA
PC NonshyPhysicians
All Providers 46634 100 53823 100 68297 100 80041 100 88569 100 97789 100 10935 3
100
in HPSA x x x x 28248 414 33148 414 36700 414 40411 413 43902 401
in PSA 5221 112 5894 11 7379 108 8301 104 NA NA NA NA NA NA
Both in HPSA amp PSA x x x x 2919 43 3270 41 NA NA NA NA NA NA
PCIP 2011 Recipients 18681 100 21456 100 27188 100 34363 100 41202 100 37756 100 35380 100
in HPSA x x x x 11310 416 14279 416 17150 416 15614 414 14256 403
in PSA 2328 125 2603 121 3214 118 3802 111 NA NA NA NA NA NA
Both in PSA amp HPSA x x x x 1273 47 1527 44 NA NA NA NA NA NA
Note HPSA includes only full HPSA areas (data from Area Resource File and HPSA status data are not available prior to 2007) PSA status after 2008 is not applicable as 2008 was the final year of the PSA bonus
45
Final Report Health Practitioner Bonuses
Around 40 percent of all primary care providers supplied services in primary care HPSA counties while roughly 10 percent did so in PSA counties The extent of overlap between these two designations amounts to approximately 3 to 4 percent of providers working in dualshydesignation areas We do not observe important differences in these distributions between all providers and PCIP recipients The same general observations apply to the two most represented specialties ie family practice and internal medicine (Exhibit 20)
Exhibit 20 Distribution of the Number of Internal Medicine and Family Practice Physicians by HPSA and PSA regions
Practice Area 2005 2006 2007 2008 2009 2010 2011
Internal Medicine
All Physicians 69391 74411 83117 87090 90291 93904 97526
in HPSA x x 38011 40382 41411 43461 43188
in PSA 5428 5770 6390 6521 NA NA NA
in HPSA amp PSA x x 2304 2372 NA NA NA
PCIP 2011 Recipients 43188 45502 49451 51813 54062 52576 51007
in HPSA x x 22166 23824 24682 24113 22537
in PSA 3423 3585 3915 4009 NA NA NA
in PSA amp HPSA x x 1303 1386 NA NA NA
Family Practice
All Physicians 61438 65205 72247 75132 77536 79891 82298
in HPSA x x 29652 31700 32602 32954 32834
in PSA 8673 9168 10181 10361 NA NA NA
in HPSA amp PSA x x 3776 3921 NA NA NA
PCIP 2011 Recipients 48448 51377 56622 59902 63227 61584 59931
in HPSA x x 22979 24971 26284 24998 23450
in PSA 6220 6546 7199 7417 NA NA NA
in PSA amp HPSA x x 2561 2695 NA NA NA
Note HPSA includes only full primary care HPSA areas (data from Area Resource File and HPSA status data are not available prior to 2007) PSA status after 2008 is not applicable as 2008 was the final year of the PSA bonus
In the case of nonshyphysicians in 2008 around 40 percent were practicing in primary care HPSA areas (Exhibit B8 in Appendix B) Nurse practitioners and physician assistants alike were distributed almost equally between shortage and nonshyshortage areas in 2008 The same is true whether we look across all providers or only 2011 PCIP recipients
B Impact of the PSA Bonus on Primary Care Supply
Since the PSA bonus was in effect from 2005 to 2008 we applied a DID estimation method to identify the effect of elimination of PSA bonus on the following outcome variables number of eligible providers practitionersrsquo volume of services and their total payments We used the provider level data on the number of EampM claims and allowed charges associated with those claims from 2005 to 2011 The data from 2005 to June 2008 show the scenarios in the preshyelimination (of PSA bonus) period and the data from 2009 to 2010 provide outlook on the postshyelimination period Data from 2011 will not be used for the DID analysis as it will include the confounding effect of the Medicare PCIP bonus The sample is restricted to physicians with the
46
τ
Final Report Health Practitioner Bonuses
following PSA bonus eligible primary care specialties family practice internal medicine and OBshyGYN
Equation (1) below shows the econometric model we estimated to assess the impact of PSA bonus policy
lowast = + lowast + + lowast lowast + lowast + + (1)
The model in equation (I) is specified based on the provider level data in each year Here the dependent variable Sit is the volume of primary care (EampM) services provided by primary or nonshyprimary care practitioner i at time t Ti is an indicator for the treatment group that takes a value of 1 if the provider is in a primary care PSA area and zero otherwise PREt is an indicator variable taking the value of 1 if the services are provided during 2005shy2008 period (when PSA bonus program was in effect) and zero otherwise the vector Xit includes variables reflecting the provider characteristics features of their geographic locations etc and is a timeshyspecific fixed effect term The term εit represents random unobserved factors affecting services
If elimination of the PSA bonus was associated with a reduction in the volume of primary care EampM services provided by practitioners in those areas then we should expect the estimated value of 8 to be positive A positive estimated value of 8 would imply higher volume of services during the period when the PSA bonus was in effect In addition the interpretation of the first four terms in equation (I) is as follows
(α + β + θ + δ) = the average number of EampM claims during the PSA period (PRE) for providers located in the PSA regions
(α + β) = the average number of EampM claims during the PostshyPSA period for providers located in the PSA regions
(θ + δ) = the difference in the average number of EampM claims between the PSA and PostshyPSA period for providers located in the PSA regions
θ = the difference in the average number of EampM claims between the PSA and PostshyPSA period for providers regardless of location
Exhibit 21 shows the results from the estimated DID model to identify the impact of the PSA bonus policy on the supply of primary care services We found that on average providers with PSA bonus eligible specialties irrespective of location were estimated to have about 153 more claims submitted during the PSA period compared to the postshyPSA period However bonusshyeligible providers located in PSA areas had on average an additional 50 claims per year compared to those located in nonshyPSA areas We attribute this additional increase in the volume of primary care EampM services to the PSA bonus policy On the other hand we do not find a statistically significant impact of the PSA bonus policy on the total annual allowed charges per physician (column 2)
47
Final Report Health Practitioner Bonuses
Exhibit 21 Impact of PSA Bonus on the Number of EampM Claims under Medicare 2005shy2010
Number of EampM Claims(1) Allowed Charges for
EampM Claims ($)(2)
Location PSA PC Indicator (PSAPC) 7055 56220
(6177) (4154)
PSA Year Indicator (2005shy2008) 1526 8709
(4405) (2964)
PSAPC PSA Year Ind 4984 shy2412
(7276) (4765)
Age 1376 8845
(00757) (5104)
Male 2069 134952
(1453) (1026)
Urban shy3192 shy4230
(2892) (1849)
Median Income ($10k) shy1047 9267
(1430) (9766)
Percent under poverty shy6671 shy3527
(0359) (2332)
shy0144 shy4476
(000680) (0483)
Percent Population over 65 1936 13894
(0424) (2815)
Unemployment Rate 1574 13370
(0720) (4964)
Primary Care Phymcarepop10k shy0110 shy2049
(00139) (0939)
PC Nonshyphymcarepop10k shy0977 shy7510
(00390) (2675)
Intercept shy6872 shy560014
(1898) (12556)
Specialty Fixed Effects Yes Yes
Year Fixed Effects Yes Yes
State Fixed Effects Yes Yes
N 1006453 1006453
Adj Rshysq 0182 0175
Note Robust standard errors are in parentheses + significance at 10 percent significance at 5 percent The sample is restricted to only providers with the following PSA eligible specialty family practice internal medicine and OBshyGYN
Exhibit 22 shows the results from the estimated DID model to identify the impact of the PSA bonus policy on the number of primary care providers at the zip code level As explained above our primary focus is the estimated coefficient of the interaction term between the PSA status indicator of the location of physicians and the PSA period (ie 2005shy2008) The number
48
Population (10k)
Final Report Health Practitioner Bonuses
of providers with PSA bonus eligible specialties is estimated to increase by about one in PSA areas during the PSA period compared to the number of providers in nonshyPSA areas This represents a meaningful increase given that on average there are about six primary care providers in PSA areas We attribute this additional increase in the number of primary care providers to the PSA bonus policy
Exhibit 22 Impact of PSA Bonus on the Number of Primary Care Providers per County (2005shy2010)
Number of Providers with PSA
Bonus Eligible Specialty
Location PSA PC Indicator (PSAPC) shy4951
(0371)
PSA Year Indicator (2005shy2008) shy1722
(0439)
PSAPC PSA Year Ind 1149
(0301)
Urban 5950
(0221)
Median Income ($10k) 0468
(0150)
Percent in poverty 0256
(0040)
Population (10k) 0007
(0001)
Percent Population over 65 0139
(0033)
Unemployment Rate shy0037
(0057)
Primary Care Phymcarepop10k 0146
(0024)
PC Nonshyphymcarepop10k 0037
(0017)
Intercept shy5250
(1522)
Year Fixed Effects Yes
State Fixed Effects Yes
N 78519
Rshysq 00856
Note Robust standard errors are in parentheses + significance at 10 percent significance at 5 percent The sample is restricted to only providers with the following PSA eligible specialty family practice internal medicine and OBshyGYN
C Impact of the HPSA Bonus on Primary Care Supply
Access to health care in shortage areas has been an ongoing source of concern among policy makers Expansion of health insurance coverage through the implementation of the ACA is
49
Final Report Health Practitioner Bonuses
likely to stimulate the demand for primary care in general and specifically in these shortage areas HRSA designates these shortage areas as primary care Health Profession Shortage Areas (HPSAs) using a defined threshold of primary care physicians to population ratio The HPSA bonus has been in place since 1987 and since 1991 the bonus payment remained at 10 percent of the fees associated with the bonus eligible Medicare claims50
In the absence of any variation in the HPSA bonus percentage in the recent past we rely on the change in the primary care HPSA status of different counties in the US over the period between 2007 and 2010 In other words we rely on the variation in HPSA status over time and across counties to identify the effect of the policy We detail the econometric model and exact interpretation of estimated coefficients in Appendix C2 Our analysis of the Area Resource File indicates that 205 US counties gained primary care HPSA status during 2007shy2011 while 257 counties lost their HPSA status51 Subsequently we analyze the changes in the outcomes of interest among primary care providers over time due to changes in the countyrsquos HPSA status during this period It is important to note that although HPSA bonus applies to physicians generally in this section we only focus on primary care physicians with primary care HPSA bonus eligible specialties described earlier The primary outcome variables that we analyzed to identify the changes in physiciansrsquo practice behavior are the volume of primary care services and total Medicare allowed charges associated with those services as captured in Medicare claims data In this framework we have assumed that the HPSA status of an area is exogenous to an individual providerrsquos decision to serve a certain number of patients or provide a given volume of services or any other individualshylevel outcomes However the HPSA status of an area may not be exogenous in models where the outcome of interest is the number of providers relative to the size of population in a given geographic area at the aggregate level This is specifically due to the fact that the HPSA status is designated based on the physicianshy toshypopulation ratio in the area as a whole
The coefficient of the interaction term between the county primary care HPSA status indicator (HPSAPC) and the indicator of whether the county ever gained the HPSA status shows the additional impact of HPSA status on the average number of claims per physician in column 1 (or payments in column 2) in the counties that ever gained the HPSA status (full model specification detailed in Appendix C2) As shown in Exhibit 23 we found that on average Medicare physicians with primary care specialties who are located in counties that ever gained the HPSA status tend to have about 17 more EampM claims submitted annually specifically due to the gain of full HPSA status The effect is statistically significant at 10 percent significance level On the other hand the loss of HPSA status does not seem to have any statistically significant impact on the number of EampM claims
50 Physicians who furnish services to Medicare beneficiaries in areas designated as primary care geographic HPSAs by HRSA as of December 31 of the prior year are eligible for the Medicare HPSA bonus during the current year Since 2005 the HPSA physician bonus payment has been automatically made to physicians who furnish services to Medicare beneficiaries in a ZIP code on the list of ZIP codes eligible for automatic HPSA bonus payment This list is updated annually and is effective for services furnished on and after January 1 of each calendar year Physicians who furnish services to Medicare beneficiaries in a geographic HPSA that is not on the list of ZIP codes eligible for automatic payment must use the AQ modifier ldquoPhysician providing a service in an unlisted Health Professional Shortage Area (HPSA)rdquo on the claim to receive the bonus payment Services that are submitted with the AQ modifier are subject to validation by Medicare The bonus is paid quarterly and is based on the amount paid for professional services
51 Area Resource File (ARF) or Area Health Resource File is an extensive county level database assembled annually
by Health Resources and Services Administration (HRSA) from over 50 sources Source httparfhrsagov
50
Final Report Health Practitioner Bonuses
Exhibit 23 Impact of HPSA Bonus on the Number of EampM Claims and Allowed Charges per Physician under Medicare 2007shy2010
Number of EampM Claims
per Physician(1)
Allowed Charges for
EampM Claims per
Physician ($)(2)
County HPSA PC Indicator (HPSAPC) shy4386 shy30245
(2500) (1721)
Ever Gained HPSA Status Indicator (ToHPSA) shy3991 shy25934
(6900) (4593)
Ever Lost HPSA Status Indicator (ToNonHPSA) shy6122 shy51496
(6772) (4673)
HPSAPCToHPSA 1741+ 4070
(9500) (6491)
HPSAPCToNonHPSA 1137 13804
(8005) (5506)
Age 1268 8544
(00845) (5927)
Male 1927 131368
(1645) (1208)
Urban shy4187 shy6167
(3324) (2220)
Median Income ($10k) shy6798 10347
(1636) (1162)
Percent under poverty shy5469 shy3003
(0416) (2838)
Population (10k) shy0116 shy3253
(000808) (0591)
Percent Population over 65 2129 15447
(0481) (3361)
Unemployment Rate 2043 16501
(0803) (5655)
Primary Care Phymcarepop10k shy000218 4187
(00126) (0881)
PC Nonshyphymcarepop10k shy0951 shy6878
(00362) (2535)
Intercept shy5943 shy578914
(2007) (13846)
Specialty Fixed Effects Yes Yes
Year Fixed Effects Yes Yes
State Fixed Effects Yes Yes
N 743907 743907
Adj Rshysq 0188 0184
Note Robust standard errors are in parentheses + significance at 10 percent significance at 5 percent The sample is restricted to only providers with HPSA eligible specialty family practice internal medicine pediatrics and OBshyGYN
51
Final Report Health Practitioner Bonuses
Next we focus on the impact of primary care HPSA status on the Medicare allowed charges per physicians associated with EampM claims (Exhibit 23 column 2) Column 2 indicates that Medicare primary care physicians who are located in counties that ever gained HPSA status do not experience significant changes in annual allowed charges per physician for EampM claims specifically due to the gain of full HPSA status However Medicare physicians with primary care who are located in counties that ever lost HPSA status tend to have about $1380 more allowed charges annually when the location has the full HPSA status This effect is statistically significant at 5 percent significance level
For our analysis of the impact of HPSA status on the volume of services in terms of EampM claims we focused only on the behavior of primary care physicians We found that on average Medicare primary care physicians tend to submit about 17 more EampM claims annually specifically due to the gain of full HPSA status This may suggest that HPSA bonus may encourage primary care providers to increase access to primary care services In addition based on our analysis of allowed charges for EampM Services we find that the Medicare primary care physicians who are located in counties that ever lost primary care HPSA status tend to have about $1380 more allowed charges annually before the location lost full HPSA status Thus gaining HPSA status is also associated with gain in additional earnings for primary care physicians Hence our analysis finds supportive evidence that HPSA bonus may improve access to primary care services in shortage areas
Finally when the outcome of interest is the PCP to population ratio at the county level relying on the change in primary care HPSA status as the primary source of variation to identify an effect of HPSA status poses additional estimation challenges The phenomena that cause decision makers to change the status may be highly correlated with our outcome of interest In this sense the HPSA status would be an endogenous variable in the regression model where the outcome of interest is the number of primary care providers per county Specifically this endogeneity problem may bias the effect of HPSA status on the number of primary care physicians toward zero One potential way to circumvent the issue of endogeneity of the HPSA status above would be to use the instrumental variable (IV) approach The IV approach relies on the identification of variables ie instruments that would be correlated with HPSA status and that would affect the providershytoshypopulation ratio only through the HPSA status variable These IVs will then be used in the regression framework to tease out the unbiased effect of the HPSA status on the providershytoshypopulation ratio However IVs are not always readily available In future upon availability of appropriate IVs a more inshydepth study can be carried out to resolve the problem of this endogeneity to estimate the unbiased effect of HPSA status on the providershytoshypopulation ratio52
52 Despite the issue of endogeneity of HPSA status we analyze the changes in the number of Medicare primary care
physicians per 10 thousand Medicare populations and the changes in the absolute number of Medicare primary care physicians over time due to changes in the countyrsquos HPSA status during the period of 2007shy2011 using the same DID framework laid out earlier The results from these estimated models are available upon request
52
Final Report Health Practitioner Bonuses
Modeling the Impact of the Increase in Medicaid Reimbursement Rate Relative to the Medicare Rate
A Study Design Overview
The availability of primary care is particularly important for public payer programs such as Medicaid and Medicare Historically Medicaid has been the less generous payer for primary care services relative to Medicare paying just 66 percent of Medicare rates on average53 In this section we first describe the variation in Medicaid reimbursement rates relative to those for Medicare both for primary care and for all services across US states during the period 2008shy2012 and second simulate the effect of a 10 percent increase in the MedicaidshytoshyMedicare fee index on the proportion of US officeshybased physicians accepting new Medicaid patients across all states
Cunningham et al (2011) report that fewer physicians accept new Medicaid patients in response to the low Medicaid reimbursement rates in several states Decker (2012) used data on officeshybased physicians from the 2011 National Ambulatory Medical Care Survey Electronic Medical Records Supplement to summarize the percentage of physicians currently accepting any new patients She finds that 694 percent of physicians in the sample accepted new patients with Medicaid This was lower than the percentage accepting new selfshypay (917 percent) Medicare (830 percent) or privately insured patients (817 percent) Logit regression model estimates showed that raising Medicaid fees to Medicare levels for all physicians a 258 percentageshypoint (35 percent) increase in the current average ratio of 742 would increase the acceptance rate of new Medicaid patients by 86 percentage points (12 percent) shy from an average of 694 percent across physicians to an average of 786 percent
Zuckerman et al (2009) reported that in 2008 stateshylevel average primary care physician fees under Medicaid ranged from 57 percent of the national average Medicaid fees in Rhode Island to 226 percent of national average in Alaska They also found that after strong Medicaid fee growth during 1998shy2003 Medicaid fees fell relative to inflation during 2003shy2008 Despite the slowdown in overall fee growth Medicaid fees for primary care services kept pace with inflation The ACA increases Medicaid reimbursement rates for certain services provided by primary care physicians to 100 percent of Medicare rates in 2013 and 2014 Given the variability of Medicaid payments across states this could be a substantial boost in payments for physicians in some states and less so in others
Zuckerman et al (2009 2012) provided stateshylevel MedicaidshytoshyMedicare fee indices for 2008 and 2012 These studies show that the national average Medicaid reimbursement rate for primary care services declined from 66 percent of the Medicare rate in 2008 to 59 percent in 2012 (about 106 percent decline) However the national average MedicaidshytoshyMedicare fee index for all services declined by about 83 percent (from 72 percent in 2008 to 66 percent in 2012) during the same period
Exhibit 24 reveals wide stateshytoshystate variation in the Medicaid fee relative to the Medicare rate in both 2008 and 2012 In several states including California Florida Michigan New York and Rhode Island the Medicaid primary care fee in 2012 was less than 50 percent of the Medicare rate In several other states including Alaska Delaware Montana North Dakota Oklahoma and Wyoming the Medicaid primary care fee was above 90 percent of the Medicare rate in the same year
53 Small DM and T McGinnis (2012) ldquoLeveraging the Medicaid Primary Care Rate Increase The Role of
Performance Measurementrdquo Center for Health Care Strategies Inc
53
Final Report Health Practitioner Bonuses
There is substantial variation in the percentage change in the MedicaidshytoshyMedicare fee index across these states too During 2008shy2012 most of the states except Maine Mississippi New Jersey New York North Dakota and DC experienced a decline in the MedicaidshytoshyMedicare fee index for all services and for primary care services Another exception is Minnesota where the MedicaidshytoshyMedicare fee index for all services declined by 66 percent during the same period but the index for primary care services increased by about 259 percent In Arizona Georgia Louisiana Michigan Nevada Virginia and Wyoming the decline in MedicaidshytoshyMedicare fee index for primary care is more than 15 percent
Decker (2012) and Cunningham (2011) exploit the stateshylevel variation in the Medicaid reimbursement rates and they examine the impact of an increase in Medicaid fee relative to Medicare on physiciansrsquo propensity to accept Medicaid patients
Cunningham (2011) uses 2008 Health Tracking Physician Survey on 1748 primary care physicians (PCPs) The empirical analysis includes the estimation of a linear probability regression model of whether a PCP is accepting new Medicaid patients using the stateshylevel Medicaid reimbursement rate relative to Medicare rate as one of the independent variables The key findings of this study can be summarized as follows
Average MedicaidshytoshyMedicare fee ratio for primary care in 2008 was 662 percent
On average PCPs accepting all or new Medicaid patients in the US in 2008 was 415 percent
One percentage point increase in MedicaidshytoshyMedicare fee ratio increases theshyproportion of PCPs accepting Medicaid patients by 0214shy
Thus based on the findings in Cunningham (2011) the implied elasticity of accepting primary care patients with respect to the MedicaidshytoshyMedicare fee is about 03454 In other words a 10 percent increase in the Medicaid fee relative to Medicare across all states would imply an increase in the acceptance rate of Medicaid patients from 415 percent to 429 percent nationally The estimated elasticity also suggests that under MedicaidshyMedicare payment parity the national average acceptance rate would go up from 415 percent to 487 percent55
The analytical findings presented here can be improved further if the data on proportion of physicians accepting new Medicaid patients in 2012 are available for each state Similarly availability of the stateshylevel MedicaidshytoshyMedicare fee index in 2011 can also refine the simulation results
54 The implied elasticity is calculated by The Lewin Group and it is based on the following statistics reported in the
study the national average MedicaidshytoshyMedicare fee ratio in 2008 (662 percent) the national average of PCPs accepting all or new Medicaid patients (415 percent) in 2008 and the estimated coefficient of MedicaidshytoshyMedicare fee ratio (0214) The estimated coefficient of 0214 implies that if the MedicaidshytoshyMedicare fee ratio increases by 1 percent from the national average (ie from 662 to 6686) then national average proportion of PCPs accepting Medicaid patients goes up by 0214(6686shy662) asymp 014 This is about 034 percent (100014415) increase in the proportion of PCPs accepting Medicaid patients Therefore the implied elasticity = ( percent change in proportion of PCPs accepting Medicaid patients) ( percent change in MedicareshytoshyMedicare fee ratio) = 0341 = 034
55 Lewinrsquos calculation of the new acceptance rate under MedicaidshyMedicare payment parity = [034(100shy
662)662+1]415 asymp 487
54
shy shy
shy shy
shy shy
shy
Final Report Health Practitioner Bonuses
Exhibit 24 MedicaidshytoshyMedicare Fee Index
States Medicare Fee Index Medicare Fee Index
Medicare Fee Index 2008
2012
All Services Primary care
All Services Primary care
All Services Primary care
US 072 066 066 059 shy83 shy106
AL 089 078 078 070 shy124 shy103
AK 140 140 124 127 shy114 shy93
AZ 106 097 082 075 shy226 shy227
AR 089 078 079 070 shy112 shy103
CA 056 047 051 043 shy89 shy85
CO 086 087 071 074 shy174 shy149
CT 099 078 087 071 shy121 shy90
DE 100 100 097 098 shy30 shy20
DC 058 047 080 080 379 702
FL 063 055 057 049 shy95 shy109
GA 090 086 075 070 shy167 shy186
HI 073 064 062 057 shy151 shy109
ID 103 103 088 089 shy146 shy136
IL 063 057 062 054 shy16 shy53
IN 069 061 062 055 shy101 shy98
IA 096 089 082 077 shy146 shy135
KS 093 094 078 082 shy161 shy128
KY 086 080 077 072 shy105 shy100
LA 092 090 075 075 shy185 shy167
ME 063 053 065 063 32 189
MD 087 082 073 070 shy161 shy146
MA 088 078 077 068 shy125 shy128
MI 063 059 051 046 shy190 shy220
MN 076 058 071 073 shy66 259
MS 087 084 090 090 34 71
MO 072 065 059 057 shy181 shy123
MT 103 096 097 094 shy58 shy21
NE 101 082 087 076 shy139 shy73
NV 104 093 074 068 shy288 shy269
NH 073 067 058 060 shy205 shy104
NJ 037 041 045 050 216 220
NM 107 098 092 085 shy140 shy133
NY 043 036 055 042 279 167
NC 095 095 082 085 shy137 shy105
ND 102 101 134 135 314 337
OH 069 066 061 059 shy116 shy106
OK 100 100 097 097 shy30 shy30
55
2008 Medicaid-to- 2012 Medicaid-to- Change in Medicaid-to-
-
shy shy
shy shy
shy shy
shy
Final Report Health Practitioner Bonuses
States Medicare Fee Index Medicare Fee Index
Medicare Fee Index 2008
2012
All Services Primary care
All Services Primary care
All Services Primary care
OR 090 078 081 072 shy100 shy77
PA 073 062 070 056 shy41 shy97
RI 042 036 037 033 shy119 shy83
SC 093 086 081 074 shy129 shy140
SD 095 085 076 069 shy200 shy188
TX 074 068 065 061 shy122 shy103
UT 082 076 074 074 shy98 shy26
VT 095 091 080 081 shy158 shy110
VA 090 088 080 074 shy111 shy159
WA 093 092 076 066 shy183 shy283
WV 085 077 080 074 shy59 shy39
WI 085 067 077 060 shy94 shy104
WY 143 117 116 096 shy189 shy179
Source Zuckerman et al (2009 and 2012) data on Tennessee were not available
Decker (2012) used data from the 2011 National Ambulatory Medical Care Survey Electronic Medical Records Supplement of 3979 officeshybased physicians (PCPs and nonshyPCPs) The studyrsquos empirical analysis included estimation of a logit regression model of whether an officeshybased physician is accepting new Medicaid patients A key variable in this analysis was the stateshylevel MedicaidshytoshyMedicare fee index of 200856 The key findings of this analysis were
Average MedicaidshytoshyMedicare fee ratio for all services (2008) was 72 percent
The average officeshybased physician new Medicaid patient acceptance rate for 2011 was 694 percent
Among PCPs the acceptance rate was 662 percent among nonshyPCPs the acceptance rate was 717 percent
Based on the logit parameter estimates she finds that an increase in the fee ratio from 742 to 100 would be expected to increase acceptance of new Medicaid patients from 694 percent to 786 percent
In other words a 10 percent increase in MedicaidshytoshyMedicare fee index for all services across all states would suggest a rise in the acceptance rate from 694 percent to 723 percent nationally57 Thus the implied elasticity of officeshybased physicians accepting new Medicaid patients with respect to the MedicaidshytoshyMedicare fee is about 04358 The study also finds that
56 One of the key limitations of the study is that the MedicaidshytoshyMedicare fee index is not available for year 2011
There may be substantial difference in stateshywide variation in these indices between 2008 and 2011 period In that case 2008 indices may not explain well the variation in the proportion of physicians accepting Medicaid patients
57 Lewinrsquos method of calculating the predicted proportion of accepting new Medicaid patients based on the estimated
logit model is explained in Appendix D 58
Lewinrsquos method of calculating the predicted proportion of accepting new Medicaid patients based on the estimated logit model is explained in Appendix D Using that method a 1 percent change in the 2008 national average
56
2008 Medicaid-to- 2012 Medicaid-to- Change in Medicaid-to-
-
shy shy
shy
shy shy
shy
Final Report Health Practitioner Bonuses
holding other things constant primary care officeshybased physicians are about 73 percentage point less likely to accept new Medicaid patients Decker also estimated the impact on the primary care physicians only and she found that the estimated impact is similar to the one reported above for all physicians More specifically she found that an increase in the MedicaidshytoshyMedicare fee ratio for primary care to 100 was predicted to increase acceptance of new Medicaid patients among primary care physicians from 647 percent to 717 percent
B Simulation Exercise
We simulated the effect of a 10 percent increase in the stateshylevel MedicaidshytoshyMedicare fee indices (for all services) from their 2008 level on the proportion of US officeshybased physicians accepting new Medicaid patients in each state59 A detailed description of the simulation methodology used to predict the proportion of officeshybased physicians accepting Medicaid patients is presented in Appendix D The simulation exercise is based on the empirical findings of Decker (2012) and the data on the proportion of US officeshybased physicians accepting new Medicaid patients for each state reported in the same study
Exhibit 25 summarizes the predicted proportion of US officeshybased physicians accepting new Medicaid patients by state For example in California the MedicaidshytoshyMedicare fee ratio in 2008 was substantially lower than the national average Subsequently only 571 percent of the officeshybased physicians in California were accepting new Medicaid patients Based on the simulation we find that a 10 percent increase in the MedicaidshytoshyMedicare fee index in California (from 056 to 062) would increase the proportion of officeshybased physicians accepting new Medicaid patients in California from 571 percent to 597 percent (about 46 percent increase)
Exhibit 25 Proportion of US Officeshybased Physicians Accepting New Medicaid Patients
States Medicare Fee Index
All Services 2008
physicians accepting
new Medicaid patients
2011
Predicted acceptance rate under
Fee Index (Based on Decker 2012)
(Non -Linear Projection)
US 072 694 722
AL 089 685 720
AK 140 821 857
AZ 106 785 817
AR 089 907 920
CA 056 571 597
CO 086 661 696
CT 099 607 650
DE 100 783 813
DC 058 752 772
MedicaidshytoshyMedicare fee index reported in the study (from 742 percent to 7492 percent) increases the proportion of officeshybased physicians accepting new Medicaid patients from 694 percent to 697 percent Therefore the implied elasticity = ( percent change in proportion of PCPs accepting Medicaid patients) ( percent change in MedicareshytoshyMedicare fee ratio) = ((697shy694)694)1 = 043
59 At this point stateshylevel MedicaidshytoshyMedicare fee index are not available for 2011 and the proportion of physicians
accepting new Medicaid patients are not readily available to Lewin by state in any year other than 2011 In future Lewin Group will explore the availability of such data to strengthen the analysis
57
Medicaid-to- of US office-based
10 rise in Medicaid-to-Medicare
shy
shy shy
shy
Final Report Health Practitioner Bonuses
States
Medicaid-to-
Medicare Fee Index
All Services 2008
of US office based
physicians accepting
new Medicaid patients
2011
Predicted acceptance rate under
10 rise in Medicaid-to-Medicare
Fee Index (Based on Decker 2012)
(Non Linear Projection)
FL 063 591 619
GA 090 674 710
HI 073 699 727
ID 103 847 870
IL 063 649 676
IN 069 706 732
IA 096 876 894
KS 093 682 719
KY 086 794 819
LA 092 621 661
ME 063 740 762
MD 087 659 695
MA 088 806 831
MI 063 811 829
MN 076 963 968
MS 087 796 821
MO 072 676 705
MT 103 899 915
NE 101 870 890
NV 104 752 787
NH 073 817 837
NJ 037 404 421
NM 107 863 885
NY 043 616 635
NC 095 764 795
ND 102 946 955
OH 069 720 745
OK 100 673 713
OR 090 795 821
PA 073 680 709
RI 042 689 706
SC 093 841 863
SD 095 941 950
TN 614
TX 074 699 727
UT 082 835 855
58
-
-
shy shy
shy
shy shy
shy
Final Report Health Practitioner Bonuses
States
Medicaid to
Medicare Fee Index
All Services 2008
of US office based
physicians accepting
new Medicaid patients
2011
Predicted acceptance rate under
10 rise in Medicaid to Medicare
Fee Index (Based on Decker 2012)
(Non Linear Projection)
VT 095 784 813
VA 090 760 790
WA 093 764 794
WV 085 809 833
WI 085 930 940
WY 143 993 995
Note The predicted proportions are based on the estimated logit model in Decker (2012)
Next we analyzed the implication of our findings from the Medicare PCIP policy analysis in the context of the MedicaidshyMedicare payment parity We have already discussed that based on our analysis the number of Medicare primary care providers accepting new Medicare patients increased by almost 10 percent in response to the Medicare 10 percent PCIP policy (Exhibit 14) According to Zuckerman et al (2012) the US average MedicaidshytoshyMedicare fee ratio for primary care services in 2012 was about 059 Thus MedicaidshyMedicare payment parity would imply almost a 70 percent increase in Medicaid fees over the 2012 US average Further the findings by Decker (2012) suggest that in 2011 almost 662 percent officeshybased primary care physicians accepted new Medicaid patients
Given the magnitude of the impact of the Medicare PCIP policy if the MedicaidshyMedicare payment parity policy at least triggers a 10 percent increase in MedicaidshytoshyMedicare fee ratio then we would expect the US average of officeshybased primary care physicians accepting new Medicaid patients to go up to at least 728 percent However considering the 2012 US average MedicaidshyMedicare payment parity would imply a much bigger percentage increase in payments than 10 percent payment increase under the Medicare PCIP policy It is challenging to use the estimated impact of PCIP program to extrapolate the impact of MedicaidshytoshyMedicare parity This is because (1) in general parity would require a much bigger change in MedicaidshytoshyMedicare fee ratio (compared to the 10 percent PCIP payment) and (2) our PCIP analysis is limited in the sense that it is not capturing continuous variation in the incentive payment due to the nature of the program Finally the actual increase in the absolute value of payment under the Medicare and Medicaid payment policies would depend on the volume of primary care services and the current state MedicaidshyMedicare fee index
Conclusions The Affordable Care Act includes two key provisions regarding reimbursement to primary care providers (a) it provides a 10 percent supplemental payment under the Medicare PCIP program to eligible providers (effective January 1 2011) and (b) it raises the Medicaid primary care reimbursement rate at least up to 100 percent of the Medicare rate ASPE has contracted with the Lewin Group to examine the role of Medicare PCIP and supplemental payment programs including the HPSA and PSA incentives in increasing the supply of primary care providers (PCP) and the access of patients to their services
We reviewed the health and labor economics literature to understand the nature and the size of the impact of any financial incentives on the labor supply behavior of PCPs and the resultant impact on the availability of primary care services estimated in the existing body of research
59
-- -
--
-
Final Report Health Practitioner Bonuses
We documented the prior empirical evidence of the impact of financial incentives on raising the supply of primary care workforce the volume of services impact on medical graduatesrsquo propensity to participate in primary care PCPsrsquo retirement decision etc This review also evaluated the past evidence on the effect of bonuses in shortage areas and their effectiveness to redistribute and retain primary care workforce Finally the review of the literature also focused on the stateshyspecific experiences with changes in their respective Medicaid payment rates for primary care and the resultant impact on the supply of PCPs their rate of acceptance of Medicaid patients and the volume of primary care services such as office visits or visits for EampM services
To explore these topics we constructed a provider level data set including all the claims submitted by the entire universe of Medicare providers in each year from 2005 to 2011 We linked Provider360 data (available from Lewin Grouprsquos parent company Optum Inc) and the AMA Physician Master File to add provider characteristics such as demographics (eg age gender) provider designation medical school and practice location We also added geographic location specific variables from the Area Resource File (ARF) based on the practice location information of providers
We find that as a result of the Medicare incentive payment the number of Medicare primary care providers has increased on average annually by about 28 providers per county from 2009 to 2011 The number of primary care physicians with PCIP eligible specialty increased by about 10 percent in response to the 10 percent incentive payment under the PCIP policy (ie elasticity of the number of primary care physicians with respect to the incentive payment is about 1) Eligible claims for some types of PCIP eligible EampM services and associated allowed charges have also increased For example on average there was a 7 percent increase in the number of 25 minute office visits claims due to the PCIP policy On the other hand in response to the PCIP policy there was a 93 percent increase in the average allowed charges (for the eligible services) among primary care provider with PCIP eligible specialties Our results regarding the PCIP impact should be interpreted with caution due to several reasons First we only observe one year after the PCIP was in effect and as data becomes available for the full 2011shy2015 period the magnitude and precision of our estimates may change Second given the limited timeframe of this incentive providers may not be willing to make longshylasting adjustments in their decision to supply primary care services Finally as Medicare providers become more familiar PCIP users in time and adjust their behavior the full impact of the incentive on provider behavior may change
In addition we find that Medicare providers were attracted to PSA areas through the PSA bonus and submitted 78 percent more EampM claims annually during the PSA period Gaining HPSA status also generated an additional 17 EampM claims submitted by primary care physicians with HPSA bonusshyeligible specialties Estimation of HPSA and PSA bonuses impact on primary care supply has been hindered by the existence of biases rising from the fact that the HPSA and PSA designation is a function of the current supply of providers While we try to mitigate some of these sources of bias future research is needed to provide a causal estimate of these bonuses
Finally we document the variation in Medicaid reimbursement rates relative to the Medicare rates both for primary care and for all services across US states during the period 2008shy2012 using the existing body of evidence Using the empirical results from our PCIP analysis we also perform an exercise to simulate the effect of a 10 percent increase in the MedicaidshytoshyMedicare fee index on the proportion of US officeshybased physicians accepting new Medicaid patients across all states The simulation suggests that a 10 percent increase in MedicaidshytoshyMedicare fee ratio would increase the US average of officeshybased primary care physicians accepting new Medicaid patients from 662 to 728 percent We caution against using the
60
Final Report Health Practitioner Bonuses
estimated impact of PCIP program to extrapolate the impact of MedicaidshytoshyMedicare parity This is because (1) in general parity would require a much bigger change in MedicaidshytoshyMedicare fee ratio (compared to the 10 percent PCIP payment) and (2) our PCIP analysis is limited in the sense that it is not capturing continuous variation in the incentive payment due to the nature of the program
61
Final Report Health Practitioner Bonuses
Appendices
Appendix A Bibliography and Literature Matrix Askildsen Jan Erik and Badi H Baltagi 2002 ldquoWill Increased Wages Reduce Shortage of Nurses A
Panel Data Analysis of Nursesrsquo Labour Supplyrdquo Health San Francisco 1ndash28 httpovidsptxovidcomspshy331aovidwebcgiampS=HIBGFPGCKJDDJIGINCCLIAGCBOJCAA00amp Complete+Reference=Ssh36|2|1
Aurlien H G Falck and G Jacobsen 1991 ldquoThe Physicianrsquos Choice of a Specialtyrdquo Tidsskrift for Den Norske Laegeforening Tidsskrift for Praktisk Medicin Ny Raekke 111 (17) 2133ndash2136
Bazzoli G J 1985 ldquoDoes Educational Indebtedness Affect Physician Specialty Choicerdquo Journal of Health Economics 4 (1) 1ndash19
Bindman Andrew B Jean Yoon and Kevin Grumbach 2003 ldquoTrends in Physician Participation in Medicaid The California Experiencerdquo The Journal of Ambulatory Care Management 26 (4) 334ndash43 httpwwwncbinlmnihgovpubmed14567277
Bloom Matt and George T Milkovich 1998 ldquoRelationships Among Risk Incentive Pay and Organizational Performancerdquo Academy of Management Journal 41 (3) 283ndash297 doi102307256908 httpconnectionebscohostcoman953549
Bodenheimer Thomas 2007 ldquoThe Primary Careshyspecialty Income Gap Why It Mattersrdquo Annals of Internal Medicine httpwebmailwendellmurraytaxescomhealthcarepolicypay_gappdf
Bolduc Denis B Fortin and MA Fournier 1996 ldquoThe Effect of Incentive Policies on the Practice Location of Doctors a Multinomial Probit Analysisrdquo Journal of Labor Economics httpwwwjstororgstable1023072535445
ChaixshyCouturier C I DurandshyZaleski D Jolly and P Durieux 2000 ldquoEffects of Financial Incentives on Medical Practice Results from a Systematic Review of the Literature and Methodological Issuesrdquo International Journal for Quality in Health Care Journal of the International Society for Quality in Health Care ISQua 12 (2) 133ndash142 httpwwwncbinlmnihgovpubmed10830670
Chou ChiushyFang and Anthony T Lo Sasso 2009 ldquoPractice Location Choice by New Physicians The Importance of Malpractice Premiums Damage Caps and Health Professional Shortage Area Designationrdquo Health Services Research 44 (4) (August) 1271ndash89 doi101111j1475shy6773200900976x httpwwwpubmedcentralnihgovarticlerenderfcgiartid=2739028amptool= pmcentrezamprendertype=abstract
Clemens Jeffrey and Joshua D Gottlieb 2014 ldquoDo Physicians Financial Incentives Affect Medical Treatment and Patient Healthrdquo American Economic Review 104(4) pp 1320shy1349
Coburn A F S H Long and M S Marquis 1999 ldquoEffects of Changing Medicaid Fees on Physician Participation and Enrollee Accessrdquo Inquiry a Journal of Medical Care Organization Provision and Financing 36 (3) 265ndash279
Cunningham Peter J 2011 ldquoState Variation in Primary Care Physician Supply Implications for Health Reform Medicaid Expansionsrdquo Research Briefs Center for Studying Health System Change (19) 1ndash 11 httpsfolioiupuieduhandle102441004
Cunningham Peter J and Ann S OrsquoMalley 2008 ldquoDo Reimbursement Delays Discourage Medicaid Participation by Physiciansrdquo Health Affairs 28 (1) w17ndashw28 httpwwwncbinlmnihgovpubmed19017679
Decker S 2012 ldquoIn 2011 Nearly OneshyThird of Physicians Said They Would Not Accept New Medicaid Patients but Rising Fees May Helprdquo Health Affairs 31 no8 pp 1673shy1679
Doran Tim Catherine Fullwood Hugh Gravelle David Reeves Evangelos Kontopantelis Urara Hiroeh and Martin Roland 2006 ldquoPayshyforshyperformance Programs in Family Practices in the United
62
thinsp
Final Report Health Practitioner Bonuses
Kingdomrdquo The New England Journal of Medicine 355 (4) (July 27) 375ndash84 doi101056NEJMsa055505 httpwwwncbinlmnihgovpubmed16870916
Dummit LA 2008 ldquoPrimary Care Physician Supply Physician Compensation and Medicare Fees What Is the Connectionrdquo Issue Brief Natl Health Policy Forum (827) http7612169157libraryissueshybriefsIB827_Physician_Income_11shy03shy08pdf
Fournier Gary M and Cheryl Henderson 2005 ldquoIncentives and Physician Specialty Choice a Case Study of Floridarsquos Program in Medical Sciencesrdquo Inquiry a Journal of Medical Care Organization Provision and Financing 42 (2) 160ndash170
Gagneacute Robert and Pierre Thomas Leacuteger 2005 ldquoDeterminants of Physiciansrsquo Decisions to Specializerdquo Health Economics 14 (7) 721ndash735 httpwwwncbinlmnihgovpubmed15678516
Gibbons Robert and Kevin J Murphy 1992 ldquoOptimal Incentive Contracts in the Presence of Career Concerns Theory and Evidencerdquo Journal of Political Economy (3792) (September) httpwwwnberorgpapersw3792
Gosden T F Forland I S Kristiansen M Sutton B Leese A Giuffrida M Sergison and L Pedersen 2001 ldquoImpact of Payment Method on Behaviour of Primary Care Physicians a Systematic Reviewrdquo Journal of Health Services Research Policy 6 (1) 44ndash55 httpeprintswhiteroseacuk52996
Grobler Liesl Ben J Marais S A Mabunda P N Marindi Helmuth Reuter and Jimmy Volmink 2009 ldquoInterventions for Increasing the Proportion of Health Professionals Practising in Rural and Other Underserved Areasrdquo Cochrane Database of Systematic Reviews Online 2 (1) CD005314 doi10100214651858CD005314pub2 httpwwwncbinlmnihgovpubmed19160251
Hadley J J Reschovsky C Corey and S Zuckerman 2009 ldquoMedicare Fees and the Volume of physiciansrsquo Servicesrdquo Inquiry 1Vol 46 No 4 Winter 2009shy2010 372shy390
Henderson M C D K Hunt and J W Williams 1996 ldquoGeneral Internists Influence Students to Choose Primary Care Careers The Power of Role Modelingrdquo The American Journal of Medicine 101 (6) 648ndash653
Hernoes E Marte Sollie and S Stroslashm 2000 ldquoEarly Retirement and Economic Incentivesrdquo The Scandinavian Journal of 102 (3) 481ndash502 httponlinelibrarywileycomdoi1011111467shy944200211abstract
Hogan F Paul and Ellen Bouchery 2010 ldquo A Model of Subspecialty Choice for Internal medicine Residentsrdquo prepared by The Lewin Group for the American College of Cardiology
Holmes George M 2005 ldquoIncreasing Physician Supply in Medically Underserved Areasrdquo Labour Economics 12 (5) (October) 697ndash725 doi101016jlabeco200402003 httplinkinghubelseviercomretrievepiiS0927537104000284
Kuhmerker K and T Hartman 2007 ldquoPayshyforshyperformance in State Medicaid Programsrdquo New York (NY) Commonwealth Fund
Lynch D C D A Newton M S Grayson and T W Whitley 1998 ldquoInfluence of Medical School on Medical Studentsrsquo Opinions About Primary Care Practicerdquo AAMC Academic Medicine Journal of the Association of American Medical Colleges 73 (4) 433ndash435
Manning WG Newhouse JP Duan N Keeler EB Benjamin B Liebowitz A et al 1988 ldquoHealth insurance and the demand for medical care Evidence from a randomized experimentrdquo Santa Monica CA RAND Corporation
McDonald Ruth and Martin Roland 2009 ldquoPay for Performance in Primary Care in England and California Comparison of Unintended Consequencesrdquo Annals Of Family Medicine 7 (2) 121ndash127 httpwwwpubmedcentralnihgovarticlerenderfcgiartid=2653973amptool=pmcentrezamprendertype=abs tract
Midtsundstad Tove 2012 ldquoEffects of Companiesrsquo Initiatives to Reduce Early Retirement Among Older Workersrdquo Nordic Journal of Working Life Studies 2(3) 89-108
63
thinsp
Final Report Health Practitioner Bonuses
Morrow R W A D Gooding and C Clark 1995 ldquoImproving Physiciansrsquo Preventive Health Care Behavior Through Peer Review and Financial Incentivesrdquo Archives of Family Medicine 4 (2) 165ndash169
Nicholson S 2002 ldquoPhysician Specialty Choice Under Uncertaintyrdquo Journal of Labor Economics 20 (4) 816ndash847
Nicholson Sean and C Propper 2011 ldquoMedical Workforcerdquo In Handbook of Health Economics 873ndash 923
Petersen Laura A LeChauncy D Woodard Tracy Urech Christina Daw and Supicha Sookanan 2006 ldquoDoes Payshyforshyperformance Improve the Quality of Health Carerdquo Annals of Internal Medicine 145 (1 Suppl) 538 author reply 538ndash539 httpwwwncbinlmnihgovpubmed16908917
Petterson Stephen M and Andrew W Bazemore 2012 ldquoProjecting US Primary Care Physician Workforce Needs 2010shy2025rdquo Annals of Family Medicine Vol 10 (No 6) 503ndash509 doi101370afm1431INTRODUCTION httpwwwannfammedorgcontent106503abstract
Piper Kip and Sellers Dorsey 2009 Global Payments to Improve Quality and Efficiency in Medicaid
Rabinowitz H K J J Diamond F W Markham and N P Paynter 2001 ldquoCritical Factors for Designing Programs to Increase the Supply and Retention of Rural Primary Care Physiciansrdquo Jama The Journal Of The American Medical Association 286 (9) 1041ndash1048 httpjamaamashyassnorgcgidoi101001jama28691041
Ramsey P G J B Coombs D D Hunt S G Marshall and M D Wenrich 2001 ldquoFrom Concept to Culture The WWAMI Program at the University of Washington School of Medicinerdquo Academic Medicine 76 (8) 765ndash775
Reschovsky J A Ghosh and K Stewart 2012 Paying More for Primary Care Can It Help Bend the Medicare Cost Curve The Commonwealth Fund httpwwwcommonwealthfundorg~mediaFilesPublicationsIssueBrief2012Mar1585_Reschovsky _paying_more_for_primary_care_FINALv2pdf
Rizzo J A and D Blumenthal 1994 ldquoPhysician Labor Supply Do Income Effects Matterrdquo Journal of Health Economics 13 (4) 433ndash453 httpwwwncbinlmnihgovpubmed10140533
Rosenthal MB Li Z Epstein AM Frank R G 2005 ldquoEarly Experience with Payshyforshyperformance From Concept to Practicerdquo JAMA The Journal of the American Medical Association 294 (14) (October 12) 1788ndash1793 httpdxdoiorg101001jama294141788
Rosenthal Meredith B and R Adams Dudley 2007 ldquoPayshyforshyperformance Will the Latest Payment Trend Improve Carerdquo Jama The Journal Of The American Medical Association 297 (7) 740ndash744 httpwwwncbinlmnihgovpubmed17312294
Salinsky E 2010 ldquoHealth Care Shortage Designations HPSA MUA and TBDrdquo National Health Policy Forum Background Paper No 75 pp 1shy36
Saether Erik Magnus 2005 ldquoPhysiciansrsquo Labour Supply The Wage Impact on Hours and Practice Combinationsrdquo Labour 19 (4) (December) 673ndash703 doi101111j1467shy9914200500317x httpdoiwileycom101111j1467shy9914200500317x
Scott Anthony Peter Sivey Driss Ait Ouakrim Lisa Willenberg Lucio Naccarella John Furler and Doris Young 2011 ldquoThe Effect of Financial Incentives on the Quality of Health Care Provided by Primary Care Physiciansrdquo Cochrane Database of Systematic Reviews Online 9 (9) CD008451 httpwwwncbinlmnihgovpubmed21901722
Sempowski Ian P 2004 ldquoEffectiveness of Financial Incentives in Exchange for Rural and Underserviced Area Returnshyofshyservice Commitments Systematic Review of the Literaturerdquo Canadian Journal of Rural Medicine the Official Journal of the Society of Rural Physicians of Canada Journal Canadien De La Medecine Rurale Le Journal Officiel De La Societe De Medecine Rurale Du Canada 9 (2) 82ndash88 httpwwwncbinlmnihgovpubmed15603680
Shen YushyChu and Stephen Zuckerman 2005 ldquoThe Effect of Medicaid Payment Generosity on Access and Use Among Beneficiariesrdquo Health Services Research 40 (3) (June) 723ndash44 doi101111j1475shy
64
Final Report Health Practitioner Bonuses
6773200500382x httpwwwpubmedcentralnihgovarticlerenderfcgiartid=1361165amptool= pmcentrezamprendertype=abstract
Shugarman Lisa R and Donna O Farley 2003 ldquoShortcomings In Medicare Bonus Payments For Physicians In Underserved Areasrdquo Health Affairs 22 (4) (July 1) 173ndash178 doi101377hlthaff224173 httpcontenthealthaffairsorgcontent224173abstract
Shurgman Lisa R Donna O Farley Pat Taylor and J Scott Ashwood 2001 Trends in Bonus Payments for Physician Services to Rural Medicare Beneficiaries
Sivey Peter Anthony Scott Julia Witt Catherine Joyce and John Humphreys 2012 ldquoJunior Doctorsrsquo Preferences for Specialty Choicerdquo Journal of Health Economics 31 (6) (December) 813ndash23 doi101016jjhealeco201207001 httpwwwncbinlmnihgovpubmed22940638
Sloan Frank 1970 ldquoLifetime Earnings and Physiciansrsquo Choice of Specialtyrdquo Industrial and Labor Relations Review Vol 24 (No 1) (October 13) pp 47ndash56 httpdukespacelibdukeedudspacehandle101612547
Small David Marc and Tricia McGinnis 2014 Leveraging the Medicaid Primary Care Rate Increase The Role of Performance Measurement
Staiger Douglas O David I Auerbach and Peter I Buerhaus 2010 ldquoTrends in the Work Hours of Physicians in the United Statesrdquo The Journal of the American Medical Association 303 (8) (February 24) 747ndash53 doi101001jama2010168 httpwwwpubmedcentralnihgovarticlerenderfcgiartid=2915438amptool=pmcentrezamprendertype= abstract
Town Robert Robert Kane Paul Johnson and Mary Butler 2005 ldquoEconomic Incentives and Physiciansrsquo Delivery of Preventive Care a Systematic Reviewrdquo American Journal of Preventive Medicine 28 (2) (February) 234ndash40 doi101016jamepre200410013 httpwwwncbinlmnihgovpubmed15710282
Vaughn Bryan T Steven R DeVrieze Shelby D Reed and Kevin a Schulman 2010 ldquoCan We Close the Income and Wealth Gap Between Specialists and Primary Care Physiciansrdquo Health Affairs 29 (5) (May) 933ndash40 doi101377hlthaff20090675 httpwwwncbinlmnihgovpubmed20439883
Verby J E J P Newell S A Andresen and W M Swentko 1991 ldquoChanging the Medical School Curriculum to Improve Patient Access to Primary Carerdquo Jama The Journal Of The American Medical Association 266 (1) 110ndash113 httpjamaamashyassnorgcontent2661110short
Zuckerman Stephen 2004 ldquoChanges in Medicaid Physician Fees 1998shy2003 Implications for Physician Participationrdquo Health Affairs (June) 1998ndash2003 doi101377hlthaffW4374 httpwwwhealthaffairsorgRWJZuckerman_June04pdf
Zuckerman Stephen Aimee F Williams and Karen E Stockley 2009 ldquoTrends in Medicaid Physician Fees 2003shy2008rdquo Health Affairs 28 (3) w510ndashw519 httpwwwncbinlmnihgovpubmed19401290
Zuckerman S and D Goin 2012 ldquoHow Much Will Medicaid Physician Fees for Primary Care Rise in 2013 Evidence from a 2012 Survey of Medicaid Physician Feesrdquo Kaiser Commission on the Medicaid and the Uninsured Issue Paper December 2012
65
Final Report Health Practitioner Bonuses
Literature Matrix
Study Goal Results Data Type of Study Reference
Topic Effect of Earnings on the Supply of Primary Care Services and Providers Role of Medicare Primary Care Bonuses (Section III)
Estimate a model where medical Data set with the Econometric students consider entry The income elasticity estimates range from 103 in family preferred and realized model Nicholson probabilities when selecting a practicepediatrics to 220 in radiology specialties for 7200 (conditional 2002 specialty medical students logit)
Estimated career wealth The present value of career wealth from college accumulation across specialists primary care physicians physician assistants business school graduates and college graduates Comparing specialists represented by cardiologists to
graduation through age sixtyshyfive was estimated at $5171407 for cardiologists $2475838 for primary care physicians $1725171 for MBA graduates $846735 for physician assistants and $340628 for college graduates For a primary care physicianrsquos lifetime earnings to equal that of a cardiologist the primary care
Data from multiple sources included income income taxes living expenses and graduate school
Compound interest wealth accumulation model
Vaughn et al 2010
primary care physicians in physician would have to receive a bonus of $11 million expenses
scenarios upon completion of medical school
Determine effect of educational indebtedness on the specialty choices of new physicians especially in light of the perceived shortage of primary care physicians
Medical students are more likely to choose primary care when the expected earnings are relatively large A $10000 (20 percent of the mean earnings) increase in expected earnings in primary care relative to the nonshyprimary care yields a 14 percentage point increase in the probability of choosing primary care
Data set from American Medical Associationrsquos 1983 lsquoSurvey of Resident Physiciansrsquo
Econometric model (utility maximization)
Bazzoli 1985
Estimation of career choice and medical studentrsquos decision to specialize given lifetime utility maximization
In response to 91 percent reduction in relative feeshypershyconsultation for a general practitioner would lead to between a 04 percent reduction and a 229 percent reduction in the proportion of Medical students entering general practice
Data from multiple sources Model estimated from sample of 30184 physicians who practiced in Canada between 1989 and 1998 and whose year of graduation from medical school is between 1975 and 1991
Econometric model (multinomial logit)
Gagne and Leger 2005
Determine the causes of the primary careshyspecialist income gap why the ResourceshyBased Relative Value Scale failed to prevent the income gap
The RBSVS failed due to four factors (1) the volume of diagnostic and imaging procedures has increased more rapidly than the volume of office visits (2) the process of updating fees every five years is heavily influenced by the Relative Value Scale Update Committee which is composed of a majority of specialists (3) Medicarersquos formula for controlling physician payments penalizes primary care physicians and (4) private insurers tend to pay for procedures at higher rates than office visits relative to Medicare
Data from multiple sources income information between 1995 and 2005
Literature review Bodenheimer 2007
66
Final Report Health Practitioner Bonuses
Study Goal Results Data Type of Study Reference
Determine the effects of expected future earnings and other attributes on specialty choice
Simulated policy changes indicate increasing general practitioners earnings by $50000 or increasing opportunities for procedural or academic work (specifically limiting the amount of onshycall hours) can increase the number of junior doctors choosing general practice by between 8 and 13 percentage points This implies an earnings elasticity of specialty choice of 095
Data from the Medicine in Australia Balancing Employment and Life (MABEL) survey
Econometric model (logit)
Sivey amp Scott 2012
Estimate a model of physician labor supply focusing on the impacts of wage and nonshywage income
Evidence of significant income effects For male physicians the income effect of a wage change on labor supply is negative with an elasticity of shy 026 The pure substitution effect of a wage change increases labor supply a 1 percent increase in wages leads to a 049 percent increase in labor supply controlling for income effects
Data from the 1987 Practice Patterns of Young Physicians Survey (YPS)
Econometric model (log linear regression)
Rizzo and Blumenthal 1994
Estimate the labor supply of physicians employed at hospitals in Norway using personnel register data merged with other public records
Research indicates a 10 percent wage increase would lead to a 3 percent increase in physician labor supply (wage elasticity of 03) The magnitude of the wage elasticity in this case may be relatively small because of hospital employed physicians tendency to have a lower wage than selfshyemployed physicians though still larger than previous estimates
Data set used is a sample of 1303 male physicians observed over the period 1993 and 1997
Econometric model (GMM system GMM)
Baltagi et al 2005
Estimate wage elasticities for Norwegian nurses
40 percent of PCC students returned to New Mexico to practice compared to 32 percent of traditional students
Data includes detailed information on 18066 individuals over 5 years totaling 56832 observations between 1993 and 1997
Econometric model (fixed effects)
Askildsen amp Baltagi 2002
Effect of a permanent 10 percent increase in fees for primary care ambulatory visits on volume of services and cost to Medicare
Analysis shows the fee increase would increase primary care visits by 88 percent and raise the overall cost of primary care visits by 17 percent However these increases would yield more than a sixshyfold annual return in lower Medicare costs for other servicesmdashmostly inpatient and postshyacute caremdashonce the full effects on treatment patterns are realized The net result would be a drop in Medicare costs of nearly 2 percent These
Data set contains Medicare claims data (2004 to 2006) as well as physician data from the Community Tracking Study (CTS) Physician Survey (2004 to 2005)
Econometric model
Reschovsky et al 2012
Estimates the relationship between Medicare fees and quantities provided by physicians for eight specific services
Results show that Medicare fees are positively related to quantity provided for all eight services and are significantly different from zero and elastic for five Estimates are that a 10 percent reduction in Medicare fees would lead to 18 percent to 66 percent reduction in the volume of office visits
Data set contains 13707 physicians who responded to surveys in 20002001 andor 20042005 and were linked to all Medicare claims for their Medicare patients
Econometric model (GLM)
Hadley et al 2009
67
Final Report Health Practitioner Bonuses
Study Goal Results Data Type of Study Reference
Estimate trends in hours worked by US physicians and assess for association with physician fees
After remaining stable through the early 1990s mean hours worked per week decreased by 72 percent between 1996 and 2008 among all physicians (from 549 hours per week in 1996shy1998 to 510 hours per week in 2006shy2008 Excluding resident physicians whose hours decreased by 98 percent the last decade due to duty hour limits imposed in 2003 nonresident physician hours decreased by 57 percent
Data set from US Census Bureau Current Population Survey between 1976 and 2008 (N=116733)
Outcomes of a Problemshybased learning model (specialty and practice location)
Steiger et al 2010
Study Goal Results Data Type of Study Reference
Topic Financial Incentives for Primary Care Providers in Underserved Areas (Section IV)
Evaluate effectiveness and developing trends in bonus payments to rural physicians
In 1991 the total amount of HPSA bonus was almost 316 million dollars Estimates show that 583 percent of the total HPSA bonus payment went to rural HPSAs while the remaining 417 percent went to urban HPSAs They also observed that the total bonus payment grew to reach about 106 million dollars in 1996 but then gradually declined to almost 77 million dollars in 1998 The rural proportion of HPSA bonus payments decreased to 511 percent
Data set includes Area Resource File (ARF) and Medicare Part B claims data for multiple years
Trend examination
Shugarman et al 2001
Examine trends in Medicare spending for basic payments and bonus payments for physician services provided to beneficiaries residing in nonmetropolitan counties
Payments under the Congressionallyshymandated bonus payment program accounted for less than 1 percent of expenditures for physician services in nonmetropolitan underserved counties Physician payments increased from 1992 to 1998 while bonus payments increased through 1996 but then declined by 13 percent by 1998 The share of bonus payments to primary care physicians declined throughout the decade but the share for primary care services increased
Data set includes Area Resource File (ARF) and Medicare Part B claims data for multiple years
Trend examination
Shugarman and Farley 2003
Evaluate the effectiveness of programs that provide financial incentives to physicians in exchange for a rural or underserviced area returnshyofshyservice (ROS) commitment
The majority of studies reported effective recruitment despite high buyshyout rates in some USshybased programs Increasing Canadian tuition and debt among medical students may make these programs attractive The one prospective cohort study on retention showed that physicians who chose voluntarily to go to a rural area were far more likely to stay long term than those who located there as an ROS commitment Multidimensional programs appeared to be more successful than those relying on financial incentives alone
Limited literature available given quality limitations
Literature Review
Sempowski et al 2004
Assess the effect of various On average a 10 percent increase in the general practitioner Data for physicians come Econometric incentive measures fees for medical services in a region increases the propensity from la Corporation model (spatial Bolduc et introduced in Quebec of a beginning GP to work in this region by 7 percent Thus the Professionnelle des autoregressive al 1996 (Canada) to influence the implied elasticity of location choice probability with respect to Medecins du Qu6bec multinomial
68
Final Report Health Practitioner Bonuses
Study Goal Results Data Type of Study Reference geographical distribution of fee increases is about 07 However this elasticity varies Population data come probit) physicians across regions it is higher in remote regions (with a maximum from Canada Census
of 128) On the other hand on average the elasticity of (various years) and intershylocation choice probability with respect to nonshylabor incomes census estimations from such as study grants is estimated to be about 111 le Bureau de la Statistique
du Qu6bec (unpublished data)
Compare the types of locations chosen by alumni and nonshyalumni of a United States program charged with increasing physician supply
Eliminating the program would decrease the supply of physicians in medically underserved communities by roughly 10 percent
Data from multiple sources primarily the
American Medical Association (AMA) master file for 1981 1986 1991 and 1996
Econometric (multinomial logit)
Holmes 2005
Examine the history and results of The Physician Shortage Area Program (PSAP) of Jefferson Medical College and identify factors independently predictive of rural primary care supply and retention
Freshmanshyyear plan for family practice being in the PSAP having a National Health Service Corps scholarship male sex and taking an elective senior family practice rural preceptorship were independently predictive of physicians practicing rural primary care Among PSAP graduates taking a senior rural preceptorship was independently predictive of rural primary care However nonshyPSAP graduates with 2 key selection characteristics of PSAP students (having grown up in a rural area and freshmanshyyear plans for family practice) were 78 percent as likely as PSAP graduates to be rural primary care physicians and 75 percent as likely to remain suggesting that the admissions component of the PSAP is the most important reason for its success
Data includes a total of 3414 Jefferson Medical College graduates from the classes of 1978shy1993 including 220 PSAP graduates
Retrospective cohort study
Rabinowitz et al 2001
69
Final Report Health Practitioner Bonuses
Study Goal Results Data Type of Study Reference
Topic Impact of the Increase in Medicaid Reimbursement Rate Relative to the Medicare Rate (Section V)
Identify the causal effect of increases in Medicaid reimbursement rates relative to the Medicare rate on the propensity of primary care physicians accepting new Medicaid patients
For primary care physicians a 10 percentage point increase in the MedicaidMedicare fee ratio for primary care is associated with only a 21 percentageshypoint increase in Medicaid patient acceptance The average Medicaid reimbursement rate relative Medicare in 2008 was at 662 percent and the national average acceptance rate of new Medicaid patients by PCPs was 415 percent Therefore the implied elasticity of accepting primary care patients with respect to the payment rate is about 033 Excluding pediatricians it is 041
Data acquired from HSC 2008 Health Tracking Physician Survey and American Medical Association (AMA) master file
Econometric model (OLS)
Cunningha m 2011
Examine the effects of Medicaid payment generosity on access and care for adult and child Medicaid beneficiaries
Higher payments increase the probability of having a usual source of care and the probability of having at least one visit to a doctor and other health professional for Medicaid adults and produce more positive assessments of the health care received by adults and children However payment generosity has no effect on the other measures that we examined such as the probability of receiving preventive care or the probability of having unmet needs
Data from the National Surveys of Americarsquos Families (1997 1999 2002) and are linked to the Urban Institute Medicaid capitation rate surveys the Area Resource File and the American Hospital Association survey files
Econometric model (differenceshyinshydifference)
Shen amp Zuckerman 2005
Evaluation in California of whether the expansion of Medicaid managed care and a physician payment increase were associated with an increase over time in the percentage of physicians caring for Medicaid patients
Despite large increases in the use of MedishyCal
managed care and the implementation of MedishyCal physician fee increases between 1996 and 2001 there was no significant inshy crease in the percentage of primary care physicians accepting new MedishyCal patients or having any MedishyCal patients in practice over time
Dataset comprised of surveys of probability samples of primary care and specialist physicians in California in 1996 1998 and 2001 and AMA master file data
Chishysquare tests
Bindman et al 2003
Examine the impact of Californiarsquos Medicaid reshy imbursement for nursing homes which includes incentives directed at staffing
Consistent with the rate incentives and rational expectation behavior expected nursing home reimbursement rates in 2008 were associated with increased RN staffing levels in 2006 but had no relationship with licensed practical nurse and certified nursing assistant staffing The effect was estimated at 2 minutes per $10 increase in rate
Data from Medicaid master file for a total of 927 California freeshystanding nursing homes in 2006
Econometric model (twoshystage MLE)
Mukamel et al 2012
Assess the effects of Medicaid fee changes on physician participation enrollee access and shifts in the site of ambulatory care using several natural experiments in Maine and Michigan
The reimbursement changes included substantial percentage changes in fees however the value of the Medicaid fee improvements relative to the private market eroded very rapidly in the months following the interventions Implied elasticities ranged between 039 and shy0021
Dataset from Medicaid claims and enrollment data between 1988 and 1992
Program Overview amp Outcomes of communityshybased training
Coburn et al 1999
70
Final Report Health Practitioner Bonuses
Appendix B Additional Exhibits
Exhibit B1 Distribution of Primary Care Providers with PCIP Eligible Specialty by Age Sex and Year
Sex Age 2005 2006 2007 2008 2009 2010 2011
Male lt35 114 104 102 98 94 88 79
Male 35shy44 299 295 288 282 276 271 265
Male 45shy54 347 338 323 311 299 287 281
Male 55shy64 186 204 220 235 250 263 275
Male 65+ 53 59 66 74 82 90 100
Male Total 95911 101781 111971 116133 118868 121264 122048
Female lt35 215 205 206 204 201 197 189
Female 35shy44 368 367 359 353 347 342 340
Female 45shy54 315 312 304 298 291 284 278
Female 55shy64 91 104 117 128 142 155 168
Female 65+ 10 12 14 17 19 22 24
Female Total 59446 66054 78531 86972 93905 100930 106003
Missing SexAge
29633 33759 42945 49954 54580 60665 73232
Total 184990 201594 233447 253059 267353 282859 301283
Exhibit B2 Average Number of PCIP Eligible EampM Claims per PCP under Medicare by Specialty 2005shy2011
Specialty 2005 2006 2007 2008 2009 2010 2011
Internal Medicine 869 823 759 746 712 697 653
Family Medicine 722 694 651 649 631 626 605
Pediatrics 51 50 42 39 41 40 36
Geriatrics 989 1026 990 978 960 955 958
Clinical Nurse Specialist 86 85 77 87 97 107 118
Nurse Practitioner 258 257 230 219 219 228 228
Physician Assistant 125 128 120 121 124 134 140
71
Final Report Health Practitioner Bonuses
Exhibit B3 Average Allowed Charges ($) for the PCIP Eligible EampM Claims per PCP under Medicare 2005shy2011
Specialty 2005 2006 2007 2008 2009 2010 2011
Physicians
Internal Medicine $52896 $51477 $51149 $51737 $51438 $55188 $53641
Family Medicine $41019 $40557 $41279 $42369 $43075 $46833 $47163
Pediatrics $3008 $3028 $2705 $2533 $2771 $3055 $2835
Geriatrics $61243 $70593 $68845 $73829 $76317 $82230 $84453
NonshyPhysicians
Clinical Nurse Specialist $4219 $4446 $3974 $4883 $5824 $6841 $7890
Nurse Practitioner $12139 $13055 $11929 $12019 $12600 $14274 $14752
Physician Assistant $5724 $6122 $6064 $6333 $6765 $8133 $8831
Exhibit B4 Proportion of PCIP Eligible EampM Claims per 2011 PCIP Recipients by Specialty 2005shy2011
Specialty 2005 2006 2007 2008 2009 2010 2011
Physicians
Internal Medicine 45 45 44 44 41 42 41
Family Medicine 45 45 44 44 41 42 40
Pediatrics 45 47 47 47 45 41 39
Geriatrics 67 72 70 68 64 62 64
NonshyPhysicians
Clinical Nurse Specialist 64 66 64 60 57 57 56
Nurse Practitioner 66 66 69 68 65 67 68
Physician Assistant 55 56 56 55 51 52 50
Note the proportions are calculated out of all Medicare claims (excluding hospital inpatient ER drug and lab)
Exhibit B5 Average Number of PCIP Eligible EampM Claims per 2011 PCIP Recipients under Medicare by Specialty 2005shy2011
Specialty 2005 2006 2007 2008 2009 2010 2011
Physicians
Internal Medicine 1113 1088 1050 1057 1015 1035 1011
Family Medicine 808 785 752 756 729 752 743
Pediatrics 157 149 130 118 111 129 132
Geriatrics 1168 1237 1191 1187 1145 1181 1193
NonshyPhysicians
Clinical Nurse Specialist 375 384 361 346 335 382 389
Nurse Practitioner 384 403 369 392 405 457 492
Physician Assistant 251 266 260 268 266 301 301
72
Final Report Health Practitioner Bonuses
Exhibit B6 Average Allowed Charges for the PCIP Eligible EampM Claims per 2011 PCIP Recipients under Medicare 2005shy2011
Specialty 2005 2006 2007 2008 2009 2010 2011
Physicians
Internal Medicine $67863 $68281 $70869 $73505 $73494 $81629 $82500
Family Medicine $45958 $45878 $47781 $49440 $49827 $56350 $58004
Pediatrics $9336 $9051 $8460 $7864 $7631 $9836 $10450
Geriatrics $72412 $85046 $82732 $89548 $90821 $101283 $104284
NonshyPhysicians
Clinical Nurse Specialist $17795 $19741 $18922 $19279 $19557 $24141 $25405
Nurse Practitioner $19633 $21605 $19496 $22516 $24830 $29740 $32837
Physician Assistant $11628 $12949 $13457 $14496 $15128 $18717 $19363
Exhibit B7 Proportion of Allowed Charges for PCIP Eligible EampM Claims per 2011 PCIP Recipients 2005shy2011
Specialty 2005 2006 2007 2008 2009 2010 2011
Physicians
Internal Medicine 71 72 74 76 77 79 76
Family Medicine 73 75 77 77 78 80 77
Pediatrics 70 73 75 75 77 77 76
Geriatrics 77 87 88 89 89 90 89
NonshyPhysicians
Clinical Nurse Specialist 76 80 81 83 85 86 85
Nurse Practitioner 68 71 75 79 82 87 87
Physician Assistant 72 74 76 78 81 83 82
Note the proportions are of allowed charges for all Medicare claims (excluding hospital inpatient ER drug and lab)
73
Final Report Health Practitioner Bonuses
Exhibit B8 Distribution of the Number of NPs and PAs across HPSA and PSA regions
Profession Type 2005 2006 2007 2008 2009 2010 2011
Nurse Practitioners
Total Providers 23610 27450 35286 42144 46973 52472 59505
in HPSA x X 14171 16978 18858 20929 23045
in PSA 2946 3331 4139 4694 NA NA NA
in HPSA amp PSA x X 1638 1855 NA NA NA
PCIP 2011 Recipients 12267 14146 18008 23070 27698 25369 23707
in HPSA x X 7335 9344 11148 10178 9312
in PSA 1558 1754 2168 2571 NA NA NA
in PSA amp HPSA x X 861 1027 NA NA NA
Physician Assistants
Total Providers 21240 24439 30823 35593 39226 42871 47340
in HPSA x X 13246 15236 16889 18489 19828
in PSA 2166 2436 3098 3467 NA NA NA
in HPSA amp PSA x X 1230 1363 NA NA NA
PCIP 2011 Recipients 6168 7033 8852 10898 13038 11961 11288
in HPSA x X 3830 4732 5760 5226 4755
in PSA 760 839 1034 1217 NA NA NA
in PSA amp HPSA x X 408 494 NA NA NA
Note HPSA includes only full HPSA areas (data from Area Resource File and HPSA status data are not available prior to 2007) PSA status after 2008 is not applicable as 2008 was the final year of the PSA bonus
Exhibit B9a Distribution of Male Primary Care Physicians with PCIP Eligible Specialty by Age and Year
Note Primary care physicians include following specialties internal medicine family practice pediatrics geriatrics
74
Final Report Health Practitioner Bonuses
Exhibit B9b Distribution of Female Primary Care Physicians with PCIP Eligible Specialty by Age and Year
Note Primary care physicians include following specialties internal medicine family practice pediatrics geriatrics
Exhibit B10 Distribution of Male Primary Care NonshyPhysicians with PCIP Eligible Specialty by Age and Year
Note Primary care nonshyphysicians include following specialties PA NP and CNS
75
Final Report Health Practitioner Bonuses
Exhibit B11 Distribution of Female Primary Care NonshyPhysicians with PCIP Eligible Specialty by Age and Year
Note Primary care nonshyphysicians include following specialties PA NP and CNS
Exhibit B12 Average Number of PCIP Eligible EampM Claims Submitted by 2011 PCIP Recipients 2005 ndash 2011
76
2
0
7
3
4 0 4 6
Final Report Health Practitioner Bonuses
Exhibit B13 Allowed Charges for PCIP Eligible EampM Claims per 2011 PCIP Recipients 2005shy2011
Exhibit B14 Total Number of PCIP Eligible EampM Claims submitted by All Providers in the Control Group 2005shy2011
Specialty 2005 2006 2007 2008 2009 2010 2011
OBGYN 2597637 2612513 2728810 281347 2893204 3047849 3040383
Ophthalmology 5615010 5648040 6070483 597672 5832440 6361330 6164821
Pathology 46894 51364 54748 57005 57147 64078 63652
Urology 6964185 7202012 7571544 777585 7777728 8616096 8641898
Optometry 2464734 2550764 2758214 289154 2969244 3048668 3088461
Podiatry 7788889 8195973 8957163 973940 1001263 1064539 1089067
Psychology 42 11 27 64 1552 2440 2097
Neurophysiology 12609 13838 13858 15451 18142 17962 17714
77
shy
Final Report Health Practitioner Bonuses
Additional Regression Results
Exhibit B15 Impact of Medicare PCIP Policy on the Number of Primary Care Providers Who Have submitted any Medicare Claims (not necessarily under PCIP Eligible Services)
(2005shy2011)
Dependent Variable Number
of Providers per county All Providers (1) Physicians Only (2) Non Physicians Only (3)
PCIP Elig Specialty Indicator 6550 4054 4859
(3929) (4449) (2759)
Elig Specialty Ind x Post 2009 4408 3255 5710
(0503) (0758) (0482)
Post 2009 4588 3314 4187
(0505) (0593) (0350)
Median Income ($10k) 2306 2728 1643
(0424) (0513) (0241)
Percent in poverty 0466 0541 0360
(00535) (00653) (00332)
Population (10k) 0727 0771 0487
(00298) (00359) (00144)
Percent Population over 65 shy0406 shy0262 shy0337
(00407) (00502) (00280)
Unemployment Rate shy0660 shy0652 shy0493
(00522) (00621) (00392)
Intercept shy7242 shy7909 shy490
(4371) (4812) (3069)
Specialty Fixed Effects Yes Yes Yes
Year Fixed Effects Yes Yes Yes
State Fixed Effects Yes Yes Yes
N 140192 107526 95647
Adj Rshysq 0391 0396 0480
Note Robust standard errors are in parentheses + significance at 10 significance at 5 The number of observation is based on the number of counties the number of years and the number of provider specialties in each model (ie physicians include 4 primary care specialties and nonshyphysicians include 3 subshy specialties)
78
-
shy
Final Report Health Practitioner Bonuses
Exhibit B16 Impact of Medicare PCIP Policy on the Number of Primary Care Providers Who Met 60 PCIP Eligibility Threshold Each Year (2005shy2011)
Dependent Variable Number of
Providers per county
All Providers
(1)
Physicians Only
(2)
Non Physicians
Only (3)
PCIP Elig Specialty Indicator 2062 2194 6540
(1769) (2050) (0642)
Elig Specialty Ind x Post 2009 2322 1841 2776
(0341) (0543) (0243)
Post 2009 1252 0750+ 0994
(0348) (0427) (0143)
Median Income ($10k) 0549+ 0847 00118
(0305) (0380) (00942)
Percent in poverty 00663+ 00965 00165
(00379) (00473) (00137)
Population (10k) 0264 0298 00610
(00229) (00284) (000579)
Percent Population over 65 shy0155 shy0105 shy0127
(00277) (00355) (00111)
Unemployment Rate shy0252 shy0259 shy00864
(00357) (00444) (00166)
Intercept shy2281 shy2717 shy3777
(2029) (2419) (0775)
Specialty Fixed Effects Yes Yes Yes
Year Fixed Effects Yes Yes Yes
State Fixed Effects Yes Yes Yes
N 140192 107526 95647
Adj Rshysq 0174 0184 0119
Note Robust standard errors are in parentheses + significance at 10 significance at 5 The number of observation is based on the number of counties the number of years and the number of provider specialties in each model (ie physicians include 4 primary care specialties and nonshyphysicians include 3 subshy specialties)
79
-
Final Report Health Practitioner Bonuses
Appendix C Differenceshyinshydifference (DID) Methodology
C1 DID model and derivation for estimating the impact of PCIP policy
The following equation (Equation (1)) shows the econometric model to identify the effect of Medicare PCIP program on the magnitude of primary care EampM services
= + lowast + lowast 13 + lowast 13 lowast + lowast + (1)
We let Sit be the volume of eligible EampM services provided by provider i in period t Ti is an indicator for treatment group that takes the value 1 if the provider is a PCP and zero otherwise the variable is an indicator variable taking the value of 1 in the years when the PCIP policy is likely to impact the behavior of the providers and 0 otherwise the vector includes provider characteristics such as age and gender etc The term Eit represents random unobserved factors affecting EampM services
The DID methodology that we use here to identify the unbiased effect of PCIP policy on the volume of primary care EampM services is illustrated by considering two time periods preshyPCIP (pre) and postshyPCIP (post) periods with the latter being the years when the PCIP policy is likely to impact the behavior of the providers Equation (2) below shows the change in the volume of EampM services provided by PCPs between preshyPCIP and postshyPCIP periods holding other things constant
(2)
Similarly equation (3) below shows the change in the volume of EampM services provided by nonshyPCPs between preshyPCIP and postshyPCIP periods
(3)
Holding other provider characteristics (embedded in Xs) constant and assuming the changes in random shocks are zero in the limit for both the groups equation (4) below shows that the change in the magnitude of the primary care EampM services provided by PCPs due to the introduction of the Medicare PCIP program is 8
(4)
Thus the coefficient 8 from equation (1) represents an unbiased estimate of the effect of the Medicare PCIP policy on the volume of primary care EampM services Similar methodology can also be applied to estimate the effect of the PCIP policy on other outcomes of interest
C2 DID model and derivation for estimating the impact of HPSA bonus
Equation (5) below shows the empirical specification that we used to estimate the effect of HPSA status on the outcome variables discussed above
80
-0 minus -23 = + + 4 -0 minus -235 lowast + -0 minus -23
minus = + 466-0 66-23 66-0 minus
66-235 lowast + 66-0 minus 66-23
(-0 minus -23) minus (66-0 minus 66-23) =
13tit
7- = +
7- =
7- = + + +
7- = +
Final Report Health Practitioner Bonuses
The model is specified based on the physician level data in each year Here the dependent variable Dict is one of the other potential outcomes of interest of a primary care physician i in county c at time t H SA ict is an indicator of whether physician irsquos county is a HPSA at time t
is an indicator variable taking the value of 1 if the physicianrsquos county ever gained the HPSA status (from a nonshyHPSA) during the sample period and zero otherwise is an indicator variable taking the value of 1 if the physicianrsquos county ever lost the HPSA designation during the sample period and zero otherwise the vector ict includes variables
reflecting the physician characteristics their geographic locations etc and t is a vector of timeshyspecific fixed effect terms
The term Eict represents random unobserved factors affecting outcomes If the change of HPSA status is associated with any changes in the volume of services provided by primary care physicians in those areas then we should expect estimated values of 82 and λ2 in equation (5) will reflect them If the outcome of interest is the volume of services then a positive significant estimated value of 82 would imply higher volume of services due to gaining HPSA designation
For simplicity assume that we have physicians in the following four types of counties counties that are always HPSA (type C1) counties that are always nonshyHPSA (type C2) counties that gained HPSA status and remained HPSA afterwards (C3) and counties that lost HPSA status and remained nonshyHPSA afterwards (C4) Also consider the number of EampM claims submitted under Medicare as the outcome variable of interest Now for given values of and E let us focus on the first 7 terms of the above equation for a representative provider in each of these 4 types of counties
Equation (6) shows the expression of the model excluding the last three terms for County Type C1 (always HPSA)
(6)
Equation (7) shows the expression of the model excluding the last three terms for County Type C2 (always nonshyHPSA)
(7)
Equation (8) shows the expression of the model excluding the last three terms for County Type C3 (gained HPSA status) when these counties have HPSA status
(8)
Equation (9) shows the expression of the model excluding the last three terms for County Type C3 (gained HPSA status) when these counties have NonshyHPSA status
(9)
81
7- = + lowast 89- + lowast 1389- + lowast 89- lowast 1389- + lt lowast 13=13gt89- + lt lowast89- lowast 13=13gt89- +
lowast + lowast + -(5)
1389ic 13=13gt8Aic
Final Report Health Practitioner Bonuses
Thus ( + ) in equation (6) shows the estimated average number of claims per physician in HPSA counties (after controlling for other factors) while in equation (7) represents the estimated average number of claims per physician in nonshyHPSA counties Thus captures the persistent difference in the average number of claims between the HPSA and nonshyHPSA counties
On the other hand comparing equation (8) and (9) the model indicates that in counties that gained the HPSA status ( + 82) shows the difference between the estimated average number of claims per physician when the counties have the HPSA status and the average number of claims when they do not have the HPSA status However already captures the persistent difference in the average number of claims between the HPSA and nonshyHPSA counties Therefore the parameter 82 shows the additional impact of HPSA status on the average number of claims per physician in the counties that gained HPSA status If gaining HPSA status encourages physicians to increase the availability of primary care services then we expect 82 to be positive
Similarly equation (10) shows the expression of the model excluding the last three terms for County Type C4 (lost HPSA status) when these counties have HPSA status
Type C4 and HPSA
Dict = + + A1 + A2 (10)
Equation (11) shows the expression of the model excluding the last three terms for County Type C4 (lost HPSA status) when these counties have NonshyHPSA status
Dict = + A1 (11)
Once again comparing equation (10) and (11) the model indicates that in counties that lost the HPSA status ( + A2) shows the difference between the estimated average number of claims per physician when they have the HPSA status and the average claims when they do not have the HPSA status However already captures the persistent difference in the average number of claims between the HPSA and nonshyHPSA counties Therefore the parameter A2 shows the additional impact of HPSA status on the average number of claims per physician in the counties that lost HPSA status If losing the HPSA status induces physicians to decrease the availability of primary care services then we expect A2 to be positive implying higher average claims when the counties had the HPSA status
82
1 = A1( lowast (1 minus )) = 04( lowast (1 minus ))
7 = Fgt(0(1 minus 0)) minus 1 lowast G0
HIJKLIJM13N7JJ = Fgt(1(1 minus 1)) = 7 + 1 lowast G1
Final Report Health Practitioner Bonuses
Appendix D Simulation Methodology
Method of Calculating the Predicted Proportion of Officeshybased Physicians Accepting New Medicaid Patience as a Function of the MedicaidshytoshyMedicare Fee Index
Consider that
I0 is the observed value of the MedicaidshytoshyMedicare fee index 2008
I1 is the new value of the MedicaidshytoshyMedicare fee index (eg I1 could be 1 percent or 10 percent or x percent higher than I0 where x is a chosen value)
P0 is the observed proportion of officeshybased physicians accepting Medicaid patients in 2011
P1 is the predicted proportion of officeshybased physicians accepting Medicaid patients after the x percent increase in MedicaidshytoshyMedicare fee index
M1 is the estimated marginal effect of the MedicaidshytoshyMedicare fee ratio (2008) = 04 (reported in the study)
B1 is the estimated logit coefficient of the MedicaidshytoshyMedicare fee ratio (2008)
Given the fact that marginal is equal to the estimated logit coefficient times P times (1shyP) where P is the mean proportion of officeshybased physicians accepting Medicaid patients in the sample equation (12) shows the estimated logit coefficient of the MedicaidshytoshyMedicare fee ratio (2008)
(12)
Since Decker (2012) reports that P is 0694 this implies B1 is equal to 04(0694(1shy0694)) which is approximately equal to 188
Letrsquos name the part of the estimated logit model which incorporates the effect of other independent variables (other than MedicaidshytoshyMedicare fee ratio) and the intercept term in the model as ldquoOther Effectsrdquo or OE Equation (13) below shows the expression of ldquoOther Effectsrdquo (OE) based on a given value of P0 and a known value of B1 (where ldquolnrdquo is the natural log)
(13)
Then based on the estimated logit model we can predict the logshyodds of the proportion of officeshybased physicians accepting new Medicaid patients for a new value of the MedicaidshytoshyMedicare index (say I1) Equation (14) shows the logshyodds of the proportion of officeshybased physicians accepting new Medicaid patients
(14)
83
1HIJKLIJOH13O13HK13gt = 1 = [1 + X QI(RSTUlowastV ]Z)W
Final Report Health Practitioner Bonuses
Therefore equation (15) shows the implied predicted proportion of officeshybased physicians accepting new Medicaid patients (where ldquoexprdquo is the exponential function operation)
(15)
Example Based on Decker (2012)
(i) The national average of observed proportion of officeshybased physicians accepting Medicaid patients in 2011 (P0) is 0694
(ii) The Observed value of the MedicaidshytoshyMedicare fee index (I0) 2008 is 0742
We have already derived that the logit coefficient of the MedicaidshytoshyMedicare fee ratio (B1) is 188 This implies that OE is approximately 0576 (based on equation (13))
Now consider a 10 percent increase in the MedicaidshytoshyMedicare fee index from the national average in 2008 This implies that the new value of the MedicaidshytoshyMedicare fee index (I1) is 08162
This further implies that the predicted logshyodds of the proportion of officeshybased physicians accepting new Medicaid patients is equal to about 0958 (using equation (14))
Thus using the expression in equation (15) the predicted proportion of officeshybased physicians accepting new Medicaid patients (P1) is equal to 0723 or 723 percent
The same methodology is applied while calculating the predicted proportions for each state and the US in Exhibit 25
84
- Health Practitioner Bonuses and Their Impact on the Availability and Utilization of Primary Care Services Final Report
-
- Table of Contents
- Table of FiguresExhibits
- Acknowledgments
- Executive Summary
-
- Overview
- Key Findings
-
- 1 Impact of the Medicare Incentive Payment for Primary Care Providers (PCIP)
- 2 Impact of the Physician Shortage Area (PSA) bonus
- 3 Impact of the Health Professional Shortage Area (HPSA) Bonus
-
- Conclusions
-
- Introduction and Purpose Of The Study
- Literature Review
-
- A Effect of Earnings on the Supply of Primary Care Services and Providers Role of Medicare Primary Care Bonuses
-
- 1 Effects of Earnings on Specialty Choice by Physicians
- 2 Effects of Earnings on Labor Supply of Health Care Workforce
- 3 Effects of Earnings on the Volume of Primary Care Services
-
- B Financial Incentives for Primary Care Providers in Underserved Areas
- C Impact of the Increase in Medicaid Reimbursement Rate Relative to the Medicare Rate
-
- 1 Systemic Change in Medicaid Reimbursement Rates in All States
- 2 Stateshyspecific Experience on Changes in Medicaid Reimbursement Rates
-
- Conclusions
-
- Modeling the Impact of Medicare Incentive Payment for Primary Care Providers
-
- A Study Design Overview
- B Data Sources and Variables
-
- 1 Main Data Sets
- 2 Trends in Key Outcome Variables
-
- C Econometric Framework
- D Main Results
-
- 1 Impact of PCIP Policy on Number of Eligible Providers
- 2 Impact of PCIP Policy on Number of Claims for EampM Services
- 3 Impact of PCIP Policy on Allowed Charges for EampM Services
-
- Analyzing the Impact of Financial Incentives for Primary Care Providers in Shortage Areas
-
- A Background
- B Impact of the PSA Bonus on Primary Care Supply
- C Impact of the HPSA Bonus on Primary Care Supply
-
- Modeling the Impact of the Increase in Medicaid Reimbursement Rate Relative to the Medicare Rate
-
- A Study Design Overview
- B Simulation Exercise
-
- Conclusions
- Appendices
- Appendix A Bibliography and Literature Matrix
- Appendix B Additional Exhibits
-
- Additional Regression Results
-
- Appendix C Differenceshyinshydifference (DID) Methodology
-
- C1 DID model and derivation for estimating the impact of PCIP policy
- C2 DID model and derivation for estimating the impact of HPSA bonus
-
- Appendix D Simulation Methodology
-
- Example
-

Final Report Health Practitioner Bonuses
Conclusions 59
Appendices 62
Appendix A Bibliography and Literature Matrix 62
Appendix B Additional Exhibits71
Additional Regression Results 78
Appendix C Differenceshyinshydifference (DID) Methodology80
C1 DID model and derivation for estimating the impact of PCIP policy 80
C2 DID model and derivation for estimating the impact of HPSA bonus 80
Appendix D Simulation Methodology83
Method of Calculating the Predicted Proportion of Officeshybased Physicians Accepting New Medicaid Patience as a Function of the MedicaidshytoshyMedicare Fee Index 83
Table of FiguresExhibits
Exhibit 1 Number of Physicians in Residency Programs 9Exhibit 2 Summary of Responsiveness of Specialty Choice to Changes in Earnings
(Earnings Elasticity) 12Exhibit 3 Number of PCIP Recipients under Medicare by Specialty 2011shy2012 23Exhibit 4 Number of Primary Care Providers under Medicare by Specialty 2005shy2011 25Exhibit 5 Total Number of PCIP Eligible EampM Claims submitted by All PCPs under
Medicare by PCP Specialty 2005shy2011 26Exhibit 6 Average Number of PCIP Eligible EampM Claims per PCP under Medicare by
Specialty 2005shy2011 27Exhibit 7 Total Allowed Charges (in million $) for the PCIP Eligible EampM Claims submitted
by All PCPs under Medicare 2005shy2011 28Exhibit 8 Average Allowed Charges ($) for the PCIP Eligible EampM Claims per PCP under
Medicare by Specialty 2005shy2011 29Exhibit 9 Share of Allowed Charges for PCIP Eligible EampM Claims by Specialty2005shy2011 29Exhibit 10 Share of PCIP Eligible EampM Claims by Specialty 2005shy2011 30Exhibit 11 Number of PCIP Eligible EampM Claims and Mean Allowed Charges per Provider
per Year by Types of Claims for Providers with PCIP Eligible Specialty 2005shy2011 32
Exhibit 12 Number of PCIP Eligible EampM Claims and Mean Allowed Charges per Providerper Year by Types of Claims for Providers with PCIP NonshyEligible Specialty 2005shy2011 33
Exhibit 13 Impact of Medicare PCIP on the Number of PCPs with Medicare Claims for PCIPEligible Services (2005shy2011) 34
Exhibit 14 Impact of Medicare PCIP on the Number of Providers Accepting New Medicare Patients and the Number of New Primary Care Providers under Medicare with Claims for PCIP Eligible Services (2005shy2011) 36
Exhibit 15 Impact of Medicare PCIP Policy on PCIP Eligible EampM Claims (2005shy2011) 38Exhibit 16 Impact of Medicare PCIP Policy on Allowed Charges for PCIP Eligible EampM
Claims (2005shy2011) 39Exhibit 17 Estimated Impact of Medicare PCIP Policy on the Number of PCIP Eligible EampM
Claims (2005shy2011) 41
ii
Final Report Health Practitioner Bonusesshy
Exhibit 18 Estimated Impact of Medicare PCIP on the Allowed Charges for PCIP Eligible EampM Claims (2005shy2011) 42
Exhibit 19 Distribution of Primary Care (PC) Providers by HPSA and PSA Regions 45Exhibit 20 Distribution of the Number of Internal Medicine and Family Practice Physicians
by HPSA and PSA regions 46Exhibit 21 Impact of PSA Bonus on the Number of EampM Claims under Medicare 2005shy
2010 48Exhibit 22 Impact of PSA Bonus on the Number of Primary Care Providers per County
(2005shy2010) 49Exhibit 23 Impact of HPSA Bonus on the Number of EampM Claims and Allowed Charges per
Physician under Medicare 2007shy2010 51Exhibit 24 MedicaidshytoshyMedicare Fee Index 55Exhibit 25 Proportion of US Officeshybased Physicians Accepting New Medicaid Patients 57Literature Matrix 66Exhibit B1 Distribution of Primary Care Providers with PCIP Eligible Specialty by Age Sex
and Year 71Exhibit B2 Average Number of PCIP Eligible EampM Claims per PCP under Medicare by
Specialty 2005shy2011 71Exhibit B3 Average Allowed Charges ($) for the PCIP Eligible EampM Claims per PCP under
Medicare 2005shy2011 72Exhibit B4 Proportion of PCIP Eligible EampM Claims per 2011 PCIP Recipients by Specialty
2005shy2011 72Exhibit B5 Average Number of PCIP Eligible EampM Claims per 2011 PCIP Recipients under
Medicare by Specialty 2005shy2011 72Exhibit B6 Average Allowed Charges for the PCIP Eligible EampM Claims per 2011 PCIP
Recipients under Medicare 2005shy2011 73Exhibit B7 Proportion of Allowed Charges for PCIP Eligible EampM Claims per 2011 PCIP
Recipients 2005shy2011 73Exhibit B8 Distribution of the Number of NPs and PAs across HPSA and PSA regions 74Exhibit B9a Distribution of Male Primary Care Physicians with PCIP Eligible Specialty by
Age and Year 74Exhibit B9b Distribution of Female Primary Care Physicians with PCIP Eligible Specialty by
Age and Year 75Exhibit B10 Distribution of Male Primary Care NonshyPhysicians with PCIP Eligible Specialty
by Age and Year 75Exhibit B11 Distribution of Female Primary Care NonshyPhysicians with PCIP Eligible
Specialty by Age and Year 76Exhibit B12 Average Number of PCIP Eligible EampM Claims Submitted by 2011 PCIP
Recipients 2005 ndash 2011 76Exhibit B13 Allowed Charges for PCIP Eligible EampM Claims per 2011 PCIP Recipients
2005shy2011 77Exhibit B14 Total Number of PCIP Eligible EampM Claims submitted by All Providers in the
Control Group 2005shy2011 77Exhibit B15 Impact of Medicare PCIP Policy on the Number of Primary Care Providers Who
Have submitted any Medicare Claims (not necessarily under PCIP Eligible Services) (2005shy2011) 78
Exhibit B16 Impact of Medicare PCIP Policy on the Number of Primary Care Providers WhoMet 60 PCIP Eligibility Threshold Each Year (2005shy2011) 79
iii
Final Report Health Practitioner Bonuses
Acknowledgments Paul Hogan Brighita Negrusa PhD and Projesh Ghosh PhD contributed to this report We benefited greatly from discussions with members of our technical expert panel We also gratefully acknowledge the input from Caroline Taplin the ASPE Project Officer and her colleague Donald Cox This study was conducted by The Lewin Group under contract number HHSP23320095639WC task order number HHSP23337019T with the HHSrsquos Office of the Assistant Secretary for Planning and Evaluation The authors take full responsibility for the accuracy of material presented herein The views expressed are those of the authors and should not be attributed to ASPE or HHS
iv
Final Report Health Practitioner Bonuses
Executive Summary
Overview
In this study funded by The Assistant Secretary for Planning and Evaluation (ASPE) we analyze the impact of three different health practitioner incentives on the supply of primary care services (1) the Medicare primary care incentive payment (PCIP) (2) the physician shortage area (PSA) bonus and (3) the health professional shortage area (HPSA) bonus Section 5501(a) of The Affordable Care Act authorized a quarterly incentive payment program to augment the Medicare payment for primary care services when furnished by primary care practitioners beginning in 2011 and ending in 2015 Medicare has been paying a HPSA bonus since 1987 Initially the HPSA bonus was paid to physicians providing care in rural geographic HPSAs in 1991 it was extended to services provided by physicians in urban geographic HPSAs Subsequently section 413a of the Medicare Modernization Act put in place an additional 5 percent bonus payment for physicians practicing in PSAs PSAs were those counties and rural zip codes in MSAs with the lowest physician to population ratios The purpose of these incentives is to increase the supply of provider services both in general and for evaluation and management (EampM) in particular In the case of the PCIP it is to increase the supply of primary care services in Medicare In the case of the PSA and HPSA bonuses it is to increase the supply of services in certain locations designated as underserved
We first consider the PCIP program Under the PCIP program eligible providers in designated primary care specialties are offered a 10 percent reimbursement premium for primary care services The study addresses the following broad empirical issues surrounding the Medicare PCIP program
Experience to date with the Medicare primary care incentive payment in terms of the aggregate number of recipients and the distribution of those recipients by specialty and by geographic area
Proportion of primary care providers who qualify for the bonus and the characteristics of those primary care providers
Volume of eligible claims submitted by the PCIP eligible providers and the impact of Medicare PCIP policy on the primary CARE services provided and other outcome measures of interest
To explore these topics we used a customized data set constructed at the provider level This data set included all the claims submitted by the entire universe of Medicare providers each year from 2005 to 2011 Subsequently each provider was linked by National Provider Identification number (NPI) to Provider360 data (available from Lewin Grouprsquos parent company Optum Inc) and the AMA Physician Master File to add provider characteristics such as provider demographics (eg age gender) provider designation medical school and practice location We also added geographic locationshyspecific variables from the Area Resource File (ARF) based on the practice location information of providers The main advantage of this pooled data set is the ability to track providers over time and capture changes in their volume of services in response to financial incentives
We use a differenceshyinshydifference (DID) approach to identify the effect of the financial incentives associated with the Medicare PCIP policy on key outcomes of interest This method entails (1) inclusion of a treatment group which is likely to be affected by the PCIP policy and a relevant comparison group not likely to be affected by the policy (2) controls for yearshyspecific effects
1
Final Report Health Practitioner Bonuses
common to both groups and (3) an interaction of the treatment group and the year effects to capture the distinct impact of the policy on the treatment group The model also controls for provider demographics and regional characteristics One advantage of the DID estimation approach is that it enables us to disentangle the net impact of the 10 percent PCIP policy from changes that coincided with the PCIP policy affecting both the treatment and comparison group
Policy makers have long been concerned about patient access to health care particularly primary care in underserved or shortage areas We also focus on two additional financial incentive programs Health Professionals Shortage Area (HPSA) bonus and Physician Shortage Area (PSA) bonus implemented in an attempt to improve access in shortage areas These programs offer a higher rate of reimbursement in Medicare for eligible providers should they provide services in designated shortage areas More specifically we examine the following issues surrounding HPSA and PSA bonus
The distribution of HPSA bonus recipients the overlap between HPSA and Medicare primary care incentive payment (PCIP) and the overlap between the HPSA and PSA bonus recipients
Impact of HPSA bonus on the number of primary care providers and subsequent impact on the volume of primary care services
Impact of PSA bonus on the number of primary care physicians and subsequent impact on the volume of primary care services
Finally we examine the existing evidence from the literature on the variation in Medicaid reimbursement rates relative to the Medicare rates to inform the impact of the Medicaid parity provision in the ACA We describe the variation in Medicaid reimbursement rates relative to the Medicare rates both for primary care and for all services across US states during the period 2008shy2012 Based on the empirical results from the PCIP analysis we perform an exercise to simulate the effect of a 10 percent increase in the MedicaidshytoshyMedicare fee index on the proportion of US officeshybased physicians accepting new Medicaid patients across all states
Key Findings
1 Impact of the Medicare Incentive Payment for Primary Care Providers (PCIP)
Number of Medicare Providers
Our estimates suggest that the number of Medicare providers with a PCIP bonusshyeligible specialty and at least one PCIP eligible claim increased annually by about 28 providers per county per year due to the Medicare PCIP bonus policy This represents a sizeable increase of almost 19 percent since there were about 15 providers per county per specialty per year under a PCIP bonus eligible specialty during the 2005shy2011 period When restricted to primary care physicians with a PCIP eligible specialty the estimated increase in the number of physicians is approximately 10 percent in response to the PCIP policy (ie elasticity of the number of primary care physicians with respect to the payment is about 1)1
1 The increase in the number of physicians with a PCIP eligible specialty attributable to the policy is about 2 per
county per year This is almost 10 percent of the average number of primary care physicians in a given PCIP eligible specialty per county per year (average is almost 19) Therefore given that PCIP policy provides 10
2
Final Report Health Practitioner Bonuses
Evaluation amp Management (EampM) Eligible Claims
The estimated impact of the PCIP policy on the volume of primary care services measured by the volume of claims is somewhat mixed
More specifically there were more PCIP eligible EampM claims submitted per provider in a particular claim type 25 minute office visits for established patients Specifically on average there was a 7 percent increase in the number of 25 minute office visits claims due to the PCIP policy Thus the implied elasticity of the number of 25 minute office visits with respect to the incentive payment is about 07 Hence it appears that the PCIP may have induced a substitution toward slightly longer visits for established patients
For PCIP eligible EampM claims in general the estimates from the DID model indicate that on average primary care providers with PCIPshyeligible specialties submitted fewer claims (per provider per year) related to PCIPshyeligible EampM services in response to the Medicare PCIP policy23
The positive impact of the PCIP bonus policy on the volume of EampM claims associated with 25 minute office visits for established patients is much stronger for providers near the PCIP eligibility threshold4 For the primary care providers near the PCIP eligibility threshold there was almost a 15 percent increase in the number of claims for 25 minute visits due to the PCIP policy
Allowed Charges for EampM Services
We estimated no significant incentive payment impact on allowed charges per provider for the full sample of providers However for the sample of providers who were near the PCIP eligibility threshold in 20095 we found that per provider charges increased by about $5611 annually in response to the policy This estimated effect represents about 93 percent of the mean allowed charges ($60235) per provider per year (ie the implied elasticity of allowed charges which do not include the bonus payment with respect to the payment is about 093)
percent incentive payment the implied elasticity of the number of physicians in PCIP eligible specialty with respect to the payment is about 1
2 Not all primary care providers are eligible for Medicare primary care incentive payments In summary primary care
physicians (with internal medicine family practice pediatrics and geriatrics specialty) who have at least 60 percent of the practitionerrsquos allowed charges under the Medicare physician fee schedule (excluding hospital inpatient care and emergency department visits) are for primary care services The PCIP eligible primary care services are defined by specific EampM codes Medicare PCIP is also provided to physician assistants nurse practitioners and clinical nurse specialists who also meet the similar eligibility criteria
3 Note that total eligible claims increased Claims per provider declined potentially because additional providers
were induced to submit eligible claims 4
For the purpose of our analysis we consider the primary care physicians (with the PCIP eligible specialty) who have 50 percentshy65 percent of their services for PCIP eligible EampM services (defined by specific EampM codes) to be near the eligibility threshold We apply the similar method to select nonshyphysicians (physician assistants nurse practitioners and clinical nurse specialists) near the eligibility threshold
5 The determination of the eligibility of providers in the first year (2011) of the PCIP is based on the extent of their
PCIP eligible services in 2009 Besides the announcement of the PCIP program was made in 2010 Thus we assumed that the providers with Medicare PCIP eligible specialties would be potentially responsive to the PCIP program as early as year 2010 and alter their behavior Subsequently it is more meaningful to examine providers who were near the PCIP eligibility threshold in 2009 which is the year just before the policy effect is expected to influence
3
Final Report Health Practitioner Bonuses
2 Impact of the Physician Shortage Area (PSA) bonus
Number of Medicare Providers
The number of providers with PSA bonusshyeligible specialties was estimated to increase by about 1 in PSA areas during the PSA period compared to the number of providers in nonshyPSA areas This represents a sizeable increase as there were about 6 primary care providers on average in PSA areas
EampMshyEligible Claims
We found that on average physicians with bonusshyeligible specialties who were located in PSA areas were estimated to have about 50 more claims submitted per year during the PSA period compared to providers with the same specialty who were located in nonshyPSA areas Given that these physicians have on average about 644 claims per year for primary care EampM services the impact of PSA bonus is not negligible
Allowed Charges for EampM Services
Our estimates indicate that on average physicians with PSA bonusshyeligible specialties located in PSA areas did not experience a statistically significant increase in total annual allowed charges per provider per year for EampM services compared to those in nonshyPSA
6 areas
3 Impact of the Health Professional Shortage Area (HPSA) Bonus
EampM Eligible Claims
We focused only on the behavior of primary care physicians who are eligible for a HPSA bonus We found that on average Medicare primary care physicians tend to submit about 17 more EampM claims annually specifically due to the gain of full HPSA status7
Allowed Charges for EampM Services
Medicare primary care physicians who are located in counties that ever lost primary care HPSA status tend to have about $1380 more allowed charges annually before the location lost full HPSA status
Conclusions
The Affordable Care Act includes two key provisions regarding reimbursement to primary care providers ) (a) it provides a 10 percent incentive payment under the Medicare PCIP program to eligible providers (effective January 1 2011) and (b) it raises the Medicaid primary care reimbursement rate at least up to 100 percent of the Medicare rate
We find that as a result of the Medicare incentive payment the number of Medicare PCPs has increased on average by about 28 providers per county annually in 2010 and 2011 Also the number of primary care physicians with PCIP eligible specialty increased by about 10 percent in
6 Although the number of EampM claims went up due to the PSA bonus it may be that within EampM services some
services experienced an increase in allowed charges due to the PSA bonus while others experienced a decrease accounting for the overall lack of impact
7 Health Resource and Services Administration (HRSA) publishes Area Health Resource File (ARF) that includes
HPSA status for each county within the US For the purpose of our analysis we focus on primary care HPSA status The ARF data classifies counties as full primary care HPSA if the whole county is considered as a HPSA
4
Final Report Health Practitioner Bonuses
response to the 10 percent incentive payment under the PCIP policy (ie elasticity of the number of primary care physicians with respect to the incentive payment is about 1) Eligible claims for some types of PCIP eligible EampM services and associated allowed charges have also increased For example on average there was a 7 percent increase in the number of claims for 25 minute office visits due to the PCIP policy On the other hand in response to the PCIP policy there was a 93 percent increase in the average allowed charges (for eligible services) among primary care providers with PCIP eligible specialties
The reader should exercise some caution in interpreting these results however The behavioral response to the PCIP was observed in our data only for one year The relatively short period may have resulted in insufficient time for a full provider behavioral response In addition the legislation provided for a program of only limited duration Some providers may have chosen explicitly or implicitly not to change their behavior for a program of limited duration
In addition we find that Medicare providers were attracted to PSA areas through the PSA bonus and submitted 78 percent more EampM claims annually during the PSA period Gaining HPSA status also generated an additional 17 EampM claims submitted by primary care physicians with HPSA bonusshyeligible specialties
The reader is again encouraged to exercise some caution in interpreting the results for the PSA bonus Because the criteria for the bonus include the actual supply of providers there is a risk that the results may be biased Though the methods we employ attempt to minimize the potential impact of this type of bias we cannot be completely sure that the results are unaffected by this
Finally we document the variation in Medicaid reimbursement rates relative to the Medicare rates both for primary care and for all services across US states during the period 2008shy2012 using the existing body of evidence Using the empirical results from our PCIP analysis we also perform an exercise to simulate the effect of a 10 percent increase in the MedicaidshytoshyMedicare fee index on the proportion of US officeshybased physicians accepting new Medicaid patients across all states The simulation suggests that a 10 percent increase in MedicaidshytoshyMedicare fee ratio would increase the US average of officeshybased primary care physicians accepting new Medicaid patients from 662 percent to 728 percent Again however caution is warranted in a literal interpretation of this result as it is based on an extrapolation from a different program
Introduction and Purpose Of The Study The Assistant Secretary for Planning and Evaluation (ASPE) has contracted with The Lewin Group to examine the role of physician bonus and supplemental payment programs in increasing the supply of primary care providers (PCP) and the access of patients to their services
The Congressional Budget Office has estimated that the implementation of the Patient Protection and Affordable Care Act (ACA) of 2010 will increase the number of nonelderly people who have health insurancemdashby about 13 million in 2014 20 million in 2015 and 25 million in each of the subsequent years through 2024 (CBO 2014)8 Because those with insurance typically use more services than those without insurance this increase in coverage will most likely result in additional pressure on a health care delivery system9 To address
8 CBO Report (February 2014) httpwwwcbogovsitesdefaultfilescbofilesattachments45010shybreakoutshy
AppendixBpdf 9
Manning WG Newhouse JP Duan N Keeler EB Benjamin B Liebowitz A et al (1988) Health insurance and the demand for medical care Evidence from a randomized experiment Santa Monica CA RAND Corporation
5
Final Report Health Practitioner Bonuses
concerns about maintaining an adequate supply and distribution of primary care services the ACA includes provisions that provide temporary financial incentives to primary care providers
1 Section 5501 provides that from January 1 2011 through December 31 2015 under Medicare eligible primary care practitioners will receive a 10 percent supplemental payment for primary care services they provide as defined by existing Evaluation and Management (EampM) codes under the new Medicare Primary Care Incentive Program (PCIP)
2 Section 1202 of the Act provides that for the period January 1 2013 to December 31 2014 under Medicaid primary care services provided by primary care physicians must be paid at rates no less than Medicare rates for primary care physicians
The Medicare primary care incentive payment is available to the eligible primary care practitioners for services provided under selected categories of EampM codes An eligible primary care practitioner is a physician nurse practitioner clinical nurse specialist or physician assistant who satisfies the following criteria (i) enrolled in Medicare with primary specialty designation of family practice internal medicine pediatrics and geriatrics and (ii) at least 60 percent of the practitionerrsquos allowed charges are for primary care services10 This temporary 10 percent incentive payment is made on a quarterly basis PCIP recipients with a family medicine Medicare specialty designation received an average incentive payment of $3450 ($212987540 61728) during the first year of the program11 This payment is equivalent to a two percent ($3450$201512) increase in annual income 12
In addition Medicaid payment rates for primary care services delivered by primary care physicians must be no less than Medicare rates for the same services in 2013 and 201413
Given the variability of Medicaid payments across states this could be a substantial boost in payments for physicians in some states and less so in others Medicare has been providing bonus payments to physicians in designated shortage areas to make these areas more attractive for physician practices The Health Professional Shortage Area (HPSA) bonus and the Physician Shortage Area (PSA) bonus are specifically intended to address the geographic distribution of physicians
The main purpose of this report is to present the key findings from our examination of the proposed research questions the main data sources used for the empirical analysis the methodologies used to identify the impact of payment incentives and detailed discussion of our analytical findings
10shyAllowed charges refer to all charges under the physician fee schedule excluding hospital inpatient care drug laboratory and emergency department visits (source httpwwwcmsgovMedicareMedicareshyFeeshyforshyServiceshyPaymentPhysicianFeeSchedDownloadsPCIPshy2011shyPaymentspdf)
11shySource httpwwwcmsgovMedicareMedicareshyFeeshyforshyServiceshyPaymentPhysicianFeeSchedDownloadsPCIPshy2011shyPaymentspdf
12shyACA Medicare PCIP Practitioners (MDs and Non‐MDs) with primary care specialty designation meeting a threshold of 60 percent of primary care serviceswill receive 10 percent bonus on the Medicare paid amount from CY 2011 to CY 2016 $558 million in 2011 translates to an average of 2 percent increase in annual income for primary care physicians
13shyThe Administration is proposing to extend this payment through Calendar Year 2015 and make it available to primary care nurse practitioners and physician assistants who practice independently (add citation to 2015 Budget in Brief when it becomes available)
6
Final Report Health Practitioner Bonuses
The report covers the three main categories of the empirical analysis
1 Examine the magnitude and the distribution of Medicare primary care incentive payments and quantitatively estimate the impact of the bonus on the supply of PCPs and their services
2 Assess the geographic distribution of HPSA bonus recipients understand the overlap between HPSA and Medicare primary care incentive payment (PCIP) and overlap between the HPSA and PSA bonus recipients and quantitatively estimate the impact of the bonuses on the supply of PCPs and their services
3 Explore any evidence of the impact of changes in state Medicaid primary careshyreimbursement rates on the supply of primary care servicesshy
A substantial portion of the empirical undertaking entailed analyzing existing Medicare claims data to understand the magnitude of these supplemental payments under Medicare and to estimate their impact on the supply of PCPs and their services In this report we provide a detailed description of the data we use our analytical approach and a thorough discussion of our analytical findings The discussion in the report is organized as follows section II presents findings from the review of relevant existing literature in section III we lay out the empirical methodology and main evidence related to the impact of the Medicare 10 percent primary care incentive payment section IV describes the empirical analysis of the HPSA and PSA bonuses section V presents the findings regarding the impact of higher primary care physician fees under Medicaid finally section VI is the conclusion
Literature Review The Lewin Group has reviewed the existing key health and labor economics literature for evidence regarding the potential impact of financial incentives on the supply of health care providers and services The objectives of the literature review were to (1) document the likely quantitative range of the effects of earnings increases (in the form of bonuses or other financial incentives) on the supply of primary care providers and services nationally or in underserved areas and (2) explore the likely impact of the increase in Medicaid reimbursement rates for primary care providers on the volume of these providers and their services under Medicaid This work can contribute to the broader understanding of provider behavior and the type and level of financial incentives that are likely to achieve the desired supply responses
The literature that directly examines the Medicare bonuses and resultant impact on the supply of primary care providers and services is very limited To address this limitation we expand our focus to include the labor economics literature This broadened search then includes studies that address the behavioral impact of earnings on medical workforce In what follows we discuss the major findings from the existing literature on the effects of financial incentives (such as Medicare bonuses and increased Medicaid reimbursement rates) on primary care workforce and services Overall the scope of the literature review can be classified under the following categories
1 Effects of earnings on (a) specialty choice by physicians (b) the labor supply of physicians and nurses in terms of work hours and labor force participation and (c) the volume of services
2 Effects of financial incentives on the supply and retention of primary care providers in designated underserved areas (HPSAPSA) and statesrsquo experiences thereof
7
Final Report Health Practitioner Bonuses
3 Impact of increases in Medicaid reimbursement rates on the supply of primary care providers and the volume of patient care under Medicaid on a state by state basis as well as systemic effects
There is considerable concern regarding a potential future primary care physician shortage and potential constriction of access to primary care The availability of primary care is particularly important for public payer programs such as Medicaid and Medicare A recent Medicare Payment Advisory Committee (MedPAC) data book indicates that six percent of Medicare beneficiaries were looking for a new primary care physician in 2011 In addition among those who tried to get an appointment with a new physician in 2011 35 percent reported having difficulties14
It is worth noting that several studies (Bodenheimer et al 2007 Vaughn et al 2010) illustrated the large income gap between primary care providers and other specialties Therefore whether a very small increase in annual income through the Medicare PCIP would significantly influence provider behavior remains unclear In addition the time limited nature of the provisions may prove to be a major deterrent to a change in provider behavior Any evidence around time‐limited bonus programs will likely show only a partial behavioral response from the targeted population Lower bound take up rates should be expected in these programs because medical students and early career providers are unlikely to base career choices on temporary policy changes
Historically the Medicaid program has reimbursed physicians at a much lower rate than Medicare paying just 66 percent of Medicare rates on average (Cunningham 2011) Cunningham (2011) also documents that due to the low Medicaid reimbursement rates in several states fewer physicians accept Medicaid patients In 2013 and 2014 ACA increases Medicaid reimbursement rates for certain services provided by primary care physicians to 100 percent of Medicare rates Given the variability of Medicaid payments across states this will be a substantial boost in payments for physicians in some states and less so in others Current differential payment levels across states and any changes in payments over time can be exploited to examine the effect of raising Medicaid primary care reimbursement rates on the provision of primary care providers and services
The discussion of the literature review is organized as follows section A reviews the literature on the effect of earnings on the supply of primary care providers and services section B discusses the evidence regarding the impact of financial incentives for primary care providers in underserved areas section C examines the empirical evidence on the impact of stateshyspecific changes in Medicaid reimbursement rates and section D concludes with a summary of the major findings from the literature and their implications for understanding the allocative effects of bonus payments and other financial incentives
A Effect of Earnings on the Supply of Primary Care Services and Providers Role of Medicare Primary Care Bonuses
The ACA stipulates multiple programs with the aim of increasing the supply and utilization of primary care services These programs all operate on the assumption that financial incentives specifically directed toward increased earnings are an effective way to promote an increase in primary care services and primary care providers While these assumptions are based upon established economic theory the evidence as to the programsrsquo effectiveness in practice is mixed
14 MedPAC ldquo A Data Book Health Care Spending and the Medicare Programrdquo June 2012 p 97
8
Final Report Health Practitioner Bonuses
While there is general consensus that expected earnings are a key driver of medical specialty choice (Bazzoli 1985 Nicholson and Propper 2011 Nicholson 2002 Vaughn et al 2010) the evidence regarding the effectiveness of programs designed to attract medical students in certain specialties is inconclusive Vaughn et al (2010) argue that programs designed to affect the number of medical students choosing primary care have largely failed while others (Fournier amp Henderson 2005 Lynch 1998 Ramsey 2001) argue that these programs have had a wide range of results that can be attributed to each programsrsquo individual composition
The effect of earnings on labor supply in relation to the healthcare workforce is also a complex issue There is wide consensus that increased earnings lead to an increase in the labor supply of health services providers (Askildsen and Baltagi 2002 Baltagi 2005 Rizzo and Blumenthal 1994) but the reported magnitude of this increase in labor supply varies widely Values reported for the wage elasticity of the primary care labor supply range from 023 to 08 Furthermore the effect of income on retirement decisions of physicians is not well understood
Finally the effect of earnings on the volume of primary care services is a related but distinct issue Much like its counterparts the effect of earnings on the volume of services is recognized to be significant and positive but reported effects range widely from a 10 percent reduction in Medicare fees leading to 18 percent to 66 percent reduction in the volume of office visits to 10 percent higher fees for primary care services raising the primary care EampM visits by 88 percent (Hadley et al 2009 Reschovsky et al 2012)
1 Effects of Earnings on Specialty Choice by Physicians
While the estimated effect of earnings on specialty choice is present and significant the magnitude of this income effect and its relative importance as compared to other factors in deciding a specialty is contentious Recent data from the residency match program in the US reveals that among 16875 US Medical school senior applicants in 2012 about 355 percent were matched to primary care specialties such as internal medicine family practice and pediatrics15 In 2010 the proportion matched to primary care (internal medicine family practice and pediatrics) was 341 percent of 16427 US Medical school senior applicants 16 Between 1995 and 2006 the total number of physician residents in the US in primary care training programs increased by 6 percent from 38753 to 40982 (Exhibit 1) Physician residents in specialty care increased by about 8 percent during the same period
Exhibit 1 Number of Physicians in Residency Programs17
Type of Resident Number of Resident Physicians
Percentage Change 1995 2006
Primary Care Residents 38753 40982 575
Specialty Care Residents 59282 63897 778
All Physician Residents 97416 104526 730
15 Source NRMP Results and Datashy2012 Main Residency Match (httpwwwnrmporgdataresultsanddata2012pdf)
16 US Medical school seniors who are matched into internal medicine can subspecialize later on in nonshyprimary care
specialty such as cardiology endocrinology oncology etc 17
Steinwald B Primary Care Professionals Recent Supply Trends Projections and Valuation of Services Statement in Testimony before the Senate Committee on Health Education Labor and Pensions Washington (DC) GAO 2008 Available from httpwwwgaogovnewitemsd08472tpdf
9
Final Report Health Practitioner Bonuses
Nicholson and Propper (2011) argue that the rate of return to medical training and specialization is the key driver of choosing medical occupation and the choice of specialty within the area of medicine The gap in median income between primary care physicians and specialists is wellshypublicized For instance using crossshysectional earnings data from 2008 Vaughn et al (2010) report that the average primary care physician could expect to earn $25 million over his lifetime net of income taxes living expenses and education costs versus $52 million for a cardiologist Berenson et al (2007) report that according to the Medical Group Management Association (MGMA) between 2000 and 2004 median physician income for all primary care increased by 99 percent while average incomes of all nonshyprimary care specialists increased by 158 percent Arguably given the income gap raising the payment rate for primary care services relative to other services would impact the number of primary care physicians and raise the amount of primary care services they provide Moreover if the reimbursement rates vary by geographic region this strategy can also affect the geographic distribution of services of primary care services
In a related study Bodenheimer (2007) attempts to explain this disparity in incomes The author notes that the ResourceshyBased Relative Value Scale which was initially designed to reduce the inequality between fees for office visits and for procedures has failed to reduce the primary carendashspecialty income gap He finds that this failure is due to four factors (1) the volume of diagnostic and imaging procedures has increased more rapidly than the volume of office visits (2) the process of updating the relative values units (RVUs) 18 associated with covered procedures is heavily influenced by the recommendations of the Relative Value Scale Update Committee (RUC) a majority of whose membership are specialists (3) Medicarersquos formula for controlling physician payments penalizes primary care physicians and (4) private insurers tend to pay for procedures at higher rates than office visits relative to Medicare They conclude that the program was designed with the correct motives but ultimately was weak and cannot achieve its purpose as currently formulated Furthermore incentives that favor specialists remain in the private market
Nicholson (2002) also provides econometric evidence that the disparity in the expected earnings between primary care and other specialties has a significant influence on medical studentsrsquo decisions to choose primary care or another specialty He observes that there is a persistent excess supply of residents to most specialties with relatively high lifetime earnings and a persistent excess demand for residents in primary care with relatively low lifetime earnings His main contribution is to examine how differences in expected earnings affect the number of students who desire to enter a specialty rather than the number who actually enter the specialty The study finds that the income elasticity ranges from 103 in family practicepediatrics to 220 in radiology19 In other words a 1 percent increase in the lifetime earnings of primary care providers such as family practitioners will increase the number of students ranking family practice as the most preferred choice by 1 percent which can be translated into an increase of equal magnitude in the supply of family practitioners
18 RVU is a key component of the formula used under Medicare Physician Fee Schedule (PFS) to calculate payment
rates for an individual service There are three different RVUs work RVU practice expense (PE) RVU and malpractice (MP) RVU Work RVU reflects the relative time and intensity associated with Medicare PFS service PE RVU reflects the costs of maintaining a practice and MP RVU reflects the cost of malpractice insurance Source httpwwwcmsgovOutreachshyandshyEducationMedicareshyLearningshyNetworkshyMLNMLNProductsdownloadsmedcrephysfeeschedfctshtpdf
19 Earlier studies of JW Hay (ldquoPhysiciansrsquo specialty choice and specialty incomerdquo Econometrics of Health Care
edited by G Duru and J Paelinck Netherland Klwer Academic 1991) and J Hurley (ldquoPhysician choices of specialty location and moderdquo Journal of Human Resources No 26 1991 pp 47shy71) did not account for uncertainty in entry to a specialty However they find that medical students are substantially responsive to expected income These studies report income elasticities that range from 1 to 3
10
Final Report Health Practitioner Bonuses
However there are studies that report comparatively less impact of expected earnings on the decision to choose primary care Bazzoli (1985) found that medical students are more likely to choose primary care when the expected earnings are relatively large but the effect is quite small More specifically a $10000 (about 20 percent of the mean earnings in 1981) increase in the expected earnings in primary care relative to the nonshyprimary care yields a 14 percentage point increase in the probability of choosing primary care
Gagne and Leger (2005) have studied the specialty choice decision of Canadian physicians who practiced between 1989 and 1998 They find that a 91 percent reduction in relative feeshypershyconsultation for a general practitioner in Quebec and Saskatchewan for example would lead to a 04 percent reduction in the proportion of medical students entering general practice The largest response is observed in Manitoba where the proportion of medical students entering general practice is estimated to decrease by 229 percent as a result of a 91 percent reduction in relative feeshypershyconsultation The implied responsiveness of specialty choice to changes in earnings from this study and from other studies discussed in this section is summarized in Exhibit 2
Vaughn et al (2010) bolster this point by noting that programs designed to affect the number of medical students choosing primary care have largely failed because of the programsrsquo inability to affect relative incomes By estimating career wealth accumulation across specialists primary care physicians physician assistants business school graduates and college graduates the authors try to elucidate the true difference between payment of physicians and nonshyphysicians and between specialists and generalists within the physician group They note that this result is to be expected as programs have done little and continue to do little to affect the disparity in expected lifetime earnings between primary care physicians and specialists The authors also find that for a primary care physicianrsquos lifetime earnings to equal those of a cardiologist the primary care physician would have to receive a bonus of $11 million upon completion of medical school
Sivey and Scott (2012) use an econometric approach to address the question of the effect of lifetime earnings on training specialty choice based on a sample of Australian postgraduate doctors Using a generalized multinomial logit model the authors find a statistically significant positive impact of earnings on the probability of choosing general practice training versus specialty training Subsequently they use the same model to simulate the effect of a $50000 increase in annual earnings of general practitioners (GPs) on the probability of junior doctors choosing GP training Specifically the simulation result suggests that $50000 additional earnings for GPs (a 278 percent increase over their current salary of $180000) would lead to a 263 percent increase in the propensity of junior doctors to choose GP training Therefore the implied earnings elasticity of the propensity to choose GP training is 095 which is consistent with previous findings (Nicholson 2002)
11
Final Report Health Practitioner Bonuses
Exhibit 2 Summary of Responsiveness of Specialty Choice to Changes in Earnings (Earnings Elasticity)
StudyArticle Description Earnings
Elasticity
Nicholson (2002) Elasticity of ranking Family Practice Pediatrics as the 1
st specialty choice with
respect to lifetime earnings (among US medical school residents) 103
Nicholson (2002) Elasticity of ranking Radiology as the 1
st specialty choice with respect to lifetime
earnings (among US medical school residents) 220
Gagne and Leger (2005)
Elasticity of proportion of medical students (in 8 Canadian provinces) entering General Practice with respect to relativeshyfeeshypershyconsultation
0044 to 025
Sivey and Scott (2012)
Elasticity of probability of junior doctors (in Australia) choosing General Practice with respect to annual earnings
095
Hogan and Bouchery (2010)
Elasticity of percentage of male US medical school Internal Medicine graduates choosing Cardiology subspecialty with respect to annual compensation
250
Note earnings elasticity gives the percentage change in the outcome measure of interest (eg proportion ofshystudents ranking family practice or radiology as the 1
st choice) due to 1 percent change in earningsshy
In an unpublished piece Hogan and Bouchery (2010) estimate a multinomial logit model of the choices of internal medicine residents to remain in internal medicine and practice primary care or to obtain a fellowship for further training in one of nine subspecialties of internal medicine and ultimately practice in that subspecialty20 The authors find that a 1 percent increase in earnings from one of the career paths holding earnings in other specialties constant increases entrants of male US medical graduates into that the examined specialty (Cardiology) by about 25 percent but increases female entrants by about only 03 percent They also find that increases in the length of additional training required for a subspecialty have a negative effect on the number of US medical graduates pursing that subspecialty and reduces the probability that US medical graduates pursue the specialty but increases the probability that international medical school graduates pursue that subspecialty21
Expected lifetime earnings are not the only factor that influences decision making during specialty choice Medical students assign a low level of prestige to a primary care career compared to other specialties Students surveyed associate primary care with low income expectation low class rank and high educational debt (Henderson 1996) Students often enter medical school with a positive perception of primary care but by the time they reach their fourth year they are increasingly likely to disagree with the assertions that primary practice is prestigious adequately compensated and allows more control over working hours (Lynch 1998) It appears that studentsrsquo positive perceptions concerning primary care may change as they experience the more realistic professional demands on primary care physicians that can develop during medical school and as they observe their peers and role models both within primary care and outside
20 Paul F Hogan and Ellen Bouchery ldquo A Model of Subspecialty Choice for Internal medicine Residentsrdquo prepared by
The Lewin Group for the American College of Cardiology 2010 21
After simulating the impact of decreasing cardiology training requirements from three years to two the study finds that oneshyyear decrease in training requirements would increase the percentage of male US medical school graduates choosing cardiology from 171 percent to 182 percent
12
Final Report Health Practitioner Bonuses
2 Effects of Earnings on Labor Supply of Health Care Workforce
Consistent with the economic theory a large number of studies find evidence in support of a positive correlation between earnings and the labor supply of the health care workforce This is in contrast to much earlier studies that relied only on aggregate time series data on physician services and fees to conclude that physician labor supply functions were backwardshybending and physicians responded negatively to wage increases22 For instance Steiger et al (2010) observe that inflationshyadjusted physician fees (weighted average of Medicare and private sector fees) decreased substantially between 1995 and 2005 The timing of the reduction in fees closely matched the observed decline in nonshyresident physician work hours The study finds that the mean hours worked per week by physicians practicing in the US decreased by almost 7 percent between 1996 and 2008 Additionally by 2006 physician fees were 25 percent lower than their inflationshyadjusted 1995 levels More recent studies which use micro data to estimate traditional labor supply equation generally find a small positive elasticity of physiciansrsquo work hours with respect to wage increases For instance Rizzo and Blumenthal (1994) use the instrumental variable approach to estimate the unbiased effect of physicianrsquos wage on the annual hours the physician spends on patient care Their results based on all physicians suggest that a 10 percent increase in the wage rate yields a 27 percent increase in the physicianrsquos annual work hours (ie wage elasticity of 027) When restricted to selfshyemployed male physicians they find a wage elasticity of 023 However for female physicians they find a higher elasticity with a 10 percent increase in the wage rate leading to a 49 percent increase in annual work hours This work is generally supported by Baltagi et al (2005) who find that a 10 percent wage increase would lead to a 3 percent increase in physician labor supply among hospital employed male physicians in Norway Baltagi et al (2005) note that the magnitude of the wage elasticity in this case may be relatively small because of hospital employed physiciansrsquo tendency to earn a lower wage relative to selfshyemployed physicians 23
There are few studies that examine the effect of earnings on a physicianrsquos decision to retire Using micro data from Norway over the period of 1990shy1992 Herneas et al (2000) estimated a model to predict retirement behavior and simulated the effect of financial incentives on retirement decisions among those who were eligible to retire early (during 1990 shy 1992) and who worked fullshytime in 1990 In their simulation the annual pension from 1993 onwards is increased by 72 percent if the retirement eligible individuals continue to work fullshytime through 1992 This increase is equivalent to a 723 percent increase of the annual disposable pension24 The simulation result suggests that the average estimated probability of continuing to work fullshytime throughout 1992 will increase by almost 100 percent (from 384 percent to 706 percent) in response to the 7234 percent hike in annual disposable pensions described above25 In other words in the absence of any pension hike after 1993 only 384 percent of physicians working full time in 1990 would still work full time through 1992 However if pension is raised by 723 percent from 1993 onwards for those who would continue to work full time through 1992 the
22 For an inshydepth exposition of the empirical evidence and lack of support for a backwardshybending physician labor
supply pleas e see Handbook of Health Economic Vol 2 Chapter 14 Section 310 23
The nature of labor supply for Physicians and nurses differ greatly There are some studies on the effect of wages on the labor supply of nurses For example Askildsen and Baltagi (2002) estimates a wage elasticity of nursesrsquo supply of labor between 07 and 08 depending upon the method of estimation The authors argue that while theirs is a larger effect than other estimations have suggested it is still not a large effect relative to other professions They also note that contract structure and type of work being performed significantly impact labor supply decisions and should not be ignored
24 Wealth is defined as the discounted value of future annual disposable pensions and the increase in wealth is
evaluated at the means of the data 25
The expected remaining lifetime was then set at 18 years which is close to the actual average for people in the relevant age groups in 1992
13
Final Report Health Practitioner Bonuses
simulation shows that 706 percent of physicians working full time in 1990 would still do so through 1992 They also estimated that the same financial incentives will lower the average estimated probability of partial retirement in 1992 (of retirement eligible workers) by about 547 percent (from 362 percent to 164 percent) Additionally they find that other decisive factors influencing retirement decisions are the level of education income and marital status
3 Effects of Earnings on the Volume of Primary Care Services
The effect of earnings on the volume of primary care services is related to the previous questions but is a distinct issue that incorporates the ability of providers to impact the demand for services as a result of changes in their income Dummit (2008) argues that as the largest single payer Medicare affects physician practice revenues directly through its payments and indirectly through its fee schedule which many private payers use Lower compensation for primary care physicians is one of the reasons that these specialties are less desirable Reschovsky et al (2012) report that over the past decade Medicare fees and spending for specialist services (such as diagnostic tests and procedures) have gone up more rapidly than fees for EampM services which primary care providers (PCPs) typically provide Those higher payments have contributed to faster growth in specialist services than in EampM patient visits Commercial insurers and state Medicaid plans often build their fee schedules on Medicarersquos further widening the income gap between PCPs and other physician specialists and contributing to the shrinking number of medical students choosing to enter primary care In this section we review how improvements in Medicare fees can influence the volume of health care services provided under Medicare
Hadley et al (2009) estimate the relationship between Medicare fees and the volume of eight specific services provided by physicians using data for 13000 physicians from 2000shy2001 and 2004shy2005 Community Tracking Study Physicians Surveys Since the fee schedule is one of the few policy tools that Medicare potentially has available to influence service volume it is critical to have a better understanding of how changes in Medicare fees affect Medicare service volume Their study finds that a 10 percent reduction in Medicare fees leads to 18 percent to 66 percent reduction in the volume of office visits (of various degrees of complexity) They argue that physicians may be more likely to respond to fee cuts by limiting their acceptance of new Medicare patients rather than limiting visits by established patients
Clemens and Gottlieb (2014) examine the changes in physiciansrsquo reimbursement rates under Medicare before and after year 1997 when consolidation of geographic regions across which Medicare adjusts physician payments led to area specific price shocks The study measures health care supply of all services using RVU They find that health care supplied to Medicare patients (RVUs per patient) exhibits a relatively large long run elasticity of around 15 with respect to reimbursement rates Their results are mostly driven by the stronger positive elasticity among elective procedures (eg eye and orthopedic procedures) When restricted to the analysis of the supply of EampM services their estimates lack precision and they find statistically insignificant short (1997shy98) and long run (2001 to 2005) impact of the price shock on the supply of EampM services However the medium run (1999 and 2000) elasticity is precisely estimated to be 097 for EampM They argue that the observed responses imply that the overall composition of services shifts toward more elective procedures as reimbursement rates increase Finally the number of patients and physicians per patient are almost unaffected by the change in the reimbursement rates
Reschovsky et al (2012) simulate the effect of a permanent 10 percent fee increase for primary care EampM services under Medicare Their estimated primary care supply model suggests that higher primary care fees lead to increases in both the likelihood that PCPs will treat Medicare beneficiaries and more importantly the quantity of EampM services PCPs provide to Medicare
14
Final Report Health Practitioner Bonuses
patients According to their analysis higher fees (10 percent increase permanently) for primary care beginning in 2011 raise the primary care EampM visits by 88 percent
Thus the likely range of changes in the volume of primary care visits in response to a longshyterm increase in Medicare primary care fees appears to be wide Based on Hadley et al (2009) and Reschovsky et al (2012) a 10 percent increase in Medicare fees for primary care can potentially increase the volume of primary care visits in the range of 18 percent to 88 percent However due to the shortshyterm nature of the Medicare PCIP (only 5 years) the observed impact of the incentive payment on the volume of EampM visits may be closer to the lower bound
B Financial Incentives for Primary Care Providers in Underserved Areas
Access to health care in areas with insufficient health professionals has been an ongoing source of concern among policy makers Expansion of health insurance coverage through the implementation of the ACA is likely to stimulate the demand for primary care in general including underserved areas Health Resources and Services Administration (HRSA) designates such areas HPSAs These geographic areas meet a defined threshold of primary care physician to population ratio Since 1987 Medicare has been paying bonuses to physicians providing primary care in rural HPSAs In 1991 the bonus payment was increased from 5 to 10 percent and eligibility extended to services provided by physicians in urban HPSAs Thus this particular form of bonus payment has been in place for almost 25 years Section 413(a) of the Medicare Modernization Act of 2003 put in place an additional 5 percent bonus payment for physicians practicing in Physician Scarcity Areas (PSAs) PSAs were those counties and rural zip codes in metropolitan statistical areas (MSAs) that represented the 20 percent of the Nationrsquos population with the lowest physician to population ratios These areas often coincided with geographic HPSAs so that physicians practicing in those areas received a 15 percent additional bonus payment during 2005shy2008 when the PSA bonuses were in effect (ie from January 2005 through June 2008)
In this section we review the literature related to the volume of these bonus programs and their potential effects on primary care services and providers Programs to address this issue have historically been implemented with the assumption that financial incentives to practice in rural areas are effective in addressing the health professional shortage in given areas This assumption is largely validated by the literature with the effect of financial incentives shown to influence the distribution of physicians and health professionals Importantly the literature generally suggests a multifaceted approach to incentives financial or otherwise Many of the most successful programs evaluated below use recruitment of medical students with specific demographic markers to influence the distribution of physicians Financial incentives have a broad range of reported specialty choice elasticities that range from 001 to 095 These discrepancies may also be somewhat determined by the type of financial incentive (eg grant loan postgraduate bonus)
In an early article on the HPSA bonus Shugarman et al (2001) estimate that in 1991 the total amount of HPSA bonus was almost 316 million dollars Their estimate shows that 583 percent of the total HPSA bonus payment went to the rural HPSAs while the remaining 417 percent went to urban HPSAs They also find that the total bonus payment grew to reach about 106 million dollars in 1996 but then gradually declined to almost 77 million dollars in 1998 The proportion of rural HPSA bonus decreased to 511 percent
In a more recent study Shugarman and Farley (2003) examined the trends in HPSA bonus payments for primary care specialties (family practice general practice and internal medicine) under Medicare over the period of 1992shy1998 using Medicare claims data for nonshymetropolitan area beneficiaries They argue that the bonus payments largely targeted primary care They
15
Final Report Health Practitioner Bonuses
find that in 1992 the payments for primary care services represented 297 percent of the total Medicare bonus payments for physician services to rural Medicare beneficiaries The proportion gradually went up to 37 percent in 1998 Their analysis also showed that in 1992 payments for primary care services represented 14 percent of total basic Medicare payments for physician services and this share rose to 186 percent by 1998 However 559 percent of all Medicare HPSA bonus payments for services to beneficiaries in nonshymetropolitan areas were made to primary care physicians This proportion declined gradually to 497 percent in 1998 The authors claim that low levels of bonus payments in general coupled with the documented declines in those amounts since 1994 may have undermined their future potential to support physicians practicing in rural areas Their findings suggest that physicians were not claiming the extra payments that were available to them Factors that could be contributing to such low uses of bonus payments include the extent to which physicians know about the payments perceived value of the bonus to physicians effects of administrative procedures on the ease of receiving them and concerns about the risk of audits Nevertheless their study highlights the role of bonuses in improving the payments and the supply of primary care services in HPSAs
The literature regarding the effect of financial incentives in underserved areas on the choice of practice location of physicians is relatively scarce Chou and Lo Sasso (2009) examined the impact of local characteristics on the practice location choices for newly trained physicians in New York between 1998 and 2003 Their empirical results suggest that PCPs without educational debt are attracted to HPSAs In other words they estimate that the propensity of choosing a location by a PCP is higher if the location is designated as an HPSA However the estimated propensity is lower if physicians have larger educational debt Their study however addresses the effect of the HPSA status in general rather than any specific effect of the amount of HPSA bonuses
In a review of rural incentive programs Sempowski et al (2004) compare rural recruitment and retention programs in the United States against those in other countries (notably Canada and New Zealand) The authors look specifically at Return of Service (ROS) commitments wherein financial incentive is provided though assistance with medical school payment in return for a commitment to serve in a rural area The authors note that programs offering financial incentives in exchange for ROS commitments to rural or underserviced areas have achieved their primary goal of short term recruitment However the authors note that in the US the lenient buyout opportunities have hindered the programs and limited their effectiveness Sempowski et al (2004) argue that the programs in Canada and New Zealand may have greater success with retention as compared to the US programs because the programs in Canada and New Zealand have a multishyfaceted approach that includes the use of financial incentives along with prudent recruitment strategies
Bolduc et al (1996) provide a theoretical framework of physicianrsquos choice of location They develop a model to assess the effect of various incentive measures introduced in Quebec (Canada) on the geographical distribution of physicians across 18 regions during 1976shy1988 The study specifically examines general practitionersrsquo choice of initial practice locations in Quebec The utility of a particular alternative depends on among other things a measure of expected discounted value of lifetime earnings associated with this alternative It is through changes in this variable that the impact of various incomeshybased physicianshylocation programs is simulated Before 1982 there were substantial variations in the population to general practitioner (GP) ratio across different regions of Quebec In order to redress geographic imbalances in the distribution of physicians the Quebec government introduced the Differential Remuneration Program (DRP) in 1982 that raised the fees (relative to the base fees to general practitioners in underserved regions compared to the regions with relatively lower population to GP ratios Among other incentive measures annual study grants of $10000 have been offered
16
Final Report Health Practitioner Bonuses
(since 1982) tied to a commitment to work in these underserved regions during a number of years equal to the number of grants received A settlement grant program has also been available since 1984 for physicians who choose to practice in these regions This program provides an annual allowance for a maximum of 4 years It varies from $5000 to $10000 (nontaxable) for a physician paid by unit of service depending on the shortage of physicians in the locality Whereas the differential remuneration program influences location choices through differential pricing of physiciansrsquo services by location the grant program affects location choices through a lump sum increase in income for a short duration (4 years)
Bolduc et al (1996) find that on average a 10 percent increase in the general practitioner fees for medical services in a region increases the propensity of a beginning GP to work in this region by 7 percent Thus the implied elasticity of location choice probability with respect to fee increases is about 07 However this elasticity varies across regions it is higher in remote regions (with a maximum of 128) On the other hand on average the elasticity of location choice probability with respect to nonshylabor incomes such as study grants is estimated to be about 111 In other words a 10 percent increase in the study grants tied to a commitment to work in the underserved regions leads to an 111 percent increase in the probability of GPs choosing these underserved regions as their starting practice location However their findings largely depict redistribution of GPs across regions within Quebec rather than showing any increase in the total number of GPs in Quebec
Despite differences in the institutional framework between the US and Canada the findings from Bolduc et al (1996) provide some valuable insights into the potential effects of financial incentives that vary across locations The remaining important issue is to identify how bonus payments affect the annual earnings of physicians in HPSAs Only then based on findings from the literature can one assess the potential impact of the earnings shock in HPSAs on primary care physiciansrsquo choice of practice location Holmes (2005) addresses this question directly Using a database containing the location of physicians at 5shyyear intervals the author compares the locations chosen by alumni and nonshyalumni of programs within the United States charged with increasing physician supply in underserved areas This analysis provides insight into the types of students that choose to enroll in programs such as the National Health Service Corps (NHSC) The author notes that participation in this program consists disproportionately of minorities from private expensive schools This suggests that scholarships (and hence the lack of debt burden) may be an influential factor in participation in the NHSC The multinomial logit model employed by Holmes (2005) shows that students which graduate from an institution with a focus on primary care are also more likely to enroll in the NHSC Using this model Holmes (2005) concludes that the elimination of the NHSC program would lead to a 10shy11 percent decrease in the supply of recent graduates in underserved communities
Rabinowitz et al (2001) examine the history and results of The Physician Shortage Area Program (PSAP) of Jefferson Medical College (Philadelphia PA) The PSAP is intended to address the shortage of primary care physicians in rural Pennsylvania The authorsrsquo analysis uses a cross section of Jefferson Medical College Graduates from 1978 to 1993 to determine which characteristics are predictive of becoming a rural primary care physician (PCP) Of the characteristic variables collected in the data freshman year plans for family practice being in PSAP having a NHSC scholarship male sex and taking elective senior family practice rural preceptorship were independently predictive of primary care in a rural area However among nonshyPSAP graduates with two key selection characteristics of PSAP students (having grown up in a rural area and freshman year plans for family practice) were 78 percent as likely as PSAP graduates to be a rural primary care physician and 75 percent to remain rural PCPs The authors note that this result suggests the most influential area of the program is the admissions component not the financial component Supporting evidence for this conclusion is provided by
17
Final Report Health Practitioner Bonuses
Brooks (2002) who found that rural upbringing and specialty preference were most strongly correlated with recruitment of physicians to rural areas Growing up in a rural area along with the studentrsquos expressed plan to become a primary care physician were associated with a 36 percent likelihood of a graduate practicing in a rural area compared with 7 percent for individuals without these preferences
Although most studies found that there was no correlation with age gender race or marital status (Horner 1993 Looney 1998 Rabinowitz 1999) a few studies determined that men have a greater likelihood of rural practice than women (Fryer 1997 West 1996) However women PSAP graduates were more than twice as likely as nonshyPSAP women to practice in rural areas (317 percent versus 123 percent) (Rabinowitz 2011) Importantly none of these articles list financial incentives as an important factor in recruitment and retention of primary care physicians in rural areas
C Impact of the Increase in Medicaid Reimbursement Rate Relative to the Medicare Rate
The availability of primary care is particularly important for public payer programs such as Medicaid and Medicare Historically Medicaid has been the lowest payer for primary care services relative to Medicare paying just 66 percent of Medicare rates on average26
Cunningham et al (2009) report that fewer physicians accept new Medicaid patients in response to the low Medicaid reimbursement rates in several states Zuckerman et al (2009) describe that in 2008 average primary care physician fees under Medicaid ranged from 57 percent of the national average in Rhode Island to 226 percent of national average in Alaska They also find that after a strong Medicaid fee growth during 1998shy2003 Medicaid fees fell relative to inflation during 2003shy2008 Despite the slowdown in overall fee growth Medicaid fees for primary care services kept pace with inflation ACA increases Medicaid reimbursement rates for certain services provided by primary care physicians to 100 percent of Medicare rates in 2013 and 2014 Given the variability of Medicaid payments across states this could be a substantial boost in payments for physicians in some states and less so in others
The findings in this section focus on the comprehensive effect of a relative rate increase both on services provided and patientrsquos utilization of those services While evidence is mixed the literature indicates significant effects of increased Medicare reimbursement on both the provision and utilization of primary care services Reported elasticities range between 041 in national estimates to shy006 in some state level analyses This broad range suggests varying evidence and a need for greater examination given the importance of this question
1 Systemic Change in Medicaid Reimbursement Rates in All States
Systemic Medicaid changes have the potential to alter the primary care environment across all states Cunningham (2011) considers a regressionshybased approach to identify the causal effect of increases in Medicaid reimbursement rates relative to the Medicare rate on the propensity of primary care physicians accepting new Medicaid patients He reported prior to the 2012 Supreme Court decision (National Federation of Independent Business et al vs Sebelius et al27) that once the ACA is implemented Medicaid eligibility will expand to cover as many as 16 million more poor and lowshyincome adults by 2019 (an increase of more than 25 percent) To
26 Small DM and T McGinnis (2012) ldquoLeveraging the Medicaid Primary Care Rate Increase The Role of
Performance Measurementrdquo Center for Health Care Strategies Inc 27
US Supreme Courtrsquos decision in the case challenging the constitutionality of the Affordable Care Act (ACA httpwwwsupremecourtgovopinions11pdf11shy393c3a2pdf
18
Final Report Health Practitioner Bonuses
meet the resultant surge in demand for primary care services ACA provides financial incentives to encourage higher participation of primary care physicians in Medicaid Specifically the ACA raises the Medicaid reimbursement rates for certain services provided by primary care physicians up to 100 percent of Medicare rates in 2013 and 2014 This study uses primary care physicians from the HSC 2008 Health Tracking Physician Survey and exploits the existing state level variation in Medicaid reimbursement rates (as a percentage of the Medicare rate) The author groups the states in three categories (low medium and high) based on PCPs to population ratios
This study shows that in 2008 the average Medicaid reimbursement rate for lowshyPCP states was about 816 percent of the Medicare rate while for medium and highshyPCP states the average rates were 643 percent and 548 percent respectively The national average of the Medicaid reimbursement rate was 662 percent of the Medicare rate Cunningham (2011) examines the effects of Medicaid reimbursement rates on PCP acceptance of Medicaid patients while accounting for differences in physician practice patient and health care market characteristics The results show that higher Medicaid reimbursement rates are associated with a greater probability of PCPs accepting all or most new Medicaid patients although the effects are relatively modest For PCPs a 10shypercentage point increase in the MedicaidMedicare fee ratio for primary care is associated with only a 21shypercentageshypoint increase in PCP Medicaid patient acceptance The study reports that the national average Medicaid reimbursement rate relative Medicare in 2008 was at 662 percent and the national average acceptance rate of new Medicaid patients by PCPs was 415 percent Therefore the implied elasticity of accepting primary care patients with respect to the payment rate is about 03328 In other words if the Medicaid fee relative to the Medicare rate goes up by 10 percent then the acceptance of new Medicaid patients by PCPs goes up by 33 percent Excluding pediatricians the effect of reimbursement on Medicaid acceptance is slightly higher the implied elasticity of accepting primary care patients with respect to the payment rate is about 041 In the context of the parity in Medicaid and Medicare reimbursement rate under the ACA empirical findings by Cunningham (2011) can serve as a benchmark for the likely positive effect of higher Medicaid reimbursement rates on the access to primary care services
Other studies bolster this finding Shen and Zuckerman (2005) study the effects of Medicaid payment generosity on access and care for adult and child Medicaid beneficiaries The authors use data comparing the experiences of Medicaid beneficiaries with groups that should not be affected by Medicaid payment policies (the uninsured) using a differenceshyinshydifferences model Shen and Zuckerman (2005) find that higher payments do increase the probability of having a usual source of care and the probability of having at least one visit to a doctor or other health professional Specifically they find that a one unit increase (equivalent to a 10 percent increase) in the payment generosity index29 leads to a 15 percentage point increase in the probability of having a usual source of care and a 16 percentage point increase in having at least one visit to a health professional30 Importantly payment generosity was noted to have no effect on the probability of receiving preventive care or the probability of having unmet needs The authors argue that this weak association between increased payments and utilization of services is due to the higher correlation between payment increases and participation by physicians with a secondary effect on utilization
28 Implied Elasticity is (21415)(10662) or 033 After excluding Pediatricians the acceptance rate of Medicaid
patients among PCPs is about 385 percent and a 10shypercentage point increase in the MedicaidMedicare fee ratio for primary care is associated with only a 24shypercentageshypoint increase in PCP Medicaid patient acceptance Therefore the implied elasticity is (24385)(10662) or 041
29 The Medicare payment generosity index is defined as the Medicare capitation rate in a county divided by the
median Medicare capitation rate in the nation in a given year Average is defined to be 10 30
These can be interpreted as elasticities Implied elasticity would be 015 and 016 respectively
19
Final Report Health Practitioner Bonuses
2 Stateshyspecific Experience on Changes in Medicaid Reimbursement Rates
To better understand the mechanism by which systemic changes in the Medicaid system will be implemented and the broad range of environments affected it is informative to review Medicaid changes at the state level Zuckerman et al (2004) illustrate that Medicaid physician fees increased on average by 274 percent between 1998 and 2003 with primary care fees growing the most On average the cumulative percentage change in the Medicaid primary care fee was about 412 percent between 1998 and 2003 The authors note that there was considerable variation in primary care fees across states Seven states (District of Columbia Georgia Indiana Kentucky Maine Rhode Island and South Dakota) left primary care fees almost unchanged while two states (Iowa and New York) raised them by more than 100 percent States with the lowest relative fees in 1998 increased their fees the most but almost no states changed their position relative to other states or Medicare since Medicare rates also increased over the period Subsequently the study finds that primary care physiciansrsquo acceptance of Medicaid patients in highshyfee states was about 18 percentage points higher than the lowshyfee states (61 percent versus 43 percent) in 1997 while in 2001 the gap is reduced to 11 percentage points (58 percent versus 47 percent) The national average of primary care physiciansrsquo acceptance of most or all new Medicaid patients was 53 percent in 1997 and 54 percent in 2001 Moreover large fee increases (eg lowshyfee states experienced the largest fee change on average) were associated with primary care physiciansrsquo greater willingness to accept new Medicaid patients the rate of primary care physiciansrsquo acceptance of new Medicaid patients in these lowshyfee states went up from 43 percent in 1997 to 47 percent in 2001 Although their study shows some evidence that a Medicaid fee increase is associated with increased Medicaid participation among primary care physicians it does not provide a direct link between Medicaid reimbursement rates relative to Medicare and physiciansrsquo acceptance of Medicaid patients
Bindman et al (2003) examine California in particular and focus on the relationship between Medicaid fee increases and the prevalence of managed care in the MedishyCal system The authors note that in August of 2000 a fee increase raised physician Medicaid reimbursement from an average of 577 percent to 652 percent of the average Medicare payment in California This amounts to a fee increase for a typical office visit from approximately $18 to $24 The study used crossshysectional surveys in 1996 and 2001 on both primary care physicians and specialists Controlling for physician demographics and specialties the authors found no increase in MedishyCal participation Their study notes that between 1996 and 2001 despite payment increases the number of MedishyCal primary care physician equivalents dropped from 57 to 46 per 100000 patients31
Mukamel et al (2012) address the effect of similar financial incentives in Californiarsquos Medicaid system but from the standpoint of nurse staffing levels Using separate models for three staffing types RNs LPNs and CNAs the authors determined that financial incentives were only a significant factor in increasing hours per resident day (hprd) for RNs They note that expected nursing home reimbursement rate increases in 2008 were associated with increased RN staffing levels in 2006 They estimate the effect at around a 2shyminute increase (0035 hrpd) for each $10 increase in payment rate This amounts to a 10 percent increase in staffing over 2005 base levels The authors explain that this relatively small increase in staffing might be partially explained by the financial incentives original intent that is to influence labor expenditures and
31 A physician equivalent is defined as one full time physician providing full time working hours per week (40 hrs) in a
given specialty For example a physician who provides 20 hours of Family Medicine is counted as 05 of a physician equivalent in Family Medicine
20
Final Report Health Practitioner Bonuses
not directly influence staffing levels The authors note there may have been a change in wages and benefits for all three groups but that it was not measured in this study
Finally Coburn et al (1999) examined the effect of Medicaid fee changes on physician participation and enrollee access in Maine and Michigan using multiple natural experiments The authors found that changes in Medicaid fees observed in either state over any observed period had no substantial impact on either physician participation or enrollee access and utilization32 In one case in Maine after an increase of 475 percent in Medicaid reimbursement rates primary care physician participation fell by 1 percent (from 477 to 471)33 After a second increase of 245 percent participation increased by only 2 percent34 This result is mirrored in Michigan where participation increased by only 2 percent after a reimbursement increase of 79 percent and decreased by 06 percent after a cut of 166 percent and fell again by 02 percent after a restoration of 196 percent The authors note that these small changes in physician participation hold even when adjusting for lagged responses in both cases The authors found similar results when examining the utilization of services Using ambulatory care as a proxy for utilization of services in general the authors found that changes in the proportion of beneficiaries with at least one visit in a month and in the average number of visits by beneficiaries with at least one visit are not in a direction consistent with the fee changes and are all very small in magnitude The authors note that these results also do not change when estimated in the long run However a major confounding factor in these results as the authors note is the relative size of Medicaid payment rate increases compared to those of the private sector fees The authors state that most gains relative to the private market were quickly eroded
Conclusions
In order to inform our empirical estimation the Lewin Group has explored the health and labor economics literature to understand the nature and the size of the impact of any financial incentives on the labor supply behavior of PCPs and the resultant impact on the availability of primary care services The main objective of this review is to document the prior empirical evidence of the impact of financial incentives on raising the supply of primary care workforce the volume of services impact on medical graduatesrsquo propensity to participate in primary care PCPsrsquo retirement decision etc This review also evaluates the past evidence on the effect of bonuses shortage areas and their effectiveness in redistributing and retaining primary care workforce Finally the review of the literature also focuses on the stateshyspecific experiences with changes in their respective Medicaid payment rates for primary care and the resultant impact on the supply of PCPs their rate of acceptance of Medicaid patients and the volume of primary care services such as office visits or visits for EampM services
Affecting the choice of specialty by a medical student is one way by which the supply of primary care services may be increased Several studies (eg Nicholson 2002 Sivey and Scott 2012) find that the propensity of medical graduates choosing primary care as their specialty would go up by 95shy10 percent in response to a 10 percent increase in their earnings (ie earnings elasticity of 095shy10) Thus even if bonus payments have the potential to influence the inflow of
32 The study has given due consideration to the changes in Medicaid payment relative to the payments by other
payers The authors use the ratio of Medicaid payments to charges as an index of changes in relative payments They have also confirmed with Blue Cross Blue Shield (BCBS) of Michigan (which serves 49 percent of the statersquos health insurance market) that BCBSrsquos paymentsshytoshycharge ratio for all physician services did not change substantially
33 The corresponding relative fee change (ie Medicare relative to charges) is 402 percent
34 The corresponding relative fee change (ie Medicare relative to charges) is 258 percent
21
Final Report Health Practitioner Bonuses
medical students into primary care the magnitude of that impact would depend largely on the size of actual bonus payments relative to PCPsrsquo earnings and how long such payments are in place These two factors will determine the contribution of the Medicare bonus to the lifeshytime earnings of primary care providers
Another way to affect the supply of primary care services is to provide financial incentives for existing providers with the aim of increasing their labor supply Past research (eg Rizzo and Blumenthal 1994 Baltagi et al 2005) estimates that a 10 percent increase in wage earnings would yield a 23 3 percent increase in their annual work hours This low wage elasticity suggests that influencing the supply of primary care labor with direct fee increases alone is likely to be costly The increased fee payments will also likely have an effect on the volume of primary care services However compared to the wage elasticity the change in volume of services in response to fee increases is relatively low Empirical evidence from the literature (eg Hadley et al 2009 Reschovsky et al 2012) suggests that a 10 percent change in Medicare fees would change the volume of office visits or EampM related visits by 18 to 88 percent in the same direction
The numerical estimates of the effect of financial incentives in underserved areas on the choice of practice location of physicians in the US are relatively scarce An important study based on Canadian data finds that on average a 10 percent increase in the general practitioner (GP) fees for medical services in a region increases the propensity of a beginning GP to work in this region by 7 percent (Bolduc et al 1996) Thus the implied elasticity of location choice probability with respect to fee increases is about 07 Several studies highlight the role of bonuses in improving the payments and the supply of primary care services in HPSAs in the US However estimating the true contribution of bonuses in underserved areas in boosting physiciansrsquo earnings would require additional research
Past research on stateshyspecific increases in Medicaid and their resultant impact is relatively sparse However several studies find a positive correlation between the Medicaid reimbursement rate and acceptance rate of Medicaid patients among PCPs Cunningham (2011) finds that the effect of increase in Medicaid reimbursement rate on the propensity of accepting primary care patients is positive but small in magnitude Coburn et al (1999) finds positive impact of Medicaid fee changes on physician participation and enrollee access in Maine and Michigan while Bindman et al (2003) did not find significant effect of Medicaid fee increase on the participation rate of primary care physicians in California
Despite several empirical results regarding the potential magnitude of the effect of different financial incentives the estimated effect of Medicare bonuses or improvement in Medicaid reimbursement rates under ACA may not be substantial This is primarily due to the size and the temporary nature of these positive earnings shocks The empirical evidence on the effect of this type of shortshyterm pay increase is almost nonshyexistent in the literature However the ranges of the effects of longshyterm earnings shocks from our review of the literature can inform policy makers about the likely magnitude of the impacts of these incomeshyaugmenting policies for PCPs if they are sustained for a longer duration
Modeling the Impact of Medicare Incentive Payment for Primary Care Providers
A Study Design Overview
The Medicare primary care incentive is available to eligible primary care practitioners for services provided under selected categories of EampM An eligible primary care practitioner is a
22
Final Report Health Practitioner Bonuses
physician nurse practitioner clinical nurse specialist or a physician assistant who satisfies the following criteria
1 Enrolled in Medicare with a primary specialty designation of family practice internal medicine pediatrics or geriatrics and
2 At least 60 percent of the practitionerrsquos allowed charges under the Medicare physician fee schedule (excluding hospital inpatient care and emergency department visits) are for primary care services
This temporary payment is available for primary care services furnished by an eligible primary care practitioner on or after January 1 2011 and before January 1 2016 The payment is made on a quarterly basis and it amounts to 10 percent of the payment amount for the Part Bshycovered primary care services furnished by the eligible provider
Based on data regarding all the Medicare PCIP recipients in 2011 and 2012 we observe that in 2011 there were 162342 providers that received the PCIP with the majority of physicians specialized in family medicine and internal medicine (Exhibit 3) Also nurse practitioners account for more than half of nonshyphysician recipients in both 2011 and 2012 Finally there was an increase in the number of physician PCIP recipients across all eligible specialties in the second year the payment was in effect The number of all eligible types of nonshyphysician PCIP recipients also increased These estimates are consistent with the statistics reported by CMS35
Exhibit 3 Number of PCIP Recipients under Medicare by Specialty 2011shy2012
Specialty Year 2011 Year 2012
Physicians 121140 133880
Internal Medicine 54062 62554
Family Medicine 63227 66560
Pediatrics 2711 3426
Geriatrics 1140 1340
NonshyPhysicians 41202 51432
Clinical Nurse Specialist 466
Nurse Practitioner 27698 33940
Physician Assistant 13038 16899
Total 162342 185312
Note Actual PCIP recipients eligibility based on conditions 2 years prior to the PCIP payment year
The specific PCIPshyeligible services and their corresponding Current Procedural Terminology (CPT) codes are as follows (1) office and other outpatient visits (99201 through 99215) (2) nursing facility domiciliary rest home or custodial care (99304 through 99340) and (3) home services (99341 through 99350)
Medicare claims data include the Healthcare Common Procedure Coding System (HCPCS) corresponding to each claim submitted by providers Since level I of HCPCS codes is comprised of CPT codes HCPCS codes associated with claims can be used to determine bonusshyeligible EampM services
35 Source Center for Medicare and Medicaid Services (httpwwwcmsgovMedicareMedicareshyFeeshyforshyServiceshy
PaymentPhysicianFeeSchedDownloadsPCIPshy2011shyPaymentspdf)
23
Final Reportshy Health Practitioner Bonuses
The key questions that we examined using the Medicare data include
What is the aggregate number of Medicare PCIP recipients
What proportion of primary care providers qualify for the PCIP
What are the characteristics of primary care providers who qualify for the PCIP
How many eligible claims were submitted by PCIP eligible providers
What is the impact of Medicare incentive payments on services provided patients seen providers accepting Medicare and other related outcome measures
B Data Sources and Variables
1 Main Data Sets
To explore these topics we used a customized data set constructed at the provider level This data set includes all the claims submitted by the entire universe of Medicare providers in each year from 2005 to 2011 The content of this customized data set is similar to the Limited Data Set (LDS) version of the Medicare Carrier File (which is also known as the PhysicianSupplier Part B Claims) available from CMS Research Data Assistance Center (RESDAC) Subsequently in the discussion that follows we will refer to the customized claims level data set for all Medicare providers as the Provider Carrier File (PCF) Most of the claims in our PCF are from nonshyinstitutional providers such as physicians physician assistants clinical social workers and nurse practitioners Key variables in this file include
Procedure codes (HCPCS) corresponding to each claim
Provider total allowable charges associated with all claims
Provider specialty place of service and geographic location (such as zip code)
We constructed a provider level pooled data set (PPD) from the claims level data in the PCF over the period 2005shy2011 This pooled data set includes information such as provider specialty volume of primary care services (based on HCPCS codes) volume of PCIP eligible services distribution of providers by volume of services their annual Medicare allowed charges their geographic location and other related information over a longer time horizon In addition the original PCF included a National Provider Identifier (NPI) for each provider Subsequently each provider was linked by NPI to Provider360 data (available from Lewin Grouprsquos parent company Optum Inc) and the AMA Physician Master File to add provider characteristics such as provider demographics (eg age gender) provider designation medical school practice group information specialty and practice location We also added geographic location specific characteristics by linking the provider level data with the Area Resource File (ARF) based on the practice location information of providers The ARF data are maintained by the Health Resources and Services Administration (HRSA) The main advantage of this pooled data set is the ability to track providers over time and capture changes in their volume of services in response to Medicare payment incentives using a preshyandshypost analysis design
2 Trends in Key Outcome Variables
We were interested in estimating the impact of the PCIP on the supply of PCPs and patientsrsquo access to their services We measured improvements in access to care by studying changes in the volume of primary care services provided and the number of PCP providers Both the supply of PCPs and volume of services are measures of access to care previously used in the
24
Final Report Health Practitioner Bonuses
literature36 In addition we investigated the impact of the PCIP on the allowed charges associated with eligible EampM claims
Primary Care Providers with PCIP Eligible Specialties
First we examined the trend in the number of eligible providers submitting Medicare claims An increase in the number of primary care providers relative to the population is expected to improve access to primary care As shown in Exhibit 4 the number of PCPs accepting Medicare patients increased steadily over the study period with an approximate 40 percent increase in the number of providers treating Medicare patients from 2005 to 2011 This trend is common to all four physician specialties under study37 In addition the number of nonshyphysician practitioners more than doubled over this period This significant increase in the number of nonshyphysician providers especially nurse practitioners has been documented elsewhere38
Exhibit 4 Number of Primary Care Providers under Medicare by Specialty 2005shy2011
Specialty 2005 2006 2007 2008 2009 2010 2011
Physicians 138356 147771 165150 173018 178784 185070 191930
Internal Medicine 69391 74411 83117 87090 90291 93904 97526
Family Medicine 61438 65205 72247 75132 77536 79891 82298
Pediatrics 6539 7045 8527 9447 9543 9757 10555
Geriatrics 988 1110 1259 1349 1414 1518 1551
NonshyPhysicians 46634 53823 68297 80041 88569 97789 109353
Clinical Nurse Specialist 1784 1934 2188 2304 2370 2446 2508
Nurse Practitioner 23610 27450 35286 42144 46973 52472 59505
Physician Assistant 21240 24439 30823 35593 39226 42871 47340
Total 184990 201594 233447 253059 267353 282859 301283
Volume of EampM PCIP Eligible Claims
Our second measure of supply of primary care services is the volume of claims submitted by primary care providers for EampM services As presented in Exhibit 5 the volume of EampM claims submitted by physicians increased by roughly 9 percent between 2005 and 2008 EampM claims took a slight dip in 2009 increased in 2010 and then stabilized in 2011 at roughly the levels in 2008 The same general increasing trend applied to each of the four eligible physician specialties with the exception of geriatrics which experienced a constant and substantial increase in EampM claims of 52 percent over the study period Internal medicine physicians provided the majority of services generating more than 50 percent of EampM claims each year over the study period Family physicians are the second largest group of providers to supply
36 For instance see Stensland et al 2013
37 In 2005 almost half of the primary care providers (PCPs) were male but the share of male PCPs declined to almost
40 percent in 2011 (Exhibit B1 Appendix B) On the other hand the share of PCPs aged 55 and above among all male PCPs increased from 24 percent in 2005 to 375 percent in 2011 (Exhibit B1 Appendix B) As observed in Appendix Exhibit B1 the physician population appears to be aging The share of male physicians aged 65 and above underwent the largest increase recently from 186 percent in 2010 to 21 percent in 2011 (Exhibit B9a Appendix B) A similar increasing trend is also observed among female physicians aged 55 and above (Exhibit B9b Appendix B) Finally in the case of nonshyphysicians we observe the same steady increase in the share of providers aged 55 and above for both male and female providers (Exhibit B10shy11 Appendix B)
38 Source GAO (2008) ndash ldquoPrimary care Professionals Recent Supply Trends Projections and Valuation of Services
ldquo GAO 08shy472T
25
Final Report Health Practitioner Bonuses
EampM services representing about 40 percent of the total followed by geriatricians and pediatricians
Consistent with the increase in the number of nonshyphysicians documented above we observe an even more dramatic increase in the total number of EampM claims submitted by nonshyphysicians (clinical nurses nurse practitioners and physician assistants) The volume of EampM claims more than doubled over the study period from roughly 9 million in 2005 to more than 20 million in 2011
Exhibit 5 Total Number of PCIP Eligible EampM Claims submitted by All PCPs under Medicare by PCP Specialty 2005shy2011
Specialty 2005 2006 2007 2008 2009 2010 2011
Physicians 105943390 107978615 111700420 115408741 114881401 117265160 115329828
Internal Medicine
60279101 61222893 63082429 64946744 64244760 65447440 63698392
Family Medicine
44352228 45264171 47011232 48776874 48891712 49977085 49767310
Pediatrics 334997 352594 360508 365170 387636 391312 377604
Geriatrics 977064 1138957 1246251 1319953 1357293 1449323 1486522
NonshyPhys 8885528 10366281 11979963 13710969 15376840 18008471 20477006
Clinical Nurse Specialist
6083315 7068153 8117610 9212329 10298679 11987059 13561380
Nurse Practitioner
153463 165033 168030 200074 228899 260618 296206
Physician Assistant
2648750 3133095 3694323 4298566 4849262 5760794 6619420
With both the aggregate number of EampM claims and the number of providers rising over time we further explore the change in the volume of claims per provider over time In other words we examined whether the increase in the aggregate number of claims could be due to the increase in claims per provider or whether it is just due to the increase in the number of providers
Inspection of Exhibit 6 reveals that in the case of all physicians the average number of eligible EampM claims per provider in 2011 was lower than in 2005 For instance the average number of eligible EampM claims for internal medicine was 653 in 2011 compared to the higher value of 869 in 2005 The decreasing trend in average claims per physicians may be due to the increase in the number of PCPs in the absence of a substantial increase in the patient population
26
Final Report Health Practitioner Bonuses
Exhibit 6 Average Number of PCIP Eligible EampM Claims per PCP under Medicare by Specialty 2005shy2011
Finally in the case of nonshyphysicians there was an overall increase in the average number of EampM claims submitted by physician assistants (PA) nurse practitioners (NP) and clinical nurse specialists (CNS) after 2009 (see Exhibit B2 Appendix B) For example the number of claims per PA increased from 125 in 2005 to almost 140 in 2011 On the other hand the number of claims per NP was 253 in 2005 then declined to 219 in 2009 and then increased to about 228 in 2011 The increase in the average number of claims submitted suggests that the dramatic increase in services provided is due to both an increase in the number of providers and in the number of services provided by each nonshyphysician The average number of claims per PCIP recipients by specialty and the average allowed charges per PCIP recipients by specialty are presented in Appendix B Exhibit 12 and 13 respectively
Allowed Charges for PCIP Eligible EampM Claims
So far we have focused on the level of EampM services provided measured in terms of number of claims and the number of providers Next we turn to the dollar value associated with EampM claims measured using allowed charges As shown in Exhibit 7 the total allowed charges (in million dollars) for eligible EampM claims increased for all providers over the period of analysis Overall total allowed charges increased by 58 percent with internal medicine and family medicine physicians accounting for most of this increase It is also noteworthy that the value of claims submitted by nonshyphysicians increased substantially over the same period by a factor between 2 and 3
27
Final Report Health Practitioner Bonuses
Exhibit 7 Total Allowed Charges (in million $) for the PCIP Eligible EampM Claims submitted by All PCPs under Medicare 2005shy2011
Specialty 2005 2006 2007 2008 2009 2010 2011
Physicians $6271 $6575 $7343 $7813 $8119 $9079 $9274
Internal Medicine $3671 $3830 $4251 $4506 $4644 $5182 $5231
Family Medicine $2520 $2645 $2982 $3183 $3340 $3742 $3881
Pediatrics $20 $21 $23 $24 $26 $30 $30
Geriatrics $61 $78 $87 $100 $108 $125 $131
NonshyPhysicians $416 $517 $617 $743 $871 $1114 $1316
Clinical Nurse Specialist $287 $358 $421 $507 $592 $749 $878
Nurse Practitioner $8 $9 $9 $11 $14 $17 $20
Physician Assistant $122 $150 $187 $225 $265 $349 $418
Total $6687 $7091 $7960 $8556 $8990 $10193 $10589
As shown in Exhibit 8 the average allowed charge per PCP for EampM claims increased slightly for internal medicine physicians and pediatricians after 2009 (also see Appendix B Exhibit B2) The average value of EampM claims increased for the other PCPs but not as fast as the total value of these claims Given the moderate increase in the average allowed charges for EampM claims the substantial increase in the aggregate allowed charges is likely due to the increase in the number of claims which in turn as discussed above may be driven by the increase in the number of providers Another important observation is that although the average number of claims submitted by physicians declined over the 2005shy2011 period the average allowed charges remained the same or even increased This observed increase in allowed charges per provider despite the documented decline in the number of claims may reflect changes in the composition of services that physicians are providing We hypothesize that this change in the composition is due to an increase in the supply of services that take more time and which are typically associated with higher charges We explore this hypothesis in the following section
28
Final Report Health Practitioner Bonuses
Exhibit 8 Average Allowed Charges ($) for the PCIP Eligible EampM Claims per PCP under Medicare by Specialty 2005shy2011
Finally we constructed the proportion of practitionerrsquos allowed charges under the Medicare fee schedule (excluding hospital inpatient admission and emergency room visits) that are for PCIP eligible primary care services As observed in Exhibit 9 for both physicians and nonshyphysicians the proportion of services that are PCIP eligible varies across specialties and is in general steadily increasing over the observation period However compared to primary care physicians the nonshyphysicians experienced a much larger percentage change in the share of allowed charges that are associated with PCIP eligible services
Exhibit 9 Share of Allowed Charges for PCIP Eligible EampM Claims by Specialty2005shy2011
Specialty 2005 2006 2007 2008 2009 2010 2011
Physicians
Internal Medicine 583 590 611 609 612 651 632
Family Medicine 692 699 724 722 725 750 734
Pediatrics 289 376 439 426 446 517 480
Geriatrics 754 845 851 858 855 879 867
NonshyPhysicians
Clinical Nurse Specialist 239 249 258 299 333 364 407
Nurse Practitioner 616 649 647 663 666 708 715
Physician Assistant 506 514 529 534 543 598 591
Note the proportions are of allowed charges for all Medicare claims (excluding hospital inpatient ER drug and lab)
29
Exhibit 8 Average Allowed Charges ($) for the PCIP Eligible EampM Claims per PCP under Medicare by Specialty 2005-2011
Final Report Health Practitioner Bonuses
While the proportion of services that are PCIP eligible is increasing over the observation period the opposite is true for the proportion of EampM claims (Exhibit 10) Consistent with the decrease in the aggregate number of EampM claims documented above we observe that the share of EampM claims out of the total Medicare claims is also slightly decreasing over the period For example in the case of providers specializing in internal medicine the share decreased from 411 percent in 2005 to 375 percent in 2011
Exhibit 10 Share of PCIP Eligible EampM Claims by Specialty 2005shy2011
Specialty 2005 2006 2007 2008 2009 2010 2011
Physicians
Internal Medicine 411 411 401 393 373 383 375
Family Medicine 432 430 419 409 386 392 384
Pediatrics 309 338 347 347 330 342 341
Geriatrics 648 696 677 641 610 600 603
NonshyPhysicians
Clinical Nurse Specialist 272 262 259 276 288 309 329
Nurse Practitioner 558 567 548 519 485 503 500
Physician Assistant 455 461 450 438 410 434 431
Note the proportions are calculated out of all Medicare claims (excluding hospital inpatient ER drug and lab)
The trends in primary care services and providers discussed above apply in general to the more restricted sample of PCIP recipients (Exhibits B4shy7 in Appendix B) When we limit the number of providers to 2011 PCIP recipients we observe a slight decrease in the average number of eligible claims submitted by physicians (Exhibit B5 Appendix B) and an overall increase in the average allowed charges over the study period (Exhibit B6 Appendix B)
C Econometric Framework
We used the providershylevel data to address the key research questions related to the Medicare PCIP We estimated several regressionshybased models using the DID method to obtain consistent estimates of the PCIP policy effect39 In order to implement the DID model we
1 Form a group of providers (treatment group) who are likely to be affected by the PCIP program including the following specialties family practice internal medicine pediatrics and geriatrics
2 Identify a natural relevant comparisoncontrol group (other nonshyprimary careshypractitioners) who are not likely to be affected by the PCIPshy
3 Assess the changes in our key outcomes of interest for the treatment group relative to the control group before and after the PCIP policy is in effect
We estimate the following econometric model to identify the effect of Medicare PCIP program on the magnitude of primary care EampM services
39 An alternative estimation method is a preshypost analysis but if there are unobserved factors that affect the
magnitude of EampM services supplied by any provider (primary or nonshyprimary care) and the effect of these unobserved factors varies over time a preshypost model would not yield an unbiased incentive effect
30
Final Report Health Practitioner Bonuses
Sit = + lowast Ti + lowast t + 8 lowast t lowast Ti + it lowast + Eit
We let Sit be the volume of eligible EampM services provided by provider i in period t Ti is anindicator for treatment group that takes the value 1 if the provider is a PCP and zero otherwise the variable Postt is an indicator variable taking the value of 1 in the years when the PCIP policyis likely to impact the behavior of the providers and 0 otherwise the vector Xit includes providercharacteristics such as age and gender The term Eit represents the net influence of randomunobserved factors affecting EampM services Importantly the estimated coefficient 8 (the coefficient of the interaction term between the treatment group indicator and the postshyPCIP policy period indicator) in equation (1) represents an unbiased estimate of the effect of the Medicare primary care incentive payment on the volume of primary care EampM services The derivation of this estimated effect is presented in Appendix C (C1) A similar methodology can be applied to estimate the effect of the incentive payment on other outcomes of interest
The choice of the control group for the DID model was based on several criteria Ideally we would have included providers with nonshyeligible specialties who also supplied EampM services In order to determine some preferred comparison group providers we
1 Evaluated the frequency of PCIP eligible and nonshyeligible providers by (primary) specialtyavailable in the Provider360 dataset after merging that data set with the list of NPIs of 2011PCIP recipients
2 Examined the volume of claims related to evaluation and management (EampM) servicesby specialty based on 2009 Medicare claims by service and specialty
3 Chose based on the volume of claims and the number of providers 8 PCIP nonshyeligiblespecialties These PCIP nonshyeligible specialties are (1) Psychiatry amp Neurology (2)Obstetrics amp Gynecology (3) Urology (4) Ophthalmology (5) Pathology (6)Psychologist (7) Podiatrist and (8) Optometrist Total number of PCIP eligible claimssubmitted by these providers with PCIP nonshyeligible specialties is presented in AppendixB Exhibit B14
D Main Results
The estimation of DID regression models is based on the number of eligible providers the volume of claims for PCIP eligible EampM services and the allowed chargespayments associated with those claims The volume of EampM claims and payments analyzed here excludes those for hospital inpatient ER drug and laboratory services As we explain above Medicare providers with a PCIPshyeligible specialty (ie family practice internal medicine geriatrics pediatrics NP PA and clinical nurse specialists) that have at least one Medicare claim are included in the ldquotreatmentrdquo group These are the providers who are likely to be affected by the Medicare PCIP policy Given that the announcement of the PCIP program was made in 201040 we assumed that the providers with Medicare PCIP eligible specialties would be potentially responsive to the
40 Source Patient Protection and Affordable Care Act (lsquolsquoPPACArsquorsquo Public Law 111ndash148) For our analysis we report a
single estimate of PCIP impact under each regression model where year 2010 and 2011 are considered as the postshypolicy periods We performed several sensitivity analyses to investigate if the estimated impact is significantly different between 2010 and 2011 we also checked if the results change once we consider 2011 as the only post period Based on such detailed analysis we did not find any systematic evidence that the estimated impact is different between these two years and they are not sensitive to the choice of postshypolicy period
31
Final Report Health Practitioner Bonuses
incentive as early as year 2010 Therefore years 2010 and 2011 represent the postshypolicy period
The DID regression models were estimated using several subshysamples (1) all providers (2) only providers that appear in all 7 years of data (roughly 44 percent of all providers) (3) providers who were near the PCIP eligibility criteria in 2009 (ie restricted to providers who had the share of total Medicare claim payments shyshy allowed chargesshyshy between 50 percent and 65 percent for PCIP eligible EampM services About 15 percent of all providers in the sample met this restriction
In Exhibit 11 we summarize the average volume of PCIP eligible EampM claims and the allowed chargespayments associated with those claims by select patient category and CPT code for providers in the ldquotreatmentrdquo group Comparing the first and last columns we observe that providers near the 60 percent eligibility threshold generate more EampM claims on average compared to the average PCP accepting Medicare (895 vs 590)
Exhibit 11 Number of PCIP Eligible EampM Claims and Mean Allowed Charges per Provider per Year by Types of Claims for Providers with PCIP Eligible Specialty 2005shy2011
All Providers Providers in
All Years
Providers Near
Eligibility
Analysis Sample
Number of Unique Providers with PCIP Eligible Specialty
264141 129587 17081
Annual Average Number of PCIP Eligible EampM Claims per provider
All EampM Claims 590 752 895
New Patient Claims 19 21 25
Established Patient Claims 487 628 813
Other Claims 84 103 57
Claims in 3 Major CPT Codes
Established Patients (15 mins) 243 315 403
Established Patients (25 mins) 177 227 282
Established Patients (40 mins) 20 25 34
Annual Average Allowed Charges for PCIP Eligible EampM Claims per Provider
All EampM Payments $40208 $51016 $60235
New Patient Payments $1941 $2223 $2661
Established Patient Payments $32409 $41764 $53755
Other Payments $5858 $7029 $3819
Payments in 3 Major CPT Codes
Established Patients (15 mins) $13613 $17635 $22712
Established Patients (25 mins) $15217 $19524 $24581
Established Patients (40 mins) $2313 $2976 $4051
Note Summary of PCIP eligibility criteria Primary care physicians (with internal medicine family practice pediatrics and geriatrics specialty) who have at least 60 percent of the practitionerrsquos allowed charges under the Medicare physician fee schedule (excluding hospital inpatient care and emergency department visits) are eligible for primary care services The PCIP eligible primary care services are defined by specific EampM codes Medicare PCIP is also provided to physician assistants nurse practitioners and clinical nurse specialists who meet the similar eligibility criteria For the purpose of our analysis we consider the PCPs (with the PCIP eligible specialty) who have
32
Final Report Health Practitioner Bonuses
50 percentshy65 percent of their services for PCIP eligible EampM services (defined by specific EampM codes) in 2009 are considered to be near the eligibility threshold
For the control group the number of providers the volume of their Medicare claims for EampM services and the associated allowed charges for the providers with the PCIP nonshyeligible specialties are presented in Exhibit 12 As expected providers in the control group generated much fewer EampM claims compared to providers in the treatment group Specifically providers in the control group supplied less than half the volume of EampM services compared to providers in the treatment group (ie 296 vs 590)
Exhibit 12 Number of PCIP Eligible EampM Claims and Mean Allowed Charges per Provider per Year by Types of Claims for Providers with PCIP NonshyEligible Specialty 2005shy2011
All Providers Providers in All Year
Analysis Sample
Number of Unique Providers with PCIP NonshyEligible Specialty
108302 70583
Annual Average Number of PCIP Eligible EampM Claims per Provider
All EampM Claims 296 333
New Patients Claims 35 38
Established Patients Claims 243 276
Other Claims 18 19
Claims in 3 Major CPT Codes
Established Patients (15 mins) 129 146
Established Patients (25 mins) 47 53
Established Patients (40 mins) 5 6
Annual Average Allowed Charges for PCIP Eligible EampM Claims per Provider
All EampM Payments $18618 $20868
New Patients Payments $3421 $3724
Established Patients Payments $14108 $15975
Other Payments $1089 $1169
Payments in 3 Major CPT Codes
Established Patients (15 mins) $7321 $8288
Established Patients (25 mins) $4048 $4578
Established Patients (40 mins) $641 $711
1 Impact of PCIP Policy on Number of Eligible Providers
We examined the changes in the number of providers with a Medicare PCIP eligible specialty in a county who have at least one claim for PCIP eligible services to identify the potential impact of the PCIP policy on these providers Exhibit 13 shows the results from the DID regression models in which we use the number of providers in a county and in a specific year as the outcome variable (Model 1) the number of physicians in each county and year (Model 2) and the number of nonshyphysicians (ie NP PA and CN) The key variable in each model is the interaction between the indicator for PCIP eligible specialty and the indicator for the period after 2009
33
shy
Final Report Health Practitioner Bonuses
In Model 1 the first estimated coefficient suggests that on average the number of Medicare providers with a PCIP eligible specialty and at least one PCIP eligible claim increased by about 28 providers per county in each year after 2009 due to the Medicare PCIP This represents an economically meaningful increase given that on average there were about 15 providers per county per year in a PCIP eligible specialty during the sample period This increase (almost 19 percent) in the number of providers in PCIP eligible specialties may be the primary reason for the estimated reduction in the number of EampM claims per provider due to the PCIP policy
In addition when we restrict the estimation to physicians (Model 2) the increase in the number of physicians with a PCIP eligible specialty attributable to the policy is about 2 per county per year This is almost 10 percent of the average number of primary care physicians in a given PCIP eligible specialty per county per year (average is almost 19) Furthermore the estimated policy impact in Model 3 indicates that the number of PCIP eligible nonshyphysicians increased by over 36 providers per county per year Thus all three models confirm that the introduction of the PCIP policy generated an increase in the number of PCIP eligible providers above and beyond the general increasing time trend Subsequently this increased number of providers may have resulted in the reduction in the average number of EampM claims submitted by these Medicare providers after 200941
Exhibit 13 Impact of Medicare PCIP on the Number of PCPs with Medicare Claims for PCIP Eligible Services (2005shy2011)
Dependent Variable Number of
Providers per county
All Providers
(1)
Physicians Only
(2)
Non Physicians Only
(3)
PCIP Elig Specialty Indicator 4247 3400 2721
(3133) (3647) (2078)
Elig Specialty Ind x Post 2009 2759 1950 3632
(0444) (0674) (0375)
Post 2009 2929 1884 2895
(0455) (0541) (0304)
Median Income ($10k) 1591 2218 1061
(0385) (0468) (0206)
Percent in poverty 0254 0339 0210
(00479) (00587) (00285)
Population (10k) 0536 0607 0317
(00280) (00339) (00128)
Percent Population over 65 shy0307 shy0196 shy0234
(00363) (00452) (00238)
Unemployment Rate shy0518 shy0510 shy0400
41 We have also estimated similar models for the primary care providers who have any Medicare claims (not
necessarily under PCIP eligible services) and the estimated effects of the PCIP policy are slightly larger in those cases These additional results are included in Appendix B Exhibit B 15 In addition we have estimated similar models of providers who met the 60 PCIP eligibility threshold in each year (2005shy2011) As expected the estimated impact of PCIP policy on the number of primary care providers is relatively lower for this restricted set of providers However if we focus on this restricted set of providers then we are likely to lose those providers who may have been induced to provide PCIP eligible services in response to the policy but may not have reached the 60 threshold Similarly we would lose the information on the providers who have reduced the proportion to below 60 The estimated results on this restricted set of providers are presented in Appendix B Exhibit B16
34
-
shy
Final Report Health Practitioner Bonuses
Dependent Variable Number of
Providers per county
All Providers
(1)
Physicians Only
(2)
Non-Physicians Only
(3)
(00461) (00557) (00324)
Intercept shy4970 shy5988 shy3006
(3489) (3996) (2344)
Specialty Fixed Effects Yes Yes Yes
Year Fixed Effects Yes Yes Yes
State Fixed Effects Yes Yes Yes
N 140192 107526 95647
Adj Rshysq 0310 0338 0365
Note Robust standard errors are in parentheses + significance at 10 percent significance at 5 percent Thenumber of observation is based on the number of counties the number of years and the number of providerspecialties in each model (ie physicians include 4 primary care specialties and nonshyphysicians include 3 subshyspecialties)shy
The PCIP policy could impact the number of Medicare providers submitting PCIP eligible claims through several channels First the policy may induce an established PCP to start to treat Medicare patients (new or established patient) under PCIP eligible services that they may not have done before In addition the policy may also encourage new providers fresh out of their completion of residency training to provide PCIP eligible services under Medicare Lastly one can also argue that the PCIP policy may encourage providers with a PCIP nonshyeligible specialty to switch to a PCIPshyeligible specialty and increase their chance to receive the incentive payment This last scenario could be especially relevant for internal medicine subshyspecialties such as cardiology pulmonary disease nephrology and endocrinology which are not PCIPshyeligible although the internal medicine specialty is PCIPshyeligible Without judging whether such specialty switching is a desired outcome under the PCIP policy we first examine to what extent such switching of specialty is prevalent in our dataset and second whether such phenomenon is large enough to influence the impact of the PCIP policy on the number of providers who submit at least one Medicare claim under PCIP eligible services
Based on our 2005shy2011 claims data we have estimated that during the postshyPCIP policy period (2010 and 2011) there are about 30864 new primary care physicians (family practice internal medicine pediatrics and geriatrics) and 27927 new primary care nonshyphysicians who have submitted at least one claim under Medicare (Note that in this accounting we do not attempt to distinguish between ldquonewrdquo providers who were induced by the PCIP to participate and providers that would have entered the Medicare program anyway) Based on our Medicare data we have estimated that 3057 physicians with at least one Medicare claim switched their specialty to a PCIP eligible specialty during the postshypolicy period Over 50 percent (1645) of these specialty switches are switches into internal medicine mainly from internal medicine subshyspecialties The number of specialty switchers is substantially smaller than the number of total new Medicare physicians with a PCIP eligible specialty in the postshypolicy periods Thus switching of specialty could not account for the estimated impact of the PCIP policy on the number of primary care physicians
Based on our claims data we estimate that during the postshyPCIP policy period (2010 and 2011) there are 17662 new primary care physicians (family practice internal medicine pediatrics and geriatrics) who have submitted at least one PCIP eligible claim Additionally we have estimated from published sources that during the post policy period there are about 10000 residency
35
Final Report Health Practitioner Bonuses
positions filled under primary care annually from 2009 to 201142 If the Medicare PCIP policy attracts part of these providers under Medicare to provide PCIP eligible services then such evidence would be consistent with our estimated impact of the PCIP policy in Exhibit 13
Exhibit 14 shows the impact of the PCIP policy on the number of providers accepting new Medicare patients (Model 1) and on the number of new Medicare providers (Model 2) The estimated coefficient on the main variable of interest mdash the interaction between the PCIP eligibility indicator and the postshy2009 indicator mdash suggests that due to the PCIP policy on average the number of PCPs accepting new Medicare patients increased by about 1 provider per county per year for a given PCIP eligible specialty This estimated impact is not negligible given that there are about 9 Medicare PCPs for a given primary care specialty who accept new Medicare patients per county per year during the sample period
Similarly Model (2) in Exhibit 14 shows the impact of the PCIP policy on the number of new Medicare providers who have submitted Medicare claims for PCIP eligible services The estimated coefficient on the main variable of interest suggests that due to the PCIP policy on average the number of new Medicare primary care providers with at least one claim submitted for PCIP eligible services increased by 0148 per county per year for a given PCIP eligible specialty Given that on average there are about 14 new Medicare primary care providers per county per year in a PCIP eligible specialty with at least one PCIP eligible claim during the sample period the estimated impact is again not negligible
Exhibit 14 Impact of Medicare PCIP on the Number of Providers Accepting New Medicare Patients and the Number of New Primary Care Providers under Medicare with Claims for
PCIP Eligible Services (2005shy2011)
Number of Providers Accepting
New Medicare Patients (1)
Number of New
Medicare Providers (2)
PCIP Elig Specialty Indicator 2819 4367
(1959) (0297)
Elig Specialty Ind x Post 2009 0883 0148
(0345) (00440)
Post 2009 1605 0293
(0369) (00460)
Median Income ($10k) 1455 00508
(0295) (00445)
Percent in poverty 0143 00160
(00366) (000545)
Population (10k) 0351 00482
(00204) (000328)
Percent Population over 65 shy0177 shy00443
(00295) (000436)
Unemployment Rate shy0314 shy00512
(00374) (000544)
Intercept shy3432 shy3926
42 Estimates include the following primary care specialties family practice internal medicine (including pediatrics)
pediatrics Source National Resident Matching Program Results and Data 2011 Main Residency Match National Resident Matching Program Washington DC 2011
36
Final Report Health Practitioner Bonuses
Number of Providers Accepting
New Medicare Patients (1)
Number of New
Medicare Providers (2)
(2461) (0330)
Specialty Fixed Effects Yes Yes
Year Fixed Effects Yes Yes
State Fixed Effects Yes Yes
N
Adj Rshysq
140192
0250
121084
0255
Note Robust standard errors are in parentheses + significance at 10 percent significance at 5 percent
2 Impact of PCIP Policy on Number of Claims for EampM Services
The DID estimates from the model using the volume of EampM claims as the outcome variable are presented in Exhibit 15 The estimated coefficient of that interaction term in the first column of Exhibit 15 (ie column (1)) indicates that in response to the Medicare PCIP policy PCPs with PCIP eligible specialties reduced their number of PCIP eligible EampM claims by about 52 on average 43 This represents a reduction in the volume of claims per provider of a little less than 9 percent Furthermore we estimate that on average providers with PCIP eligible specialties had about 187 more EampM claims submitted under Medicare during the sample period than the providers with PCIP nonshyeligible specialties Also for the providers with both PCIP eligible and nonshyeligible specialties the average number of EampM claims submitted went down by 70 claims after 2009
In addition we find that as the number of primary care providers per 10000 population increases the number of claims per provider decreases Finally the volume of claims per provider increases with the providerrsquos age and with the increase in the size of the Medicare population The effect of unemployment on the number of EampM claims per provider is also positive and statistically significant
When the sample is restricted to providers who were near the PCIP eligibility threshold in 2009 (column (3)) the estimated reduction in the number of claims per provider due to the PCIP policy is smaller only about 33 claims44 The reduction in the number of claims per provider in response to the PCIP policy may appear counterintuitive However the total number and value of claims may still increase as a result of the policy as long the number of providers with a PCIP
43 The postshypost policy period in our analysis comprises of two years 2010 and 2011 We have also estimated the
impact of the PCIP policy on the volume of claims and other outcomes discussed later for each postshypolicy year separately and the effects in these two years are not statistically different for a given outcome of interest
44 We focus on the primary care providers who are near the PCIP eligibility threshold because these providers are at
the margin to improve the volume of their PCIP eligible services by incurring a relatively low cost and gain the PCIP incentive payment (ie marginal benefit is much higher relative to the marginal cost) Therefore we would expect the impact of PCIP policy (if there is any) would be more substantial among the providers near the eligibility threshold However if we only focus on those who met the 60 criteria then we would lose the behavioral changes among the providers who are below the threshold may have tried to reach the 60 threshold in response to PCIP This may bias the PCIP impact By focusing only on those providers who met the 60 eligibility criteria we would face the typical problem of selection bias Hence focusing on those providers who are near the eligibility threshold circumvents this problem but captures the essence of the hypothesis that we are referring to In addition we have estimated several models with different ranges (50shy65 50shy70 55shy65 and 40shy80) of the proportion of allowed charges on PCIP eligible primary care services and tested the sensitivity of our results At least for the first three ranges mentioned we find that results are not sensitive to those three ranges However once we broaden the analysis to 40shy80 the estimated impact is in between the effects we observed for all providers and the providers in 50shy65 threshold (as expected) Also the mean value of this proportion in the sample is about 53
37
Final Report Health Practitioner Bonuses
eligible specialty increases at a higher rate than the decline in the number of claims submitted per provider Thus a reduction in the number of claims per provider should not be interpreted as evidence of decreased access to primary care services if the number of providers is increasing at the same time
Exhibit 15 Impact of Medicare PCIP Policy on PCIP Eligible EampM Claims (2005shy2011)
Dependent Variable PCIP Eligible
EampM Claims per Provider
Analysis Sample
(1) EampM
Claims
(2) EampM Claims
(Providers in All Years)
(3) EampM Claims
(Near Eligib 09)
PCIP Elig Specialty Indicator 1869 1166 1176
(1293) (1838) (1246)
Elig Specialty Ind x Post 2009 shy5173 shy3696 shy3259
(1814) (2412) (5762)
Post 2009 shy7442 shy7727 shy3728
(2692) (3423) (3155)
Age 8450 6980 2241
(00450) (00637) (00547)
Male 1657 1989 9039
(0965) (1243) (1162)
Urban shy3978 shy5101 shy4900
(1712) (2153) (2190)
Median Income ($10k) shy7296 shy5815 00475
(0886) (1137) (1057)
Percent in poverty shy4678 shy4105 1523
(0222) (0283) (0272)
Population (10k) shy0107 shy0134 shy00710
(000441) (000576) (000531)
Percent Population over 65 1784 2072 1844
(0256) (0319) (0322)
Unemployment Rate 1307 1766 6838
(0425) (0560) (0522)
Primary Care Phypop10k shy0156 shy0172 shy0258
(000716) (00102) (00146)
PC Nonshyphypop10k shy0452 shy0627 shy0208
(00154) (00234) (00228)
Intercept shy34610 shy30330 shy11460
(1669) (2263) (1734)
Specialty Fixed Effects Yes Yes Yes
Year Fixed Effects Yes Yes Yes
State Fixed Effects Yes Yes Yes
N 2014835 1397760 746845
Adj Rshysq 0222 0241 0380
Note Robust standard errors are in parentheses + significance at 10 percent significance at 5 percent
38
Final Report Health Practitioner Bonuses
3 Impact of PCIP Policy on Allowed Charges for EampM Services
The estimated effect of the PCIP policy on the allowed charges associated with the EampM claims is in general positive and statistically significant (Exhibit 16) While we estimate no significant policy impact on charges for our full sample of providers (Model 1) we do find a significant policy effect when we restrict the sample to those providers most likely to change their behavior in response to the PCIP ie the providers that were near eligibility More specifically for the sample of providers who were near the PCIP eligibility threshold in 2009 (ie Model 3) the estimated coefficient of the interaction term in the last column of Exhibit 16 shows that in response to the Medicare PCIP policy on average the allowed charges of primary care providers with a PCIP eligible specialty increased by about $5611 The estimated effect represents about 93 percent of the mean allowed charges ($60235) per provider per year for the providers with PCIP eligible specialties who were near the eligibility threshold in 2009 This estimated effect on the allowed charges in response to a 10 percent Medicare PCIP program suggests an implied elasticity of the allowed charges per provider per year with respect to the payment is about 1 (ie 9310) The effect is smaller if we restrict the sample to all the providers who submitted EampM claims under Medicare in all seven years The mean allowed charges per provider per year for these providers were $51016 Thus due to the Medicare PCIP policy they experienced an additional 56 percent increase ($2839$51016) in allowed charges One caveat surrounding these results is that since the actual Medicare payment may be smaller in magnitude compared to the allowed charges the increase in actual Medicare payments may be lower than our estimated increases in allowed charges
Exhibit 16 Impact of Medicare PCIP Policy on Allowed Charges for PCIP Eligible EampM Claims (2005shy2011)
Dependent Variable Allowed
Charges for PCIP Eligible EampM
Claims per Provider (EampM
Payments)
Analysis Sample
(1)
EampM Charges
(2)
EampM Charges
(Providers in All Years)
(3)
EampM Charges
(Near Eligib 09)
PCIP Elig Specialty Indicator 74741 11382 7518
(10776) (15832) (10475)
Elig Specialty Ind x Post 2009 5944 28393 56109
(1328) (1769) (4206)
Post 2009 8285 12090 24180
(1835) (2327) (2120)
Age 5501 4099 1234
(3093) (4324) (3721)
Male 110676 131571 61031
(6897) (8780) (8071)
Urban shy10435 shy15097 shy19719
(1116) (1389) (1394)
Median Income ($10k) 8678 12737 9787
(6178) (7872) (7147)
Percent in poverty shy2473 shy1804 1343
(1470) (1862) (1750)
Population (10k) shy2646 shy3481 shy0464
(0322) (0416) (0384)
39
Final Report Health Practitioner Bonuses
Dependent Variable Allowed
Charges for PCIP Eligible EampM
Claims per Provider (EampM
Payments)
Analysis Sample
(1)
EampM Charges
(2)
EampM Charges
(Providers in All Years)
(3)
EampM Charges
(Near Eligib 09)
Percent Population over 65 12427 14194 12150
(1764) (2177) (2170)
Unemployment Rate 12175 15928 7567
(2998) (3869) (3632)
Primary Care Phypop10k shy7423 shy7227 shy1433
(0503) (0703) (0952)
PC Nonshyphypop10k shy3412 shy4836 shy1718
(1082) (1629) (1540)
Intercept shy371778 shy337862 shy158347
(12927) (18147) (13208)
Specialty Fixed Effects Yes Yes Yes
Year Fixed Effects Yes Yes Yes
State Fixed Effects Yes Yes Yes
N 2014835 1397760 746845
Adj Rshysq 0222 0246 0367
Note Robust standard errors are in parentheses + significance at 10 percent significance at 5 percent
So far we have found that the PCIP program resulted in increased allowed charges for EampM services per provider despite some decline in the corresponding number of EampM claims We have already discussed that one potential reason for the decline in the average volume of claims could be due the increase in the number of providers under PCIP eligible specialties that can be specifically attributed to the PCIP policy However the question still remains regarding a shift in the composition of services that may have resulted in increased allowed charges or payments despite the decline in the number of claims per provider
In order to gain a deeper understanding of this issue we estimate the impact of the Medicare PCIP policy on each key component of EampM services (Exhibit 17) More specifically we examine the impact of the policy on the volume of claims associated with services for new patients established patients and EampM claims for all other services EampM claims associated with services for established patients account for more than 80 percent of all the EampM claims (and allowed charges) submitted by providers with PCIP eligible specialties45 Furthermore 15 and 25 minute visits account for 40 percent and 30 percent of all EampM claims for established patients respectively Moreover the 25 minute visits account for a slightly higher share of allowed charges ie 38 percent relative to 34 percent for 15 minute visits
In Exhibit 17 we present the estimated impact of the PCIP on the average number of EampM claims per provider for three relevant samples of providers We find that the introduction of the Medicare PCIP policy reduced the average number of EampM claims submitted for both new and established patients The estimated impact suggests that on average the number of EampM claims per provider for 15 minute visits declined by an additional 46 among PCIPshyeligible providers compared to nonshyeligible providers Similarly results using the sample of all providers
45 For the providers near the PCIP eligibility threshold this share of EampM claims is almost 90 percent
40
lsquo
Final Report Health Practitioner Bonuses
suggest that EampM claims per provider for 25 minute visits increased by an additional 13 among PCIPshyeligible providers compared to nonshyeligible providers When we restrict the sample to providers near the PCIP eligibility threshold in 2009 the decline for EampM claims for 15 minutes visits due to PCIP policy is about 57 claims while the EampM claims associated with 25 minute visits increased by about 42 claims due to the PCIP policy
Exhibit 17 Estimated Impact of Medicare PCIP Policy on the Number of PCIP Eligible EampM Claims (2005shy2011)
Estimated coefficient of variable Elig Specialty Ind x Post 2009 from each DID Model
Dependent Variable Analysis Sample
All Providers in All Years Providers Near Eligibility lsquo09
All EampM Claims shy5173 shy3696 shy3259
New Patient Claims shy1354 shy1591 shy1172
Established Patient Claims shy3525 shy2091 shy2224
Other Claims shy2941 shy0150 1369
Claims by Duration (Minutes)
New Patient Visits
10 00673 00850 00551
20 0160 00269 0209+
30 shy5102 shy5894 shy4607
45 shy7697 shy8930 shy6854
60 shy0966 shy1194 shy0528
Established Patient Visits
5 shy3926 shy3621 shy6227
10 1611 1702 shy2487
15 shy4554 shy4716 shy5649
25 1257 2679 4155
40 00347 1382 1417
Note Robust standard errors are in parentheses + significance at 10 percent significance at 5 percent
The above findings raise the question of whether the policyshyinduced net decrease in the number of EampM claims will be reflected in the corresponding allowed charges To answer this question we estimated the potential impact of the PCIP policy on the allowed charges associated with the each component of the EampM claims (Exhibit 18)
The estimated impact of the PCIP policy on allowed charges associated with 15 minute visits for established patients suggests that on average the policy additionally reduced the total allowed charges by about $1577 per provider per year after 2009 However the estimated policy induced reduction in allowed charges is smaller for providers near the PCIP eligibility threshold ie a reduction of about $602
Moreover the PCIP policy additionally increased the total annual allowed charges by about $2740 per provider after 2009 for 25 minute visits for established patients This is a substantial increase considering that providers with PCIP eligible specialties had about $15217 in allowed charges per year for 25 minute visits for established patients The impact is even larger once the sample is restricted to providers near the PCIP eligibility threshold increase in
41
lsquo
Final Report Health Practitioner Bonuses
total annual allowed charges by about $6807 a 28 percent increase Similarly allowed charges associated with all EampM services for all established patients increased substantially by about $6544 or 12 percent for providers near the PCIP eligibility threshold In the case of all providers the estimated increase in total annual allowed charges for established patients was $1245 per provider We find that the PCIP policy resulted in increased Medicare allowed charges across all providers with PCIP eligible specialties This increase in allowed charges is likely to have also resulted in increased payments for these primary care EampM services
Exhibit 18 Estimated Impact of Medicare PCIP on the Allowed Charges for PCIP Eligible EampM Claims (2005shy2011)
Estimated coefficient of the variable Elig Specialty Ind x Post 2009 from each DID Model
Dependent Variable Analysis Sample
All Providers in All Years Providers Near Eligibility lsquo09
All EampM Payments 5944 28393 56109
New Patient Payments shy19109 shy22065 shy16024
Established Patient Payments 12446 39059 65439
Other Payments 7258 11400 6694
Payments by Duration (Minutes)
New Patient Payments
10 0951 1407+ 0706
20 shy1710 shy2891 shy1237+
30 shy5445 shy6203 shy4922
45 shy11845 shy13594 shy10331
60 shy1658 shy1993 shy6551
Established Patient Payments
5 shy7515 shy7066 shy1223
10 shy3412 shy3594+ shy1183
15 shy15772 shy10952 shy6017
25 27404 46709 68070
40 1906 4367 5792
Note Robust standard errors are in parentheses + significance at 10 percent significance at 5 percent
42
Final Report Health Practitioner Bonuses
Analyzing the Impact of Financial Incentives for Primary Care Providers in Shortage Areas
A Background
Access to health care in underserved areas has been an ongoing source of concern among policy makers A 2013 CRS report for the congress (Physician Supply and the ACA by EJ Heisler) indicates that the expansion of health insurance coverage under the ACA is likely to stimulate the demand for primary care in general and also in the underserved areas HRSA designates certain underserved areas as primary care Health Profession Shortage Areas (HPSAs) These areas meet a defined threshold of physicians to population ratio46 HPSA designations are currently limited to primary medical care HPSAs dental HPSAs and mental health HPSAs In this section we focus on only primary care HPSAs All nonshyfederal Doctors of Medicine (MD) and Doctors of Osteopathy (DO) providing direct patient care and who practice principally in one of the four primary care specialties shy general or family practice general internal medicine pediatrics and obstetricsgynecology shy will be counted under the definition of primary care HPSA As previously noted since 1987 Medicare has been paying bonus payments initially five percent to physicians providing care in rural geographic HPSAs In 1991 the bonus payment was increased to 10 percent and eligibility extended to services provided by physicians in urban geographic HPSAs Thus this particular form of bonus payment has been in place for almost 25 years Although the HPSA bonus is available to nonshyprimary care providers such as dentists and mental health care providers for the purpose of this study we focus only on primary care providers eligible for primary care HPSA bonus
Section 413a of the Medicare Modernization Act put in place an additional 5 percent bonus payment for physicians practicing in Physician Scarcity Areas (PSAs)47 PSAs were those counties and rural zip codes in MSAs with the lowest physician to population ratios These areas often coincided with geographic HPSAs so that physicians practicing in those areas received a 15 percent additional bonus payment during 2005shy2008 when the PSA bonuses were in effect
Some key points to note regarding the PSA bonus are the following
Medicare paid the 5 percent PSA bonus on a quarterly basis and the bonus was based on what Medicare actually paid not the Medicareshyapproved payment amount
The same service could be eligible for the PSA bonus and the HPSA bonus
The payment was based on where the service is performed not on the address of the beneficiary
46 Health Professionals Shortage Areas (HPSAs) are based upon criteria set forth under Section 332 of the Public
Health Service Act HPSAs are defined to include 1) urban and rural geographic areas 2) population groups and 3) facilities with shortages of health professionals HPSA designations are currently limited to primary medicalcare HPSAs dental HPSAs and mental health HPSAs in the past similar designations identified shortages in a wide variety of health professions including podiatry pharmacy and veterinary medicine (Salinsky 2010) For primary care HPSAs one of the following two conditions must prevail within the area a) a ratio of population to fullshytimeshyequivalent primary care physician of at least 35001 or b) a ratio of population to fullshytimeshyequivalent primary care physician of less than 35001 but greater than 30001 and an unusually high need for primary care services or insufficient capacity of existing primary care providers
47 The expiration of the PSA bonus in 2008 was likely a result of Medicare expenditures being capped by law In
House Bill HR 6331 of 2008 the cut was equivalent to 106 percent In order to avoid the 106 percent loss PSA designations were allowed to expire which automatically led to the expiration of the PSA bonus Source httpwwwgrahamshycenterorgonlineetcmedialibgrahamdocumentsmedicareshypaymentmaPar0001Filetmpmapdf
43
Final Report Health Practitioner Bonuses
The PSA bonus was paid on services rendered on or after January 1 2005 through June 30 2008
Only the physician designations of General Practice Family Practice Internal Medicine and ObstetricsGynecology were paid the bonus for the ZIP code areas designated as primary care PSAs All other physician provider specialties were eligible for the specialty PSA area bonus for the ZIP codes areas designated as specialty PSAs48 Once again for the purpose of this study we focus only on the primary care physicians with PSA bonus eligible specialties
Our main claimsshylevel data includes a variable that indicates the location of each provider Additionally CMS provides the list of HPSA and PSA areas In this section we review the PSA geographic areas and the extent of overlap with HPSAs Physicians practicing in these overlap areas received a 15 percent additional bonus payment during 2005shy2008 when the PSA bonuses were in effect
In the exhibits below we present the distribution of primary care providers across HPSA and PSA areas Due to limited data we do not present provider counts for HPSA areas prior to 2007 while the PSA bonus was no longer in place after 2008 Moreover we do not use data from 2011 for the DID analysis as it will include the confounding effect of Medicare PCIP49
Although the PSA bonus does not apply to nonshyphysicians we report the number of nonshyphysicians in PSA areas (in italics) for comparison purposes
We consider only those counties that have a full rather than partial primary care HPSA designation In 2011 we identified 1279 full HPSA counties covering 40 percent of the total US population Exhibits 19 amp 20 show the distribution of PCPs and 2011 PCIP recipients across HPSA and PSA areas over the 2005shy2011 period
48 Dentist Podiatrists Optometrists and Chiropractors were not eligible for PSA bonus Source
httpwwwcmsgovMedicareMedicareshyFeeshyforshyServiceshyPaymentHPSAPSAPhysicianBonusesPSAhtml For zip codes that are not in CMS PSA zip code list the bonus payment cannot be made automatically In these cases physicians have to check whether the county where service is provided is included in CMS PSA county list If the county is included in the PSA county list then physicians need to include ldquoARrdquo modifier in their claims to collect PSA bonus
49 If a region switched its HPSA status in 2011 which is also the first year Medicare PCIP was available
econometrically it would be difficult to disentangle the effects of these two changes The indicator variables showing change in HPSA status and availability of PCIP would be perfectly collinear
44
Final Report Health Practitioner Bonuses
Exhibit 19 Distribution of Primary Care (PC) Providers by HPSA and PSA Regions
2005 2006 2007 2008 2009 2010 2011
PC Physicians Total Total Total Total Total Total Total
All Providers 13835 6
100 14777 1
100 16515 0
100 17301 8
100 17878 4
100 18507 0
100 19193 0
100
in HPSA x x x x 72804 441 77656 449 79620 445 82101 444 81855 426
in PSA 14446 104 15336 104 17026 103 17323 10 NA NA NA NA NA NA
Both in HPSA amp PSA x x x x 6267 38 6461 37 NA NA NA NA NA NA
PCIP 2011 Recipients 93886 100 99359 100 10896 6
100 11505 0
100 12114 0
100 11749 0
100 11400 2
100
in HPSA x x x x 46578 427 50451 439 52871 436 50762 432 47458 416
in PSA 9771 104 10282 103 11290 104 11605 101 NA NA NA NA NA NA
Both in PSA amp HPSA x x x x 3927 36 4143 36 NA NA NA NA NA NA
PC NonshyPhysicians
All Providers 46634 100 53823 100 68297 100 80041 100 88569 100 97789 100 10935 3
100
in HPSA x x x x 28248 414 33148 414 36700 414 40411 413 43902 401
in PSA 5221 112 5894 11 7379 108 8301 104 NA NA NA NA NA NA
Both in HPSA amp PSA x x x x 2919 43 3270 41 NA NA NA NA NA NA
PCIP 2011 Recipients 18681 100 21456 100 27188 100 34363 100 41202 100 37756 100 35380 100
in HPSA x x x x 11310 416 14279 416 17150 416 15614 414 14256 403
in PSA 2328 125 2603 121 3214 118 3802 111 NA NA NA NA NA NA
Both in PSA amp HPSA x x x x 1273 47 1527 44 NA NA NA NA NA NA
Note HPSA includes only full HPSA areas (data from Area Resource File and HPSA status data are not available prior to 2007) PSA status after 2008 is not applicable as 2008 was the final year of the PSA bonus
45
Final Report Health Practitioner Bonuses
Around 40 percent of all primary care providers supplied services in primary care HPSA counties while roughly 10 percent did so in PSA counties The extent of overlap between these two designations amounts to approximately 3 to 4 percent of providers working in dualshydesignation areas We do not observe important differences in these distributions between all providers and PCIP recipients The same general observations apply to the two most represented specialties ie family practice and internal medicine (Exhibit 20)
Exhibit 20 Distribution of the Number of Internal Medicine and Family Practice Physicians by HPSA and PSA regions
Practice Area 2005 2006 2007 2008 2009 2010 2011
Internal Medicine
All Physicians 69391 74411 83117 87090 90291 93904 97526
in HPSA x x 38011 40382 41411 43461 43188
in PSA 5428 5770 6390 6521 NA NA NA
in HPSA amp PSA x x 2304 2372 NA NA NA
PCIP 2011 Recipients 43188 45502 49451 51813 54062 52576 51007
in HPSA x x 22166 23824 24682 24113 22537
in PSA 3423 3585 3915 4009 NA NA NA
in PSA amp HPSA x x 1303 1386 NA NA NA
Family Practice
All Physicians 61438 65205 72247 75132 77536 79891 82298
in HPSA x x 29652 31700 32602 32954 32834
in PSA 8673 9168 10181 10361 NA NA NA
in HPSA amp PSA x x 3776 3921 NA NA NA
PCIP 2011 Recipients 48448 51377 56622 59902 63227 61584 59931
in HPSA x x 22979 24971 26284 24998 23450
in PSA 6220 6546 7199 7417 NA NA NA
in PSA amp HPSA x x 2561 2695 NA NA NA
Note HPSA includes only full primary care HPSA areas (data from Area Resource File and HPSA status data are not available prior to 2007) PSA status after 2008 is not applicable as 2008 was the final year of the PSA bonus
In the case of nonshyphysicians in 2008 around 40 percent were practicing in primary care HPSA areas (Exhibit B8 in Appendix B) Nurse practitioners and physician assistants alike were distributed almost equally between shortage and nonshyshortage areas in 2008 The same is true whether we look across all providers or only 2011 PCIP recipients
B Impact of the PSA Bonus on Primary Care Supply
Since the PSA bonus was in effect from 2005 to 2008 we applied a DID estimation method to identify the effect of elimination of PSA bonus on the following outcome variables number of eligible providers practitionersrsquo volume of services and their total payments We used the provider level data on the number of EampM claims and allowed charges associated with those claims from 2005 to 2011 The data from 2005 to June 2008 show the scenarios in the preshyelimination (of PSA bonus) period and the data from 2009 to 2010 provide outlook on the postshyelimination period Data from 2011 will not be used for the DID analysis as it will include the confounding effect of the Medicare PCIP bonus The sample is restricted to physicians with the
46
τ
Final Report Health Practitioner Bonuses
following PSA bonus eligible primary care specialties family practice internal medicine and OBshyGYN
Equation (1) below shows the econometric model we estimated to assess the impact of PSA bonus policy
lowast = + lowast + + lowast lowast + lowast + + (1)
The model in equation (I) is specified based on the provider level data in each year Here the dependent variable Sit is the volume of primary care (EampM) services provided by primary or nonshyprimary care practitioner i at time t Ti is an indicator for the treatment group that takes a value of 1 if the provider is in a primary care PSA area and zero otherwise PREt is an indicator variable taking the value of 1 if the services are provided during 2005shy2008 period (when PSA bonus program was in effect) and zero otherwise the vector Xit includes variables reflecting the provider characteristics features of their geographic locations etc and is a timeshyspecific fixed effect term The term εit represents random unobserved factors affecting services
If elimination of the PSA bonus was associated with a reduction in the volume of primary care EampM services provided by practitioners in those areas then we should expect the estimated value of 8 to be positive A positive estimated value of 8 would imply higher volume of services during the period when the PSA bonus was in effect In addition the interpretation of the first four terms in equation (I) is as follows
(α + β + θ + δ) = the average number of EampM claims during the PSA period (PRE) for providers located in the PSA regions
(α + β) = the average number of EampM claims during the PostshyPSA period for providers located in the PSA regions
(θ + δ) = the difference in the average number of EampM claims between the PSA and PostshyPSA period for providers located in the PSA regions
θ = the difference in the average number of EampM claims between the PSA and PostshyPSA period for providers regardless of location
Exhibit 21 shows the results from the estimated DID model to identify the impact of the PSA bonus policy on the supply of primary care services We found that on average providers with PSA bonus eligible specialties irrespective of location were estimated to have about 153 more claims submitted during the PSA period compared to the postshyPSA period However bonusshyeligible providers located in PSA areas had on average an additional 50 claims per year compared to those located in nonshyPSA areas We attribute this additional increase in the volume of primary care EampM services to the PSA bonus policy On the other hand we do not find a statistically significant impact of the PSA bonus policy on the total annual allowed charges per physician (column 2)
47
Final Report Health Practitioner Bonuses
Exhibit 21 Impact of PSA Bonus on the Number of EampM Claims under Medicare 2005shy2010
Number of EampM Claims(1) Allowed Charges for
EampM Claims ($)(2)
Location PSA PC Indicator (PSAPC) 7055 56220
(6177) (4154)
PSA Year Indicator (2005shy2008) 1526 8709
(4405) (2964)
PSAPC PSA Year Ind 4984 shy2412
(7276) (4765)
Age 1376 8845
(00757) (5104)
Male 2069 134952
(1453) (1026)
Urban shy3192 shy4230
(2892) (1849)
Median Income ($10k) shy1047 9267
(1430) (9766)
Percent under poverty shy6671 shy3527
(0359) (2332)
shy0144 shy4476
(000680) (0483)
Percent Population over 65 1936 13894
(0424) (2815)
Unemployment Rate 1574 13370
(0720) (4964)
Primary Care Phymcarepop10k shy0110 shy2049
(00139) (0939)
PC Nonshyphymcarepop10k shy0977 shy7510
(00390) (2675)
Intercept shy6872 shy560014
(1898) (12556)
Specialty Fixed Effects Yes Yes
Year Fixed Effects Yes Yes
State Fixed Effects Yes Yes
N 1006453 1006453
Adj Rshysq 0182 0175
Note Robust standard errors are in parentheses + significance at 10 percent significance at 5 percent The sample is restricted to only providers with the following PSA eligible specialty family practice internal medicine and OBshyGYN
Exhibit 22 shows the results from the estimated DID model to identify the impact of the PSA bonus policy on the number of primary care providers at the zip code level As explained above our primary focus is the estimated coefficient of the interaction term between the PSA status indicator of the location of physicians and the PSA period (ie 2005shy2008) The number
48
Population (10k)
Final Report Health Practitioner Bonuses
of providers with PSA bonus eligible specialties is estimated to increase by about one in PSA areas during the PSA period compared to the number of providers in nonshyPSA areas This represents a meaningful increase given that on average there are about six primary care providers in PSA areas We attribute this additional increase in the number of primary care providers to the PSA bonus policy
Exhibit 22 Impact of PSA Bonus on the Number of Primary Care Providers per County (2005shy2010)
Number of Providers with PSA
Bonus Eligible Specialty
Location PSA PC Indicator (PSAPC) shy4951
(0371)
PSA Year Indicator (2005shy2008) shy1722
(0439)
PSAPC PSA Year Ind 1149
(0301)
Urban 5950
(0221)
Median Income ($10k) 0468
(0150)
Percent in poverty 0256
(0040)
Population (10k) 0007
(0001)
Percent Population over 65 0139
(0033)
Unemployment Rate shy0037
(0057)
Primary Care Phymcarepop10k 0146
(0024)
PC Nonshyphymcarepop10k 0037
(0017)
Intercept shy5250
(1522)
Year Fixed Effects Yes
State Fixed Effects Yes
N 78519
Rshysq 00856
Note Robust standard errors are in parentheses + significance at 10 percent significance at 5 percent The sample is restricted to only providers with the following PSA eligible specialty family practice internal medicine and OBshyGYN
C Impact of the HPSA Bonus on Primary Care Supply
Access to health care in shortage areas has been an ongoing source of concern among policy makers Expansion of health insurance coverage through the implementation of the ACA is
49
Final Report Health Practitioner Bonuses
likely to stimulate the demand for primary care in general and specifically in these shortage areas HRSA designates these shortage areas as primary care Health Profession Shortage Areas (HPSAs) using a defined threshold of primary care physicians to population ratio The HPSA bonus has been in place since 1987 and since 1991 the bonus payment remained at 10 percent of the fees associated with the bonus eligible Medicare claims50
In the absence of any variation in the HPSA bonus percentage in the recent past we rely on the change in the primary care HPSA status of different counties in the US over the period between 2007 and 2010 In other words we rely on the variation in HPSA status over time and across counties to identify the effect of the policy We detail the econometric model and exact interpretation of estimated coefficients in Appendix C2 Our analysis of the Area Resource File indicates that 205 US counties gained primary care HPSA status during 2007shy2011 while 257 counties lost their HPSA status51 Subsequently we analyze the changes in the outcomes of interest among primary care providers over time due to changes in the countyrsquos HPSA status during this period It is important to note that although HPSA bonus applies to physicians generally in this section we only focus on primary care physicians with primary care HPSA bonus eligible specialties described earlier The primary outcome variables that we analyzed to identify the changes in physiciansrsquo practice behavior are the volume of primary care services and total Medicare allowed charges associated with those services as captured in Medicare claims data In this framework we have assumed that the HPSA status of an area is exogenous to an individual providerrsquos decision to serve a certain number of patients or provide a given volume of services or any other individualshylevel outcomes However the HPSA status of an area may not be exogenous in models where the outcome of interest is the number of providers relative to the size of population in a given geographic area at the aggregate level This is specifically due to the fact that the HPSA status is designated based on the physicianshy toshypopulation ratio in the area as a whole
The coefficient of the interaction term between the county primary care HPSA status indicator (HPSAPC) and the indicator of whether the county ever gained the HPSA status shows the additional impact of HPSA status on the average number of claims per physician in column 1 (or payments in column 2) in the counties that ever gained the HPSA status (full model specification detailed in Appendix C2) As shown in Exhibit 23 we found that on average Medicare physicians with primary care specialties who are located in counties that ever gained the HPSA status tend to have about 17 more EampM claims submitted annually specifically due to the gain of full HPSA status The effect is statistically significant at 10 percent significance level On the other hand the loss of HPSA status does not seem to have any statistically significant impact on the number of EampM claims
50 Physicians who furnish services to Medicare beneficiaries in areas designated as primary care geographic HPSAs by HRSA as of December 31 of the prior year are eligible for the Medicare HPSA bonus during the current year Since 2005 the HPSA physician bonus payment has been automatically made to physicians who furnish services to Medicare beneficiaries in a ZIP code on the list of ZIP codes eligible for automatic HPSA bonus payment This list is updated annually and is effective for services furnished on and after January 1 of each calendar year Physicians who furnish services to Medicare beneficiaries in a geographic HPSA that is not on the list of ZIP codes eligible for automatic payment must use the AQ modifier ldquoPhysician providing a service in an unlisted Health Professional Shortage Area (HPSA)rdquo on the claim to receive the bonus payment Services that are submitted with the AQ modifier are subject to validation by Medicare The bonus is paid quarterly and is based on the amount paid for professional services
51 Area Resource File (ARF) or Area Health Resource File is an extensive county level database assembled annually
by Health Resources and Services Administration (HRSA) from over 50 sources Source httparfhrsagov
50
Final Report Health Practitioner Bonuses
Exhibit 23 Impact of HPSA Bonus on the Number of EampM Claims and Allowed Charges per Physician under Medicare 2007shy2010
Number of EampM Claims
per Physician(1)
Allowed Charges for
EampM Claims per
Physician ($)(2)
County HPSA PC Indicator (HPSAPC) shy4386 shy30245
(2500) (1721)
Ever Gained HPSA Status Indicator (ToHPSA) shy3991 shy25934
(6900) (4593)
Ever Lost HPSA Status Indicator (ToNonHPSA) shy6122 shy51496
(6772) (4673)
HPSAPCToHPSA 1741+ 4070
(9500) (6491)
HPSAPCToNonHPSA 1137 13804
(8005) (5506)
Age 1268 8544
(00845) (5927)
Male 1927 131368
(1645) (1208)
Urban shy4187 shy6167
(3324) (2220)
Median Income ($10k) shy6798 10347
(1636) (1162)
Percent under poverty shy5469 shy3003
(0416) (2838)
Population (10k) shy0116 shy3253
(000808) (0591)
Percent Population over 65 2129 15447
(0481) (3361)
Unemployment Rate 2043 16501
(0803) (5655)
Primary Care Phymcarepop10k shy000218 4187
(00126) (0881)
PC Nonshyphymcarepop10k shy0951 shy6878
(00362) (2535)
Intercept shy5943 shy578914
(2007) (13846)
Specialty Fixed Effects Yes Yes
Year Fixed Effects Yes Yes
State Fixed Effects Yes Yes
N 743907 743907
Adj Rshysq 0188 0184
Note Robust standard errors are in parentheses + significance at 10 percent significance at 5 percent The sample is restricted to only providers with HPSA eligible specialty family practice internal medicine pediatrics and OBshyGYN
51
Final Report Health Practitioner Bonuses
Next we focus on the impact of primary care HPSA status on the Medicare allowed charges per physicians associated with EampM claims (Exhibit 23 column 2) Column 2 indicates that Medicare primary care physicians who are located in counties that ever gained HPSA status do not experience significant changes in annual allowed charges per physician for EampM claims specifically due to the gain of full HPSA status However Medicare physicians with primary care who are located in counties that ever lost HPSA status tend to have about $1380 more allowed charges annually when the location has the full HPSA status This effect is statistically significant at 5 percent significance level
For our analysis of the impact of HPSA status on the volume of services in terms of EampM claims we focused only on the behavior of primary care physicians We found that on average Medicare primary care physicians tend to submit about 17 more EampM claims annually specifically due to the gain of full HPSA status This may suggest that HPSA bonus may encourage primary care providers to increase access to primary care services In addition based on our analysis of allowed charges for EampM Services we find that the Medicare primary care physicians who are located in counties that ever lost primary care HPSA status tend to have about $1380 more allowed charges annually before the location lost full HPSA status Thus gaining HPSA status is also associated with gain in additional earnings for primary care physicians Hence our analysis finds supportive evidence that HPSA bonus may improve access to primary care services in shortage areas
Finally when the outcome of interest is the PCP to population ratio at the county level relying on the change in primary care HPSA status as the primary source of variation to identify an effect of HPSA status poses additional estimation challenges The phenomena that cause decision makers to change the status may be highly correlated with our outcome of interest In this sense the HPSA status would be an endogenous variable in the regression model where the outcome of interest is the number of primary care providers per county Specifically this endogeneity problem may bias the effect of HPSA status on the number of primary care physicians toward zero One potential way to circumvent the issue of endogeneity of the HPSA status above would be to use the instrumental variable (IV) approach The IV approach relies on the identification of variables ie instruments that would be correlated with HPSA status and that would affect the providershytoshypopulation ratio only through the HPSA status variable These IVs will then be used in the regression framework to tease out the unbiased effect of the HPSA status on the providershytoshypopulation ratio However IVs are not always readily available In future upon availability of appropriate IVs a more inshydepth study can be carried out to resolve the problem of this endogeneity to estimate the unbiased effect of HPSA status on the providershytoshypopulation ratio52
52 Despite the issue of endogeneity of HPSA status we analyze the changes in the number of Medicare primary care
physicians per 10 thousand Medicare populations and the changes in the absolute number of Medicare primary care physicians over time due to changes in the countyrsquos HPSA status during the period of 2007shy2011 using the same DID framework laid out earlier The results from these estimated models are available upon request
52
Final Report Health Practitioner Bonuses
Modeling the Impact of the Increase in Medicaid Reimbursement Rate Relative to the Medicare Rate
A Study Design Overview
The availability of primary care is particularly important for public payer programs such as Medicaid and Medicare Historically Medicaid has been the less generous payer for primary care services relative to Medicare paying just 66 percent of Medicare rates on average53 In this section we first describe the variation in Medicaid reimbursement rates relative to those for Medicare both for primary care and for all services across US states during the period 2008shy2012 and second simulate the effect of a 10 percent increase in the MedicaidshytoshyMedicare fee index on the proportion of US officeshybased physicians accepting new Medicaid patients across all states
Cunningham et al (2011) report that fewer physicians accept new Medicaid patients in response to the low Medicaid reimbursement rates in several states Decker (2012) used data on officeshybased physicians from the 2011 National Ambulatory Medical Care Survey Electronic Medical Records Supplement to summarize the percentage of physicians currently accepting any new patients She finds that 694 percent of physicians in the sample accepted new patients with Medicaid This was lower than the percentage accepting new selfshypay (917 percent) Medicare (830 percent) or privately insured patients (817 percent) Logit regression model estimates showed that raising Medicaid fees to Medicare levels for all physicians a 258 percentageshypoint (35 percent) increase in the current average ratio of 742 would increase the acceptance rate of new Medicaid patients by 86 percentage points (12 percent) shy from an average of 694 percent across physicians to an average of 786 percent
Zuckerman et al (2009) reported that in 2008 stateshylevel average primary care physician fees under Medicaid ranged from 57 percent of the national average Medicaid fees in Rhode Island to 226 percent of national average in Alaska They also found that after strong Medicaid fee growth during 1998shy2003 Medicaid fees fell relative to inflation during 2003shy2008 Despite the slowdown in overall fee growth Medicaid fees for primary care services kept pace with inflation The ACA increases Medicaid reimbursement rates for certain services provided by primary care physicians to 100 percent of Medicare rates in 2013 and 2014 Given the variability of Medicaid payments across states this could be a substantial boost in payments for physicians in some states and less so in others
Zuckerman et al (2009 2012) provided stateshylevel MedicaidshytoshyMedicare fee indices for 2008 and 2012 These studies show that the national average Medicaid reimbursement rate for primary care services declined from 66 percent of the Medicare rate in 2008 to 59 percent in 2012 (about 106 percent decline) However the national average MedicaidshytoshyMedicare fee index for all services declined by about 83 percent (from 72 percent in 2008 to 66 percent in 2012) during the same period
Exhibit 24 reveals wide stateshytoshystate variation in the Medicaid fee relative to the Medicare rate in both 2008 and 2012 In several states including California Florida Michigan New York and Rhode Island the Medicaid primary care fee in 2012 was less than 50 percent of the Medicare rate In several other states including Alaska Delaware Montana North Dakota Oklahoma and Wyoming the Medicaid primary care fee was above 90 percent of the Medicare rate in the same year
53 Small DM and T McGinnis (2012) ldquoLeveraging the Medicaid Primary Care Rate Increase The Role of
Performance Measurementrdquo Center for Health Care Strategies Inc
53
Final Report Health Practitioner Bonuses
There is substantial variation in the percentage change in the MedicaidshytoshyMedicare fee index across these states too During 2008shy2012 most of the states except Maine Mississippi New Jersey New York North Dakota and DC experienced a decline in the MedicaidshytoshyMedicare fee index for all services and for primary care services Another exception is Minnesota where the MedicaidshytoshyMedicare fee index for all services declined by 66 percent during the same period but the index for primary care services increased by about 259 percent In Arizona Georgia Louisiana Michigan Nevada Virginia and Wyoming the decline in MedicaidshytoshyMedicare fee index for primary care is more than 15 percent
Decker (2012) and Cunningham (2011) exploit the stateshylevel variation in the Medicaid reimbursement rates and they examine the impact of an increase in Medicaid fee relative to Medicare on physiciansrsquo propensity to accept Medicaid patients
Cunningham (2011) uses 2008 Health Tracking Physician Survey on 1748 primary care physicians (PCPs) The empirical analysis includes the estimation of a linear probability regression model of whether a PCP is accepting new Medicaid patients using the stateshylevel Medicaid reimbursement rate relative to Medicare rate as one of the independent variables The key findings of this study can be summarized as follows
Average MedicaidshytoshyMedicare fee ratio for primary care in 2008 was 662 percent
On average PCPs accepting all or new Medicaid patients in the US in 2008 was 415 percent
One percentage point increase in MedicaidshytoshyMedicare fee ratio increases theshyproportion of PCPs accepting Medicaid patients by 0214shy
Thus based on the findings in Cunningham (2011) the implied elasticity of accepting primary care patients with respect to the MedicaidshytoshyMedicare fee is about 03454 In other words a 10 percent increase in the Medicaid fee relative to Medicare across all states would imply an increase in the acceptance rate of Medicaid patients from 415 percent to 429 percent nationally The estimated elasticity also suggests that under MedicaidshyMedicare payment parity the national average acceptance rate would go up from 415 percent to 487 percent55
The analytical findings presented here can be improved further if the data on proportion of physicians accepting new Medicaid patients in 2012 are available for each state Similarly availability of the stateshylevel MedicaidshytoshyMedicare fee index in 2011 can also refine the simulation results
54 The implied elasticity is calculated by The Lewin Group and it is based on the following statistics reported in the
study the national average MedicaidshytoshyMedicare fee ratio in 2008 (662 percent) the national average of PCPs accepting all or new Medicaid patients (415 percent) in 2008 and the estimated coefficient of MedicaidshytoshyMedicare fee ratio (0214) The estimated coefficient of 0214 implies that if the MedicaidshytoshyMedicare fee ratio increases by 1 percent from the national average (ie from 662 to 6686) then national average proportion of PCPs accepting Medicaid patients goes up by 0214(6686shy662) asymp 014 This is about 034 percent (100014415) increase in the proportion of PCPs accepting Medicaid patients Therefore the implied elasticity = ( percent change in proportion of PCPs accepting Medicaid patients) ( percent change in MedicareshytoshyMedicare fee ratio) = 0341 = 034
55 Lewinrsquos calculation of the new acceptance rate under MedicaidshyMedicare payment parity = [034(100shy
662)662+1]415 asymp 487
54
shy shy
shy shy
shy shy
shy
Final Report Health Practitioner Bonuses
Exhibit 24 MedicaidshytoshyMedicare Fee Index
States Medicare Fee Index Medicare Fee Index
Medicare Fee Index 2008
2012
All Services Primary care
All Services Primary care
All Services Primary care
US 072 066 066 059 shy83 shy106
AL 089 078 078 070 shy124 shy103
AK 140 140 124 127 shy114 shy93
AZ 106 097 082 075 shy226 shy227
AR 089 078 079 070 shy112 shy103
CA 056 047 051 043 shy89 shy85
CO 086 087 071 074 shy174 shy149
CT 099 078 087 071 shy121 shy90
DE 100 100 097 098 shy30 shy20
DC 058 047 080 080 379 702
FL 063 055 057 049 shy95 shy109
GA 090 086 075 070 shy167 shy186
HI 073 064 062 057 shy151 shy109
ID 103 103 088 089 shy146 shy136
IL 063 057 062 054 shy16 shy53
IN 069 061 062 055 shy101 shy98
IA 096 089 082 077 shy146 shy135
KS 093 094 078 082 shy161 shy128
KY 086 080 077 072 shy105 shy100
LA 092 090 075 075 shy185 shy167
ME 063 053 065 063 32 189
MD 087 082 073 070 shy161 shy146
MA 088 078 077 068 shy125 shy128
MI 063 059 051 046 shy190 shy220
MN 076 058 071 073 shy66 259
MS 087 084 090 090 34 71
MO 072 065 059 057 shy181 shy123
MT 103 096 097 094 shy58 shy21
NE 101 082 087 076 shy139 shy73
NV 104 093 074 068 shy288 shy269
NH 073 067 058 060 shy205 shy104
NJ 037 041 045 050 216 220
NM 107 098 092 085 shy140 shy133
NY 043 036 055 042 279 167
NC 095 095 082 085 shy137 shy105
ND 102 101 134 135 314 337
OH 069 066 061 059 shy116 shy106
OK 100 100 097 097 shy30 shy30
55
2008 Medicaid-to- 2012 Medicaid-to- Change in Medicaid-to-
-
shy shy
shy shy
shy shy
shy
Final Report Health Practitioner Bonuses
States Medicare Fee Index Medicare Fee Index
Medicare Fee Index 2008
2012
All Services Primary care
All Services Primary care
All Services Primary care
OR 090 078 081 072 shy100 shy77
PA 073 062 070 056 shy41 shy97
RI 042 036 037 033 shy119 shy83
SC 093 086 081 074 shy129 shy140
SD 095 085 076 069 shy200 shy188
TX 074 068 065 061 shy122 shy103
UT 082 076 074 074 shy98 shy26
VT 095 091 080 081 shy158 shy110
VA 090 088 080 074 shy111 shy159
WA 093 092 076 066 shy183 shy283
WV 085 077 080 074 shy59 shy39
WI 085 067 077 060 shy94 shy104
WY 143 117 116 096 shy189 shy179
Source Zuckerman et al (2009 and 2012) data on Tennessee were not available
Decker (2012) used data from the 2011 National Ambulatory Medical Care Survey Electronic Medical Records Supplement of 3979 officeshybased physicians (PCPs and nonshyPCPs) The studyrsquos empirical analysis included estimation of a logit regression model of whether an officeshybased physician is accepting new Medicaid patients A key variable in this analysis was the stateshylevel MedicaidshytoshyMedicare fee index of 200856 The key findings of this analysis were
Average MedicaidshytoshyMedicare fee ratio for all services (2008) was 72 percent
The average officeshybased physician new Medicaid patient acceptance rate for 2011 was 694 percent
Among PCPs the acceptance rate was 662 percent among nonshyPCPs the acceptance rate was 717 percent
Based on the logit parameter estimates she finds that an increase in the fee ratio from 742 to 100 would be expected to increase acceptance of new Medicaid patients from 694 percent to 786 percent
In other words a 10 percent increase in MedicaidshytoshyMedicare fee index for all services across all states would suggest a rise in the acceptance rate from 694 percent to 723 percent nationally57 Thus the implied elasticity of officeshybased physicians accepting new Medicaid patients with respect to the MedicaidshytoshyMedicare fee is about 04358 The study also finds that
56 One of the key limitations of the study is that the MedicaidshytoshyMedicare fee index is not available for year 2011
There may be substantial difference in stateshywide variation in these indices between 2008 and 2011 period In that case 2008 indices may not explain well the variation in the proportion of physicians accepting Medicaid patients
57 Lewinrsquos method of calculating the predicted proportion of accepting new Medicaid patients based on the estimated
logit model is explained in Appendix D 58
Lewinrsquos method of calculating the predicted proportion of accepting new Medicaid patients based on the estimated logit model is explained in Appendix D Using that method a 1 percent change in the 2008 national average
56
2008 Medicaid-to- 2012 Medicaid-to- Change in Medicaid-to-
-
shy shy
shy
shy shy
shy
Final Report Health Practitioner Bonuses
holding other things constant primary care officeshybased physicians are about 73 percentage point less likely to accept new Medicaid patients Decker also estimated the impact on the primary care physicians only and she found that the estimated impact is similar to the one reported above for all physicians More specifically she found that an increase in the MedicaidshytoshyMedicare fee ratio for primary care to 100 was predicted to increase acceptance of new Medicaid patients among primary care physicians from 647 percent to 717 percent
B Simulation Exercise
We simulated the effect of a 10 percent increase in the stateshylevel MedicaidshytoshyMedicare fee indices (for all services) from their 2008 level on the proportion of US officeshybased physicians accepting new Medicaid patients in each state59 A detailed description of the simulation methodology used to predict the proportion of officeshybased physicians accepting Medicaid patients is presented in Appendix D The simulation exercise is based on the empirical findings of Decker (2012) and the data on the proportion of US officeshybased physicians accepting new Medicaid patients for each state reported in the same study
Exhibit 25 summarizes the predicted proportion of US officeshybased physicians accepting new Medicaid patients by state For example in California the MedicaidshytoshyMedicare fee ratio in 2008 was substantially lower than the national average Subsequently only 571 percent of the officeshybased physicians in California were accepting new Medicaid patients Based on the simulation we find that a 10 percent increase in the MedicaidshytoshyMedicare fee index in California (from 056 to 062) would increase the proportion of officeshybased physicians accepting new Medicaid patients in California from 571 percent to 597 percent (about 46 percent increase)
Exhibit 25 Proportion of US Officeshybased Physicians Accepting New Medicaid Patients
States Medicare Fee Index
All Services 2008
physicians accepting
new Medicaid patients
2011
Predicted acceptance rate under
Fee Index (Based on Decker 2012)
(Non -Linear Projection)
US 072 694 722
AL 089 685 720
AK 140 821 857
AZ 106 785 817
AR 089 907 920
CA 056 571 597
CO 086 661 696
CT 099 607 650
DE 100 783 813
DC 058 752 772
MedicaidshytoshyMedicare fee index reported in the study (from 742 percent to 7492 percent) increases the proportion of officeshybased physicians accepting new Medicaid patients from 694 percent to 697 percent Therefore the implied elasticity = ( percent change in proportion of PCPs accepting Medicaid patients) ( percent change in MedicareshytoshyMedicare fee ratio) = ((697shy694)694)1 = 043
59 At this point stateshylevel MedicaidshytoshyMedicare fee index are not available for 2011 and the proportion of physicians
accepting new Medicaid patients are not readily available to Lewin by state in any year other than 2011 In future Lewin Group will explore the availability of such data to strengthen the analysis
57
Medicaid-to- of US office-based
10 rise in Medicaid-to-Medicare
shy
shy shy
shy
Final Report Health Practitioner Bonuses
States
Medicaid-to-
Medicare Fee Index
All Services 2008
of US office based
physicians accepting
new Medicaid patients
2011
Predicted acceptance rate under
10 rise in Medicaid-to-Medicare
Fee Index (Based on Decker 2012)
(Non Linear Projection)
FL 063 591 619
GA 090 674 710
HI 073 699 727
ID 103 847 870
IL 063 649 676
IN 069 706 732
IA 096 876 894
KS 093 682 719
KY 086 794 819
LA 092 621 661
ME 063 740 762
MD 087 659 695
MA 088 806 831
MI 063 811 829
MN 076 963 968
MS 087 796 821
MO 072 676 705
MT 103 899 915
NE 101 870 890
NV 104 752 787
NH 073 817 837
NJ 037 404 421
NM 107 863 885
NY 043 616 635
NC 095 764 795
ND 102 946 955
OH 069 720 745
OK 100 673 713
OR 090 795 821
PA 073 680 709
RI 042 689 706
SC 093 841 863
SD 095 941 950
TN 614
TX 074 699 727
UT 082 835 855
58
-
-
shy shy
shy
shy shy
shy
Final Report Health Practitioner Bonuses
States
Medicaid to
Medicare Fee Index
All Services 2008
of US office based
physicians accepting
new Medicaid patients
2011
Predicted acceptance rate under
10 rise in Medicaid to Medicare
Fee Index (Based on Decker 2012)
(Non Linear Projection)
VT 095 784 813
VA 090 760 790
WA 093 764 794
WV 085 809 833
WI 085 930 940
WY 143 993 995
Note The predicted proportions are based on the estimated logit model in Decker (2012)
Next we analyzed the implication of our findings from the Medicare PCIP policy analysis in the context of the MedicaidshyMedicare payment parity We have already discussed that based on our analysis the number of Medicare primary care providers accepting new Medicare patients increased by almost 10 percent in response to the Medicare 10 percent PCIP policy (Exhibit 14) According to Zuckerman et al (2012) the US average MedicaidshytoshyMedicare fee ratio for primary care services in 2012 was about 059 Thus MedicaidshyMedicare payment parity would imply almost a 70 percent increase in Medicaid fees over the 2012 US average Further the findings by Decker (2012) suggest that in 2011 almost 662 percent officeshybased primary care physicians accepted new Medicaid patients
Given the magnitude of the impact of the Medicare PCIP policy if the MedicaidshyMedicare payment parity policy at least triggers a 10 percent increase in MedicaidshytoshyMedicare fee ratio then we would expect the US average of officeshybased primary care physicians accepting new Medicaid patients to go up to at least 728 percent However considering the 2012 US average MedicaidshyMedicare payment parity would imply a much bigger percentage increase in payments than 10 percent payment increase under the Medicare PCIP policy It is challenging to use the estimated impact of PCIP program to extrapolate the impact of MedicaidshytoshyMedicare parity This is because (1) in general parity would require a much bigger change in MedicaidshytoshyMedicare fee ratio (compared to the 10 percent PCIP payment) and (2) our PCIP analysis is limited in the sense that it is not capturing continuous variation in the incentive payment due to the nature of the program Finally the actual increase in the absolute value of payment under the Medicare and Medicaid payment policies would depend on the volume of primary care services and the current state MedicaidshyMedicare fee index
Conclusions The Affordable Care Act includes two key provisions regarding reimbursement to primary care providers (a) it provides a 10 percent supplemental payment under the Medicare PCIP program to eligible providers (effective January 1 2011) and (b) it raises the Medicaid primary care reimbursement rate at least up to 100 percent of the Medicare rate ASPE has contracted with the Lewin Group to examine the role of Medicare PCIP and supplemental payment programs including the HPSA and PSA incentives in increasing the supply of primary care providers (PCP) and the access of patients to their services
We reviewed the health and labor economics literature to understand the nature and the size of the impact of any financial incentives on the labor supply behavior of PCPs and the resultant impact on the availability of primary care services estimated in the existing body of research
59
-- -
--
-
Final Report Health Practitioner Bonuses
We documented the prior empirical evidence of the impact of financial incentives on raising the supply of primary care workforce the volume of services impact on medical graduatesrsquo propensity to participate in primary care PCPsrsquo retirement decision etc This review also evaluated the past evidence on the effect of bonuses in shortage areas and their effectiveness to redistribute and retain primary care workforce Finally the review of the literature also focused on the stateshyspecific experiences with changes in their respective Medicaid payment rates for primary care and the resultant impact on the supply of PCPs their rate of acceptance of Medicaid patients and the volume of primary care services such as office visits or visits for EampM services
To explore these topics we constructed a provider level data set including all the claims submitted by the entire universe of Medicare providers in each year from 2005 to 2011 We linked Provider360 data (available from Lewin Grouprsquos parent company Optum Inc) and the AMA Physician Master File to add provider characteristics such as demographics (eg age gender) provider designation medical school and practice location We also added geographic location specific variables from the Area Resource File (ARF) based on the practice location information of providers
We find that as a result of the Medicare incentive payment the number of Medicare primary care providers has increased on average annually by about 28 providers per county from 2009 to 2011 The number of primary care physicians with PCIP eligible specialty increased by about 10 percent in response to the 10 percent incentive payment under the PCIP policy (ie elasticity of the number of primary care physicians with respect to the incentive payment is about 1) Eligible claims for some types of PCIP eligible EampM services and associated allowed charges have also increased For example on average there was a 7 percent increase in the number of 25 minute office visits claims due to the PCIP policy On the other hand in response to the PCIP policy there was a 93 percent increase in the average allowed charges (for the eligible services) among primary care provider with PCIP eligible specialties Our results regarding the PCIP impact should be interpreted with caution due to several reasons First we only observe one year after the PCIP was in effect and as data becomes available for the full 2011shy2015 period the magnitude and precision of our estimates may change Second given the limited timeframe of this incentive providers may not be willing to make longshylasting adjustments in their decision to supply primary care services Finally as Medicare providers become more familiar PCIP users in time and adjust their behavior the full impact of the incentive on provider behavior may change
In addition we find that Medicare providers were attracted to PSA areas through the PSA bonus and submitted 78 percent more EampM claims annually during the PSA period Gaining HPSA status also generated an additional 17 EampM claims submitted by primary care physicians with HPSA bonusshyeligible specialties Estimation of HPSA and PSA bonuses impact on primary care supply has been hindered by the existence of biases rising from the fact that the HPSA and PSA designation is a function of the current supply of providers While we try to mitigate some of these sources of bias future research is needed to provide a causal estimate of these bonuses
Finally we document the variation in Medicaid reimbursement rates relative to the Medicare rates both for primary care and for all services across US states during the period 2008shy2012 using the existing body of evidence Using the empirical results from our PCIP analysis we also perform an exercise to simulate the effect of a 10 percent increase in the MedicaidshytoshyMedicare fee index on the proportion of US officeshybased physicians accepting new Medicaid patients across all states The simulation suggests that a 10 percent increase in MedicaidshytoshyMedicare fee ratio would increase the US average of officeshybased primary care physicians accepting new Medicaid patients from 662 to 728 percent We caution against using the
60
Final Report Health Practitioner Bonuses
estimated impact of PCIP program to extrapolate the impact of MedicaidshytoshyMedicare parity This is because (1) in general parity would require a much bigger change in MedicaidshytoshyMedicare fee ratio (compared to the 10 percent PCIP payment) and (2) our PCIP analysis is limited in the sense that it is not capturing continuous variation in the incentive payment due to the nature of the program
61
Final Report Health Practitioner Bonuses
Appendices
Appendix A Bibliography and Literature Matrix Askildsen Jan Erik and Badi H Baltagi 2002 ldquoWill Increased Wages Reduce Shortage of Nurses A
Panel Data Analysis of Nursesrsquo Labour Supplyrdquo Health San Francisco 1ndash28 httpovidsptxovidcomspshy331aovidwebcgiampS=HIBGFPGCKJDDJIGINCCLIAGCBOJCAA00amp Complete+Reference=Ssh36|2|1
Aurlien H G Falck and G Jacobsen 1991 ldquoThe Physicianrsquos Choice of a Specialtyrdquo Tidsskrift for Den Norske Laegeforening Tidsskrift for Praktisk Medicin Ny Raekke 111 (17) 2133ndash2136
Bazzoli G J 1985 ldquoDoes Educational Indebtedness Affect Physician Specialty Choicerdquo Journal of Health Economics 4 (1) 1ndash19
Bindman Andrew B Jean Yoon and Kevin Grumbach 2003 ldquoTrends in Physician Participation in Medicaid The California Experiencerdquo The Journal of Ambulatory Care Management 26 (4) 334ndash43 httpwwwncbinlmnihgovpubmed14567277
Bloom Matt and George T Milkovich 1998 ldquoRelationships Among Risk Incentive Pay and Organizational Performancerdquo Academy of Management Journal 41 (3) 283ndash297 doi102307256908 httpconnectionebscohostcoman953549
Bodenheimer Thomas 2007 ldquoThe Primary Careshyspecialty Income Gap Why It Mattersrdquo Annals of Internal Medicine httpwebmailwendellmurraytaxescomhealthcarepolicypay_gappdf
Bolduc Denis B Fortin and MA Fournier 1996 ldquoThe Effect of Incentive Policies on the Practice Location of Doctors a Multinomial Probit Analysisrdquo Journal of Labor Economics httpwwwjstororgstable1023072535445
ChaixshyCouturier C I DurandshyZaleski D Jolly and P Durieux 2000 ldquoEffects of Financial Incentives on Medical Practice Results from a Systematic Review of the Literature and Methodological Issuesrdquo International Journal for Quality in Health Care Journal of the International Society for Quality in Health Care ISQua 12 (2) 133ndash142 httpwwwncbinlmnihgovpubmed10830670
Chou ChiushyFang and Anthony T Lo Sasso 2009 ldquoPractice Location Choice by New Physicians The Importance of Malpractice Premiums Damage Caps and Health Professional Shortage Area Designationrdquo Health Services Research 44 (4) (August) 1271ndash89 doi101111j1475shy6773200900976x httpwwwpubmedcentralnihgovarticlerenderfcgiartid=2739028amptool= pmcentrezamprendertype=abstract
Clemens Jeffrey and Joshua D Gottlieb 2014 ldquoDo Physicians Financial Incentives Affect Medical Treatment and Patient Healthrdquo American Economic Review 104(4) pp 1320shy1349
Coburn A F S H Long and M S Marquis 1999 ldquoEffects of Changing Medicaid Fees on Physician Participation and Enrollee Accessrdquo Inquiry a Journal of Medical Care Organization Provision and Financing 36 (3) 265ndash279
Cunningham Peter J 2011 ldquoState Variation in Primary Care Physician Supply Implications for Health Reform Medicaid Expansionsrdquo Research Briefs Center for Studying Health System Change (19) 1ndash 11 httpsfolioiupuieduhandle102441004
Cunningham Peter J and Ann S OrsquoMalley 2008 ldquoDo Reimbursement Delays Discourage Medicaid Participation by Physiciansrdquo Health Affairs 28 (1) w17ndashw28 httpwwwncbinlmnihgovpubmed19017679
Decker S 2012 ldquoIn 2011 Nearly OneshyThird of Physicians Said They Would Not Accept New Medicaid Patients but Rising Fees May Helprdquo Health Affairs 31 no8 pp 1673shy1679
Doran Tim Catherine Fullwood Hugh Gravelle David Reeves Evangelos Kontopantelis Urara Hiroeh and Martin Roland 2006 ldquoPayshyforshyperformance Programs in Family Practices in the United
62
thinsp
Final Report Health Practitioner Bonuses
Kingdomrdquo The New England Journal of Medicine 355 (4) (July 27) 375ndash84 doi101056NEJMsa055505 httpwwwncbinlmnihgovpubmed16870916
Dummit LA 2008 ldquoPrimary Care Physician Supply Physician Compensation and Medicare Fees What Is the Connectionrdquo Issue Brief Natl Health Policy Forum (827) http7612169157libraryissueshybriefsIB827_Physician_Income_11shy03shy08pdf
Fournier Gary M and Cheryl Henderson 2005 ldquoIncentives and Physician Specialty Choice a Case Study of Floridarsquos Program in Medical Sciencesrdquo Inquiry a Journal of Medical Care Organization Provision and Financing 42 (2) 160ndash170
Gagneacute Robert and Pierre Thomas Leacuteger 2005 ldquoDeterminants of Physiciansrsquo Decisions to Specializerdquo Health Economics 14 (7) 721ndash735 httpwwwncbinlmnihgovpubmed15678516
Gibbons Robert and Kevin J Murphy 1992 ldquoOptimal Incentive Contracts in the Presence of Career Concerns Theory and Evidencerdquo Journal of Political Economy (3792) (September) httpwwwnberorgpapersw3792
Gosden T F Forland I S Kristiansen M Sutton B Leese A Giuffrida M Sergison and L Pedersen 2001 ldquoImpact of Payment Method on Behaviour of Primary Care Physicians a Systematic Reviewrdquo Journal of Health Services Research Policy 6 (1) 44ndash55 httpeprintswhiteroseacuk52996
Grobler Liesl Ben J Marais S A Mabunda P N Marindi Helmuth Reuter and Jimmy Volmink 2009 ldquoInterventions for Increasing the Proportion of Health Professionals Practising in Rural and Other Underserved Areasrdquo Cochrane Database of Systematic Reviews Online 2 (1) CD005314 doi10100214651858CD005314pub2 httpwwwncbinlmnihgovpubmed19160251
Hadley J J Reschovsky C Corey and S Zuckerman 2009 ldquoMedicare Fees and the Volume of physiciansrsquo Servicesrdquo Inquiry 1Vol 46 No 4 Winter 2009shy2010 372shy390
Henderson M C D K Hunt and J W Williams 1996 ldquoGeneral Internists Influence Students to Choose Primary Care Careers The Power of Role Modelingrdquo The American Journal of Medicine 101 (6) 648ndash653
Hernoes E Marte Sollie and S Stroslashm 2000 ldquoEarly Retirement and Economic Incentivesrdquo The Scandinavian Journal of 102 (3) 481ndash502 httponlinelibrarywileycomdoi1011111467shy944200211abstract
Hogan F Paul and Ellen Bouchery 2010 ldquo A Model of Subspecialty Choice for Internal medicine Residentsrdquo prepared by The Lewin Group for the American College of Cardiology
Holmes George M 2005 ldquoIncreasing Physician Supply in Medically Underserved Areasrdquo Labour Economics 12 (5) (October) 697ndash725 doi101016jlabeco200402003 httplinkinghubelseviercomretrievepiiS0927537104000284
Kuhmerker K and T Hartman 2007 ldquoPayshyforshyperformance in State Medicaid Programsrdquo New York (NY) Commonwealth Fund
Lynch D C D A Newton M S Grayson and T W Whitley 1998 ldquoInfluence of Medical School on Medical Studentsrsquo Opinions About Primary Care Practicerdquo AAMC Academic Medicine Journal of the Association of American Medical Colleges 73 (4) 433ndash435
Manning WG Newhouse JP Duan N Keeler EB Benjamin B Liebowitz A et al 1988 ldquoHealth insurance and the demand for medical care Evidence from a randomized experimentrdquo Santa Monica CA RAND Corporation
McDonald Ruth and Martin Roland 2009 ldquoPay for Performance in Primary Care in England and California Comparison of Unintended Consequencesrdquo Annals Of Family Medicine 7 (2) 121ndash127 httpwwwpubmedcentralnihgovarticlerenderfcgiartid=2653973amptool=pmcentrezamprendertype=abs tract
Midtsundstad Tove 2012 ldquoEffects of Companiesrsquo Initiatives to Reduce Early Retirement Among Older Workersrdquo Nordic Journal of Working Life Studies 2(3) 89-108
63
thinsp
Final Report Health Practitioner Bonuses
Morrow R W A D Gooding and C Clark 1995 ldquoImproving Physiciansrsquo Preventive Health Care Behavior Through Peer Review and Financial Incentivesrdquo Archives of Family Medicine 4 (2) 165ndash169
Nicholson S 2002 ldquoPhysician Specialty Choice Under Uncertaintyrdquo Journal of Labor Economics 20 (4) 816ndash847
Nicholson Sean and C Propper 2011 ldquoMedical Workforcerdquo In Handbook of Health Economics 873ndash 923
Petersen Laura A LeChauncy D Woodard Tracy Urech Christina Daw and Supicha Sookanan 2006 ldquoDoes Payshyforshyperformance Improve the Quality of Health Carerdquo Annals of Internal Medicine 145 (1 Suppl) 538 author reply 538ndash539 httpwwwncbinlmnihgovpubmed16908917
Petterson Stephen M and Andrew W Bazemore 2012 ldquoProjecting US Primary Care Physician Workforce Needs 2010shy2025rdquo Annals of Family Medicine Vol 10 (No 6) 503ndash509 doi101370afm1431INTRODUCTION httpwwwannfammedorgcontent106503abstract
Piper Kip and Sellers Dorsey 2009 Global Payments to Improve Quality and Efficiency in Medicaid
Rabinowitz H K J J Diamond F W Markham and N P Paynter 2001 ldquoCritical Factors for Designing Programs to Increase the Supply and Retention of Rural Primary Care Physiciansrdquo Jama The Journal Of The American Medical Association 286 (9) 1041ndash1048 httpjamaamashyassnorgcgidoi101001jama28691041
Ramsey P G J B Coombs D D Hunt S G Marshall and M D Wenrich 2001 ldquoFrom Concept to Culture The WWAMI Program at the University of Washington School of Medicinerdquo Academic Medicine 76 (8) 765ndash775
Reschovsky J A Ghosh and K Stewart 2012 Paying More for Primary Care Can It Help Bend the Medicare Cost Curve The Commonwealth Fund httpwwwcommonwealthfundorg~mediaFilesPublicationsIssueBrief2012Mar1585_Reschovsky _paying_more_for_primary_care_FINALv2pdf
Rizzo J A and D Blumenthal 1994 ldquoPhysician Labor Supply Do Income Effects Matterrdquo Journal of Health Economics 13 (4) 433ndash453 httpwwwncbinlmnihgovpubmed10140533
Rosenthal MB Li Z Epstein AM Frank R G 2005 ldquoEarly Experience with Payshyforshyperformance From Concept to Practicerdquo JAMA The Journal of the American Medical Association 294 (14) (October 12) 1788ndash1793 httpdxdoiorg101001jama294141788
Rosenthal Meredith B and R Adams Dudley 2007 ldquoPayshyforshyperformance Will the Latest Payment Trend Improve Carerdquo Jama The Journal Of The American Medical Association 297 (7) 740ndash744 httpwwwncbinlmnihgovpubmed17312294
Salinsky E 2010 ldquoHealth Care Shortage Designations HPSA MUA and TBDrdquo National Health Policy Forum Background Paper No 75 pp 1shy36
Saether Erik Magnus 2005 ldquoPhysiciansrsquo Labour Supply The Wage Impact on Hours and Practice Combinationsrdquo Labour 19 (4) (December) 673ndash703 doi101111j1467shy9914200500317x httpdoiwileycom101111j1467shy9914200500317x
Scott Anthony Peter Sivey Driss Ait Ouakrim Lisa Willenberg Lucio Naccarella John Furler and Doris Young 2011 ldquoThe Effect of Financial Incentives on the Quality of Health Care Provided by Primary Care Physiciansrdquo Cochrane Database of Systematic Reviews Online 9 (9) CD008451 httpwwwncbinlmnihgovpubmed21901722
Sempowski Ian P 2004 ldquoEffectiveness of Financial Incentives in Exchange for Rural and Underserviced Area Returnshyofshyservice Commitments Systematic Review of the Literaturerdquo Canadian Journal of Rural Medicine the Official Journal of the Society of Rural Physicians of Canada Journal Canadien De La Medecine Rurale Le Journal Officiel De La Societe De Medecine Rurale Du Canada 9 (2) 82ndash88 httpwwwncbinlmnihgovpubmed15603680
Shen YushyChu and Stephen Zuckerman 2005 ldquoThe Effect of Medicaid Payment Generosity on Access and Use Among Beneficiariesrdquo Health Services Research 40 (3) (June) 723ndash44 doi101111j1475shy
64
Final Report Health Practitioner Bonuses
6773200500382x httpwwwpubmedcentralnihgovarticlerenderfcgiartid=1361165amptool= pmcentrezamprendertype=abstract
Shugarman Lisa R and Donna O Farley 2003 ldquoShortcomings In Medicare Bonus Payments For Physicians In Underserved Areasrdquo Health Affairs 22 (4) (July 1) 173ndash178 doi101377hlthaff224173 httpcontenthealthaffairsorgcontent224173abstract
Shurgman Lisa R Donna O Farley Pat Taylor and J Scott Ashwood 2001 Trends in Bonus Payments for Physician Services to Rural Medicare Beneficiaries
Sivey Peter Anthony Scott Julia Witt Catherine Joyce and John Humphreys 2012 ldquoJunior Doctorsrsquo Preferences for Specialty Choicerdquo Journal of Health Economics 31 (6) (December) 813ndash23 doi101016jjhealeco201207001 httpwwwncbinlmnihgovpubmed22940638
Sloan Frank 1970 ldquoLifetime Earnings and Physiciansrsquo Choice of Specialtyrdquo Industrial and Labor Relations Review Vol 24 (No 1) (October 13) pp 47ndash56 httpdukespacelibdukeedudspacehandle101612547
Small David Marc and Tricia McGinnis 2014 Leveraging the Medicaid Primary Care Rate Increase The Role of Performance Measurement
Staiger Douglas O David I Auerbach and Peter I Buerhaus 2010 ldquoTrends in the Work Hours of Physicians in the United Statesrdquo The Journal of the American Medical Association 303 (8) (February 24) 747ndash53 doi101001jama2010168 httpwwwpubmedcentralnihgovarticlerenderfcgiartid=2915438amptool=pmcentrezamprendertype= abstract
Town Robert Robert Kane Paul Johnson and Mary Butler 2005 ldquoEconomic Incentives and Physiciansrsquo Delivery of Preventive Care a Systematic Reviewrdquo American Journal of Preventive Medicine 28 (2) (February) 234ndash40 doi101016jamepre200410013 httpwwwncbinlmnihgovpubmed15710282
Vaughn Bryan T Steven R DeVrieze Shelby D Reed and Kevin a Schulman 2010 ldquoCan We Close the Income and Wealth Gap Between Specialists and Primary Care Physiciansrdquo Health Affairs 29 (5) (May) 933ndash40 doi101377hlthaff20090675 httpwwwncbinlmnihgovpubmed20439883
Verby J E J P Newell S A Andresen and W M Swentko 1991 ldquoChanging the Medical School Curriculum to Improve Patient Access to Primary Carerdquo Jama The Journal Of The American Medical Association 266 (1) 110ndash113 httpjamaamashyassnorgcontent2661110short
Zuckerman Stephen 2004 ldquoChanges in Medicaid Physician Fees 1998shy2003 Implications for Physician Participationrdquo Health Affairs (June) 1998ndash2003 doi101377hlthaffW4374 httpwwwhealthaffairsorgRWJZuckerman_June04pdf
Zuckerman Stephen Aimee F Williams and Karen E Stockley 2009 ldquoTrends in Medicaid Physician Fees 2003shy2008rdquo Health Affairs 28 (3) w510ndashw519 httpwwwncbinlmnihgovpubmed19401290
Zuckerman S and D Goin 2012 ldquoHow Much Will Medicaid Physician Fees for Primary Care Rise in 2013 Evidence from a 2012 Survey of Medicaid Physician Feesrdquo Kaiser Commission on the Medicaid and the Uninsured Issue Paper December 2012
65
Final Report Health Practitioner Bonuses
Literature Matrix
Study Goal Results Data Type of Study Reference
Topic Effect of Earnings on the Supply of Primary Care Services and Providers Role of Medicare Primary Care Bonuses (Section III)
Estimate a model where medical Data set with the Econometric students consider entry The income elasticity estimates range from 103 in family preferred and realized model Nicholson probabilities when selecting a practicepediatrics to 220 in radiology specialties for 7200 (conditional 2002 specialty medical students logit)
Estimated career wealth The present value of career wealth from college accumulation across specialists primary care physicians physician assistants business school graduates and college graduates Comparing specialists represented by cardiologists to
graduation through age sixtyshyfive was estimated at $5171407 for cardiologists $2475838 for primary care physicians $1725171 for MBA graduates $846735 for physician assistants and $340628 for college graduates For a primary care physicianrsquos lifetime earnings to equal that of a cardiologist the primary care
Data from multiple sources included income income taxes living expenses and graduate school
Compound interest wealth accumulation model
Vaughn et al 2010
primary care physicians in physician would have to receive a bonus of $11 million expenses
scenarios upon completion of medical school
Determine effect of educational indebtedness on the specialty choices of new physicians especially in light of the perceived shortage of primary care physicians
Medical students are more likely to choose primary care when the expected earnings are relatively large A $10000 (20 percent of the mean earnings) increase in expected earnings in primary care relative to the nonshyprimary care yields a 14 percentage point increase in the probability of choosing primary care
Data set from American Medical Associationrsquos 1983 lsquoSurvey of Resident Physiciansrsquo
Econometric model (utility maximization)
Bazzoli 1985
Estimation of career choice and medical studentrsquos decision to specialize given lifetime utility maximization
In response to 91 percent reduction in relative feeshypershyconsultation for a general practitioner would lead to between a 04 percent reduction and a 229 percent reduction in the proportion of Medical students entering general practice
Data from multiple sources Model estimated from sample of 30184 physicians who practiced in Canada between 1989 and 1998 and whose year of graduation from medical school is between 1975 and 1991
Econometric model (multinomial logit)
Gagne and Leger 2005
Determine the causes of the primary careshyspecialist income gap why the ResourceshyBased Relative Value Scale failed to prevent the income gap
The RBSVS failed due to four factors (1) the volume of diagnostic and imaging procedures has increased more rapidly than the volume of office visits (2) the process of updating fees every five years is heavily influenced by the Relative Value Scale Update Committee which is composed of a majority of specialists (3) Medicarersquos formula for controlling physician payments penalizes primary care physicians and (4) private insurers tend to pay for procedures at higher rates than office visits relative to Medicare
Data from multiple sources income information between 1995 and 2005
Literature review Bodenheimer 2007
66
Final Report Health Practitioner Bonuses
Study Goal Results Data Type of Study Reference
Determine the effects of expected future earnings and other attributes on specialty choice
Simulated policy changes indicate increasing general practitioners earnings by $50000 or increasing opportunities for procedural or academic work (specifically limiting the amount of onshycall hours) can increase the number of junior doctors choosing general practice by between 8 and 13 percentage points This implies an earnings elasticity of specialty choice of 095
Data from the Medicine in Australia Balancing Employment and Life (MABEL) survey
Econometric model (logit)
Sivey amp Scott 2012
Estimate a model of physician labor supply focusing on the impacts of wage and nonshywage income
Evidence of significant income effects For male physicians the income effect of a wage change on labor supply is negative with an elasticity of shy 026 The pure substitution effect of a wage change increases labor supply a 1 percent increase in wages leads to a 049 percent increase in labor supply controlling for income effects
Data from the 1987 Practice Patterns of Young Physicians Survey (YPS)
Econometric model (log linear regression)
Rizzo and Blumenthal 1994
Estimate the labor supply of physicians employed at hospitals in Norway using personnel register data merged with other public records
Research indicates a 10 percent wage increase would lead to a 3 percent increase in physician labor supply (wage elasticity of 03) The magnitude of the wage elasticity in this case may be relatively small because of hospital employed physicians tendency to have a lower wage than selfshyemployed physicians though still larger than previous estimates
Data set used is a sample of 1303 male physicians observed over the period 1993 and 1997
Econometric model (GMM system GMM)
Baltagi et al 2005
Estimate wage elasticities for Norwegian nurses
40 percent of PCC students returned to New Mexico to practice compared to 32 percent of traditional students
Data includes detailed information on 18066 individuals over 5 years totaling 56832 observations between 1993 and 1997
Econometric model (fixed effects)
Askildsen amp Baltagi 2002
Effect of a permanent 10 percent increase in fees for primary care ambulatory visits on volume of services and cost to Medicare
Analysis shows the fee increase would increase primary care visits by 88 percent and raise the overall cost of primary care visits by 17 percent However these increases would yield more than a sixshyfold annual return in lower Medicare costs for other servicesmdashmostly inpatient and postshyacute caremdashonce the full effects on treatment patterns are realized The net result would be a drop in Medicare costs of nearly 2 percent These
Data set contains Medicare claims data (2004 to 2006) as well as physician data from the Community Tracking Study (CTS) Physician Survey (2004 to 2005)
Econometric model
Reschovsky et al 2012
Estimates the relationship between Medicare fees and quantities provided by physicians for eight specific services
Results show that Medicare fees are positively related to quantity provided for all eight services and are significantly different from zero and elastic for five Estimates are that a 10 percent reduction in Medicare fees would lead to 18 percent to 66 percent reduction in the volume of office visits
Data set contains 13707 physicians who responded to surveys in 20002001 andor 20042005 and were linked to all Medicare claims for their Medicare patients
Econometric model (GLM)
Hadley et al 2009
67
Final Report Health Practitioner Bonuses
Study Goal Results Data Type of Study Reference
Estimate trends in hours worked by US physicians and assess for association with physician fees
After remaining stable through the early 1990s mean hours worked per week decreased by 72 percent between 1996 and 2008 among all physicians (from 549 hours per week in 1996shy1998 to 510 hours per week in 2006shy2008 Excluding resident physicians whose hours decreased by 98 percent the last decade due to duty hour limits imposed in 2003 nonresident physician hours decreased by 57 percent
Data set from US Census Bureau Current Population Survey between 1976 and 2008 (N=116733)
Outcomes of a Problemshybased learning model (specialty and practice location)
Steiger et al 2010
Study Goal Results Data Type of Study Reference
Topic Financial Incentives for Primary Care Providers in Underserved Areas (Section IV)
Evaluate effectiveness and developing trends in bonus payments to rural physicians
In 1991 the total amount of HPSA bonus was almost 316 million dollars Estimates show that 583 percent of the total HPSA bonus payment went to rural HPSAs while the remaining 417 percent went to urban HPSAs They also observed that the total bonus payment grew to reach about 106 million dollars in 1996 but then gradually declined to almost 77 million dollars in 1998 The rural proportion of HPSA bonus payments decreased to 511 percent
Data set includes Area Resource File (ARF) and Medicare Part B claims data for multiple years
Trend examination
Shugarman et al 2001
Examine trends in Medicare spending for basic payments and bonus payments for physician services provided to beneficiaries residing in nonmetropolitan counties
Payments under the Congressionallyshymandated bonus payment program accounted for less than 1 percent of expenditures for physician services in nonmetropolitan underserved counties Physician payments increased from 1992 to 1998 while bonus payments increased through 1996 but then declined by 13 percent by 1998 The share of bonus payments to primary care physicians declined throughout the decade but the share for primary care services increased
Data set includes Area Resource File (ARF) and Medicare Part B claims data for multiple years
Trend examination
Shugarman and Farley 2003
Evaluate the effectiveness of programs that provide financial incentives to physicians in exchange for a rural or underserviced area returnshyofshyservice (ROS) commitment
The majority of studies reported effective recruitment despite high buyshyout rates in some USshybased programs Increasing Canadian tuition and debt among medical students may make these programs attractive The one prospective cohort study on retention showed that physicians who chose voluntarily to go to a rural area were far more likely to stay long term than those who located there as an ROS commitment Multidimensional programs appeared to be more successful than those relying on financial incentives alone
Limited literature available given quality limitations
Literature Review
Sempowski et al 2004
Assess the effect of various On average a 10 percent increase in the general practitioner Data for physicians come Econometric incentive measures fees for medical services in a region increases the propensity from la Corporation model (spatial Bolduc et introduced in Quebec of a beginning GP to work in this region by 7 percent Thus the Professionnelle des autoregressive al 1996 (Canada) to influence the implied elasticity of location choice probability with respect to Medecins du Qu6bec multinomial
68
Final Report Health Practitioner Bonuses
Study Goal Results Data Type of Study Reference geographical distribution of fee increases is about 07 However this elasticity varies Population data come probit) physicians across regions it is higher in remote regions (with a maximum from Canada Census
of 128) On the other hand on average the elasticity of (various years) and intershylocation choice probability with respect to nonshylabor incomes census estimations from such as study grants is estimated to be about 111 le Bureau de la Statistique
du Qu6bec (unpublished data)
Compare the types of locations chosen by alumni and nonshyalumni of a United States program charged with increasing physician supply
Eliminating the program would decrease the supply of physicians in medically underserved communities by roughly 10 percent
Data from multiple sources primarily the
American Medical Association (AMA) master file for 1981 1986 1991 and 1996
Econometric (multinomial logit)
Holmes 2005
Examine the history and results of The Physician Shortage Area Program (PSAP) of Jefferson Medical College and identify factors independently predictive of rural primary care supply and retention
Freshmanshyyear plan for family practice being in the PSAP having a National Health Service Corps scholarship male sex and taking an elective senior family practice rural preceptorship were independently predictive of physicians practicing rural primary care Among PSAP graduates taking a senior rural preceptorship was independently predictive of rural primary care However nonshyPSAP graduates with 2 key selection characteristics of PSAP students (having grown up in a rural area and freshmanshyyear plans for family practice) were 78 percent as likely as PSAP graduates to be rural primary care physicians and 75 percent as likely to remain suggesting that the admissions component of the PSAP is the most important reason for its success
Data includes a total of 3414 Jefferson Medical College graduates from the classes of 1978shy1993 including 220 PSAP graduates
Retrospective cohort study
Rabinowitz et al 2001
69
Final Report Health Practitioner Bonuses
Study Goal Results Data Type of Study Reference
Topic Impact of the Increase in Medicaid Reimbursement Rate Relative to the Medicare Rate (Section V)
Identify the causal effect of increases in Medicaid reimbursement rates relative to the Medicare rate on the propensity of primary care physicians accepting new Medicaid patients
For primary care physicians a 10 percentage point increase in the MedicaidMedicare fee ratio for primary care is associated with only a 21 percentageshypoint increase in Medicaid patient acceptance The average Medicaid reimbursement rate relative Medicare in 2008 was at 662 percent and the national average acceptance rate of new Medicaid patients by PCPs was 415 percent Therefore the implied elasticity of accepting primary care patients with respect to the payment rate is about 033 Excluding pediatricians it is 041
Data acquired from HSC 2008 Health Tracking Physician Survey and American Medical Association (AMA) master file
Econometric model (OLS)
Cunningha m 2011
Examine the effects of Medicaid payment generosity on access and care for adult and child Medicaid beneficiaries
Higher payments increase the probability of having a usual source of care and the probability of having at least one visit to a doctor and other health professional for Medicaid adults and produce more positive assessments of the health care received by adults and children However payment generosity has no effect on the other measures that we examined such as the probability of receiving preventive care or the probability of having unmet needs
Data from the National Surveys of Americarsquos Families (1997 1999 2002) and are linked to the Urban Institute Medicaid capitation rate surveys the Area Resource File and the American Hospital Association survey files
Econometric model (differenceshyinshydifference)
Shen amp Zuckerman 2005
Evaluation in California of whether the expansion of Medicaid managed care and a physician payment increase were associated with an increase over time in the percentage of physicians caring for Medicaid patients
Despite large increases in the use of MedishyCal
managed care and the implementation of MedishyCal physician fee increases between 1996 and 2001 there was no significant inshy crease in the percentage of primary care physicians accepting new MedishyCal patients or having any MedishyCal patients in practice over time
Dataset comprised of surveys of probability samples of primary care and specialist physicians in California in 1996 1998 and 2001 and AMA master file data
Chishysquare tests
Bindman et al 2003
Examine the impact of Californiarsquos Medicaid reshy imbursement for nursing homes which includes incentives directed at staffing
Consistent with the rate incentives and rational expectation behavior expected nursing home reimbursement rates in 2008 were associated with increased RN staffing levels in 2006 but had no relationship with licensed practical nurse and certified nursing assistant staffing The effect was estimated at 2 minutes per $10 increase in rate
Data from Medicaid master file for a total of 927 California freeshystanding nursing homes in 2006
Econometric model (twoshystage MLE)
Mukamel et al 2012
Assess the effects of Medicaid fee changes on physician participation enrollee access and shifts in the site of ambulatory care using several natural experiments in Maine and Michigan
The reimbursement changes included substantial percentage changes in fees however the value of the Medicaid fee improvements relative to the private market eroded very rapidly in the months following the interventions Implied elasticities ranged between 039 and shy0021
Dataset from Medicaid claims and enrollment data between 1988 and 1992
Program Overview amp Outcomes of communityshybased training
Coburn et al 1999
70
Final Report Health Practitioner Bonuses
Appendix B Additional Exhibits
Exhibit B1 Distribution of Primary Care Providers with PCIP Eligible Specialty by Age Sex and Year
Sex Age 2005 2006 2007 2008 2009 2010 2011
Male lt35 114 104 102 98 94 88 79
Male 35shy44 299 295 288 282 276 271 265
Male 45shy54 347 338 323 311 299 287 281
Male 55shy64 186 204 220 235 250 263 275
Male 65+ 53 59 66 74 82 90 100
Male Total 95911 101781 111971 116133 118868 121264 122048
Female lt35 215 205 206 204 201 197 189
Female 35shy44 368 367 359 353 347 342 340
Female 45shy54 315 312 304 298 291 284 278
Female 55shy64 91 104 117 128 142 155 168
Female 65+ 10 12 14 17 19 22 24
Female Total 59446 66054 78531 86972 93905 100930 106003
Missing SexAge
29633 33759 42945 49954 54580 60665 73232
Total 184990 201594 233447 253059 267353 282859 301283
Exhibit B2 Average Number of PCIP Eligible EampM Claims per PCP under Medicare by Specialty 2005shy2011
Specialty 2005 2006 2007 2008 2009 2010 2011
Internal Medicine 869 823 759 746 712 697 653
Family Medicine 722 694 651 649 631 626 605
Pediatrics 51 50 42 39 41 40 36
Geriatrics 989 1026 990 978 960 955 958
Clinical Nurse Specialist 86 85 77 87 97 107 118
Nurse Practitioner 258 257 230 219 219 228 228
Physician Assistant 125 128 120 121 124 134 140
71
Final Report Health Practitioner Bonuses
Exhibit B3 Average Allowed Charges ($) for the PCIP Eligible EampM Claims per PCP under Medicare 2005shy2011
Specialty 2005 2006 2007 2008 2009 2010 2011
Physicians
Internal Medicine $52896 $51477 $51149 $51737 $51438 $55188 $53641
Family Medicine $41019 $40557 $41279 $42369 $43075 $46833 $47163
Pediatrics $3008 $3028 $2705 $2533 $2771 $3055 $2835
Geriatrics $61243 $70593 $68845 $73829 $76317 $82230 $84453
NonshyPhysicians
Clinical Nurse Specialist $4219 $4446 $3974 $4883 $5824 $6841 $7890
Nurse Practitioner $12139 $13055 $11929 $12019 $12600 $14274 $14752
Physician Assistant $5724 $6122 $6064 $6333 $6765 $8133 $8831
Exhibit B4 Proportion of PCIP Eligible EampM Claims per 2011 PCIP Recipients by Specialty 2005shy2011
Specialty 2005 2006 2007 2008 2009 2010 2011
Physicians
Internal Medicine 45 45 44 44 41 42 41
Family Medicine 45 45 44 44 41 42 40
Pediatrics 45 47 47 47 45 41 39
Geriatrics 67 72 70 68 64 62 64
NonshyPhysicians
Clinical Nurse Specialist 64 66 64 60 57 57 56
Nurse Practitioner 66 66 69 68 65 67 68
Physician Assistant 55 56 56 55 51 52 50
Note the proportions are calculated out of all Medicare claims (excluding hospital inpatient ER drug and lab)
Exhibit B5 Average Number of PCIP Eligible EampM Claims per 2011 PCIP Recipients under Medicare by Specialty 2005shy2011
Specialty 2005 2006 2007 2008 2009 2010 2011
Physicians
Internal Medicine 1113 1088 1050 1057 1015 1035 1011
Family Medicine 808 785 752 756 729 752 743
Pediatrics 157 149 130 118 111 129 132
Geriatrics 1168 1237 1191 1187 1145 1181 1193
NonshyPhysicians
Clinical Nurse Specialist 375 384 361 346 335 382 389
Nurse Practitioner 384 403 369 392 405 457 492
Physician Assistant 251 266 260 268 266 301 301
72
Final Report Health Practitioner Bonuses
Exhibit B6 Average Allowed Charges for the PCIP Eligible EampM Claims per 2011 PCIP Recipients under Medicare 2005shy2011
Specialty 2005 2006 2007 2008 2009 2010 2011
Physicians
Internal Medicine $67863 $68281 $70869 $73505 $73494 $81629 $82500
Family Medicine $45958 $45878 $47781 $49440 $49827 $56350 $58004
Pediatrics $9336 $9051 $8460 $7864 $7631 $9836 $10450
Geriatrics $72412 $85046 $82732 $89548 $90821 $101283 $104284
NonshyPhysicians
Clinical Nurse Specialist $17795 $19741 $18922 $19279 $19557 $24141 $25405
Nurse Practitioner $19633 $21605 $19496 $22516 $24830 $29740 $32837
Physician Assistant $11628 $12949 $13457 $14496 $15128 $18717 $19363
Exhibit B7 Proportion of Allowed Charges for PCIP Eligible EampM Claims per 2011 PCIP Recipients 2005shy2011
Specialty 2005 2006 2007 2008 2009 2010 2011
Physicians
Internal Medicine 71 72 74 76 77 79 76
Family Medicine 73 75 77 77 78 80 77
Pediatrics 70 73 75 75 77 77 76
Geriatrics 77 87 88 89 89 90 89
NonshyPhysicians
Clinical Nurse Specialist 76 80 81 83 85 86 85
Nurse Practitioner 68 71 75 79 82 87 87
Physician Assistant 72 74 76 78 81 83 82
Note the proportions are of allowed charges for all Medicare claims (excluding hospital inpatient ER drug and lab)
73
Final Report Health Practitioner Bonuses
Exhibit B8 Distribution of the Number of NPs and PAs across HPSA and PSA regions
Profession Type 2005 2006 2007 2008 2009 2010 2011
Nurse Practitioners
Total Providers 23610 27450 35286 42144 46973 52472 59505
in HPSA x X 14171 16978 18858 20929 23045
in PSA 2946 3331 4139 4694 NA NA NA
in HPSA amp PSA x X 1638 1855 NA NA NA
PCIP 2011 Recipients 12267 14146 18008 23070 27698 25369 23707
in HPSA x X 7335 9344 11148 10178 9312
in PSA 1558 1754 2168 2571 NA NA NA
in PSA amp HPSA x X 861 1027 NA NA NA
Physician Assistants
Total Providers 21240 24439 30823 35593 39226 42871 47340
in HPSA x X 13246 15236 16889 18489 19828
in PSA 2166 2436 3098 3467 NA NA NA
in HPSA amp PSA x X 1230 1363 NA NA NA
PCIP 2011 Recipients 6168 7033 8852 10898 13038 11961 11288
in HPSA x X 3830 4732 5760 5226 4755
in PSA 760 839 1034 1217 NA NA NA
in PSA amp HPSA x X 408 494 NA NA NA
Note HPSA includes only full HPSA areas (data from Area Resource File and HPSA status data are not available prior to 2007) PSA status after 2008 is not applicable as 2008 was the final year of the PSA bonus
Exhibit B9a Distribution of Male Primary Care Physicians with PCIP Eligible Specialty by Age and Year
Note Primary care physicians include following specialties internal medicine family practice pediatrics geriatrics
74
Final Report Health Practitioner Bonuses
Exhibit B9b Distribution of Female Primary Care Physicians with PCIP Eligible Specialty by Age and Year
Note Primary care physicians include following specialties internal medicine family practice pediatrics geriatrics
Exhibit B10 Distribution of Male Primary Care NonshyPhysicians with PCIP Eligible Specialty by Age and Year
Note Primary care nonshyphysicians include following specialties PA NP and CNS
75
Final Report Health Practitioner Bonuses
Exhibit B11 Distribution of Female Primary Care NonshyPhysicians with PCIP Eligible Specialty by Age and Year
Note Primary care nonshyphysicians include following specialties PA NP and CNS
Exhibit B12 Average Number of PCIP Eligible EampM Claims Submitted by 2011 PCIP Recipients 2005 ndash 2011
76
2
0
7
3
4 0 4 6
Final Report Health Practitioner Bonuses
Exhibit B13 Allowed Charges for PCIP Eligible EampM Claims per 2011 PCIP Recipients 2005shy2011
Exhibit B14 Total Number of PCIP Eligible EampM Claims submitted by All Providers in the Control Group 2005shy2011
Specialty 2005 2006 2007 2008 2009 2010 2011
OBGYN 2597637 2612513 2728810 281347 2893204 3047849 3040383
Ophthalmology 5615010 5648040 6070483 597672 5832440 6361330 6164821
Pathology 46894 51364 54748 57005 57147 64078 63652
Urology 6964185 7202012 7571544 777585 7777728 8616096 8641898
Optometry 2464734 2550764 2758214 289154 2969244 3048668 3088461
Podiatry 7788889 8195973 8957163 973940 1001263 1064539 1089067
Psychology 42 11 27 64 1552 2440 2097
Neurophysiology 12609 13838 13858 15451 18142 17962 17714
77
shy
Final Report Health Practitioner Bonuses
Additional Regression Results
Exhibit B15 Impact of Medicare PCIP Policy on the Number of Primary Care Providers Who Have submitted any Medicare Claims (not necessarily under PCIP Eligible Services)
(2005shy2011)
Dependent Variable Number
of Providers per county All Providers (1) Physicians Only (2) Non Physicians Only (3)
PCIP Elig Specialty Indicator 6550 4054 4859
(3929) (4449) (2759)
Elig Specialty Ind x Post 2009 4408 3255 5710
(0503) (0758) (0482)
Post 2009 4588 3314 4187
(0505) (0593) (0350)
Median Income ($10k) 2306 2728 1643
(0424) (0513) (0241)
Percent in poverty 0466 0541 0360
(00535) (00653) (00332)
Population (10k) 0727 0771 0487
(00298) (00359) (00144)
Percent Population over 65 shy0406 shy0262 shy0337
(00407) (00502) (00280)
Unemployment Rate shy0660 shy0652 shy0493
(00522) (00621) (00392)
Intercept shy7242 shy7909 shy490
(4371) (4812) (3069)
Specialty Fixed Effects Yes Yes Yes
Year Fixed Effects Yes Yes Yes
State Fixed Effects Yes Yes Yes
N 140192 107526 95647
Adj Rshysq 0391 0396 0480
Note Robust standard errors are in parentheses + significance at 10 significance at 5 The number of observation is based on the number of counties the number of years and the number of provider specialties in each model (ie physicians include 4 primary care specialties and nonshyphysicians include 3 subshy specialties)
78
-
shy
Final Report Health Practitioner Bonuses
Exhibit B16 Impact of Medicare PCIP Policy on the Number of Primary Care Providers Who Met 60 PCIP Eligibility Threshold Each Year (2005shy2011)
Dependent Variable Number of
Providers per county
All Providers
(1)
Physicians Only
(2)
Non Physicians
Only (3)
PCIP Elig Specialty Indicator 2062 2194 6540
(1769) (2050) (0642)
Elig Specialty Ind x Post 2009 2322 1841 2776
(0341) (0543) (0243)
Post 2009 1252 0750+ 0994
(0348) (0427) (0143)
Median Income ($10k) 0549+ 0847 00118
(0305) (0380) (00942)
Percent in poverty 00663+ 00965 00165
(00379) (00473) (00137)
Population (10k) 0264 0298 00610
(00229) (00284) (000579)
Percent Population over 65 shy0155 shy0105 shy0127
(00277) (00355) (00111)
Unemployment Rate shy0252 shy0259 shy00864
(00357) (00444) (00166)
Intercept shy2281 shy2717 shy3777
(2029) (2419) (0775)
Specialty Fixed Effects Yes Yes Yes
Year Fixed Effects Yes Yes Yes
State Fixed Effects Yes Yes Yes
N 140192 107526 95647
Adj Rshysq 0174 0184 0119
Note Robust standard errors are in parentheses + significance at 10 significance at 5 The number of observation is based on the number of counties the number of years and the number of provider specialties in each model (ie physicians include 4 primary care specialties and nonshyphysicians include 3 subshy specialties)
79
-
Final Report Health Practitioner Bonuses
Appendix C Differenceshyinshydifference (DID) Methodology
C1 DID model and derivation for estimating the impact of PCIP policy
The following equation (Equation (1)) shows the econometric model to identify the effect of Medicare PCIP program on the magnitude of primary care EampM services
= + lowast + lowast 13 + lowast 13 lowast + lowast + (1)
We let Sit be the volume of eligible EampM services provided by provider i in period t Ti is an indicator for treatment group that takes the value 1 if the provider is a PCP and zero otherwise the variable is an indicator variable taking the value of 1 in the years when the PCIP policy is likely to impact the behavior of the providers and 0 otherwise the vector includes provider characteristics such as age and gender etc The term Eit represents random unobserved factors affecting EampM services
The DID methodology that we use here to identify the unbiased effect of PCIP policy on the volume of primary care EampM services is illustrated by considering two time periods preshyPCIP (pre) and postshyPCIP (post) periods with the latter being the years when the PCIP policy is likely to impact the behavior of the providers Equation (2) below shows the change in the volume of EampM services provided by PCPs between preshyPCIP and postshyPCIP periods holding other things constant
(2)
Similarly equation (3) below shows the change in the volume of EampM services provided by nonshyPCPs between preshyPCIP and postshyPCIP periods
(3)
Holding other provider characteristics (embedded in Xs) constant and assuming the changes in random shocks are zero in the limit for both the groups equation (4) below shows that the change in the magnitude of the primary care EampM services provided by PCPs due to the introduction of the Medicare PCIP program is 8
(4)
Thus the coefficient 8 from equation (1) represents an unbiased estimate of the effect of the Medicare PCIP policy on the volume of primary care EampM services Similar methodology can also be applied to estimate the effect of the PCIP policy on other outcomes of interest
C2 DID model and derivation for estimating the impact of HPSA bonus
Equation (5) below shows the empirical specification that we used to estimate the effect of HPSA status on the outcome variables discussed above
80
-0 minus -23 = + + 4 -0 minus -235 lowast + -0 minus -23
minus = + 466-0 66-23 66-0 minus
66-235 lowast + 66-0 minus 66-23
(-0 minus -23) minus (66-0 minus 66-23) =
13tit
7- = +
7- =
7- = + + +
7- = +
Final Report Health Practitioner Bonuses
The model is specified based on the physician level data in each year Here the dependent variable Dict is one of the other potential outcomes of interest of a primary care physician i in county c at time t H SA ict is an indicator of whether physician irsquos county is a HPSA at time t
is an indicator variable taking the value of 1 if the physicianrsquos county ever gained the HPSA status (from a nonshyHPSA) during the sample period and zero otherwise is an indicator variable taking the value of 1 if the physicianrsquos county ever lost the HPSA designation during the sample period and zero otherwise the vector ict includes variables
reflecting the physician characteristics their geographic locations etc and t is a vector of timeshyspecific fixed effect terms
The term Eict represents random unobserved factors affecting outcomes If the change of HPSA status is associated with any changes in the volume of services provided by primary care physicians in those areas then we should expect estimated values of 82 and λ2 in equation (5) will reflect them If the outcome of interest is the volume of services then a positive significant estimated value of 82 would imply higher volume of services due to gaining HPSA designation
For simplicity assume that we have physicians in the following four types of counties counties that are always HPSA (type C1) counties that are always nonshyHPSA (type C2) counties that gained HPSA status and remained HPSA afterwards (C3) and counties that lost HPSA status and remained nonshyHPSA afterwards (C4) Also consider the number of EampM claims submitted under Medicare as the outcome variable of interest Now for given values of and E let us focus on the first 7 terms of the above equation for a representative provider in each of these 4 types of counties
Equation (6) shows the expression of the model excluding the last three terms for County Type C1 (always HPSA)
(6)
Equation (7) shows the expression of the model excluding the last three terms for County Type C2 (always nonshyHPSA)
(7)
Equation (8) shows the expression of the model excluding the last three terms for County Type C3 (gained HPSA status) when these counties have HPSA status
(8)
Equation (9) shows the expression of the model excluding the last three terms for County Type C3 (gained HPSA status) when these counties have NonshyHPSA status
(9)
81
7- = + lowast 89- + lowast 1389- + lowast 89- lowast 1389- + lt lowast 13=13gt89- + lt lowast89- lowast 13=13gt89- +
lowast + lowast + -(5)
1389ic 13=13gt8Aic
Final Report Health Practitioner Bonuses
Thus ( + ) in equation (6) shows the estimated average number of claims per physician in HPSA counties (after controlling for other factors) while in equation (7) represents the estimated average number of claims per physician in nonshyHPSA counties Thus captures the persistent difference in the average number of claims between the HPSA and nonshyHPSA counties
On the other hand comparing equation (8) and (9) the model indicates that in counties that gained the HPSA status ( + 82) shows the difference between the estimated average number of claims per physician when the counties have the HPSA status and the average number of claims when they do not have the HPSA status However already captures the persistent difference in the average number of claims between the HPSA and nonshyHPSA counties Therefore the parameter 82 shows the additional impact of HPSA status on the average number of claims per physician in the counties that gained HPSA status If gaining HPSA status encourages physicians to increase the availability of primary care services then we expect 82 to be positive
Similarly equation (10) shows the expression of the model excluding the last three terms for County Type C4 (lost HPSA status) when these counties have HPSA status
Type C4 and HPSA
Dict = + + A1 + A2 (10)
Equation (11) shows the expression of the model excluding the last three terms for County Type C4 (lost HPSA status) when these counties have NonshyHPSA status
Dict = + A1 (11)
Once again comparing equation (10) and (11) the model indicates that in counties that lost the HPSA status ( + A2) shows the difference between the estimated average number of claims per physician when they have the HPSA status and the average claims when they do not have the HPSA status However already captures the persistent difference in the average number of claims between the HPSA and nonshyHPSA counties Therefore the parameter A2 shows the additional impact of HPSA status on the average number of claims per physician in the counties that lost HPSA status If losing the HPSA status induces physicians to decrease the availability of primary care services then we expect A2 to be positive implying higher average claims when the counties had the HPSA status
82
1 = A1( lowast (1 minus )) = 04( lowast (1 minus ))
7 = Fgt(0(1 minus 0)) minus 1 lowast G0
HIJKLIJM13N7JJ = Fgt(1(1 minus 1)) = 7 + 1 lowast G1
Final Report Health Practitioner Bonuses
Appendix D Simulation Methodology
Method of Calculating the Predicted Proportion of Officeshybased Physicians Accepting New Medicaid Patience as a Function of the MedicaidshytoshyMedicare Fee Index
Consider that
I0 is the observed value of the MedicaidshytoshyMedicare fee index 2008
I1 is the new value of the MedicaidshytoshyMedicare fee index (eg I1 could be 1 percent or 10 percent or x percent higher than I0 where x is a chosen value)
P0 is the observed proportion of officeshybased physicians accepting Medicaid patients in 2011
P1 is the predicted proportion of officeshybased physicians accepting Medicaid patients after the x percent increase in MedicaidshytoshyMedicare fee index
M1 is the estimated marginal effect of the MedicaidshytoshyMedicare fee ratio (2008) = 04 (reported in the study)
B1 is the estimated logit coefficient of the MedicaidshytoshyMedicare fee ratio (2008)
Given the fact that marginal is equal to the estimated logit coefficient times P times (1shyP) where P is the mean proportion of officeshybased physicians accepting Medicaid patients in the sample equation (12) shows the estimated logit coefficient of the MedicaidshytoshyMedicare fee ratio (2008)
(12)
Since Decker (2012) reports that P is 0694 this implies B1 is equal to 04(0694(1shy0694)) which is approximately equal to 188
Letrsquos name the part of the estimated logit model which incorporates the effect of other independent variables (other than MedicaidshytoshyMedicare fee ratio) and the intercept term in the model as ldquoOther Effectsrdquo or OE Equation (13) below shows the expression of ldquoOther Effectsrdquo (OE) based on a given value of P0 and a known value of B1 (where ldquolnrdquo is the natural log)
(13)
Then based on the estimated logit model we can predict the logshyodds of the proportion of officeshybased physicians accepting new Medicaid patients for a new value of the MedicaidshytoshyMedicare index (say I1) Equation (14) shows the logshyodds of the proportion of officeshybased physicians accepting new Medicaid patients
(14)
83
1HIJKLIJOH13O13HK13gt = 1 = [1 + X QI(RSTUlowastV ]Z)W
Final Report Health Practitioner Bonuses
Therefore equation (15) shows the implied predicted proportion of officeshybased physicians accepting new Medicaid patients (where ldquoexprdquo is the exponential function operation)
(15)
Example Based on Decker (2012)
(i) The national average of observed proportion of officeshybased physicians accepting Medicaid patients in 2011 (P0) is 0694
(ii) The Observed value of the MedicaidshytoshyMedicare fee index (I0) 2008 is 0742
We have already derived that the logit coefficient of the MedicaidshytoshyMedicare fee ratio (B1) is 188 This implies that OE is approximately 0576 (based on equation (13))
Now consider a 10 percent increase in the MedicaidshytoshyMedicare fee index from the national average in 2008 This implies that the new value of the MedicaidshytoshyMedicare fee index (I1) is 08162
This further implies that the predicted logshyodds of the proportion of officeshybased physicians accepting new Medicaid patients is equal to about 0958 (using equation (14))
Thus using the expression in equation (15) the predicted proportion of officeshybased physicians accepting new Medicaid patients (P1) is equal to 0723 or 723 percent
The same methodology is applied while calculating the predicted proportions for each state and the US in Exhibit 25
84
- Health Practitioner Bonuses and Their Impact on the Availability and Utilization of Primary Care Services Final Report
-
- Table of Contents
- Table of FiguresExhibits
- Acknowledgments
- Executive Summary
-
- Overview
- Key Findings
-
- 1 Impact of the Medicare Incentive Payment for Primary Care Providers (PCIP)
- 2 Impact of the Physician Shortage Area (PSA) bonus
- 3 Impact of the Health Professional Shortage Area (HPSA) Bonus
-
- Conclusions
-
- Introduction and Purpose Of The Study
- Literature Review
-
- A Effect of Earnings on the Supply of Primary Care Services and Providers Role of Medicare Primary Care Bonuses
-
- 1 Effects of Earnings on Specialty Choice by Physicians
- 2 Effects of Earnings on Labor Supply of Health Care Workforce
- 3 Effects of Earnings on the Volume of Primary Care Services
-
- B Financial Incentives for Primary Care Providers in Underserved Areas
- C Impact of the Increase in Medicaid Reimbursement Rate Relative to the Medicare Rate
-
- 1 Systemic Change in Medicaid Reimbursement Rates in All States
- 2 Stateshyspecific Experience on Changes in Medicaid Reimbursement Rates
-
- Conclusions
-
- Modeling the Impact of Medicare Incentive Payment for Primary Care Providers
-
- A Study Design Overview
- B Data Sources and Variables
-
- 1 Main Data Sets
- 2 Trends in Key Outcome Variables
-
- C Econometric Framework
- D Main Results
-
- 1 Impact of PCIP Policy on Number of Eligible Providers
- 2 Impact of PCIP Policy on Number of Claims for EampM Services
- 3 Impact of PCIP Policy on Allowed Charges for EampM Services
-
- Analyzing the Impact of Financial Incentives for Primary Care Providers in Shortage Areas
-
- A Background
- B Impact of the PSA Bonus on Primary Care Supply
- C Impact of the HPSA Bonus on Primary Care Supply
-
- Modeling the Impact of the Increase in Medicaid Reimbursement Rate Relative to the Medicare Rate
-
- A Study Design Overview
- B Simulation Exercise
-
- Conclusions
- Appendices
- Appendix A Bibliography and Literature Matrix
- Appendix B Additional Exhibits
-
- Additional Regression Results
-
- Appendix C Differenceshyinshydifference (DID) Methodology
-
- C1 DID model and derivation for estimating the impact of PCIP policy
- C2 DID model and derivation for estimating the impact of HPSA bonus
-
- Appendix D Simulation Methodology
-
- Example
-

Final Report Health Practitioner Bonuses
Acknowledgments Paul Hogan Brighita Negrusa PhD and Projesh Ghosh PhD contributed to this report We benefited greatly from discussions with members of our technical expert panel We also gratefully acknowledge the input from Caroline Taplin the ASPE Project Officer and her colleague Donald Cox This study was conducted by The Lewin Group under contract number HHSP23320095639WC task order number HHSP23337019T with the HHSrsquos Office of the Assistant Secretary for Planning and Evaluation The authors take full responsibility for the accuracy of material presented herein The views expressed are those of the authors and should not be attributed to ASPE or HHS
iv
Final Report Health Practitioner Bonuses
Executive Summary
Overview
In this study funded by The Assistant Secretary for Planning and Evaluation (ASPE) we analyze the impact of three different health practitioner incentives on the supply of primary care services (1) the Medicare primary care incentive payment (PCIP) (2) the physician shortage area (PSA) bonus and (3) the health professional shortage area (HPSA) bonus Section 5501(a) of The Affordable Care Act authorized a quarterly incentive payment program to augment the Medicare payment for primary care services when furnished by primary care practitioners beginning in 2011 and ending in 2015 Medicare has been paying a HPSA bonus since 1987 Initially the HPSA bonus was paid to physicians providing care in rural geographic HPSAs in 1991 it was extended to services provided by physicians in urban geographic HPSAs Subsequently section 413a of the Medicare Modernization Act put in place an additional 5 percent bonus payment for physicians practicing in PSAs PSAs were those counties and rural zip codes in MSAs with the lowest physician to population ratios The purpose of these incentives is to increase the supply of provider services both in general and for evaluation and management (EampM) in particular In the case of the PCIP it is to increase the supply of primary care services in Medicare In the case of the PSA and HPSA bonuses it is to increase the supply of services in certain locations designated as underserved
We first consider the PCIP program Under the PCIP program eligible providers in designated primary care specialties are offered a 10 percent reimbursement premium for primary care services The study addresses the following broad empirical issues surrounding the Medicare PCIP program
Experience to date with the Medicare primary care incentive payment in terms of the aggregate number of recipients and the distribution of those recipients by specialty and by geographic area
Proportion of primary care providers who qualify for the bonus and the characteristics of those primary care providers
Volume of eligible claims submitted by the PCIP eligible providers and the impact of Medicare PCIP policy on the primary CARE services provided and other outcome measures of interest
To explore these topics we used a customized data set constructed at the provider level This data set included all the claims submitted by the entire universe of Medicare providers each year from 2005 to 2011 Subsequently each provider was linked by National Provider Identification number (NPI) to Provider360 data (available from Lewin Grouprsquos parent company Optum Inc) and the AMA Physician Master File to add provider characteristics such as provider demographics (eg age gender) provider designation medical school and practice location We also added geographic locationshyspecific variables from the Area Resource File (ARF) based on the practice location information of providers The main advantage of this pooled data set is the ability to track providers over time and capture changes in their volume of services in response to financial incentives
We use a differenceshyinshydifference (DID) approach to identify the effect of the financial incentives associated with the Medicare PCIP policy on key outcomes of interest This method entails (1) inclusion of a treatment group which is likely to be affected by the PCIP policy and a relevant comparison group not likely to be affected by the policy (2) controls for yearshyspecific effects
1
Final Report Health Practitioner Bonuses
common to both groups and (3) an interaction of the treatment group and the year effects to capture the distinct impact of the policy on the treatment group The model also controls for provider demographics and regional characteristics One advantage of the DID estimation approach is that it enables us to disentangle the net impact of the 10 percent PCIP policy from changes that coincided with the PCIP policy affecting both the treatment and comparison group
Policy makers have long been concerned about patient access to health care particularly primary care in underserved or shortage areas We also focus on two additional financial incentive programs Health Professionals Shortage Area (HPSA) bonus and Physician Shortage Area (PSA) bonus implemented in an attempt to improve access in shortage areas These programs offer a higher rate of reimbursement in Medicare for eligible providers should they provide services in designated shortage areas More specifically we examine the following issues surrounding HPSA and PSA bonus
The distribution of HPSA bonus recipients the overlap between HPSA and Medicare primary care incentive payment (PCIP) and the overlap between the HPSA and PSA bonus recipients
Impact of HPSA bonus on the number of primary care providers and subsequent impact on the volume of primary care services
Impact of PSA bonus on the number of primary care physicians and subsequent impact on the volume of primary care services
Finally we examine the existing evidence from the literature on the variation in Medicaid reimbursement rates relative to the Medicare rates to inform the impact of the Medicaid parity provision in the ACA We describe the variation in Medicaid reimbursement rates relative to the Medicare rates both for primary care and for all services across US states during the period 2008shy2012 Based on the empirical results from the PCIP analysis we perform an exercise to simulate the effect of a 10 percent increase in the MedicaidshytoshyMedicare fee index on the proportion of US officeshybased physicians accepting new Medicaid patients across all states
Key Findings
1 Impact of the Medicare Incentive Payment for Primary Care Providers (PCIP)
Number of Medicare Providers
Our estimates suggest that the number of Medicare providers with a PCIP bonusshyeligible specialty and at least one PCIP eligible claim increased annually by about 28 providers per county per year due to the Medicare PCIP bonus policy This represents a sizeable increase of almost 19 percent since there were about 15 providers per county per specialty per year under a PCIP bonus eligible specialty during the 2005shy2011 period When restricted to primary care physicians with a PCIP eligible specialty the estimated increase in the number of physicians is approximately 10 percent in response to the PCIP policy (ie elasticity of the number of primary care physicians with respect to the payment is about 1)1
1 The increase in the number of physicians with a PCIP eligible specialty attributable to the policy is about 2 per
county per year This is almost 10 percent of the average number of primary care physicians in a given PCIP eligible specialty per county per year (average is almost 19) Therefore given that PCIP policy provides 10
2
Final Report Health Practitioner Bonuses
Evaluation amp Management (EampM) Eligible Claims
The estimated impact of the PCIP policy on the volume of primary care services measured by the volume of claims is somewhat mixed
More specifically there were more PCIP eligible EampM claims submitted per provider in a particular claim type 25 minute office visits for established patients Specifically on average there was a 7 percent increase in the number of 25 minute office visits claims due to the PCIP policy Thus the implied elasticity of the number of 25 minute office visits with respect to the incentive payment is about 07 Hence it appears that the PCIP may have induced a substitution toward slightly longer visits for established patients
For PCIP eligible EampM claims in general the estimates from the DID model indicate that on average primary care providers with PCIPshyeligible specialties submitted fewer claims (per provider per year) related to PCIPshyeligible EampM services in response to the Medicare PCIP policy23
The positive impact of the PCIP bonus policy on the volume of EampM claims associated with 25 minute office visits for established patients is much stronger for providers near the PCIP eligibility threshold4 For the primary care providers near the PCIP eligibility threshold there was almost a 15 percent increase in the number of claims for 25 minute visits due to the PCIP policy
Allowed Charges for EampM Services
We estimated no significant incentive payment impact on allowed charges per provider for the full sample of providers However for the sample of providers who were near the PCIP eligibility threshold in 20095 we found that per provider charges increased by about $5611 annually in response to the policy This estimated effect represents about 93 percent of the mean allowed charges ($60235) per provider per year (ie the implied elasticity of allowed charges which do not include the bonus payment with respect to the payment is about 093)
percent incentive payment the implied elasticity of the number of physicians in PCIP eligible specialty with respect to the payment is about 1
2 Not all primary care providers are eligible for Medicare primary care incentive payments In summary primary care
physicians (with internal medicine family practice pediatrics and geriatrics specialty) who have at least 60 percent of the practitionerrsquos allowed charges under the Medicare physician fee schedule (excluding hospital inpatient care and emergency department visits) are for primary care services The PCIP eligible primary care services are defined by specific EampM codes Medicare PCIP is also provided to physician assistants nurse practitioners and clinical nurse specialists who also meet the similar eligibility criteria
3 Note that total eligible claims increased Claims per provider declined potentially because additional providers
were induced to submit eligible claims 4
For the purpose of our analysis we consider the primary care physicians (with the PCIP eligible specialty) who have 50 percentshy65 percent of their services for PCIP eligible EampM services (defined by specific EampM codes) to be near the eligibility threshold We apply the similar method to select nonshyphysicians (physician assistants nurse practitioners and clinical nurse specialists) near the eligibility threshold
5 The determination of the eligibility of providers in the first year (2011) of the PCIP is based on the extent of their
PCIP eligible services in 2009 Besides the announcement of the PCIP program was made in 2010 Thus we assumed that the providers with Medicare PCIP eligible specialties would be potentially responsive to the PCIP program as early as year 2010 and alter their behavior Subsequently it is more meaningful to examine providers who were near the PCIP eligibility threshold in 2009 which is the year just before the policy effect is expected to influence
3
Final Report Health Practitioner Bonuses
2 Impact of the Physician Shortage Area (PSA) bonus
Number of Medicare Providers
The number of providers with PSA bonusshyeligible specialties was estimated to increase by about 1 in PSA areas during the PSA period compared to the number of providers in nonshyPSA areas This represents a sizeable increase as there were about 6 primary care providers on average in PSA areas
EampMshyEligible Claims
We found that on average physicians with bonusshyeligible specialties who were located in PSA areas were estimated to have about 50 more claims submitted per year during the PSA period compared to providers with the same specialty who were located in nonshyPSA areas Given that these physicians have on average about 644 claims per year for primary care EampM services the impact of PSA bonus is not negligible
Allowed Charges for EampM Services
Our estimates indicate that on average physicians with PSA bonusshyeligible specialties located in PSA areas did not experience a statistically significant increase in total annual allowed charges per provider per year for EampM services compared to those in nonshyPSA
6 areas
3 Impact of the Health Professional Shortage Area (HPSA) Bonus
EampM Eligible Claims
We focused only on the behavior of primary care physicians who are eligible for a HPSA bonus We found that on average Medicare primary care physicians tend to submit about 17 more EampM claims annually specifically due to the gain of full HPSA status7
Allowed Charges for EampM Services
Medicare primary care physicians who are located in counties that ever lost primary care HPSA status tend to have about $1380 more allowed charges annually before the location lost full HPSA status
Conclusions
The Affordable Care Act includes two key provisions regarding reimbursement to primary care providers ) (a) it provides a 10 percent incentive payment under the Medicare PCIP program to eligible providers (effective January 1 2011) and (b) it raises the Medicaid primary care reimbursement rate at least up to 100 percent of the Medicare rate
We find that as a result of the Medicare incentive payment the number of Medicare PCPs has increased on average by about 28 providers per county annually in 2010 and 2011 Also the number of primary care physicians with PCIP eligible specialty increased by about 10 percent in
6 Although the number of EampM claims went up due to the PSA bonus it may be that within EampM services some
services experienced an increase in allowed charges due to the PSA bonus while others experienced a decrease accounting for the overall lack of impact
7 Health Resource and Services Administration (HRSA) publishes Area Health Resource File (ARF) that includes
HPSA status for each county within the US For the purpose of our analysis we focus on primary care HPSA status The ARF data classifies counties as full primary care HPSA if the whole county is considered as a HPSA
4
Final Report Health Practitioner Bonuses
response to the 10 percent incentive payment under the PCIP policy (ie elasticity of the number of primary care physicians with respect to the incentive payment is about 1) Eligible claims for some types of PCIP eligible EampM services and associated allowed charges have also increased For example on average there was a 7 percent increase in the number of claims for 25 minute office visits due to the PCIP policy On the other hand in response to the PCIP policy there was a 93 percent increase in the average allowed charges (for eligible services) among primary care providers with PCIP eligible specialties
The reader should exercise some caution in interpreting these results however The behavioral response to the PCIP was observed in our data only for one year The relatively short period may have resulted in insufficient time for a full provider behavioral response In addition the legislation provided for a program of only limited duration Some providers may have chosen explicitly or implicitly not to change their behavior for a program of limited duration
In addition we find that Medicare providers were attracted to PSA areas through the PSA bonus and submitted 78 percent more EampM claims annually during the PSA period Gaining HPSA status also generated an additional 17 EampM claims submitted by primary care physicians with HPSA bonusshyeligible specialties
The reader is again encouraged to exercise some caution in interpreting the results for the PSA bonus Because the criteria for the bonus include the actual supply of providers there is a risk that the results may be biased Though the methods we employ attempt to minimize the potential impact of this type of bias we cannot be completely sure that the results are unaffected by this
Finally we document the variation in Medicaid reimbursement rates relative to the Medicare rates both for primary care and for all services across US states during the period 2008shy2012 using the existing body of evidence Using the empirical results from our PCIP analysis we also perform an exercise to simulate the effect of a 10 percent increase in the MedicaidshytoshyMedicare fee index on the proportion of US officeshybased physicians accepting new Medicaid patients across all states The simulation suggests that a 10 percent increase in MedicaidshytoshyMedicare fee ratio would increase the US average of officeshybased primary care physicians accepting new Medicaid patients from 662 percent to 728 percent Again however caution is warranted in a literal interpretation of this result as it is based on an extrapolation from a different program
Introduction and Purpose Of The Study The Assistant Secretary for Planning and Evaluation (ASPE) has contracted with The Lewin Group to examine the role of physician bonus and supplemental payment programs in increasing the supply of primary care providers (PCP) and the access of patients to their services
The Congressional Budget Office has estimated that the implementation of the Patient Protection and Affordable Care Act (ACA) of 2010 will increase the number of nonelderly people who have health insurancemdashby about 13 million in 2014 20 million in 2015 and 25 million in each of the subsequent years through 2024 (CBO 2014)8 Because those with insurance typically use more services than those without insurance this increase in coverage will most likely result in additional pressure on a health care delivery system9 To address
8 CBO Report (February 2014) httpwwwcbogovsitesdefaultfilescbofilesattachments45010shybreakoutshy
AppendixBpdf 9
Manning WG Newhouse JP Duan N Keeler EB Benjamin B Liebowitz A et al (1988) Health insurance and the demand for medical care Evidence from a randomized experiment Santa Monica CA RAND Corporation
5
Final Report Health Practitioner Bonuses
concerns about maintaining an adequate supply and distribution of primary care services the ACA includes provisions that provide temporary financial incentives to primary care providers
1 Section 5501 provides that from January 1 2011 through December 31 2015 under Medicare eligible primary care practitioners will receive a 10 percent supplemental payment for primary care services they provide as defined by existing Evaluation and Management (EampM) codes under the new Medicare Primary Care Incentive Program (PCIP)
2 Section 1202 of the Act provides that for the period January 1 2013 to December 31 2014 under Medicaid primary care services provided by primary care physicians must be paid at rates no less than Medicare rates for primary care physicians
The Medicare primary care incentive payment is available to the eligible primary care practitioners for services provided under selected categories of EampM codes An eligible primary care practitioner is a physician nurse practitioner clinical nurse specialist or physician assistant who satisfies the following criteria (i) enrolled in Medicare with primary specialty designation of family practice internal medicine pediatrics and geriatrics and (ii) at least 60 percent of the practitionerrsquos allowed charges are for primary care services10 This temporary 10 percent incentive payment is made on a quarterly basis PCIP recipients with a family medicine Medicare specialty designation received an average incentive payment of $3450 ($212987540 61728) during the first year of the program11 This payment is equivalent to a two percent ($3450$201512) increase in annual income 12
In addition Medicaid payment rates for primary care services delivered by primary care physicians must be no less than Medicare rates for the same services in 2013 and 201413
Given the variability of Medicaid payments across states this could be a substantial boost in payments for physicians in some states and less so in others Medicare has been providing bonus payments to physicians in designated shortage areas to make these areas more attractive for physician practices The Health Professional Shortage Area (HPSA) bonus and the Physician Shortage Area (PSA) bonus are specifically intended to address the geographic distribution of physicians
The main purpose of this report is to present the key findings from our examination of the proposed research questions the main data sources used for the empirical analysis the methodologies used to identify the impact of payment incentives and detailed discussion of our analytical findings
10shyAllowed charges refer to all charges under the physician fee schedule excluding hospital inpatient care drug laboratory and emergency department visits (source httpwwwcmsgovMedicareMedicareshyFeeshyforshyServiceshyPaymentPhysicianFeeSchedDownloadsPCIPshy2011shyPaymentspdf)
11shySource httpwwwcmsgovMedicareMedicareshyFeeshyforshyServiceshyPaymentPhysicianFeeSchedDownloadsPCIPshy2011shyPaymentspdf
12shyACA Medicare PCIP Practitioners (MDs and Non‐MDs) with primary care specialty designation meeting a threshold of 60 percent of primary care serviceswill receive 10 percent bonus on the Medicare paid amount from CY 2011 to CY 2016 $558 million in 2011 translates to an average of 2 percent increase in annual income for primary care physicians
13shyThe Administration is proposing to extend this payment through Calendar Year 2015 and make it available to primary care nurse practitioners and physician assistants who practice independently (add citation to 2015 Budget in Brief when it becomes available)
6
Final Report Health Practitioner Bonuses
The report covers the three main categories of the empirical analysis
1 Examine the magnitude and the distribution of Medicare primary care incentive payments and quantitatively estimate the impact of the bonus on the supply of PCPs and their services
2 Assess the geographic distribution of HPSA bonus recipients understand the overlap between HPSA and Medicare primary care incentive payment (PCIP) and overlap between the HPSA and PSA bonus recipients and quantitatively estimate the impact of the bonuses on the supply of PCPs and their services
3 Explore any evidence of the impact of changes in state Medicaid primary careshyreimbursement rates on the supply of primary care servicesshy
A substantial portion of the empirical undertaking entailed analyzing existing Medicare claims data to understand the magnitude of these supplemental payments under Medicare and to estimate their impact on the supply of PCPs and their services In this report we provide a detailed description of the data we use our analytical approach and a thorough discussion of our analytical findings The discussion in the report is organized as follows section II presents findings from the review of relevant existing literature in section III we lay out the empirical methodology and main evidence related to the impact of the Medicare 10 percent primary care incentive payment section IV describes the empirical analysis of the HPSA and PSA bonuses section V presents the findings regarding the impact of higher primary care physician fees under Medicaid finally section VI is the conclusion
Literature Review The Lewin Group has reviewed the existing key health and labor economics literature for evidence regarding the potential impact of financial incentives on the supply of health care providers and services The objectives of the literature review were to (1) document the likely quantitative range of the effects of earnings increases (in the form of bonuses or other financial incentives) on the supply of primary care providers and services nationally or in underserved areas and (2) explore the likely impact of the increase in Medicaid reimbursement rates for primary care providers on the volume of these providers and their services under Medicaid This work can contribute to the broader understanding of provider behavior and the type and level of financial incentives that are likely to achieve the desired supply responses
The literature that directly examines the Medicare bonuses and resultant impact on the supply of primary care providers and services is very limited To address this limitation we expand our focus to include the labor economics literature This broadened search then includes studies that address the behavioral impact of earnings on medical workforce In what follows we discuss the major findings from the existing literature on the effects of financial incentives (such as Medicare bonuses and increased Medicaid reimbursement rates) on primary care workforce and services Overall the scope of the literature review can be classified under the following categories
1 Effects of earnings on (a) specialty choice by physicians (b) the labor supply of physicians and nurses in terms of work hours and labor force participation and (c) the volume of services
2 Effects of financial incentives on the supply and retention of primary care providers in designated underserved areas (HPSAPSA) and statesrsquo experiences thereof
7
Final Report Health Practitioner Bonuses
3 Impact of increases in Medicaid reimbursement rates on the supply of primary care providers and the volume of patient care under Medicaid on a state by state basis as well as systemic effects
There is considerable concern regarding a potential future primary care physician shortage and potential constriction of access to primary care The availability of primary care is particularly important for public payer programs such as Medicaid and Medicare A recent Medicare Payment Advisory Committee (MedPAC) data book indicates that six percent of Medicare beneficiaries were looking for a new primary care physician in 2011 In addition among those who tried to get an appointment with a new physician in 2011 35 percent reported having difficulties14
It is worth noting that several studies (Bodenheimer et al 2007 Vaughn et al 2010) illustrated the large income gap between primary care providers and other specialties Therefore whether a very small increase in annual income through the Medicare PCIP would significantly influence provider behavior remains unclear In addition the time limited nature of the provisions may prove to be a major deterrent to a change in provider behavior Any evidence around time‐limited bonus programs will likely show only a partial behavioral response from the targeted population Lower bound take up rates should be expected in these programs because medical students and early career providers are unlikely to base career choices on temporary policy changes
Historically the Medicaid program has reimbursed physicians at a much lower rate than Medicare paying just 66 percent of Medicare rates on average (Cunningham 2011) Cunningham (2011) also documents that due to the low Medicaid reimbursement rates in several states fewer physicians accept Medicaid patients In 2013 and 2014 ACA increases Medicaid reimbursement rates for certain services provided by primary care physicians to 100 percent of Medicare rates Given the variability of Medicaid payments across states this will be a substantial boost in payments for physicians in some states and less so in others Current differential payment levels across states and any changes in payments over time can be exploited to examine the effect of raising Medicaid primary care reimbursement rates on the provision of primary care providers and services
The discussion of the literature review is organized as follows section A reviews the literature on the effect of earnings on the supply of primary care providers and services section B discusses the evidence regarding the impact of financial incentives for primary care providers in underserved areas section C examines the empirical evidence on the impact of stateshyspecific changes in Medicaid reimbursement rates and section D concludes with a summary of the major findings from the literature and their implications for understanding the allocative effects of bonus payments and other financial incentives
A Effect of Earnings on the Supply of Primary Care Services and Providers Role of Medicare Primary Care Bonuses
The ACA stipulates multiple programs with the aim of increasing the supply and utilization of primary care services These programs all operate on the assumption that financial incentives specifically directed toward increased earnings are an effective way to promote an increase in primary care services and primary care providers While these assumptions are based upon established economic theory the evidence as to the programsrsquo effectiveness in practice is mixed
14 MedPAC ldquo A Data Book Health Care Spending and the Medicare Programrdquo June 2012 p 97
8
Final Report Health Practitioner Bonuses
While there is general consensus that expected earnings are a key driver of medical specialty choice (Bazzoli 1985 Nicholson and Propper 2011 Nicholson 2002 Vaughn et al 2010) the evidence regarding the effectiveness of programs designed to attract medical students in certain specialties is inconclusive Vaughn et al (2010) argue that programs designed to affect the number of medical students choosing primary care have largely failed while others (Fournier amp Henderson 2005 Lynch 1998 Ramsey 2001) argue that these programs have had a wide range of results that can be attributed to each programsrsquo individual composition
The effect of earnings on labor supply in relation to the healthcare workforce is also a complex issue There is wide consensus that increased earnings lead to an increase in the labor supply of health services providers (Askildsen and Baltagi 2002 Baltagi 2005 Rizzo and Blumenthal 1994) but the reported magnitude of this increase in labor supply varies widely Values reported for the wage elasticity of the primary care labor supply range from 023 to 08 Furthermore the effect of income on retirement decisions of physicians is not well understood
Finally the effect of earnings on the volume of primary care services is a related but distinct issue Much like its counterparts the effect of earnings on the volume of services is recognized to be significant and positive but reported effects range widely from a 10 percent reduction in Medicare fees leading to 18 percent to 66 percent reduction in the volume of office visits to 10 percent higher fees for primary care services raising the primary care EampM visits by 88 percent (Hadley et al 2009 Reschovsky et al 2012)
1 Effects of Earnings on Specialty Choice by Physicians
While the estimated effect of earnings on specialty choice is present and significant the magnitude of this income effect and its relative importance as compared to other factors in deciding a specialty is contentious Recent data from the residency match program in the US reveals that among 16875 US Medical school senior applicants in 2012 about 355 percent were matched to primary care specialties such as internal medicine family practice and pediatrics15 In 2010 the proportion matched to primary care (internal medicine family practice and pediatrics) was 341 percent of 16427 US Medical school senior applicants 16 Between 1995 and 2006 the total number of physician residents in the US in primary care training programs increased by 6 percent from 38753 to 40982 (Exhibit 1) Physician residents in specialty care increased by about 8 percent during the same period
Exhibit 1 Number of Physicians in Residency Programs17
Type of Resident Number of Resident Physicians
Percentage Change 1995 2006
Primary Care Residents 38753 40982 575
Specialty Care Residents 59282 63897 778
All Physician Residents 97416 104526 730
15 Source NRMP Results and Datashy2012 Main Residency Match (httpwwwnrmporgdataresultsanddata2012pdf)
16 US Medical school seniors who are matched into internal medicine can subspecialize later on in nonshyprimary care
specialty such as cardiology endocrinology oncology etc 17
Steinwald B Primary Care Professionals Recent Supply Trends Projections and Valuation of Services Statement in Testimony before the Senate Committee on Health Education Labor and Pensions Washington (DC) GAO 2008 Available from httpwwwgaogovnewitemsd08472tpdf
9
Final Report Health Practitioner Bonuses
Nicholson and Propper (2011) argue that the rate of return to medical training and specialization is the key driver of choosing medical occupation and the choice of specialty within the area of medicine The gap in median income between primary care physicians and specialists is wellshypublicized For instance using crossshysectional earnings data from 2008 Vaughn et al (2010) report that the average primary care physician could expect to earn $25 million over his lifetime net of income taxes living expenses and education costs versus $52 million for a cardiologist Berenson et al (2007) report that according to the Medical Group Management Association (MGMA) between 2000 and 2004 median physician income for all primary care increased by 99 percent while average incomes of all nonshyprimary care specialists increased by 158 percent Arguably given the income gap raising the payment rate for primary care services relative to other services would impact the number of primary care physicians and raise the amount of primary care services they provide Moreover if the reimbursement rates vary by geographic region this strategy can also affect the geographic distribution of services of primary care services
In a related study Bodenheimer (2007) attempts to explain this disparity in incomes The author notes that the ResourceshyBased Relative Value Scale which was initially designed to reduce the inequality between fees for office visits and for procedures has failed to reduce the primary carendashspecialty income gap He finds that this failure is due to four factors (1) the volume of diagnostic and imaging procedures has increased more rapidly than the volume of office visits (2) the process of updating the relative values units (RVUs) 18 associated with covered procedures is heavily influenced by the recommendations of the Relative Value Scale Update Committee (RUC) a majority of whose membership are specialists (3) Medicarersquos formula for controlling physician payments penalizes primary care physicians and (4) private insurers tend to pay for procedures at higher rates than office visits relative to Medicare They conclude that the program was designed with the correct motives but ultimately was weak and cannot achieve its purpose as currently formulated Furthermore incentives that favor specialists remain in the private market
Nicholson (2002) also provides econometric evidence that the disparity in the expected earnings between primary care and other specialties has a significant influence on medical studentsrsquo decisions to choose primary care or another specialty He observes that there is a persistent excess supply of residents to most specialties with relatively high lifetime earnings and a persistent excess demand for residents in primary care with relatively low lifetime earnings His main contribution is to examine how differences in expected earnings affect the number of students who desire to enter a specialty rather than the number who actually enter the specialty The study finds that the income elasticity ranges from 103 in family practicepediatrics to 220 in radiology19 In other words a 1 percent increase in the lifetime earnings of primary care providers such as family practitioners will increase the number of students ranking family practice as the most preferred choice by 1 percent which can be translated into an increase of equal magnitude in the supply of family practitioners
18 RVU is a key component of the formula used under Medicare Physician Fee Schedule (PFS) to calculate payment
rates for an individual service There are three different RVUs work RVU practice expense (PE) RVU and malpractice (MP) RVU Work RVU reflects the relative time and intensity associated with Medicare PFS service PE RVU reflects the costs of maintaining a practice and MP RVU reflects the cost of malpractice insurance Source httpwwwcmsgovOutreachshyandshyEducationMedicareshyLearningshyNetworkshyMLNMLNProductsdownloadsmedcrephysfeeschedfctshtpdf
19 Earlier studies of JW Hay (ldquoPhysiciansrsquo specialty choice and specialty incomerdquo Econometrics of Health Care
edited by G Duru and J Paelinck Netherland Klwer Academic 1991) and J Hurley (ldquoPhysician choices of specialty location and moderdquo Journal of Human Resources No 26 1991 pp 47shy71) did not account for uncertainty in entry to a specialty However they find that medical students are substantially responsive to expected income These studies report income elasticities that range from 1 to 3
10
Final Report Health Practitioner Bonuses
However there are studies that report comparatively less impact of expected earnings on the decision to choose primary care Bazzoli (1985) found that medical students are more likely to choose primary care when the expected earnings are relatively large but the effect is quite small More specifically a $10000 (about 20 percent of the mean earnings in 1981) increase in the expected earnings in primary care relative to the nonshyprimary care yields a 14 percentage point increase in the probability of choosing primary care
Gagne and Leger (2005) have studied the specialty choice decision of Canadian physicians who practiced between 1989 and 1998 They find that a 91 percent reduction in relative feeshypershyconsultation for a general practitioner in Quebec and Saskatchewan for example would lead to a 04 percent reduction in the proportion of medical students entering general practice The largest response is observed in Manitoba where the proportion of medical students entering general practice is estimated to decrease by 229 percent as a result of a 91 percent reduction in relative feeshypershyconsultation The implied responsiveness of specialty choice to changes in earnings from this study and from other studies discussed in this section is summarized in Exhibit 2
Vaughn et al (2010) bolster this point by noting that programs designed to affect the number of medical students choosing primary care have largely failed because of the programsrsquo inability to affect relative incomes By estimating career wealth accumulation across specialists primary care physicians physician assistants business school graduates and college graduates the authors try to elucidate the true difference between payment of physicians and nonshyphysicians and between specialists and generalists within the physician group They note that this result is to be expected as programs have done little and continue to do little to affect the disparity in expected lifetime earnings between primary care physicians and specialists The authors also find that for a primary care physicianrsquos lifetime earnings to equal those of a cardiologist the primary care physician would have to receive a bonus of $11 million upon completion of medical school
Sivey and Scott (2012) use an econometric approach to address the question of the effect of lifetime earnings on training specialty choice based on a sample of Australian postgraduate doctors Using a generalized multinomial logit model the authors find a statistically significant positive impact of earnings on the probability of choosing general practice training versus specialty training Subsequently they use the same model to simulate the effect of a $50000 increase in annual earnings of general practitioners (GPs) on the probability of junior doctors choosing GP training Specifically the simulation result suggests that $50000 additional earnings for GPs (a 278 percent increase over their current salary of $180000) would lead to a 263 percent increase in the propensity of junior doctors to choose GP training Therefore the implied earnings elasticity of the propensity to choose GP training is 095 which is consistent with previous findings (Nicholson 2002)
11
Final Report Health Practitioner Bonuses
Exhibit 2 Summary of Responsiveness of Specialty Choice to Changes in Earnings (Earnings Elasticity)
StudyArticle Description Earnings
Elasticity
Nicholson (2002) Elasticity of ranking Family Practice Pediatrics as the 1
st specialty choice with
respect to lifetime earnings (among US medical school residents) 103
Nicholson (2002) Elasticity of ranking Radiology as the 1
st specialty choice with respect to lifetime
earnings (among US medical school residents) 220
Gagne and Leger (2005)
Elasticity of proportion of medical students (in 8 Canadian provinces) entering General Practice with respect to relativeshyfeeshypershyconsultation
0044 to 025
Sivey and Scott (2012)
Elasticity of probability of junior doctors (in Australia) choosing General Practice with respect to annual earnings
095
Hogan and Bouchery (2010)
Elasticity of percentage of male US medical school Internal Medicine graduates choosing Cardiology subspecialty with respect to annual compensation
250
Note earnings elasticity gives the percentage change in the outcome measure of interest (eg proportion ofshystudents ranking family practice or radiology as the 1
st choice) due to 1 percent change in earningsshy
In an unpublished piece Hogan and Bouchery (2010) estimate a multinomial logit model of the choices of internal medicine residents to remain in internal medicine and practice primary care or to obtain a fellowship for further training in one of nine subspecialties of internal medicine and ultimately practice in that subspecialty20 The authors find that a 1 percent increase in earnings from one of the career paths holding earnings in other specialties constant increases entrants of male US medical graduates into that the examined specialty (Cardiology) by about 25 percent but increases female entrants by about only 03 percent They also find that increases in the length of additional training required for a subspecialty have a negative effect on the number of US medical graduates pursing that subspecialty and reduces the probability that US medical graduates pursue the specialty but increases the probability that international medical school graduates pursue that subspecialty21
Expected lifetime earnings are not the only factor that influences decision making during specialty choice Medical students assign a low level of prestige to a primary care career compared to other specialties Students surveyed associate primary care with low income expectation low class rank and high educational debt (Henderson 1996) Students often enter medical school with a positive perception of primary care but by the time they reach their fourth year they are increasingly likely to disagree with the assertions that primary practice is prestigious adequately compensated and allows more control over working hours (Lynch 1998) It appears that studentsrsquo positive perceptions concerning primary care may change as they experience the more realistic professional demands on primary care physicians that can develop during medical school and as they observe their peers and role models both within primary care and outside
20 Paul F Hogan and Ellen Bouchery ldquo A Model of Subspecialty Choice for Internal medicine Residentsrdquo prepared by
The Lewin Group for the American College of Cardiology 2010 21
After simulating the impact of decreasing cardiology training requirements from three years to two the study finds that oneshyyear decrease in training requirements would increase the percentage of male US medical school graduates choosing cardiology from 171 percent to 182 percent
12
Final Report Health Practitioner Bonuses
2 Effects of Earnings on Labor Supply of Health Care Workforce
Consistent with the economic theory a large number of studies find evidence in support of a positive correlation between earnings and the labor supply of the health care workforce This is in contrast to much earlier studies that relied only on aggregate time series data on physician services and fees to conclude that physician labor supply functions were backwardshybending and physicians responded negatively to wage increases22 For instance Steiger et al (2010) observe that inflationshyadjusted physician fees (weighted average of Medicare and private sector fees) decreased substantially between 1995 and 2005 The timing of the reduction in fees closely matched the observed decline in nonshyresident physician work hours The study finds that the mean hours worked per week by physicians practicing in the US decreased by almost 7 percent between 1996 and 2008 Additionally by 2006 physician fees were 25 percent lower than their inflationshyadjusted 1995 levels More recent studies which use micro data to estimate traditional labor supply equation generally find a small positive elasticity of physiciansrsquo work hours with respect to wage increases For instance Rizzo and Blumenthal (1994) use the instrumental variable approach to estimate the unbiased effect of physicianrsquos wage on the annual hours the physician spends on patient care Their results based on all physicians suggest that a 10 percent increase in the wage rate yields a 27 percent increase in the physicianrsquos annual work hours (ie wage elasticity of 027) When restricted to selfshyemployed male physicians they find a wage elasticity of 023 However for female physicians they find a higher elasticity with a 10 percent increase in the wage rate leading to a 49 percent increase in annual work hours This work is generally supported by Baltagi et al (2005) who find that a 10 percent wage increase would lead to a 3 percent increase in physician labor supply among hospital employed male physicians in Norway Baltagi et al (2005) note that the magnitude of the wage elasticity in this case may be relatively small because of hospital employed physiciansrsquo tendency to earn a lower wage relative to selfshyemployed physicians 23
There are few studies that examine the effect of earnings on a physicianrsquos decision to retire Using micro data from Norway over the period of 1990shy1992 Herneas et al (2000) estimated a model to predict retirement behavior and simulated the effect of financial incentives on retirement decisions among those who were eligible to retire early (during 1990 shy 1992) and who worked fullshytime in 1990 In their simulation the annual pension from 1993 onwards is increased by 72 percent if the retirement eligible individuals continue to work fullshytime through 1992 This increase is equivalent to a 723 percent increase of the annual disposable pension24 The simulation result suggests that the average estimated probability of continuing to work fullshytime throughout 1992 will increase by almost 100 percent (from 384 percent to 706 percent) in response to the 7234 percent hike in annual disposable pensions described above25 In other words in the absence of any pension hike after 1993 only 384 percent of physicians working full time in 1990 would still work full time through 1992 However if pension is raised by 723 percent from 1993 onwards for those who would continue to work full time through 1992 the
22 For an inshydepth exposition of the empirical evidence and lack of support for a backwardshybending physician labor
supply pleas e see Handbook of Health Economic Vol 2 Chapter 14 Section 310 23
The nature of labor supply for Physicians and nurses differ greatly There are some studies on the effect of wages on the labor supply of nurses For example Askildsen and Baltagi (2002) estimates a wage elasticity of nursesrsquo supply of labor between 07 and 08 depending upon the method of estimation The authors argue that while theirs is a larger effect than other estimations have suggested it is still not a large effect relative to other professions They also note that contract structure and type of work being performed significantly impact labor supply decisions and should not be ignored
24 Wealth is defined as the discounted value of future annual disposable pensions and the increase in wealth is
evaluated at the means of the data 25
The expected remaining lifetime was then set at 18 years which is close to the actual average for people in the relevant age groups in 1992
13
Final Report Health Practitioner Bonuses
simulation shows that 706 percent of physicians working full time in 1990 would still do so through 1992 They also estimated that the same financial incentives will lower the average estimated probability of partial retirement in 1992 (of retirement eligible workers) by about 547 percent (from 362 percent to 164 percent) Additionally they find that other decisive factors influencing retirement decisions are the level of education income and marital status
3 Effects of Earnings on the Volume of Primary Care Services
The effect of earnings on the volume of primary care services is related to the previous questions but is a distinct issue that incorporates the ability of providers to impact the demand for services as a result of changes in their income Dummit (2008) argues that as the largest single payer Medicare affects physician practice revenues directly through its payments and indirectly through its fee schedule which many private payers use Lower compensation for primary care physicians is one of the reasons that these specialties are less desirable Reschovsky et al (2012) report that over the past decade Medicare fees and spending for specialist services (such as diagnostic tests and procedures) have gone up more rapidly than fees for EampM services which primary care providers (PCPs) typically provide Those higher payments have contributed to faster growth in specialist services than in EampM patient visits Commercial insurers and state Medicaid plans often build their fee schedules on Medicarersquos further widening the income gap between PCPs and other physician specialists and contributing to the shrinking number of medical students choosing to enter primary care In this section we review how improvements in Medicare fees can influence the volume of health care services provided under Medicare
Hadley et al (2009) estimate the relationship between Medicare fees and the volume of eight specific services provided by physicians using data for 13000 physicians from 2000shy2001 and 2004shy2005 Community Tracking Study Physicians Surveys Since the fee schedule is one of the few policy tools that Medicare potentially has available to influence service volume it is critical to have a better understanding of how changes in Medicare fees affect Medicare service volume Their study finds that a 10 percent reduction in Medicare fees leads to 18 percent to 66 percent reduction in the volume of office visits (of various degrees of complexity) They argue that physicians may be more likely to respond to fee cuts by limiting their acceptance of new Medicare patients rather than limiting visits by established patients
Clemens and Gottlieb (2014) examine the changes in physiciansrsquo reimbursement rates under Medicare before and after year 1997 when consolidation of geographic regions across which Medicare adjusts physician payments led to area specific price shocks The study measures health care supply of all services using RVU They find that health care supplied to Medicare patients (RVUs per patient) exhibits a relatively large long run elasticity of around 15 with respect to reimbursement rates Their results are mostly driven by the stronger positive elasticity among elective procedures (eg eye and orthopedic procedures) When restricted to the analysis of the supply of EampM services their estimates lack precision and they find statistically insignificant short (1997shy98) and long run (2001 to 2005) impact of the price shock on the supply of EampM services However the medium run (1999 and 2000) elasticity is precisely estimated to be 097 for EampM They argue that the observed responses imply that the overall composition of services shifts toward more elective procedures as reimbursement rates increase Finally the number of patients and physicians per patient are almost unaffected by the change in the reimbursement rates
Reschovsky et al (2012) simulate the effect of a permanent 10 percent fee increase for primary care EampM services under Medicare Their estimated primary care supply model suggests that higher primary care fees lead to increases in both the likelihood that PCPs will treat Medicare beneficiaries and more importantly the quantity of EampM services PCPs provide to Medicare
14
Final Report Health Practitioner Bonuses
patients According to their analysis higher fees (10 percent increase permanently) for primary care beginning in 2011 raise the primary care EampM visits by 88 percent
Thus the likely range of changes in the volume of primary care visits in response to a longshyterm increase in Medicare primary care fees appears to be wide Based on Hadley et al (2009) and Reschovsky et al (2012) a 10 percent increase in Medicare fees for primary care can potentially increase the volume of primary care visits in the range of 18 percent to 88 percent However due to the shortshyterm nature of the Medicare PCIP (only 5 years) the observed impact of the incentive payment on the volume of EampM visits may be closer to the lower bound
B Financial Incentives for Primary Care Providers in Underserved Areas
Access to health care in areas with insufficient health professionals has been an ongoing source of concern among policy makers Expansion of health insurance coverage through the implementation of the ACA is likely to stimulate the demand for primary care in general including underserved areas Health Resources and Services Administration (HRSA) designates such areas HPSAs These geographic areas meet a defined threshold of primary care physician to population ratio Since 1987 Medicare has been paying bonuses to physicians providing primary care in rural HPSAs In 1991 the bonus payment was increased from 5 to 10 percent and eligibility extended to services provided by physicians in urban HPSAs Thus this particular form of bonus payment has been in place for almost 25 years Section 413(a) of the Medicare Modernization Act of 2003 put in place an additional 5 percent bonus payment for physicians practicing in Physician Scarcity Areas (PSAs) PSAs were those counties and rural zip codes in metropolitan statistical areas (MSAs) that represented the 20 percent of the Nationrsquos population with the lowest physician to population ratios These areas often coincided with geographic HPSAs so that physicians practicing in those areas received a 15 percent additional bonus payment during 2005shy2008 when the PSA bonuses were in effect (ie from January 2005 through June 2008)
In this section we review the literature related to the volume of these bonus programs and their potential effects on primary care services and providers Programs to address this issue have historically been implemented with the assumption that financial incentives to practice in rural areas are effective in addressing the health professional shortage in given areas This assumption is largely validated by the literature with the effect of financial incentives shown to influence the distribution of physicians and health professionals Importantly the literature generally suggests a multifaceted approach to incentives financial or otherwise Many of the most successful programs evaluated below use recruitment of medical students with specific demographic markers to influence the distribution of physicians Financial incentives have a broad range of reported specialty choice elasticities that range from 001 to 095 These discrepancies may also be somewhat determined by the type of financial incentive (eg grant loan postgraduate bonus)
In an early article on the HPSA bonus Shugarman et al (2001) estimate that in 1991 the total amount of HPSA bonus was almost 316 million dollars Their estimate shows that 583 percent of the total HPSA bonus payment went to the rural HPSAs while the remaining 417 percent went to urban HPSAs They also find that the total bonus payment grew to reach about 106 million dollars in 1996 but then gradually declined to almost 77 million dollars in 1998 The proportion of rural HPSA bonus decreased to 511 percent
In a more recent study Shugarman and Farley (2003) examined the trends in HPSA bonus payments for primary care specialties (family practice general practice and internal medicine) under Medicare over the period of 1992shy1998 using Medicare claims data for nonshymetropolitan area beneficiaries They argue that the bonus payments largely targeted primary care They
15
Final Report Health Practitioner Bonuses
find that in 1992 the payments for primary care services represented 297 percent of the total Medicare bonus payments for physician services to rural Medicare beneficiaries The proportion gradually went up to 37 percent in 1998 Their analysis also showed that in 1992 payments for primary care services represented 14 percent of total basic Medicare payments for physician services and this share rose to 186 percent by 1998 However 559 percent of all Medicare HPSA bonus payments for services to beneficiaries in nonshymetropolitan areas were made to primary care physicians This proportion declined gradually to 497 percent in 1998 The authors claim that low levels of bonus payments in general coupled with the documented declines in those amounts since 1994 may have undermined their future potential to support physicians practicing in rural areas Their findings suggest that physicians were not claiming the extra payments that were available to them Factors that could be contributing to such low uses of bonus payments include the extent to which physicians know about the payments perceived value of the bonus to physicians effects of administrative procedures on the ease of receiving them and concerns about the risk of audits Nevertheless their study highlights the role of bonuses in improving the payments and the supply of primary care services in HPSAs
The literature regarding the effect of financial incentives in underserved areas on the choice of practice location of physicians is relatively scarce Chou and Lo Sasso (2009) examined the impact of local characteristics on the practice location choices for newly trained physicians in New York between 1998 and 2003 Their empirical results suggest that PCPs without educational debt are attracted to HPSAs In other words they estimate that the propensity of choosing a location by a PCP is higher if the location is designated as an HPSA However the estimated propensity is lower if physicians have larger educational debt Their study however addresses the effect of the HPSA status in general rather than any specific effect of the amount of HPSA bonuses
In a review of rural incentive programs Sempowski et al (2004) compare rural recruitment and retention programs in the United States against those in other countries (notably Canada and New Zealand) The authors look specifically at Return of Service (ROS) commitments wherein financial incentive is provided though assistance with medical school payment in return for a commitment to serve in a rural area The authors note that programs offering financial incentives in exchange for ROS commitments to rural or underserviced areas have achieved their primary goal of short term recruitment However the authors note that in the US the lenient buyout opportunities have hindered the programs and limited their effectiveness Sempowski et al (2004) argue that the programs in Canada and New Zealand may have greater success with retention as compared to the US programs because the programs in Canada and New Zealand have a multishyfaceted approach that includes the use of financial incentives along with prudent recruitment strategies
Bolduc et al (1996) provide a theoretical framework of physicianrsquos choice of location They develop a model to assess the effect of various incentive measures introduced in Quebec (Canada) on the geographical distribution of physicians across 18 regions during 1976shy1988 The study specifically examines general practitionersrsquo choice of initial practice locations in Quebec The utility of a particular alternative depends on among other things a measure of expected discounted value of lifetime earnings associated with this alternative It is through changes in this variable that the impact of various incomeshybased physicianshylocation programs is simulated Before 1982 there were substantial variations in the population to general practitioner (GP) ratio across different regions of Quebec In order to redress geographic imbalances in the distribution of physicians the Quebec government introduced the Differential Remuneration Program (DRP) in 1982 that raised the fees (relative to the base fees to general practitioners in underserved regions compared to the regions with relatively lower population to GP ratios Among other incentive measures annual study grants of $10000 have been offered
16
Final Report Health Practitioner Bonuses
(since 1982) tied to a commitment to work in these underserved regions during a number of years equal to the number of grants received A settlement grant program has also been available since 1984 for physicians who choose to practice in these regions This program provides an annual allowance for a maximum of 4 years It varies from $5000 to $10000 (nontaxable) for a physician paid by unit of service depending on the shortage of physicians in the locality Whereas the differential remuneration program influences location choices through differential pricing of physiciansrsquo services by location the grant program affects location choices through a lump sum increase in income for a short duration (4 years)
Bolduc et al (1996) find that on average a 10 percent increase in the general practitioner fees for medical services in a region increases the propensity of a beginning GP to work in this region by 7 percent Thus the implied elasticity of location choice probability with respect to fee increases is about 07 However this elasticity varies across regions it is higher in remote regions (with a maximum of 128) On the other hand on average the elasticity of location choice probability with respect to nonshylabor incomes such as study grants is estimated to be about 111 In other words a 10 percent increase in the study grants tied to a commitment to work in the underserved regions leads to an 111 percent increase in the probability of GPs choosing these underserved regions as their starting practice location However their findings largely depict redistribution of GPs across regions within Quebec rather than showing any increase in the total number of GPs in Quebec
Despite differences in the institutional framework between the US and Canada the findings from Bolduc et al (1996) provide some valuable insights into the potential effects of financial incentives that vary across locations The remaining important issue is to identify how bonus payments affect the annual earnings of physicians in HPSAs Only then based on findings from the literature can one assess the potential impact of the earnings shock in HPSAs on primary care physiciansrsquo choice of practice location Holmes (2005) addresses this question directly Using a database containing the location of physicians at 5shyyear intervals the author compares the locations chosen by alumni and nonshyalumni of programs within the United States charged with increasing physician supply in underserved areas This analysis provides insight into the types of students that choose to enroll in programs such as the National Health Service Corps (NHSC) The author notes that participation in this program consists disproportionately of minorities from private expensive schools This suggests that scholarships (and hence the lack of debt burden) may be an influential factor in participation in the NHSC The multinomial logit model employed by Holmes (2005) shows that students which graduate from an institution with a focus on primary care are also more likely to enroll in the NHSC Using this model Holmes (2005) concludes that the elimination of the NHSC program would lead to a 10shy11 percent decrease in the supply of recent graduates in underserved communities
Rabinowitz et al (2001) examine the history and results of The Physician Shortage Area Program (PSAP) of Jefferson Medical College (Philadelphia PA) The PSAP is intended to address the shortage of primary care physicians in rural Pennsylvania The authorsrsquo analysis uses a cross section of Jefferson Medical College Graduates from 1978 to 1993 to determine which characteristics are predictive of becoming a rural primary care physician (PCP) Of the characteristic variables collected in the data freshman year plans for family practice being in PSAP having a NHSC scholarship male sex and taking elective senior family practice rural preceptorship were independently predictive of primary care in a rural area However among nonshyPSAP graduates with two key selection characteristics of PSAP students (having grown up in a rural area and freshman year plans for family practice) were 78 percent as likely as PSAP graduates to be a rural primary care physician and 75 percent to remain rural PCPs The authors note that this result suggests the most influential area of the program is the admissions component not the financial component Supporting evidence for this conclusion is provided by
17
Final Report Health Practitioner Bonuses
Brooks (2002) who found that rural upbringing and specialty preference were most strongly correlated with recruitment of physicians to rural areas Growing up in a rural area along with the studentrsquos expressed plan to become a primary care physician were associated with a 36 percent likelihood of a graduate practicing in a rural area compared with 7 percent for individuals without these preferences
Although most studies found that there was no correlation with age gender race or marital status (Horner 1993 Looney 1998 Rabinowitz 1999) a few studies determined that men have a greater likelihood of rural practice than women (Fryer 1997 West 1996) However women PSAP graduates were more than twice as likely as nonshyPSAP women to practice in rural areas (317 percent versus 123 percent) (Rabinowitz 2011) Importantly none of these articles list financial incentives as an important factor in recruitment and retention of primary care physicians in rural areas
C Impact of the Increase in Medicaid Reimbursement Rate Relative to the Medicare Rate
The availability of primary care is particularly important for public payer programs such as Medicaid and Medicare Historically Medicaid has been the lowest payer for primary care services relative to Medicare paying just 66 percent of Medicare rates on average26
Cunningham et al (2009) report that fewer physicians accept new Medicaid patients in response to the low Medicaid reimbursement rates in several states Zuckerman et al (2009) describe that in 2008 average primary care physician fees under Medicaid ranged from 57 percent of the national average in Rhode Island to 226 percent of national average in Alaska They also find that after a strong Medicaid fee growth during 1998shy2003 Medicaid fees fell relative to inflation during 2003shy2008 Despite the slowdown in overall fee growth Medicaid fees for primary care services kept pace with inflation ACA increases Medicaid reimbursement rates for certain services provided by primary care physicians to 100 percent of Medicare rates in 2013 and 2014 Given the variability of Medicaid payments across states this could be a substantial boost in payments for physicians in some states and less so in others
The findings in this section focus on the comprehensive effect of a relative rate increase both on services provided and patientrsquos utilization of those services While evidence is mixed the literature indicates significant effects of increased Medicare reimbursement on both the provision and utilization of primary care services Reported elasticities range between 041 in national estimates to shy006 in some state level analyses This broad range suggests varying evidence and a need for greater examination given the importance of this question
1 Systemic Change in Medicaid Reimbursement Rates in All States
Systemic Medicaid changes have the potential to alter the primary care environment across all states Cunningham (2011) considers a regressionshybased approach to identify the causal effect of increases in Medicaid reimbursement rates relative to the Medicare rate on the propensity of primary care physicians accepting new Medicaid patients He reported prior to the 2012 Supreme Court decision (National Federation of Independent Business et al vs Sebelius et al27) that once the ACA is implemented Medicaid eligibility will expand to cover as many as 16 million more poor and lowshyincome adults by 2019 (an increase of more than 25 percent) To
26 Small DM and T McGinnis (2012) ldquoLeveraging the Medicaid Primary Care Rate Increase The Role of
Performance Measurementrdquo Center for Health Care Strategies Inc 27
US Supreme Courtrsquos decision in the case challenging the constitutionality of the Affordable Care Act (ACA httpwwwsupremecourtgovopinions11pdf11shy393c3a2pdf
18
Final Report Health Practitioner Bonuses
meet the resultant surge in demand for primary care services ACA provides financial incentives to encourage higher participation of primary care physicians in Medicaid Specifically the ACA raises the Medicaid reimbursement rates for certain services provided by primary care physicians up to 100 percent of Medicare rates in 2013 and 2014 This study uses primary care physicians from the HSC 2008 Health Tracking Physician Survey and exploits the existing state level variation in Medicaid reimbursement rates (as a percentage of the Medicare rate) The author groups the states in three categories (low medium and high) based on PCPs to population ratios
This study shows that in 2008 the average Medicaid reimbursement rate for lowshyPCP states was about 816 percent of the Medicare rate while for medium and highshyPCP states the average rates were 643 percent and 548 percent respectively The national average of the Medicaid reimbursement rate was 662 percent of the Medicare rate Cunningham (2011) examines the effects of Medicaid reimbursement rates on PCP acceptance of Medicaid patients while accounting for differences in physician practice patient and health care market characteristics The results show that higher Medicaid reimbursement rates are associated with a greater probability of PCPs accepting all or most new Medicaid patients although the effects are relatively modest For PCPs a 10shypercentage point increase in the MedicaidMedicare fee ratio for primary care is associated with only a 21shypercentageshypoint increase in PCP Medicaid patient acceptance The study reports that the national average Medicaid reimbursement rate relative Medicare in 2008 was at 662 percent and the national average acceptance rate of new Medicaid patients by PCPs was 415 percent Therefore the implied elasticity of accepting primary care patients with respect to the payment rate is about 03328 In other words if the Medicaid fee relative to the Medicare rate goes up by 10 percent then the acceptance of new Medicaid patients by PCPs goes up by 33 percent Excluding pediatricians the effect of reimbursement on Medicaid acceptance is slightly higher the implied elasticity of accepting primary care patients with respect to the payment rate is about 041 In the context of the parity in Medicaid and Medicare reimbursement rate under the ACA empirical findings by Cunningham (2011) can serve as a benchmark for the likely positive effect of higher Medicaid reimbursement rates on the access to primary care services
Other studies bolster this finding Shen and Zuckerman (2005) study the effects of Medicaid payment generosity on access and care for adult and child Medicaid beneficiaries The authors use data comparing the experiences of Medicaid beneficiaries with groups that should not be affected by Medicaid payment policies (the uninsured) using a differenceshyinshydifferences model Shen and Zuckerman (2005) find that higher payments do increase the probability of having a usual source of care and the probability of having at least one visit to a doctor or other health professional Specifically they find that a one unit increase (equivalent to a 10 percent increase) in the payment generosity index29 leads to a 15 percentage point increase in the probability of having a usual source of care and a 16 percentage point increase in having at least one visit to a health professional30 Importantly payment generosity was noted to have no effect on the probability of receiving preventive care or the probability of having unmet needs The authors argue that this weak association between increased payments and utilization of services is due to the higher correlation between payment increases and participation by physicians with a secondary effect on utilization
28 Implied Elasticity is (21415)(10662) or 033 After excluding Pediatricians the acceptance rate of Medicaid
patients among PCPs is about 385 percent and a 10shypercentage point increase in the MedicaidMedicare fee ratio for primary care is associated with only a 24shypercentageshypoint increase in PCP Medicaid patient acceptance Therefore the implied elasticity is (24385)(10662) or 041
29 The Medicare payment generosity index is defined as the Medicare capitation rate in a county divided by the
median Medicare capitation rate in the nation in a given year Average is defined to be 10 30
These can be interpreted as elasticities Implied elasticity would be 015 and 016 respectively
19
Final Report Health Practitioner Bonuses
2 Stateshyspecific Experience on Changes in Medicaid Reimbursement Rates
To better understand the mechanism by which systemic changes in the Medicaid system will be implemented and the broad range of environments affected it is informative to review Medicaid changes at the state level Zuckerman et al (2004) illustrate that Medicaid physician fees increased on average by 274 percent between 1998 and 2003 with primary care fees growing the most On average the cumulative percentage change in the Medicaid primary care fee was about 412 percent between 1998 and 2003 The authors note that there was considerable variation in primary care fees across states Seven states (District of Columbia Georgia Indiana Kentucky Maine Rhode Island and South Dakota) left primary care fees almost unchanged while two states (Iowa and New York) raised them by more than 100 percent States with the lowest relative fees in 1998 increased their fees the most but almost no states changed their position relative to other states or Medicare since Medicare rates also increased over the period Subsequently the study finds that primary care physiciansrsquo acceptance of Medicaid patients in highshyfee states was about 18 percentage points higher than the lowshyfee states (61 percent versus 43 percent) in 1997 while in 2001 the gap is reduced to 11 percentage points (58 percent versus 47 percent) The national average of primary care physiciansrsquo acceptance of most or all new Medicaid patients was 53 percent in 1997 and 54 percent in 2001 Moreover large fee increases (eg lowshyfee states experienced the largest fee change on average) were associated with primary care physiciansrsquo greater willingness to accept new Medicaid patients the rate of primary care physiciansrsquo acceptance of new Medicaid patients in these lowshyfee states went up from 43 percent in 1997 to 47 percent in 2001 Although their study shows some evidence that a Medicaid fee increase is associated with increased Medicaid participation among primary care physicians it does not provide a direct link between Medicaid reimbursement rates relative to Medicare and physiciansrsquo acceptance of Medicaid patients
Bindman et al (2003) examine California in particular and focus on the relationship between Medicaid fee increases and the prevalence of managed care in the MedishyCal system The authors note that in August of 2000 a fee increase raised physician Medicaid reimbursement from an average of 577 percent to 652 percent of the average Medicare payment in California This amounts to a fee increase for a typical office visit from approximately $18 to $24 The study used crossshysectional surveys in 1996 and 2001 on both primary care physicians and specialists Controlling for physician demographics and specialties the authors found no increase in MedishyCal participation Their study notes that between 1996 and 2001 despite payment increases the number of MedishyCal primary care physician equivalents dropped from 57 to 46 per 100000 patients31
Mukamel et al (2012) address the effect of similar financial incentives in Californiarsquos Medicaid system but from the standpoint of nurse staffing levels Using separate models for three staffing types RNs LPNs and CNAs the authors determined that financial incentives were only a significant factor in increasing hours per resident day (hprd) for RNs They note that expected nursing home reimbursement rate increases in 2008 were associated with increased RN staffing levels in 2006 They estimate the effect at around a 2shyminute increase (0035 hrpd) for each $10 increase in payment rate This amounts to a 10 percent increase in staffing over 2005 base levels The authors explain that this relatively small increase in staffing might be partially explained by the financial incentives original intent that is to influence labor expenditures and
31 A physician equivalent is defined as one full time physician providing full time working hours per week (40 hrs) in a
given specialty For example a physician who provides 20 hours of Family Medicine is counted as 05 of a physician equivalent in Family Medicine
20
Final Report Health Practitioner Bonuses
not directly influence staffing levels The authors note there may have been a change in wages and benefits for all three groups but that it was not measured in this study
Finally Coburn et al (1999) examined the effect of Medicaid fee changes on physician participation and enrollee access in Maine and Michigan using multiple natural experiments The authors found that changes in Medicaid fees observed in either state over any observed period had no substantial impact on either physician participation or enrollee access and utilization32 In one case in Maine after an increase of 475 percent in Medicaid reimbursement rates primary care physician participation fell by 1 percent (from 477 to 471)33 After a second increase of 245 percent participation increased by only 2 percent34 This result is mirrored in Michigan where participation increased by only 2 percent after a reimbursement increase of 79 percent and decreased by 06 percent after a cut of 166 percent and fell again by 02 percent after a restoration of 196 percent The authors note that these small changes in physician participation hold even when adjusting for lagged responses in both cases The authors found similar results when examining the utilization of services Using ambulatory care as a proxy for utilization of services in general the authors found that changes in the proportion of beneficiaries with at least one visit in a month and in the average number of visits by beneficiaries with at least one visit are not in a direction consistent with the fee changes and are all very small in magnitude The authors note that these results also do not change when estimated in the long run However a major confounding factor in these results as the authors note is the relative size of Medicaid payment rate increases compared to those of the private sector fees The authors state that most gains relative to the private market were quickly eroded
Conclusions
In order to inform our empirical estimation the Lewin Group has explored the health and labor economics literature to understand the nature and the size of the impact of any financial incentives on the labor supply behavior of PCPs and the resultant impact on the availability of primary care services The main objective of this review is to document the prior empirical evidence of the impact of financial incentives on raising the supply of primary care workforce the volume of services impact on medical graduatesrsquo propensity to participate in primary care PCPsrsquo retirement decision etc This review also evaluates the past evidence on the effect of bonuses shortage areas and their effectiveness in redistributing and retaining primary care workforce Finally the review of the literature also focuses on the stateshyspecific experiences with changes in their respective Medicaid payment rates for primary care and the resultant impact on the supply of PCPs their rate of acceptance of Medicaid patients and the volume of primary care services such as office visits or visits for EampM services
Affecting the choice of specialty by a medical student is one way by which the supply of primary care services may be increased Several studies (eg Nicholson 2002 Sivey and Scott 2012) find that the propensity of medical graduates choosing primary care as their specialty would go up by 95shy10 percent in response to a 10 percent increase in their earnings (ie earnings elasticity of 095shy10) Thus even if bonus payments have the potential to influence the inflow of
32 The study has given due consideration to the changes in Medicaid payment relative to the payments by other
payers The authors use the ratio of Medicaid payments to charges as an index of changes in relative payments They have also confirmed with Blue Cross Blue Shield (BCBS) of Michigan (which serves 49 percent of the statersquos health insurance market) that BCBSrsquos paymentsshytoshycharge ratio for all physician services did not change substantially
33 The corresponding relative fee change (ie Medicare relative to charges) is 402 percent
34 The corresponding relative fee change (ie Medicare relative to charges) is 258 percent
21
Final Report Health Practitioner Bonuses
medical students into primary care the magnitude of that impact would depend largely on the size of actual bonus payments relative to PCPsrsquo earnings and how long such payments are in place These two factors will determine the contribution of the Medicare bonus to the lifeshytime earnings of primary care providers
Another way to affect the supply of primary care services is to provide financial incentives for existing providers with the aim of increasing their labor supply Past research (eg Rizzo and Blumenthal 1994 Baltagi et al 2005) estimates that a 10 percent increase in wage earnings would yield a 23 3 percent increase in their annual work hours This low wage elasticity suggests that influencing the supply of primary care labor with direct fee increases alone is likely to be costly The increased fee payments will also likely have an effect on the volume of primary care services However compared to the wage elasticity the change in volume of services in response to fee increases is relatively low Empirical evidence from the literature (eg Hadley et al 2009 Reschovsky et al 2012) suggests that a 10 percent change in Medicare fees would change the volume of office visits or EampM related visits by 18 to 88 percent in the same direction
The numerical estimates of the effect of financial incentives in underserved areas on the choice of practice location of physicians in the US are relatively scarce An important study based on Canadian data finds that on average a 10 percent increase in the general practitioner (GP) fees for medical services in a region increases the propensity of a beginning GP to work in this region by 7 percent (Bolduc et al 1996) Thus the implied elasticity of location choice probability with respect to fee increases is about 07 Several studies highlight the role of bonuses in improving the payments and the supply of primary care services in HPSAs in the US However estimating the true contribution of bonuses in underserved areas in boosting physiciansrsquo earnings would require additional research
Past research on stateshyspecific increases in Medicaid and their resultant impact is relatively sparse However several studies find a positive correlation between the Medicaid reimbursement rate and acceptance rate of Medicaid patients among PCPs Cunningham (2011) finds that the effect of increase in Medicaid reimbursement rate on the propensity of accepting primary care patients is positive but small in magnitude Coburn et al (1999) finds positive impact of Medicaid fee changes on physician participation and enrollee access in Maine and Michigan while Bindman et al (2003) did not find significant effect of Medicaid fee increase on the participation rate of primary care physicians in California
Despite several empirical results regarding the potential magnitude of the effect of different financial incentives the estimated effect of Medicare bonuses or improvement in Medicaid reimbursement rates under ACA may not be substantial This is primarily due to the size and the temporary nature of these positive earnings shocks The empirical evidence on the effect of this type of shortshyterm pay increase is almost nonshyexistent in the literature However the ranges of the effects of longshyterm earnings shocks from our review of the literature can inform policy makers about the likely magnitude of the impacts of these incomeshyaugmenting policies for PCPs if they are sustained for a longer duration
Modeling the Impact of Medicare Incentive Payment for Primary Care Providers
A Study Design Overview
The Medicare primary care incentive is available to eligible primary care practitioners for services provided under selected categories of EampM An eligible primary care practitioner is a
22
Final Report Health Practitioner Bonuses
physician nurse practitioner clinical nurse specialist or a physician assistant who satisfies the following criteria
1 Enrolled in Medicare with a primary specialty designation of family practice internal medicine pediatrics or geriatrics and
2 At least 60 percent of the practitionerrsquos allowed charges under the Medicare physician fee schedule (excluding hospital inpatient care and emergency department visits) are for primary care services
This temporary payment is available for primary care services furnished by an eligible primary care practitioner on or after January 1 2011 and before January 1 2016 The payment is made on a quarterly basis and it amounts to 10 percent of the payment amount for the Part Bshycovered primary care services furnished by the eligible provider
Based on data regarding all the Medicare PCIP recipients in 2011 and 2012 we observe that in 2011 there were 162342 providers that received the PCIP with the majority of physicians specialized in family medicine and internal medicine (Exhibit 3) Also nurse practitioners account for more than half of nonshyphysician recipients in both 2011 and 2012 Finally there was an increase in the number of physician PCIP recipients across all eligible specialties in the second year the payment was in effect The number of all eligible types of nonshyphysician PCIP recipients also increased These estimates are consistent with the statistics reported by CMS35
Exhibit 3 Number of PCIP Recipients under Medicare by Specialty 2011shy2012
Specialty Year 2011 Year 2012
Physicians 121140 133880
Internal Medicine 54062 62554
Family Medicine 63227 66560
Pediatrics 2711 3426
Geriatrics 1140 1340
NonshyPhysicians 41202 51432
Clinical Nurse Specialist 466
Nurse Practitioner 27698 33940
Physician Assistant 13038 16899
Total 162342 185312
Note Actual PCIP recipients eligibility based on conditions 2 years prior to the PCIP payment year
The specific PCIPshyeligible services and their corresponding Current Procedural Terminology (CPT) codes are as follows (1) office and other outpatient visits (99201 through 99215) (2) nursing facility domiciliary rest home or custodial care (99304 through 99340) and (3) home services (99341 through 99350)
Medicare claims data include the Healthcare Common Procedure Coding System (HCPCS) corresponding to each claim submitted by providers Since level I of HCPCS codes is comprised of CPT codes HCPCS codes associated with claims can be used to determine bonusshyeligible EampM services
35 Source Center for Medicare and Medicaid Services (httpwwwcmsgovMedicareMedicareshyFeeshyforshyServiceshy
PaymentPhysicianFeeSchedDownloadsPCIPshy2011shyPaymentspdf)
23
Final Reportshy Health Practitioner Bonuses
The key questions that we examined using the Medicare data include
What is the aggregate number of Medicare PCIP recipients
What proportion of primary care providers qualify for the PCIP
What are the characteristics of primary care providers who qualify for the PCIP
How many eligible claims were submitted by PCIP eligible providers
What is the impact of Medicare incentive payments on services provided patients seen providers accepting Medicare and other related outcome measures
B Data Sources and Variables
1 Main Data Sets
To explore these topics we used a customized data set constructed at the provider level This data set includes all the claims submitted by the entire universe of Medicare providers in each year from 2005 to 2011 The content of this customized data set is similar to the Limited Data Set (LDS) version of the Medicare Carrier File (which is also known as the PhysicianSupplier Part B Claims) available from CMS Research Data Assistance Center (RESDAC) Subsequently in the discussion that follows we will refer to the customized claims level data set for all Medicare providers as the Provider Carrier File (PCF) Most of the claims in our PCF are from nonshyinstitutional providers such as physicians physician assistants clinical social workers and nurse practitioners Key variables in this file include
Procedure codes (HCPCS) corresponding to each claim
Provider total allowable charges associated with all claims
Provider specialty place of service and geographic location (such as zip code)
We constructed a provider level pooled data set (PPD) from the claims level data in the PCF over the period 2005shy2011 This pooled data set includes information such as provider specialty volume of primary care services (based on HCPCS codes) volume of PCIP eligible services distribution of providers by volume of services their annual Medicare allowed charges their geographic location and other related information over a longer time horizon In addition the original PCF included a National Provider Identifier (NPI) for each provider Subsequently each provider was linked by NPI to Provider360 data (available from Lewin Grouprsquos parent company Optum Inc) and the AMA Physician Master File to add provider characteristics such as provider demographics (eg age gender) provider designation medical school practice group information specialty and practice location We also added geographic location specific characteristics by linking the provider level data with the Area Resource File (ARF) based on the practice location information of providers The ARF data are maintained by the Health Resources and Services Administration (HRSA) The main advantage of this pooled data set is the ability to track providers over time and capture changes in their volume of services in response to Medicare payment incentives using a preshyandshypost analysis design
2 Trends in Key Outcome Variables
We were interested in estimating the impact of the PCIP on the supply of PCPs and patientsrsquo access to their services We measured improvements in access to care by studying changes in the volume of primary care services provided and the number of PCP providers Both the supply of PCPs and volume of services are measures of access to care previously used in the
24
Final Report Health Practitioner Bonuses
literature36 In addition we investigated the impact of the PCIP on the allowed charges associated with eligible EampM claims
Primary Care Providers with PCIP Eligible Specialties
First we examined the trend in the number of eligible providers submitting Medicare claims An increase in the number of primary care providers relative to the population is expected to improve access to primary care As shown in Exhibit 4 the number of PCPs accepting Medicare patients increased steadily over the study period with an approximate 40 percent increase in the number of providers treating Medicare patients from 2005 to 2011 This trend is common to all four physician specialties under study37 In addition the number of nonshyphysician practitioners more than doubled over this period This significant increase in the number of nonshyphysician providers especially nurse practitioners has been documented elsewhere38
Exhibit 4 Number of Primary Care Providers under Medicare by Specialty 2005shy2011
Specialty 2005 2006 2007 2008 2009 2010 2011
Physicians 138356 147771 165150 173018 178784 185070 191930
Internal Medicine 69391 74411 83117 87090 90291 93904 97526
Family Medicine 61438 65205 72247 75132 77536 79891 82298
Pediatrics 6539 7045 8527 9447 9543 9757 10555
Geriatrics 988 1110 1259 1349 1414 1518 1551
NonshyPhysicians 46634 53823 68297 80041 88569 97789 109353
Clinical Nurse Specialist 1784 1934 2188 2304 2370 2446 2508
Nurse Practitioner 23610 27450 35286 42144 46973 52472 59505
Physician Assistant 21240 24439 30823 35593 39226 42871 47340
Total 184990 201594 233447 253059 267353 282859 301283
Volume of EampM PCIP Eligible Claims
Our second measure of supply of primary care services is the volume of claims submitted by primary care providers for EampM services As presented in Exhibit 5 the volume of EampM claims submitted by physicians increased by roughly 9 percent between 2005 and 2008 EampM claims took a slight dip in 2009 increased in 2010 and then stabilized in 2011 at roughly the levels in 2008 The same general increasing trend applied to each of the four eligible physician specialties with the exception of geriatrics which experienced a constant and substantial increase in EampM claims of 52 percent over the study period Internal medicine physicians provided the majority of services generating more than 50 percent of EampM claims each year over the study period Family physicians are the second largest group of providers to supply
36 For instance see Stensland et al 2013
37 In 2005 almost half of the primary care providers (PCPs) were male but the share of male PCPs declined to almost
40 percent in 2011 (Exhibit B1 Appendix B) On the other hand the share of PCPs aged 55 and above among all male PCPs increased from 24 percent in 2005 to 375 percent in 2011 (Exhibit B1 Appendix B) As observed in Appendix Exhibit B1 the physician population appears to be aging The share of male physicians aged 65 and above underwent the largest increase recently from 186 percent in 2010 to 21 percent in 2011 (Exhibit B9a Appendix B) A similar increasing trend is also observed among female physicians aged 55 and above (Exhibit B9b Appendix B) Finally in the case of nonshyphysicians we observe the same steady increase in the share of providers aged 55 and above for both male and female providers (Exhibit B10shy11 Appendix B)
38 Source GAO (2008) ndash ldquoPrimary care Professionals Recent Supply Trends Projections and Valuation of Services
ldquo GAO 08shy472T
25
Final Report Health Practitioner Bonuses
EampM services representing about 40 percent of the total followed by geriatricians and pediatricians
Consistent with the increase in the number of nonshyphysicians documented above we observe an even more dramatic increase in the total number of EampM claims submitted by nonshyphysicians (clinical nurses nurse practitioners and physician assistants) The volume of EampM claims more than doubled over the study period from roughly 9 million in 2005 to more than 20 million in 2011
Exhibit 5 Total Number of PCIP Eligible EampM Claims submitted by All PCPs under Medicare by PCP Specialty 2005shy2011
Specialty 2005 2006 2007 2008 2009 2010 2011
Physicians 105943390 107978615 111700420 115408741 114881401 117265160 115329828
Internal Medicine
60279101 61222893 63082429 64946744 64244760 65447440 63698392
Family Medicine
44352228 45264171 47011232 48776874 48891712 49977085 49767310
Pediatrics 334997 352594 360508 365170 387636 391312 377604
Geriatrics 977064 1138957 1246251 1319953 1357293 1449323 1486522
NonshyPhys 8885528 10366281 11979963 13710969 15376840 18008471 20477006
Clinical Nurse Specialist
6083315 7068153 8117610 9212329 10298679 11987059 13561380
Nurse Practitioner
153463 165033 168030 200074 228899 260618 296206
Physician Assistant
2648750 3133095 3694323 4298566 4849262 5760794 6619420
With both the aggregate number of EampM claims and the number of providers rising over time we further explore the change in the volume of claims per provider over time In other words we examined whether the increase in the aggregate number of claims could be due to the increase in claims per provider or whether it is just due to the increase in the number of providers
Inspection of Exhibit 6 reveals that in the case of all physicians the average number of eligible EampM claims per provider in 2011 was lower than in 2005 For instance the average number of eligible EampM claims for internal medicine was 653 in 2011 compared to the higher value of 869 in 2005 The decreasing trend in average claims per physicians may be due to the increase in the number of PCPs in the absence of a substantial increase in the patient population
26
Final Report Health Practitioner Bonuses
Exhibit 6 Average Number of PCIP Eligible EampM Claims per PCP under Medicare by Specialty 2005shy2011
Finally in the case of nonshyphysicians there was an overall increase in the average number of EampM claims submitted by physician assistants (PA) nurse practitioners (NP) and clinical nurse specialists (CNS) after 2009 (see Exhibit B2 Appendix B) For example the number of claims per PA increased from 125 in 2005 to almost 140 in 2011 On the other hand the number of claims per NP was 253 in 2005 then declined to 219 in 2009 and then increased to about 228 in 2011 The increase in the average number of claims submitted suggests that the dramatic increase in services provided is due to both an increase in the number of providers and in the number of services provided by each nonshyphysician The average number of claims per PCIP recipients by specialty and the average allowed charges per PCIP recipients by specialty are presented in Appendix B Exhibit 12 and 13 respectively
Allowed Charges for PCIP Eligible EampM Claims
So far we have focused on the level of EampM services provided measured in terms of number of claims and the number of providers Next we turn to the dollar value associated with EampM claims measured using allowed charges As shown in Exhibit 7 the total allowed charges (in million dollars) for eligible EampM claims increased for all providers over the period of analysis Overall total allowed charges increased by 58 percent with internal medicine and family medicine physicians accounting for most of this increase It is also noteworthy that the value of claims submitted by nonshyphysicians increased substantially over the same period by a factor between 2 and 3
27
Final Report Health Practitioner Bonuses
Exhibit 7 Total Allowed Charges (in million $) for the PCIP Eligible EampM Claims submitted by All PCPs under Medicare 2005shy2011
Specialty 2005 2006 2007 2008 2009 2010 2011
Physicians $6271 $6575 $7343 $7813 $8119 $9079 $9274
Internal Medicine $3671 $3830 $4251 $4506 $4644 $5182 $5231
Family Medicine $2520 $2645 $2982 $3183 $3340 $3742 $3881
Pediatrics $20 $21 $23 $24 $26 $30 $30
Geriatrics $61 $78 $87 $100 $108 $125 $131
NonshyPhysicians $416 $517 $617 $743 $871 $1114 $1316
Clinical Nurse Specialist $287 $358 $421 $507 $592 $749 $878
Nurse Practitioner $8 $9 $9 $11 $14 $17 $20
Physician Assistant $122 $150 $187 $225 $265 $349 $418
Total $6687 $7091 $7960 $8556 $8990 $10193 $10589
As shown in Exhibit 8 the average allowed charge per PCP for EampM claims increased slightly for internal medicine physicians and pediatricians after 2009 (also see Appendix B Exhibit B2) The average value of EampM claims increased for the other PCPs but not as fast as the total value of these claims Given the moderate increase in the average allowed charges for EampM claims the substantial increase in the aggregate allowed charges is likely due to the increase in the number of claims which in turn as discussed above may be driven by the increase in the number of providers Another important observation is that although the average number of claims submitted by physicians declined over the 2005shy2011 period the average allowed charges remained the same or even increased This observed increase in allowed charges per provider despite the documented decline in the number of claims may reflect changes in the composition of services that physicians are providing We hypothesize that this change in the composition is due to an increase in the supply of services that take more time and which are typically associated with higher charges We explore this hypothesis in the following section
28
Final Report Health Practitioner Bonuses
Exhibit 8 Average Allowed Charges ($) for the PCIP Eligible EampM Claims per PCP under Medicare by Specialty 2005shy2011
Finally we constructed the proportion of practitionerrsquos allowed charges under the Medicare fee schedule (excluding hospital inpatient admission and emergency room visits) that are for PCIP eligible primary care services As observed in Exhibit 9 for both physicians and nonshyphysicians the proportion of services that are PCIP eligible varies across specialties and is in general steadily increasing over the observation period However compared to primary care physicians the nonshyphysicians experienced a much larger percentage change in the share of allowed charges that are associated with PCIP eligible services
Exhibit 9 Share of Allowed Charges for PCIP Eligible EampM Claims by Specialty2005shy2011
Specialty 2005 2006 2007 2008 2009 2010 2011
Physicians
Internal Medicine 583 590 611 609 612 651 632
Family Medicine 692 699 724 722 725 750 734
Pediatrics 289 376 439 426 446 517 480
Geriatrics 754 845 851 858 855 879 867
NonshyPhysicians
Clinical Nurse Specialist 239 249 258 299 333 364 407
Nurse Practitioner 616 649 647 663 666 708 715
Physician Assistant 506 514 529 534 543 598 591
Note the proportions are of allowed charges for all Medicare claims (excluding hospital inpatient ER drug and lab)
29
Exhibit 8 Average Allowed Charges ($) for the PCIP Eligible EampM Claims per PCP under Medicare by Specialty 2005-2011
Final Report Health Practitioner Bonuses
While the proportion of services that are PCIP eligible is increasing over the observation period the opposite is true for the proportion of EampM claims (Exhibit 10) Consistent with the decrease in the aggregate number of EampM claims documented above we observe that the share of EampM claims out of the total Medicare claims is also slightly decreasing over the period For example in the case of providers specializing in internal medicine the share decreased from 411 percent in 2005 to 375 percent in 2011
Exhibit 10 Share of PCIP Eligible EampM Claims by Specialty 2005shy2011
Specialty 2005 2006 2007 2008 2009 2010 2011
Physicians
Internal Medicine 411 411 401 393 373 383 375
Family Medicine 432 430 419 409 386 392 384
Pediatrics 309 338 347 347 330 342 341
Geriatrics 648 696 677 641 610 600 603
NonshyPhysicians
Clinical Nurse Specialist 272 262 259 276 288 309 329
Nurse Practitioner 558 567 548 519 485 503 500
Physician Assistant 455 461 450 438 410 434 431
Note the proportions are calculated out of all Medicare claims (excluding hospital inpatient ER drug and lab)
The trends in primary care services and providers discussed above apply in general to the more restricted sample of PCIP recipients (Exhibits B4shy7 in Appendix B) When we limit the number of providers to 2011 PCIP recipients we observe a slight decrease in the average number of eligible claims submitted by physicians (Exhibit B5 Appendix B) and an overall increase in the average allowed charges over the study period (Exhibit B6 Appendix B)
C Econometric Framework
We used the providershylevel data to address the key research questions related to the Medicare PCIP We estimated several regressionshybased models using the DID method to obtain consistent estimates of the PCIP policy effect39 In order to implement the DID model we
1 Form a group of providers (treatment group) who are likely to be affected by the PCIP program including the following specialties family practice internal medicine pediatrics and geriatrics
2 Identify a natural relevant comparisoncontrol group (other nonshyprimary careshypractitioners) who are not likely to be affected by the PCIPshy
3 Assess the changes in our key outcomes of interest for the treatment group relative to the control group before and after the PCIP policy is in effect
We estimate the following econometric model to identify the effect of Medicare PCIP program on the magnitude of primary care EampM services
39 An alternative estimation method is a preshypost analysis but if there are unobserved factors that affect the
magnitude of EampM services supplied by any provider (primary or nonshyprimary care) and the effect of these unobserved factors varies over time a preshypost model would not yield an unbiased incentive effect
30
Final Report Health Practitioner Bonuses
Sit = + lowast Ti + lowast t + 8 lowast t lowast Ti + it lowast + Eit
We let Sit be the volume of eligible EampM services provided by provider i in period t Ti is anindicator for treatment group that takes the value 1 if the provider is a PCP and zero otherwise the variable Postt is an indicator variable taking the value of 1 in the years when the PCIP policyis likely to impact the behavior of the providers and 0 otherwise the vector Xit includes providercharacteristics such as age and gender The term Eit represents the net influence of randomunobserved factors affecting EampM services Importantly the estimated coefficient 8 (the coefficient of the interaction term between the treatment group indicator and the postshyPCIP policy period indicator) in equation (1) represents an unbiased estimate of the effect of the Medicare primary care incentive payment on the volume of primary care EampM services The derivation of this estimated effect is presented in Appendix C (C1) A similar methodology can be applied to estimate the effect of the incentive payment on other outcomes of interest
The choice of the control group for the DID model was based on several criteria Ideally we would have included providers with nonshyeligible specialties who also supplied EampM services In order to determine some preferred comparison group providers we
1 Evaluated the frequency of PCIP eligible and nonshyeligible providers by (primary) specialtyavailable in the Provider360 dataset after merging that data set with the list of NPIs of 2011PCIP recipients
2 Examined the volume of claims related to evaluation and management (EampM) servicesby specialty based on 2009 Medicare claims by service and specialty
3 Chose based on the volume of claims and the number of providers 8 PCIP nonshyeligiblespecialties These PCIP nonshyeligible specialties are (1) Psychiatry amp Neurology (2)Obstetrics amp Gynecology (3) Urology (4) Ophthalmology (5) Pathology (6)Psychologist (7) Podiatrist and (8) Optometrist Total number of PCIP eligible claimssubmitted by these providers with PCIP nonshyeligible specialties is presented in AppendixB Exhibit B14
D Main Results
The estimation of DID regression models is based on the number of eligible providers the volume of claims for PCIP eligible EampM services and the allowed chargespayments associated with those claims The volume of EampM claims and payments analyzed here excludes those for hospital inpatient ER drug and laboratory services As we explain above Medicare providers with a PCIPshyeligible specialty (ie family practice internal medicine geriatrics pediatrics NP PA and clinical nurse specialists) that have at least one Medicare claim are included in the ldquotreatmentrdquo group These are the providers who are likely to be affected by the Medicare PCIP policy Given that the announcement of the PCIP program was made in 201040 we assumed that the providers with Medicare PCIP eligible specialties would be potentially responsive to the
40 Source Patient Protection and Affordable Care Act (lsquolsquoPPACArsquorsquo Public Law 111ndash148) For our analysis we report a
single estimate of PCIP impact under each regression model where year 2010 and 2011 are considered as the postshypolicy periods We performed several sensitivity analyses to investigate if the estimated impact is significantly different between 2010 and 2011 we also checked if the results change once we consider 2011 as the only post period Based on such detailed analysis we did not find any systematic evidence that the estimated impact is different between these two years and they are not sensitive to the choice of postshypolicy period
31
Final Report Health Practitioner Bonuses
incentive as early as year 2010 Therefore years 2010 and 2011 represent the postshypolicy period
The DID regression models were estimated using several subshysamples (1) all providers (2) only providers that appear in all 7 years of data (roughly 44 percent of all providers) (3) providers who were near the PCIP eligibility criteria in 2009 (ie restricted to providers who had the share of total Medicare claim payments shyshy allowed chargesshyshy between 50 percent and 65 percent for PCIP eligible EampM services About 15 percent of all providers in the sample met this restriction
In Exhibit 11 we summarize the average volume of PCIP eligible EampM claims and the allowed chargespayments associated with those claims by select patient category and CPT code for providers in the ldquotreatmentrdquo group Comparing the first and last columns we observe that providers near the 60 percent eligibility threshold generate more EampM claims on average compared to the average PCP accepting Medicare (895 vs 590)
Exhibit 11 Number of PCIP Eligible EampM Claims and Mean Allowed Charges per Provider per Year by Types of Claims for Providers with PCIP Eligible Specialty 2005shy2011
All Providers Providers in
All Years
Providers Near
Eligibility
Analysis Sample
Number of Unique Providers with PCIP Eligible Specialty
264141 129587 17081
Annual Average Number of PCIP Eligible EampM Claims per provider
All EampM Claims 590 752 895
New Patient Claims 19 21 25
Established Patient Claims 487 628 813
Other Claims 84 103 57
Claims in 3 Major CPT Codes
Established Patients (15 mins) 243 315 403
Established Patients (25 mins) 177 227 282
Established Patients (40 mins) 20 25 34
Annual Average Allowed Charges for PCIP Eligible EampM Claims per Provider
All EampM Payments $40208 $51016 $60235
New Patient Payments $1941 $2223 $2661
Established Patient Payments $32409 $41764 $53755
Other Payments $5858 $7029 $3819
Payments in 3 Major CPT Codes
Established Patients (15 mins) $13613 $17635 $22712
Established Patients (25 mins) $15217 $19524 $24581
Established Patients (40 mins) $2313 $2976 $4051
Note Summary of PCIP eligibility criteria Primary care physicians (with internal medicine family practice pediatrics and geriatrics specialty) who have at least 60 percent of the practitionerrsquos allowed charges under the Medicare physician fee schedule (excluding hospital inpatient care and emergency department visits) are eligible for primary care services The PCIP eligible primary care services are defined by specific EampM codes Medicare PCIP is also provided to physician assistants nurse practitioners and clinical nurse specialists who meet the similar eligibility criteria For the purpose of our analysis we consider the PCPs (with the PCIP eligible specialty) who have
32
Final Report Health Practitioner Bonuses
50 percentshy65 percent of their services for PCIP eligible EampM services (defined by specific EampM codes) in 2009 are considered to be near the eligibility threshold
For the control group the number of providers the volume of their Medicare claims for EampM services and the associated allowed charges for the providers with the PCIP nonshyeligible specialties are presented in Exhibit 12 As expected providers in the control group generated much fewer EampM claims compared to providers in the treatment group Specifically providers in the control group supplied less than half the volume of EampM services compared to providers in the treatment group (ie 296 vs 590)
Exhibit 12 Number of PCIP Eligible EampM Claims and Mean Allowed Charges per Provider per Year by Types of Claims for Providers with PCIP NonshyEligible Specialty 2005shy2011
All Providers Providers in All Year
Analysis Sample
Number of Unique Providers with PCIP NonshyEligible Specialty
108302 70583
Annual Average Number of PCIP Eligible EampM Claims per Provider
All EampM Claims 296 333
New Patients Claims 35 38
Established Patients Claims 243 276
Other Claims 18 19
Claims in 3 Major CPT Codes
Established Patients (15 mins) 129 146
Established Patients (25 mins) 47 53
Established Patients (40 mins) 5 6
Annual Average Allowed Charges for PCIP Eligible EampM Claims per Provider
All EampM Payments $18618 $20868
New Patients Payments $3421 $3724
Established Patients Payments $14108 $15975
Other Payments $1089 $1169
Payments in 3 Major CPT Codes
Established Patients (15 mins) $7321 $8288
Established Patients (25 mins) $4048 $4578
Established Patients (40 mins) $641 $711
1 Impact of PCIP Policy on Number of Eligible Providers
We examined the changes in the number of providers with a Medicare PCIP eligible specialty in a county who have at least one claim for PCIP eligible services to identify the potential impact of the PCIP policy on these providers Exhibit 13 shows the results from the DID regression models in which we use the number of providers in a county and in a specific year as the outcome variable (Model 1) the number of physicians in each county and year (Model 2) and the number of nonshyphysicians (ie NP PA and CN) The key variable in each model is the interaction between the indicator for PCIP eligible specialty and the indicator for the period after 2009
33
shy
Final Report Health Practitioner Bonuses
In Model 1 the first estimated coefficient suggests that on average the number of Medicare providers with a PCIP eligible specialty and at least one PCIP eligible claim increased by about 28 providers per county in each year after 2009 due to the Medicare PCIP This represents an economically meaningful increase given that on average there were about 15 providers per county per year in a PCIP eligible specialty during the sample period This increase (almost 19 percent) in the number of providers in PCIP eligible specialties may be the primary reason for the estimated reduction in the number of EampM claims per provider due to the PCIP policy
In addition when we restrict the estimation to physicians (Model 2) the increase in the number of physicians with a PCIP eligible specialty attributable to the policy is about 2 per county per year This is almost 10 percent of the average number of primary care physicians in a given PCIP eligible specialty per county per year (average is almost 19) Furthermore the estimated policy impact in Model 3 indicates that the number of PCIP eligible nonshyphysicians increased by over 36 providers per county per year Thus all three models confirm that the introduction of the PCIP policy generated an increase in the number of PCIP eligible providers above and beyond the general increasing time trend Subsequently this increased number of providers may have resulted in the reduction in the average number of EampM claims submitted by these Medicare providers after 200941
Exhibit 13 Impact of Medicare PCIP on the Number of PCPs with Medicare Claims for PCIP Eligible Services (2005shy2011)
Dependent Variable Number of
Providers per county
All Providers
(1)
Physicians Only
(2)
Non Physicians Only
(3)
PCIP Elig Specialty Indicator 4247 3400 2721
(3133) (3647) (2078)
Elig Specialty Ind x Post 2009 2759 1950 3632
(0444) (0674) (0375)
Post 2009 2929 1884 2895
(0455) (0541) (0304)
Median Income ($10k) 1591 2218 1061
(0385) (0468) (0206)
Percent in poverty 0254 0339 0210
(00479) (00587) (00285)
Population (10k) 0536 0607 0317
(00280) (00339) (00128)
Percent Population over 65 shy0307 shy0196 shy0234
(00363) (00452) (00238)
Unemployment Rate shy0518 shy0510 shy0400
41 We have also estimated similar models for the primary care providers who have any Medicare claims (not
necessarily under PCIP eligible services) and the estimated effects of the PCIP policy are slightly larger in those cases These additional results are included in Appendix B Exhibit B 15 In addition we have estimated similar models of providers who met the 60 PCIP eligibility threshold in each year (2005shy2011) As expected the estimated impact of PCIP policy on the number of primary care providers is relatively lower for this restricted set of providers However if we focus on this restricted set of providers then we are likely to lose those providers who may have been induced to provide PCIP eligible services in response to the policy but may not have reached the 60 threshold Similarly we would lose the information on the providers who have reduced the proportion to below 60 The estimated results on this restricted set of providers are presented in Appendix B Exhibit B16
34
-
shy
Final Report Health Practitioner Bonuses
Dependent Variable Number of
Providers per county
All Providers
(1)
Physicians Only
(2)
Non-Physicians Only
(3)
(00461) (00557) (00324)
Intercept shy4970 shy5988 shy3006
(3489) (3996) (2344)
Specialty Fixed Effects Yes Yes Yes
Year Fixed Effects Yes Yes Yes
State Fixed Effects Yes Yes Yes
N 140192 107526 95647
Adj Rshysq 0310 0338 0365
Note Robust standard errors are in parentheses + significance at 10 percent significance at 5 percent Thenumber of observation is based on the number of counties the number of years and the number of providerspecialties in each model (ie physicians include 4 primary care specialties and nonshyphysicians include 3 subshyspecialties)shy
The PCIP policy could impact the number of Medicare providers submitting PCIP eligible claims through several channels First the policy may induce an established PCP to start to treat Medicare patients (new or established patient) under PCIP eligible services that they may not have done before In addition the policy may also encourage new providers fresh out of their completion of residency training to provide PCIP eligible services under Medicare Lastly one can also argue that the PCIP policy may encourage providers with a PCIP nonshyeligible specialty to switch to a PCIPshyeligible specialty and increase their chance to receive the incentive payment This last scenario could be especially relevant for internal medicine subshyspecialties such as cardiology pulmonary disease nephrology and endocrinology which are not PCIPshyeligible although the internal medicine specialty is PCIPshyeligible Without judging whether such specialty switching is a desired outcome under the PCIP policy we first examine to what extent such switching of specialty is prevalent in our dataset and second whether such phenomenon is large enough to influence the impact of the PCIP policy on the number of providers who submit at least one Medicare claim under PCIP eligible services
Based on our 2005shy2011 claims data we have estimated that during the postshyPCIP policy period (2010 and 2011) there are about 30864 new primary care physicians (family practice internal medicine pediatrics and geriatrics) and 27927 new primary care nonshyphysicians who have submitted at least one claim under Medicare (Note that in this accounting we do not attempt to distinguish between ldquonewrdquo providers who were induced by the PCIP to participate and providers that would have entered the Medicare program anyway) Based on our Medicare data we have estimated that 3057 physicians with at least one Medicare claim switched their specialty to a PCIP eligible specialty during the postshypolicy period Over 50 percent (1645) of these specialty switches are switches into internal medicine mainly from internal medicine subshyspecialties The number of specialty switchers is substantially smaller than the number of total new Medicare physicians with a PCIP eligible specialty in the postshypolicy periods Thus switching of specialty could not account for the estimated impact of the PCIP policy on the number of primary care physicians
Based on our claims data we estimate that during the postshyPCIP policy period (2010 and 2011) there are 17662 new primary care physicians (family practice internal medicine pediatrics and geriatrics) who have submitted at least one PCIP eligible claim Additionally we have estimated from published sources that during the post policy period there are about 10000 residency
35
Final Report Health Practitioner Bonuses
positions filled under primary care annually from 2009 to 201142 If the Medicare PCIP policy attracts part of these providers under Medicare to provide PCIP eligible services then such evidence would be consistent with our estimated impact of the PCIP policy in Exhibit 13
Exhibit 14 shows the impact of the PCIP policy on the number of providers accepting new Medicare patients (Model 1) and on the number of new Medicare providers (Model 2) The estimated coefficient on the main variable of interest mdash the interaction between the PCIP eligibility indicator and the postshy2009 indicator mdash suggests that due to the PCIP policy on average the number of PCPs accepting new Medicare patients increased by about 1 provider per county per year for a given PCIP eligible specialty This estimated impact is not negligible given that there are about 9 Medicare PCPs for a given primary care specialty who accept new Medicare patients per county per year during the sample period
Similarly Model (2) in Exhibit 14 shows the impact of the PCIP policy on the number of new Medicare providers who have submitted Medicare claims for PCIP eligible services The estimated coefficient on the main variable of interest suggests that due to the PCIP policy on average the number of new Medicare primary care providers with at least one claim submitted for PCIP eligible services increased by 0148 per county per year for a given PCIP eligible specialty Given that on average there are about 14 new Medicare primary care providers per county per year in a PCIP eligible specialty with at least one PCIP eligible claim during the sample period the estimated impact is again not negligible
Exhibit 14 Impact of Medicare PCIP on the Number of Providers Accepting New Medicare Patients and the Number of New Primary Care Providers under Medicare with Claims for
PCIP Eligible Services (2005shy2011)
Number of Providers Accepting
New Medicare Patients (1)
Number of New
Medicare Providers (2)
PCIP Elig Specialty Indicator 2819 4367
(1959) (0297)
Elig Specialty Ind x Post 2009 0883 0148
(0345) (00440)
Post 2009 1605 0293
(0369) (00460)
Median Income ($10k) 1455 00508
(0295) (00445)
Percent in poverty 0143 00160
(00366) (000545)
Population (10k) 0351 00482
(00204) (000328)
Percent Population over 65 shy0177 shy00443
(00295) (000436)
Unemployment Rate shy0314 shy00512
(00374) (000544)
Intercept shy3432 shy3926
42 Estimates include the following primary care specialties family practice internal medicine (including pediatrics)
pediatrics Source National Resident Matching Program Results and Data 2011 Main Residency Match National Resident Matching Program Washington DC 2011
36
Final Report Health Practitioner Bonuses
Number of Providers Accepting
New Medicare Patients (1)
Number of New
Medicare Providers (2)
(2461) (0330)
Specialty Fixed Effects Yes Yes
Year Fixed Effects Yes Yes
State Fixed Effects Yes Yes
N
Adj Rshysq
140192
0250
121084
0255
Note Robust standard errors are in parentheses + significance at 10 percent significance at 5 percent
2 Impact of PCIP Policy on Number of Claims for EampM Services
The DID estimates from the model using the volume of EampM claims as the outcome variable are presented in Exhibit 15 The estimated coefficient of that interaction term in the first column of Exhibit 15 (ie column (1)) indicates that in response to the Medicare PCIP policy PCPs with PCIP eligible specialties reduced their number of PCIP eligible EampM claims by about 52 on average 43 This represents a reduction in the volume of claims per provider of a little less than 9 percent Furthermore we estimate that on average providers with PCIP eligible specialties had about 187 more EampM claims submitted under Medicare during the sample period than the providers with PCIP nonshyeligible specialties Also for the providers with both PCIP eligible and nonshyeligible specialties the average number of EampM claims submitted went down by 70 claims after 2009
In addition we find that as the number of primary care providers per 10000 population increases the number of claims per provider decreases Finally the volume of claims per provider increases with the providerrsquos age and with the increase in the size of the Medicare population The effect of unemployment on the number of EampM claims per provider is also positive and statistically significant
When the sample is restricted to providers who were near the PCIP eligibility threshold in 2009 (column (3)) the estimated reduction in the number of claims per provider due to the PCIP policy is smaller only about 33 claims44 The reduction in the number of claims per provider in response to the PCIP policy may appear counterintuitive However the total number and value of claims may still increase as a result of the policy as long the number of providers with a PCIP
43 The postshypost policy period in our analysis comprises of two years 2010 and 2011 We have also estimated the
impact of the PCIP policy on the volume of claims and other outcomes discussed later for each postshypolicy year separately and the effects in these two years are not statistically different for a given outcome of interest
44 We focus on the primary care providers who are near the PCIP eligibility threshold because these providers are at
the margin to improve the volume of their PCIP eligible services by incurring a relatively low cost and gain the PCIP incentive payment (ie marginal benefit is much higher relative to the marginal cost) Therefore we would expect the impact of PCIP policy (if there is any) would be more substantial among the providers near the eligibility threshold However if we only focus on those who met the 60 criteria then we would lose the behavioral changes among the providers who are below the threshold may have tried to reach the 60 threshold in response to PCIP This may bias the PCIP impact By focusing only on those providers who met the 60 eligibility criteria we would face the typical problem of selection bias Hence focusing on those providers who are near the eligibility threshold circumvents this problem but captures the essence of the hypothesis that we are referring to In addition we have estimated several models with different ranges (50shy65 50shy70 55shy65 and 40shy80) of the proportion of allowed charges on PCIP eligible primary care services and tested the sensitivity of our results At least for the first three ranges mentioned we find that results are not sensitive to those three ranges However once we broaden the analysis to 40shy80 the estimated impact is in between the effects we observed for all providers and the providers in 50shy65 threshold (as expected) Also the mean value of this proportion in the sample is about 53
37
Final Report Health Practitioner Bonuses
eligible specialty increases at a higher rate than the decline in the number of claims submitted per provider Thus a reduction in the number of claims per provider should not be interpreted as evidence of decreased access to primary care services if the number of providers is increasing at the same time
Exhibit 15 Impact of Medicare PCIP Policy on PCIP Eligible EampM Claims (2005shy2011)
Dependent Variable PCIP Eligible
EampM Claims per Provider
Analysis Sample
(1) EampM
Claims
(2) EampM Claims
(Providers in All Years)
(3) EampM Claims
(Near Eligib 09)
PCIP Elig Specialty Indicator 1869 1166 1176
(1293) (1838) (1246)
Elig Specialty Ind x Post 2009 shy5173 shy3696 shy3259
(1814) (2412) (5762)
Post 2009 shy7442 shy7727 shy3728
(2692) (3423) (3155)
Age 8450 6980 2241
(00450) (00637) (00547)
Male 1657 1989 9039
(0965) (1243) (1162)
Urban shy3978 shy5101 shy4900
(1712) (2153) (2190)
Median Income ($10k) shy7296 shy5815 00475
(0886) (1137) (1057)
Percent in poverty shy4678 shy4105 1523
(0222) (0283) (0272)
Population (10k) shy0107 shy0134 shy00710
(000441) (000576) (000531)
Percent Population over 65 1784 2072 1844
(0256) (0319) (0322)
Unemployment Rate 1307 1766 6838
(0425) (0560) (0522)
Primary Care Phypop10k shy0156 shy0172 shy0258
(000716) (00102) (00146)
PC Nonshyphypop10k shy0452 shy0627 shy0208
(00154) (00234) (00228)
Intercept shy34610 shy30330 shy11460
(1669) (2263) (1734)
Specialty Fixed Effects Yes Yes Yes
Year Fixed Effects Yes Yes Yes
State Fixed Effects Yes Yes Yes
N 2014835 1397760 746845
Adj Rshysq 0222 0241 0380
Note Robust standard errors are in parentheses + significance at 10 percent significance at 5 percent
38
Final Report Health Practitioner Bonuses
3 Impact of PCIP Policy on Allowed Charges for EampM Services
The estimated effect of the PCIP policy on the allowed charges associated with the EampM claims is in general positive and statistically significant (Exhibit 16) While we estimate no significant policy impact on charges for our full sample of providers (Model 1) we do find a significant policy effect when we restrict the sample to those providers most likely to change their behavior in response to the PCIP ie the providers that were near eligibility More specifically for the sample of providers who were near the PCIP eligibility threshold in 2009 (ie Model 3) the estimated coefficient of the interaction term in the last column of Exhibit 16 shows that in response to the Medicare PCIP policy on average the allowed charges of primary care providers with a PCIP eligible specialty increased by about $5611 The estimated effect represents about 93 percent of the mean allowed charges ($60235) per provider per year for the providers with PCIP eligible specialties who were near the eligibility threshold in 2009 This estimated effect on the allowed charges in response to a 10 percent Medicare PCIP program suggests an implied elasticity of the allowed charges per provider per year with respect to the payment is about 1 (ie 9310) The effect is smaller if we restrict the sample to all the providers who submitted EampM claims under Medicare in all seven years The mean allowed charges per provider per year for these providers were $51016 Thus due to the Medicare PCIP policy they experienced an additional 56 percent increase ($2839$51016) in allowed charges One caveat surrounding these results is that since the actual Medicare payment may be smaller in magnitude compared to the allowed charges the increase in actual Medicare payments may be lower than our estimated increases in allowed charges
Exhibit 16 Impact of Medicare PCIP Policy on Allowed Charges for PCIP Eligible EampM Claims (2005shy2011)
Dependent Variable Allowed
Charges for PCIP Eligible EampM
Claims per Provider (EampM
Payments)
Analysis Sample
(1)
EampM Charges
(2)
EampM Charges
(Providers in All Years)
(3)
EampM Charges
(Near Eligib 09)
PCIP Elig Specialty Indicator 74741 11382 7518
(10776) (15832) (10475)
Elig Specialty Ind x Post 2009 5944 28393 56109
(1328) (1769) (4206)
Post 2009 8285 12090 24180
(1835) (2327) (2120)
Age 5501 4099 1234
(3093) (4324) (3721)
Male 110676 131571 61031
(6897) (8780) (8071)
Urban shy10435 shy15097 shy19719
(1116) (1389) (1394)
Median Income ($10k) 8678 12737 9787
(6178) (7872) (7147)
Percent in poverty shy2473 shy1804 1343
(1470) (1862) (1750)
Population (10k) shy2646 shy3481 shy0464
(0322) (0416) (0384)
39
Final Report Health Practitioner Bonuses
Dependent Variable Allowed
Charges for PCIP Eligible EampM
Claims per Provider (EampM
Payments)
Analysis Sample
(1)
EampM Charges
(2)
EampM Charges
(Providers in All Years)
(3)
EampM Charges
(Near Eligib 09)
Percent Population over 65 12427 14194 12150
(1764) (2177) (2170)
Unemployment Rate 12175 15928 7567
(2998) (3869) (3632)
Primary Care Phypop10k shy7423 shy7227 shy1433
(0503) (0703) (0952)
PC Nonshyphypop10k shy3412 shy4836 shy1718
(1082) (1629) (1540)
Intercept shy371778 shy337862 shy158347
(12927) (18147) (13208)
Specialty Fixed Effects Yes Yes Yes
Year Fixed Effects Yes Yes Yes
State Fixed Effects Yes Yes Yes
N 2014835 1397760 746845
Adj Rshysq 0222 0246 0367
Note Robust standard errors are in parentheses + significance at 10 percent significance at 5 percent
So far we have found that the PCIP program resulted in increased allowed charges for EampM services per provider despite some decline in the corresponding number of EampM claims We have already discussed that one potential reason for the decline in the average volume of claims could be due the increase in the number of providers under PCIP eligible specialties that can be specifically attributed to the PCIP policy However the question still remains regarding a shift in the composition of services that may have resulted in increased allowed charges or payments despite the decline in the number of claims per provider
In order to gain a deeper understanding of this issue we estimate the impact of the Medicare PCIP policy on each key component of EampM services (Exhibit 17) More specifically we examine the impact of the policy on the volume of claims associated with services for new patients established patients and EampM claims for all other services EampM claims associated with services for established patients account for more than 80 percent of all the EampM claims (and allowed charges) submitted by providers with PCIP eligible specialties45 Furthermore 15 and 25 minute visits account for 40 percent and 30 percent of all EampM claims for established patients respectively Moreover the 25 minute visits account for a slightly higher share of allowed charges ie 38 percent relative to 34 percent for 15 minute visits
In Exhibit 17 we present the estimated impact of the PCIP on the average number of EampM claims per provider for three relevant samples of providers We find that the introduction of the Medicare PCIP policy reduced the average number of EampM claims submitted for both new and established patients The estimated impact suggests that on average the number of EampM claims per provider for 15 minute visits declined by an additional 46 among PCIPshyeligible providers compared to nonshyeligible providers Similarly results using the sample of all providers
45 For the providers near the PCIP eligibility threshold this share of EampM claims is almost 90 percent
40
lsquo
Final Report Health Practitioner Bonuses
suggest that EampM claims per provider for 25 minute visits increased by an additional 13 among PCIPshyeligible providers compared to nonshyeligible providers When we restrict the sample to providers near the PCIP eligibility threshold in 2009 the decline for EampM claims for 15 minutes visits due to PCIP policy is about 57 claims while the EampM claims associated with 25 minute visits increased by about 42 claims due to the PCIP policy
Exhibit 17 Estimated Impact of Medicare PCIP Policy on the Number of PCIP Eligible EampM Claims (2005shy2011)
Estimated coefficient of variable Elig Specialty Ind x Post 2009 from each DID Model
Dependent Variable Analysis Sample
All Providers in All Years Providers Near Eligibility lsquo09
All EampM Claims shy5173 shy3696 shy3259
New Patient Claims shy1354 shy1591 shy1172
Established Patient Claims shy3525 shy2091 shy2224
Other Claims shy2941 shy0150 1369
Claims by Duration (Minutes)
New Patient Visits
10 00673 00850 00551
20 0160 00269 0209+
30 shy5102 shy5894 shy4607
45 shy7697 shy8930 shy6854
60 shy0966 shy1194 shy0528
Established Patient Visits
5 shy3926 shy3621 shy6227
10 1611 1702 shy2487
15 shy4554 shy4716 shy5649
25 1257 2679 4155
40 00347 1382 1417
Note Robust standard errors are in parentheses + significance at 10 percent significance at 5 percent
The above findings raise the question of whether the policyshyinduced net decrease in the number of EampM claims will be reflected in the corresponding allowed charges To answer this question we estimated the potential impact of the PCIP policy on the allowed charges associated with the each component of the EampM claims (Exhibit 18)
The estimated impact of the PCIP policy on allowed charges associated with 15 minute visits for established patients suggests that on average the policy additionally reduced the total allowed charges by about $1577 per provider per year after 2009 However the estimated policy induced reduction in allowed charges is smaller for providers near the PCIP eligibility threshold ie a reduction of about $602
Moreover the PCIP policy additionally increased the total annual allowed charges by about $2740 per provider after 2009 for 25 minute visits for established patients This is a substantial increase considering that providers with PCIP eligible specialties had about $15217 in allowed charges per year for 25 minute visits for established patients The impact is even larger once the sample is restricted to providers near the PCIP eligibility threshold increase in
41
lsquo
Final Report Health Practitioner Bonuses
total annual allowed charges by about $6807 a 28 percent increase Similarly allowed charges associated with all EampM services for all established patients increased substantially by about $6544 or 12 percent for providers near the PCIP eligibility threshold In the case of all providers the estimated increase in total annual allowed charges for established patients was $1245 per provider We find that the PCIP policy resulted in increased Medicare allowed charges across all providers with PCIP eligible specialties This increase in allowed charges is likely to have also resulted in increased payments for these primary care EampM services
Exhibit 18 Estimated Impact of Medicare PCIP on the Allowed Charges for PCIP Eligible EampM Claims (2005shy2011)
Estimated coefficient of the variable Elig Specialty Ind x Post 2009 from each DID Model
Dependent Variable Analysis Sample
All Providers in All Years Providers Near Eligibility lsquo09
All EampM Payments 5944 28393 56109
New Patient Payments shy19109 shy22065 shy16024
Established Patient Payments 12446 39059 65439
Other Payments 7258 11400 6694
Payments by Duration (Minutes)
New Patient Payments
10 0951 1407+ 0706
20 shy1710 shy2891 shy1237+
30 shy5445 shy6203 shy4922
45 shy11845 shy13594 shy10331
60 shy1658 shy1993 shy6551
Established Patient Payments
5 shy7515 shy7066 shy1223
10 shy3412 shy3594+ shy1183
15 shy15772 shy10952 shy6017
25 27404 46709 68070
40 1906 4367 5792
Note Robust standard errors are in parentheses + significance at 10 percent significance at 5 percent
42
Final Report Health Practitioner Bonuses
Analyzing the Impact of Financial Incentives for Primary Care Providers in Shortage Areas
A Background
Access to health care in underserved areas has been an ongoing source of concern among policy makers A 2013 CRS report for the congress (Physician Supply and the ACA by EJ Heisler) indicates that the expansion of health insurance coverage under the ACA is likely to stimulate the demand for primary care in general and also in the underserved areas HRSA designates certain underserved areas as primary care Health Profession Shortage Areas (HPSAs) These areas meet a defined threshold of physicians to population ratio46 HPSA designations are currently limited to primary medical care HPSAs dental HPSAs and mental health HPSAs In this section we focus on only primary care HPSAs All nonshyfederal Doctors of Medicine (MD) and Doctors of Osteopathy (DO) providing direct patient care and who practice principally in one of the four primary care specialties shy general or family practice general internal medicine pediatrics and obstetricsgynecology shy will be counted under the definition of primary care HPSA As previously noted since 1987 Medicare has been paying bonus payments initially five percent to physicians providing care in rural geographic HPSAs In 1991 the bonus payment was increased to 10 percent and eligibility extended to services provided by physicians in urban geographic HPSAs Thus this particular form of bonus payment has been in place for almost 25 years Although the HPSA bonus is available to nonshyprimary care providers such as dentists and mental health care providers for the purpose of this study we focus only on primary care providers eligible for primary care HPSA bonus
Section 413a of the Medicare Modernization Act put in place an additional 5 percent bonus payment for physicians practicing in Physician Scarcity Areas (PSAs)47 PSAs were those counties and rural zip codes in MSAs with the lowest physician to population ratios These areas often coincided with geographic HPSAs so that physicians practicing in those areas received a 15 percent additional bonus payment during 2005shy2008 when the PSA bonuses were in effect
Some key points to note regarding the PSA bonus are the following
Medicare paid the 5 percent PSA bonus on a quarterly basis and the bonus was based on what Medicare actually paid not the Medicareshyapproved payment amount
The same service could be eligible for the PSA bonus and the HPSA bonus
The payment was based on where the service is performed not on the address of the beneficiary
46 Health Professionals Shortage Areas (HPSAs) are based upon criteria set forth under Section 332 of the Public
Health Service Act HPSAs are defined to include 1) urban and rural geographic areas 2) population groups and 3) facilities with shortages of health professionals HPSA designations are currently limited to primary medicalcare HPSAs dental HPSAs and mental health HPSAs in the past similar designations identified shortages in a wide variety of health professions including podiatry pharmacy and veterinary medicine (Salinsky 2010) For primary care HPSAs one of the following two conditions must prevail within the area a) a ratio of population to fullshytimeshyequivalent primary care physician of at least 35001 or b) a ratio of population to fullshytimeshyequivalent primary care physician of less than 35001 but greater than 30001 and an unusually high need for primary care services or insufficient capacity of existing primary care providers
47 The expiration of the PSA bonus in 2008 was likely a result of Medicare expenditures being capped by law In
House Bill HR 6331 of 2008 the cut was equivalent to 106 percent In order to avoid the 106 percent loss PSA designations were allowed to expire which automatically led to the expiration of the PSA bonus Source httpwwwgrahamshycenterorgonlineetcmedialibgrahamdocumentsmedicareshypaymentmaPar0001Filetmpmapdf
43
Final Report Health Practitioner Bonuses
The PSA bonus was paid on services rendered on or after January 1 2005 through June 30 2008
Only the physician designations of General Practice Family Practice Internal Medicine and ObstetricsGynecology were paid the bonus for the ZIP code areas designated as primary care PSAs All other physician provider specialties were eligible for the specialty PSA area bonus for the ZIP codes areas designated as specialty PSAs48 Once again for the purpose of this study we focus only on the primary care physicians with PSA bonus eligible specialties
Our main claimsshylevel data includes a variable that indicates the location of each provider Additionally CMS provides the list of HPSA and PSA areas In this section we review the PSA geographic areas and the extent of overlap with HPSAs Physicians practicing in these overlap areas received a 15 percent additional bonus payment during 2005shy2008 when the PSA bonuses were in effect
In the exhibits below we present the distribution of primary care providers across HPSA and PSA areas Due to limited data we do not present provider counts for HPSA areas prior to 2007 while the PSA bonus was no longer in place after 2008 Moreover we do not use data from 2011 for the DID analysis as it will include the confounding effect of Medicare PCIP49
Although the PSA bonus does not apply to nonshyphysicians we report the number of nonshyphysicians in PSA areas (in italics) for comparison purposes
We consider only those counties that have a full rather than partial primary care HPSA designation In 2011 we identified 1279 full HPSA counties covering 40 percent of the total US population Exhibits 19 amp 20 show the distribution of PCPs and 2011 PCIP recipients across HPSA and PSA areas over the 2005shy2011 period
48 Dentist Podiatrists Optometrists and Chiropractors were not eligible for PSA bonus Source
httpwwwcmsgovMedicareMedicareshyFeeshyforshyServiceshyPaymentHPSAPSAPhysicianBonusesPSAhtml For zip codes that are not in CMS PSA zip code list the bonus payment cannot be made automatically In these cases physicians have to check whether the county where service is provided is included in CMS PSA county list If the county is included in the PSA county list then physicians need to include ldquoARrdquo modifier in their claims to collect PSA bonus
49 If a region switched its HPSA status in 2011 which is also the first year Medicare PCIP was available
econometrically it would be difficult to disentangle the effects of these two changes The indicator variables showing change in HPSA status and availability of PCIP would be perfectly collinear
44
Final Report Health Practitioner Bonuses
Exhibit 19 Distribution of Primary Care (PC) Providers by HPSA and PSA Regions
2005 2006 2007 2008 2009 2010 2011
PC Physicians Total Total Total Total Total Total Total
All Providers 13835 6
100 14777 1
100 16515 0
100 17301 8
100 17878 4
100 18507 0
100 19193 0
100
in HPSA x x x x 72804 441 77656 449 79620 445 82101 444 81855 426
in PSA 14446 104 15336 104 17026 103 17323 10 NA NA NA NA NA NA
Both in HPSA amp PSA x x x x 6267 38 6461 37 NA NA NA NA NA NA
PCIP 2011 Recipients 93886 100 99359 100 10896 6
100 11505 0
100 12114 0
100 11749 0
100 11400 2
100
in HPSA x x x x 46578 427 50451 439 52871 436 50762 432 47458 416
in PSA 9771 104 10282 103 11290 104 11605 101 NA NA NA NA NA NA
Both in PSA amp HPSA x x x x 3927 36 4143 36 NA NA NA NA NA NA
PC NonshyPhysicians
All Providers 46634 100 53823 100 68297 100 80041 100 88569 100 97789 100 10935 3
100
in HPSA x x x x 28248 414 33148 414 36700 414 40411 413 43902 401
in PSA 5221 112 5894 11 7379 108 8301 104 NA NA NA NA NA NA
Both in HPSA amp PSA x x x x 2919 43 3270 41 NA NA NA NA NA NA
PCIP 2011 Recipients 18681 100 21456 100 27188 100 34363 100 41202 100 37756 100 35380 100
in HPSA x x x x 11310 416 14279 416 17150 416 15614 414 14256 403
in PSA 2328 125 2603 121 3214 118 3802 111 NA NA NA NA NA NA
Both in PSA amp HPSA x x x x 1273 47 1527 44 NA NA NA NA NA NA
Note HPSA includes only full HPSA areas (data from Area Resource File and HPSA status data are not available prior to 2007) PSA status after 2008 is not applicable as 2008 was the final year of the PSA bonus
45
Final Report Health Practitioner Bonuses
Around 40 percent of all primary care providers supplied services in primary care HPSA counties while roughly 10 percent did so in PSA counties The extent of overlap between these two designations amounts to approximately 3 to 4 percent of providers working in dualshydesignation areas We do not observe important differences in these distributions between all providers and PCIP recipients The same general observations apply to the two most represented specialties ie family practice and internal medicine (Exhibit 20)
Exhibit 20 Distribution of the Number of Internal Medicine and Family Practice Physicians by HPSA and PSA regions
Practice Area 2005 2006 2007 2008 2009 2010 2011
Internal Medicine
All Physicians 69391 74411 83117 87090 90291 93904 97526
in HPSA x x 38011 40382 41411 43461 43188
in PSA 5428 5770 6390 6521 NA NA NA
in HPSA amp PSA x x 2304 2372 NA NA NA
PCIP 2011 Recipients 43188 45502 49451 51813 54062 52576 51007
in HPSA x x 22166 23824 24682 24113 22537
in PSA 3423 3585 3915 4009 NA NA NA
in PSA amp HPSA x x 1303 1386 NA NA NA
Family Practice
All Physicians 61438 65205 72247 75132 77536 79891 82298
in HPSA x x 29652 31700 32602 32954 32834
in PSA 8673 9168 10181 10361 NA NA NA
in HPSA amp PSA x x 3776 3921 NA NA NA
PCIP 2011 Recipients 48448 51377 56622 59902 63227 61584 59931
in HPSA x x 22979 24971 26284 24998 23450
in PSA 6220 6546 7199 7417 NA NA NA
in PSA amp HPSA x x 2561 2695 NA NA NA
Note HPSA includes only full primary care HPSA areas (data from Area Resource File and HPSA status data are not available prior to 2007) PSA status after 2008 is not applicable as 2008 was the final year of the PSA bonus
In the case of nonshyphysicians in 2008 around 40 percent were practicing in primary care HPSA areas (Exhibit B8 in Appendix B) Nurse practitioners and physician assistants alike were distributed almost equally between shortage and nonshyshortage areas in 2008 The same is true whether we look across all providers or only 2011 PCIP recipients
B Impact of the PSA Bonus on Primary Care Supply
Since the PSA bonus was in effect from 2005 to 2008 we applied a DID estimation method to identify the effect of elimination of PSA bonus on the following outcome variables number of eligible providers practitionersrsquo volume of services and their total payments We used the provider level data on the number of EampM claims and allowed charges associated with those claims from 2005 to 2011 The data from 2005 to June 2008 show the scenarios in the preshyelimination (of PSA bonus) period and the data from 2009 to 2010 provide outlook on the postshyelimination period Data from 2011 will not be used for the DID analysis as it will include the confounding effect of the Medicare PCIP bonus The sample is restricted to physicians with the
46
τ
Final Report Health Practitioner Bonuses
following PSA bonus eligible primary care specialties family practice internal medicine and OBshyGYN
Equation (1) below shows the econometric model we estimated to assess the impact of PSA bonus policy
lowast = + lowast + + lowast lowast + lowast + + (1)
The model in equation (I) is specified based on the provider level data in each year Here the dependent variable Sit is the volume of primary care (EampM) services provided by primary or nonshyprimary care practitioner i at time t Ti is an indicator for the treatment group that takes a value of 1 if the provider is in a primary care PSA area and zero otherwise PREt is an indicator variable taking the value of 1 if the services are provided during 2005shy2008 period (when PSA bonus program was in effect) and zero otherwise the vector Xit includes variables reflecting the provider characteristics features of their geographic locations etc and is a timeshyspecific fixed effect term The term εit represents random unobserved factors affecting services
If elimination of the PSA bonus was associated with a reduction in the volume of primary care EampM services provided by practitioners in those areas then we should expect the estimated value of 8 to be positive A positive estimated value of 8 would imply higher volume of services during the period when the PSA bonus was in effect In addition the interpretation of the first four terms in equation (I) is as follows
(α + β + θ + δ) = the average number of EampM claims during the PSA period (PRE) for providers located in the PSA regions
(α + β) = the average number of EampM claims during the PostshyPSA period for providers located in the PSA regions
(θ + δ) = the difference in the average number of EampM claims between the PSA and PostshyPSA period for providers located in the PSA regions
θ = the difference in the average number of EampM claims between the PSA and PostshyPSA period for providers regardless of location
Exhibit 21 shows the results from the estimated DID model to identify the impact of the PSA bonus policy on the supply of primary care services We found that on average providers with PSA bonus eligible specialties irrespective of location were estimated to have about 153 more claims submitted during the PSA period compared to the postshyPSA period However bonusshyeligible providers located in PSA areas had on average an additional 50 claims per year compared to those located in nonshyPSA areas We attribute this additional increase in the volume of primary care EampM services to the PSA bonus policy On the other hand we do not find a statistically significant impact of the PSA bonus policy on the total annual allowed charges per physician (column 2)
47
Final Report Health Practitioner Bonuses
Exhibit 21 Impact of PSA Bonus on the Number of EampM Claims under Medicare 2005shy2010
Number of EampM Claims(1) Allowed Charges for
EampM Claims ($)(2)
Location PSA PC Indicator (PSAPC) 7055 56220
(6177) (4154)
PSA Year Indicator (2005shy2008) 1526 8709
(4405) (2964)
PSAPC PSA Year Ind 4984 shy2412
(7276) (4765)
Age 1376 8845
(00757) (5104)
Male 2069 134952
(1453) (1026)
Urban shy3192 shy4230
(2892) (1849)
Median Income ($10k) shy1047 9267
(1430) (9766)
Percent under poverty shy6671 shy3527
(0359) (2332)
shy0144 shy4476
(000680) (0483)
Percent Population over 65 1936 13894
(0424) (2815)
Unemployment Rate 1574 13370
(0720) (4964)
Primary Care Phymcarepop10k shy0110 shy2049
(00139) (0939)
PC Nonshyphymcarepop10k shy0977 shy7510
(00390) (2675)
Intercept shy6872 shy560014
(1898) (12556)
Specialty Fixed Effects Yes Yes
Year Fixed Effects Yes Yes
State Fixed Effects Yes Yes
N 1006453 1006453
Adj Rshysq 0182 0175
Note Robust standard errors are in parentheses + significance at 10 percent significance at 5 percent The sample is restricted to only providers with the following PSA eligible specialty family practice internal medicine and OBshyGYN
Exhibit 22 shows the results from the estimated DID model to identify the impact of the PSA bonus policy on the number of primary care providers at the zip code level As explained above our primary focus is the estimated coefficient of the interaction term between the PSA status indicator of the location of physicians and the PSA period (ie 2005shy2008) The number
48
Population (10k)
Final Report Health Practitioner Bonuses
of providers with PSA bonus eligible specialties is estimated to increase by about one in PSA areas during the PSA period compared to the number of providers in nonshyPSA areas This represents a meaningful increase given that on average there are about six primary care providers in PSA areas We attribute this additional increase in the number of primary care providers to the PSA bonus policy
Exhibit 22 Impact of PSA Bonus on the Number of Primary Care Providers per County (2005shy2010)
Number of Providers with PSA
Bonus Eligible Specialty
Location PSA PC Indicator (PSAPC) shy4951
(0371)
PSA Year Indicator (2005shy2008) shy1722
(0439)
PSAPC PSA Year Ind 1149
(0301)
Urban 5950
(0221)
Median Income ($10k) 0468
(0150)
Percent in poverty 0256
(0040)
Population (10k) 0007
(0001)
Percent Population over 65 0139
(0033)
Unemployment Rate shy0037
(0057)
Primary Care Phymcarepop10k 0146
(0024)
PC Nonshyphymcarepop10k 0037
(0017)
Intercept shy5250
(1522)
Year Fixed Effects Yes
State Fixed Effects Yes
N 78519
Rshysq 00856
Note Robust standard errors are in parentheses + significance at 10 percent significance at 5 percent The sample is restricted to only providers with the following PSA eligible specialty family practice internal medicine and OBshyGYN
C Impact of the HPSA Bonus on Primary Care Supply
Access to health care in shortage areas has been an ongoing source of concern among policy makers Expansion of health insurance coverage through the implementation of the ACA is
49
Final Report Health Practitioner Bonuses
likely to stimulate the demand for primary care in general and specifically in these shortage areas HRSA designates these shortage areas as primary care Health Profession Shortage Areas (HPSAs) using a defined threshold of primary care physicians to population ratio The HPSA bonus has been in place since 1987 and since 1991 the bonus payment remained at 10 percent of the fees associated with the bonus eligible Medicare claims50
In the absence of any variation in the HPSA bonus percentage in the recent past we rely on the change in the primary care HPSA status of different counties in the US over the period between 2007 and 2010 In other words we rely on the variation in HPSA status over time and across counties to identify the effect of the policy We detail the econometric model and exact interpretation of estimated coefficients in Appendix C2 Our analysis of the Area Resource File indicates that 205 US counties gained primary care HPSA status during 2007shy2011 while 257 counties lost their HPSA status51 Subsequently we analyze the changes in the outcomes of interest among primary care providers over time due to changes in the countyrsquos HPSA status during this period It is important to note that although HPSA bonus applies to physicians generally in this section we only focus on primary care physicians with primary care HPSA bonus eligible specialties described earlier The primary outcome variables that we analyzed to identify the changes in physiciansrsquo practice behavior are the volume of primary care services and total Medicare allowed charges associated with those services as captured in Medicare claims data In this framework we have assumed that the HPSA status of an area is exogenous to an individual providerrsquos decision to serve a certain number of patients or provide a given volume of services or any other individualshylevel outcomes However the HPSA status of an area may not be exogenous in models where the outcome of interest is the number of providers relative to the size of population in a given geographic area at the aggregate level This is specifically due to the fact that the HPSA status is designated based on the physicianshy toshypopulation ratio in the area as a whole
The coefficient of the interaction term between the county primary care HPSA status indicator (HPSAPC) and the indicator of whether the county ever gained the HPSA status shows the additional impact of HPSA status on the average number of claims per physician in column 1 (or payments in column 2) in the counties that ever gained the HPSA status (full model specification detailed in Appendix C2) As shown in Exhibit 23 we found that on average Medicare physicians with primary care specialties who are located in counties that ever gained the HPSA status tend to have about 17 more EampM claims submitted annually specifically due to the gain of full HPSA status The effect is statistically significant at 10 percent significance level On the other hand the loss of HPSA status does not seem to have any statistically significant impact on the number of EampM claims
50 Physicians who furnish services to Medicare beneficiaries in areas designated as primary care geographic HPSAs by HRSA as of December 31 of the prior year are eligible for the Medicare HPSA bonus during the current year Since 2005 the HPSA physician bonus payment has been automatically made to physicians who furnish services to Medicare beneficiaries in a ZIP code on the list of ZIP codes eligible for automatic HPSA bonus payment This list is updated annually and is effective for services furnished on and after January 1 of each calendar year Physicians who furnish services to Medicare beneficiaries in a geographic HPSA that is not on the list of ZIP codes eligible for automatic payment must use the AQ modifier ldquoPhysician providing a service in an unlisted Health Professional Shortage Area (HPSA)rdquo on the claim to receive the bonus payment Services that are submitted with the AQ modifier are subject to validation by Medicare The bonus is paid quarterly and is based on the amount paid for professional services
51 Area Resource File (ARF) or Area Health Resource File is an extensive county level database assembled annually
by Health Resources and Services Administration (HRSA) from over 50 sources Source httparfhrsagov
50
Final Report Health Practitioner Bonuses
Exhibit 23 Impact of HPSA Bonus on the Number of EampM Claims and Allowed Charges per Physician under Medicare 2007shy2010
Number of EampM Claims
per Physician(1)
Allowed Charges for
EampM Claims per
Physician ($)(2)
County HPSA PC Indicator (HPSAPC) shy4386 shy30245
(2500) (1721)
Ever Gained HPSA Status Indicator (ToHPSA) shy3991 shy25934
(6900) (4593)
Ever Lost HPSA Status Indicator (ToNonHPSA) shy6122 shy51496
(6772) (4673)
HPSAPCToHPSA 1741+ 4070
(9500) (6491)
HPSAPCToNonHPSA 1137 13804
(8005) (5506)
Age 1268 8544
(00845) (5927)
Male 1927 131368
(1645) (1208)
Urban shy4187 shy6167
(3324) (2220)
Median Income ($10k) shy6798 10347
(1636) (1162)
Percent under poverty shy5469 shy3003
(0416) (2838)
Population (10k) shy0116 shy3253
(000808) (0591)
Percent Population over 65 2129 15447
(0481) (3361)
Unemployment Rate 2043 16501
(0803) (5655)
Primary Care Phymcarepop10k shy000218 4187
(00126) (0881)
PC Nonshyphymcarepop10k shy0951 shy6878
(00362) (2535)
Intercept shy5943 shy578914
(2007) (13846)
Specialty Fixed Effects Yes Yes
Year Fixed Effects Yes Yes
State Fixed Effects Yes Yes
N 743907 743907
Adj Rshysq 0188 0184
Note Robust standard errors are in parentheses + significance at 10 percent significance at 5 percent The sample is restricted to only providers with HPSA eligible specialty family practice internal medicine pediatrics and OBshyGYN
51
Final Report Health Practitioner Bonuses
Next we focus on the impact of primary care HPSA status on the Medicare allowed charges per physicians associated with EampM claims (Exhibit 23 column 2) Column 2 indicates that Medicare primary care physicians who are located in counties that ever gained HPSA status do not experience significant changes in annual allowed charges per physician for EampM claims specifically due to the gain of full HPSA status However Medicare physicians with primary care who are located in counties that ever lost HPSA status tend to have about $1380 more allowed charges annually when the location has the full HPSA status This effect is statistically significant at 5 percent significance level
For our analysis of the impact of HPSA status on the volume of services in terms of EampM claims we focused only on the behavior of primary care physicians We found that on average Medicare primary care physicians tend to submit about 17 more EampM claims annually specifically due to the gain of full HPSA status This may suggest that HPSA bonus may encourage primary care providers to increase access to primary care services In addition based on our analysis of allowed charges for EampM Services we find that the Medicare primary care physicians who are located in counties that ever lost primary care HPSA status tend to have about $1380 more allowed charges annually before the location lost full HPSA status Thus gaining HPSA status is also associated with gain in additional earnings for primary care physicians Hence our analysis finds supportive evidence that HPSA bonus may improve access to primary care services in shortage areas
Finally when the outcome of interest is the PCP to population ratio at the county level relying on the change in primary care HPSA status as the primary source of variation to identify an effect of HPSA status poses additional estimation challenges The phenomena that cause decision makers to change the status may be highly correlated with our outcome of interest In this sense the HPSA status would be an endogenous variable in the regression model where the outcome of interest is the number of primary care providers per county Specifically this endogeneity problem may bias the effect of HPSA status on the number of primary care physicians toward zero One potential way to circumvent the issue of endogeneity of the HPSA status above would be to use the instrumental variable (IV) approach The IV approach relies on the identification of variables ie instruments that would be correlated with HPSA status and that would affect the providershytoshypopulation ratio only through the HPSA status variable These IVs will then be used in the regression framework to tease out the unbiased effect of the HPSA status on the providershytoshypopulation ratio However IVs are not always readily available In future upon availability of appropriate IVs a more inshydepth study can be carried out to resolve the problem of this endogeneity to estimate the unbiased effect of HPSA status on the providershytoshypopulation ratio52
52 Despite the issue of endogeneity of HPSA status we analyze the changes in the number of Medicare primary care
physicians per 10 thousand Medicare populations and the changes in the absolute number of Medicare primary care physicians over time due to changes in the countyrsquos HPSA status during the period of 2007shy2011 using the same DID framework laid out earlier The results from these estimated models are available upon request
52
Final Report Health Practitioner Bonuses
Modeling the Impact of the Increase in Medicaid Reimbursement Rate Relative to the Medicare Rate
A Study Design Overview
The availability of primary care is particularly important for public payer programs such as Medicaid and Medicare Historically Medicaid has been the less generous payer for primary care services relative to Medicare paying just 66 percent of Medicare rates on average53 In this section we first describe the variation in Medicaid reimbursement rates relative to those for Medicare both for primary care and for all services across US states during the period 2008shy2012 and second simulate the effect of a 10 percent increase in the MedicaidshytoshyMedicare fee index on the proportion of US officeshybased physicians accepting new Medicaid patients across all states
Cunningham et al (2011) report that fewer physicians accept new Medicaid patients in response to the low Medicaid reimbursement rates in several states Decker (2012) used data on officeshybased physicians from the 2011 National Ambulatory Medical Care Survey Electronic Medical Records Supplement to summarize the percentage of physicians currently accepting any new patients She finds that 694 percent of physicians in the sample accepted new patients with Medicaid This was lower than the percentage accepting new selfshypay (917 percent) Medicare (830 percent) or privately insured patients (817 percent) Logit regression model estimates showed that raising Medicaid fees to Medicare levels for all physicians a 258 percentageshypoint (35 percent) increase in the current average ratio of 742 would increase the acceptance rate of new Medicaid patients by 86 percentage points (12 percent) shy from an average of 694 percent across physicians to an average of 786 percent
Zuckerman et al (2009) reported that in 2008 stateshylevel average primary care physician fees under Medicaid ranged from 57 percent of the national average Medicaid fees in Rhode Island to 226 percent of national average in Alaska They also found that after strong Medicaid fee growth during 1998shy2003 Medicaid fees fell relative to inflation during 2003shy2008 Despite the slowdown in overall fee growth Medicaid fees for primary care services kept pace with inflation The ACA increases Medicaid reimbursement rates for certain services provided by primary care physicians to 100 percent of Medicare rates in 2013 and 2014 Given the variability of Medicaid payments across states this could be a substantial boost in payments for physicians in some states and less so in others
Zuckerman et al (2009 2012) provided stateshylevel MedicaidshytoshyMedicare fee indices for 2008 and 2012 These studies show that the national average Medicaid reimbursement rate for primary care services declined from 66 percent of the Medicare rate in 2008 to 59 percent in 2012 (about 106 percent decline) However the national average MedicaidshytoshyMedicare fee index for all services declined by about 83 percent (from 72 percent in 2008 to 66 percent in 2012) during the same period
Exhibit 24 reveals wide stateshytoshystate variation in the Medicaid fee relative to the Medicare rate in both 2008 and 2012 In several states including California Florida Michigan New York and Rhode Island the Medicaid primary care fee in 2012 was less than 50 percent of the Medicare rate In several other states including Alaska Delaware Montana North Dakota Oklahoma and Wyoming the Medicaid primary care fee was above 90 percent of the Medicare rate in the same year
53 Small DM and T McGinnis (2012) ldquoLeveraging the Medicaid Primary Care Rate Increase The Role of
Performance Measurementrdquo Center for Health Care Strategies Inc
53
Final Report Health Practitioner Bonuses
There is substantial variation in the percentage change in the MedicaidshytoshyMedicare fee index across these states too During 2008shy2012 most of the states except Maine Mississippi New Jersey New York North Dakota and DC experienced a decline in the MedicaidshytoshyMedicare fee index for all services and for primary care services Another exception is Minnesota where the MedicaidshytoshyMedicare fee index for all services declined by 66 percent during the same period but the index for primary care services increased by about 259 percent In Arizona Georgia Louisiana Michigan Nevada Virginia and Wyoming the decline in MedicaidshytoshyMedicare fee index for primary care is more than 15 percent
Decker (2012) and Cunningham (2011) exploit the stateshylevel variation in the Medicaid reimbursement rates and they examine the impact of an increase in Medicaid fee relative to Medicare on physiciansrsquo propensity to accept Medicaid patients
Cunningham (2011) uses 2008 Health Tracking Physician Survey on 1748 primary care physicians (PCPs) The empirical analysis includes the estimation of a linear probability regression model of whether a PCP is accepting new Medicaid patients using the stateshylevel Medicaid reimbursement rate relative to Medicare rate as one of the independent variables The key findings of this study can be summarized as follows
Average MedicaidshytoshyMedicare fee ratio for primary care in 2008 was 662 percent
On average PCPs accepting all or new Medicaid patients in the US in 2008 was 415 percent
One percentage point increase in MedicaidshytoshyMedicare fee ratio increases theshyproportion of PCPs accepting Medicaid patients by 0214shy
Thus based on the findings in Cunningham (2011) the implied elasticity of accepting primary care patients with respect to the MedicaidshytoshyMedicare fee is about 03454 In other words a 10 percent increase in the Medicaid fee relative to Medicare across all states would imply an increase in the acceptance rate of Medicaid patients from 415 percent to 429 percent nationally The estimated elasticity also suggests that under MedicaidshyMedicare payment parity the national average acceptance rate would go up from 415 percent to 487 percent55
The analytical findings presented here can be improved further if the data on proportion of physicians accepting new Medicaid patients in 2012 are available for each state Similarly availability of the stateshylevel MedicaidshytoshyMedicare fee index in 2011 can also refine the simulation results
54 The implied elasticity is calculated by The Lewin Group and it is based on the following statistics reported in the
study the national average MedicaidshytoshyMedicare fee ratio in 2008 (662 percent) the national average of PCPs accepting all or new Medicaid patients (415 percent) in 2008 and the estimated coefficient of MedicaidshytoshyMedicare fee ratio (0214) The estimated coefficient of 0214 implies that if the MedicaidshytoshyMedicare fee ratio increases by 1 percent from the national average (ie from 662 to 6686) then national average proportion of PCPs accepting Medicaid patients goes up by 0214(6686shy662) asymp 014 This is about 034 percent (100014415) increase in the proportion of PCPs accepting Medicaid patients Therefore the implied elasticity = ( percent change in proportion of PCPs accepting Medicaid patients) ( percent change in MedicareshytoshyMedicare fee ratio) = 0341 = 034
55 Lewinrsquos calculation of the new acceptance rate under MedicaidshyMedicare payment parity = [034(100shy
662)662+1]415 asymp 487
54
shy shy
shy shy
shy shy
shy
Final Report Health Practitioner Bonuses
Exhibit 24 MedicaidshytoshyMedicare Fee Index
States Medicare Fee Index Medicare Fee Index
Medicare Fee Index 2008
2012
All Services Primary care
All Services Primary care
All Services Primary care
US 072 066 066 059 shy83 shy106
AL 089 078 078 070 shy124 shy103
AK 140 140 124 127 shy114 shy93
AZ 106 097 082 075 shy226 shy227
AR 089 078 079 070 shy112 shy103
CA 056 047 051 043 shy89 shy85
CO 086 087 071 074 shy174 shy149
CT 099 078 087 071 shy121 shy90
DE 100 100 097 098 shy30 shy20
DC 058 047 080 080 379 702
FL 063 055 057 049 shy95 shy109
GA 090 086 075 070 shy167 shy186
HI 073 064 062 057 shy151 shy109
ID 103 103 088 089 shy146 shy136
IL 063 057 062 054 shy16 shy53
IN 069 061 062 055 shy101 shy98
IA 096 089 082 077 shy146 shy135
KS 093 094 078 082 shy161 shy128
KY 086 080 077 072 shy105 shy100
LA 092 090 075 075 shy185 shy167
ME 063 053 065 063 32 189
MD 087 082 073 070 shy161 shy146
MA 088 078 077 068 shy125 shy128
MI 063 059 051 046 shy190 shy220
MN 076 058 071 073 shy66 259
MS 087 084 090 090 34 71
MO 072 065 059 057 shy181 shy123
MT 103 096 097 094 shy58 shy21
NE 101 082 087 076 shy139 shy73
NV 104 093 074 068 shy288 shy269
NH 073 067 058 060 shy205 shy104
NJ 037 041 045 050 216 220
NM 107 098 092 085 shy140 shy133
NY 043 036 055 042 279 167
NC 095 095 082 085 shy137 shy105
ND 102 101 134 135 314 337
OH 069 066 061 059 shy116 shy106
OK 100 100 097 097 shy30 shy30
55
2008 Medicaid-to- 2012 Medicaid-to- Change in Medicaid-to-
-
shy shy
shy shy
shy shy
shy
Final Report Health Practitioner Bonuses
States Medicare Fee Index Medicare Fee Index
Medicare Fee Index 2008
2012
All Services Primary care
All Services Primary care
All Services Primary care
OR 090 078 081 072 shy100 shy77
PA 073 062 070 056 shy41 shy97
RI 042 036 037 033 shy119 shy83
SC 093 086 081 074 shy129 shy140
SD 095 085 076 069 shy200 shy188
TX 074 068 065 061 shy122 shy103
UT 082 076 074 074 shy98 shy26
VT 095 091 080 081 shy158 shy110
VA 090 088 080 074 shy111 shy159
WA 093 092 076 066 shy183 shy283
WV 085 077 080 074 shy59 shy39
WI 085 067 077 060 shy94 shy104
WY 143 117 116 096 shy189 shy179
Source Zuckerman et al (2009 and 2012) data on Tennessee were not available
Decker (2012) used data from the 2011 National Ambulatory Medical Care Survey Electronic Medical Records Supplement of 3979 officeshybased physicians (PCPs and nonshyPCPs) The studyrsquos empirical analysis included estimation of a logit regression model of whether an officeshybased physician is accepting new Medicaid patients A key variable in this analysis was the stateshylevel MedicaidshytoshyMedicare fee index of 200856 The key findings of this analysis were
Average MedicaidshytoshyMedicare fee ratio for all services (2008) was 72 percent
The average officeshybased physician new Medicaid patient acceptance rate for 2011 was 694 percent
Among PCPs the acceptance rate was 662 percent among nonshyPCPs the acceptance rate was 717 percent
Based on the logit parameter estimates she finds that an increase in the fee ratio from 742 to 100 would be expected to increase acceptance of new Medicaid patients from 694 percent to 786 percent
In other words a 10 percent increase in MedicaidshytoshyMedicare fee index for all services across all states would suggest a rise in the acceptance rate from 694 percent to 723 percent nationally57 Thus the implied elasticity of officeshybased physicians accepting new Medicaid patients with respect to the MedicaidshytoshyMedicare fee is about 04358 The study also finds that
56 One of the key limitations of the study is that the MedicaidshytoshyMedicare fee index is not available for year 2011
There may be substantial difference in stateshywide variation in these indices between 2008 and 2011 period In that case 2008 indices may not explain well the variation in the proportion of physicians accepting Medicaid patients
57 Lewinrsquos method of calculating the predicted proportion of accepting new Medicaid patients based on the estimated
logit model is explained in Appendix D 58
Lewinrsquos method of calculating the predicted proportion of accepting new Medicaid patients based on the estimated logit model is explained in Appendix D Using that method a 1 percent change in the 2008 national average
56
2008 Medicaid-to- 2012 Medicaid-to- Change in Medicaid-to-
-
shy shy
shy
shy shy
shy
Final Report Health Practitioner Bonuses
holding other things constant primary care officeshybased physicians are about 73 percentage point less likely to accept new Medicaid patients Decker also estimated the impact on the primary care physicians only and she found that the estimated impact is similar to the one reported above for all physicians More specifically she found that an increase in the MedicaidshytoshyMedicare fee ratio for primary care to 100 was predicted to increase acceptance of new Medicaid patients among primary care physicians from 647 percent to 717 percent
B Simulation Exercise
We simulated the effect of a 10 percent increase in the stateshylevel MedicaidshytoshyMedicare fee indices (for all services) from their 2008 level on the proportion of US officeshybased physicians accepting new Medicaid patients in each state59 A detailed description of the simulation methodology used to predict the proportion of officeshybased physicians accepting Medicaid patients is presented in Appendix D The simulation exercise is based on the empirical findings of Decker (2012) and the data on the proportion of US officeshybased physicians accepting new Medicaid patients for each state reported in the same study
Exhibit 25 summarizes the predicted proportion of US officeshybased physicians accepting new Medicaid patients by state For example in California the MedicaidshytoshyMedicare fee ratio in 2008 was substantially lower than the national average Subsequently only 571 percent of the officeshybased physicians in California were accepting new Medicaid patients Based on the simulation we find that a 10 percent increase in the MedicaidshytoshyMedicare fee index in California (from 056 to 062) would increase the proportion of officeshybased physicians accepting new Medicaid patients in California from 571 percent to 597 percent (about 46 percent increase)
Exhibit 25 Proportion of US Officeshybased Physicians Accepting New Medicaid Patients
States Medicare Fee Index
All Services 2008
physicians accepting
new Medicaid patients
2011
Predicted acceptance rate under
Fee Index (Based on Decker 2012)
(Non -Linear Projection)
US 072 694 722
AL 089 685 720
AK 140 821 857
AZ 106 785 817
AR 089 907 920
CA 056 571 597
CO 086 661 696
CT 099 607 650
DE 100 783 813
DC 058 752 772
MedicaidshytoshyMedicare fee index reported in the study (from 742 percent to 7492 percent) increases the proportion of officeshybased physicians accepting new Medicaid patients from 694 percent to 697 percent Therefore the implied elasticity = ( percent change in proportion of PCPs accepting Medicaid patients) ( percent change in MedicareshytoshyMedicare fee ratio) = ((697shy694)694)1 = 043
59 At this point stateshylevel MedicaidshytoshyMedicare fee index are not available for 2011 and the proportion of physicians
accepting new Medicaid patients are not readily available to Lewin by state in any year other than 2011 In future Lewin Group will explore the availability of such data to strengthen the analysis
57
Medicaid-to- of US office-based
10 rise in Medicaid-to-Medicare
shy
shy shy
shy
Final Report Health Practitioner Bonuses
States
Medicaid-to-
Medicare Fee Index
All Services 2008
of US office based
physicians accepting
new Medicaid patients
2011
Predicted acceptance rate under
10 rise in Medicaid-to-Medicare
Fee Index (Based on Decker 2012)
(Non Linear Projection)
FL 063 591 619
GA 090 674 710
HI 073 699 727
ID 103 847 870
IL 063 649 676
IN 069 706 732
IA 096 876 894
KS 093 682 719
KY 086 794 819
LA 092 621 661
ME 063 740 762
MD 087 659 695
MA 088 806 831
MI 063 811 829
MN 076 963 968
MS 087 796 821
MO 072 676 705
MT 103 899 915
NE 101 870 890
NV 104 752 787
NH 073 817 837
NJ 037 404 421
NM 107 863 885
NY 043 616 635
NC 095 764 795
ND 102 946 955
OH 069 720 745
OK 100 673 713
OR 090 795 821
PA 073 680 709
RI 042 689 706
SC 093 841 863
SD 095 941 950
TN 614
TX 074 699 727
UT 082 835 855
58
-
-
shy shy
shy
shy shy
shy
Final Report Health Practitioner Bonuses
States
Medicaid to
Medicare Fee Index
All Services 2008
of US office based
physicians accepting
new Medicaid patients
2011
Predicted acceptance rate under
10 rise in Medicaid to Medicare
Fee Index (Based on Decker 2012)
(Non Linear Projection)
VT 095 784 813
VA 090 760 790
WA 093 764 794
WV 085 809 833
WI 085 930 940
WY 143 993 995
Note The predicted proportions are based on the estimated logit model in Decker (2012)
Next we analyzed the implication of our findings from the Medicare PCIP policy analysis in the context of the MedicaidshyMedicare payment parity We have already discussed that based on our analysis the number of Medicare primary care providers accepting new Medicare patients increased by almost 10 percent in response to the Medicare 10 percent PCIP policy (Exhibit 14) According to Zuckerman et al (2012) the US average MedicaidshytoshyMedicare fee ratio for primary care services in 2012 was about 059 Thus MedicaidshyMedicare payment parity would imply almost a 70 percent increase in Medicaid fees over the 2012 US average Further the findings by Decker (2012) suggest that in 2011 almost 662 percent officeshybased primary care physicians accepted new Medicaid patients
Given the magnitude of the impact of the Medicare PCIP policy if the MedicaidshyMedicare payment parity policy at least triggers a 10 percent increase in MedicaidshytoshyMedicare fee ratio then we would expect the US average of officeshybased primary care physicians accepting new Medicaid patients to go up to at least 728 percent However considering the 2012 US average MedicaidshyMedicare payment parity would imply a much bigger percentage increase in payments than 10 percent payment increase under the Medicare PCIP policy It is challenging to use the estimated impact of PCIP program to extrapolate the impact of MedicaidshytoshyMedicare parity This is because (1) in general parity would require a much bigger change in MedicaidshytoshyMedicare fee ratio (compared to the 10 percent PCIP payment) and (2) our PCIP analysis is limited in the sense that it is not capturing continuous variation in the incentive payment due to the nature of the program Finally the actual increase in the absolute value of payment under the Medicare and Medicaid payment policies would depend on the volume of primary care services and the current state MedicaidshyMedicare fee index
Conclusions The Affordable Care Act includes two key provisions regarding reimbursement to primary care providers (a) it provides a 10 percent supplemental payment under the Medicare PCIP program to eligible providers (effective January 1 2011) and (b) it raises the Medicaid primary care reimbursement rate at least up to 100 percent of the Medicare rate ASPE has contracted with the Lewin Group to examine the role of Medicare PCIP and supplemental payment programs including the HPSA and PSA incentives in increasing the supply of primary care providers (PCP) and the access of patients to their services
We reviewed the health and labor economics literature to understand the nature and the size of the impact of any financial incentives on the labor supply behavior of PCPs and the resultant impact on the availability of primary care services estimated in the existing body of research
59
-- -
--
-
Final Report Health Practitioner Bonuses
We documented the prior empirical evidence of the impact of financial incentives on raising the supply of primary care workforce the volume of services impact on medical graduatesrsquo propensity to participate in primary care PCPsrsquo retirement decision etc This review also evaluated the past evidence on the effect of bonuses in shortage areas and their effectiveness to redistribute and retain primary care workforce Finally the review of the literature also focused on the stateshyspecific experiences with changes in their respective Medicaid payment rates for primary care and the resultant impact on the supply of PCPs their rate of acceptance of Medicaid patients and the volume of primary care services such as office visits or visits for EampM services
To explore these topics we constructed a provider level data set including all the claims submitted by the entire universe of Medicare providers in each year from 2005 to 2011 We linked Provider360 data (available from Lewin Grouprsquos parent company Optum Inc) and the AMA Physician Master File to add provider characteristics such as demographics (eg age gender) provider designation medical school and practice location We also added geographic location specific variables from the Area Resource File (ARF) based on the practice location information of providers
We find that as a result of the Medicare incentive payment the number of Medicare primary care providers has increased on average annually by about 28 providers per county from 2009 to 2011 The number of primary care physicians with PCIP eligible specialty increased by about 10 percent in response to the 10 percent incentive payment under the PCIP policy (ie elasticity of the number of primary care physicians with respect to the incentive payment is about 1) Eligible claims for some types of PCIP eligible EampM services and associated allowed charges have also increased For example on average there was a 7 percent increase in the number of 25 minute office visits claims due to the PCIP policy On the other hand in response to the PCIP policy there was a 93 percent increase in the average allowed charges (for the eligible services) among primary care provider with PCIP eligible specialties Our results regarding the PCIP impact should be interpreted with caution due to several reasons First we only observe one year after the PCIP was in effect and as data becomes available for the full 2011shy2015 period the magnitude and precision of our estimates may change Second given the limited timeframe of this incentive providers may not be willing to make longshylasting adjustments in their decision to supply primary care services Finally as Medicare providers become more familiar PCIP users in time and adjust their behavior the full impact of the incentive on provider behavior may change
In addition we find that Medicare providers were attracted to PSA areas through the PSA bonus and submitted 78 percent more EampM claims annually during the PSA period Gaining HPSA status also generated an additional 17 EampM claims submitted by primary care physicians with HPSA bonusshyeligible specialties Estimation of HPSA and PSA bonuses impact on primary care supply has been hindered by the existence of biases rising from the fact that the HPSA and PSA designation is a function of the current supply of providers While we try to mitigate some of these sources of bias future research is needed to provide a causal estimate of these bonuses
Finally we document the variation in Medicaid reimbursement rates relative to the Medicare rates both for primary care and for all services across US states during the period 2008shy2012 using the existing body of evidence Using the empirical results from our PCIP analysis we also perform an exercise to simulate the effect of a 10 percent increase in the MedicaidshytoshyMedicare fee index on the proportion of US officeshybased physicians accepting new Medicaid patients across all states The simulation suggests that a 10 percent increase in MedicaidshytoshyMedicare fee ratio would increase the US average of officeshybased primary care physicians accepting new Medicaid patients from 662 to 728 percent We caution against using the
60
Final Report Health Practitioner Bonuses
estimated impact of PCIP program to extrapolate the impact of MedicaidshytoshyMedicare parity This is because (1) in general parity would require a much bigger change in MedicaidshytoshyMedicare fee ratio (compared to the 10 percent PCIP payment) and (2) our PCIP analysis is limited in the sense that it is not capturing continuous variation in the incentive payment due to the nature of the program
61
Final Report Health Practitioner Bonuses
Appendices
Appendix A Bibliography and Literature Matrix Askildsen Jan Erik and Badi H Baltagi 2002 ldquoWill Increased Wages Reduce Shortage of Nurses A
Panel Data Analysis of Nursesrsquo Labour Supplyrdquo Health San Francisco 1ndash28 httpovidsptxovidcomspshy331aovidwebcgiampS=HIBGFPGCKJDDJIGINCCLIAGCBOJCAA00amp Complete+Reference=Ssh36|2|1
Aurlien H G Falck and G Jacobsen 1991 ldquoThe Physicianrsquos Choice of a Specialtyrdquo Tidsskrift for Den Norske Laegeforening Tidsskrift for Praktisk Medicin Ny Raekke 111 (17) 2133ndash2136
Bazzoli G J 1985 ldquoDoes Educational Indebtedness Affect Physician Specialty Choicerdquo Journal of Health Economics 4 (1) 1ndash19
Bindman Andrew B Jean Yoon and Kevin Grumbach 2003 ldquoTrends in Physician Participation in Medicaid The California Experiencerdquo The Journal of Ambulatory Care Management 26 (4) 334ndash43 httpwwwncbinlmnihgovpubmed14567277
Bloom Matt and George T Milkovich 1998 ldquoRelationships Among Risk Incentive Pay and Organizational Performancerdquo Academy of Management Journal 41 (3) 283ndash297 doi102307256908 httpconnectionebscohostcoman953549
Bodenheimer Thomas 2007 ldquoThe Primary Careshyspecialty Income Gap Why It Mattersrdquo Annals of Internal Medicine httpwebmailwendellmurraytaxescomhealthcarepolicypay_gappdf
Bolduc Denis B Fortin and MA Fournier 1996 ldquoThe Effect of Incentive Policies on the Practice Location of Doctors a Multinomial Probit Analysisrdquo Journal of Labor Economics httpwwwjstororgstable1023072535445
ChaixshyCouturier C I DurandshyZaleski D Jolly and P Durieux 2000 ldquoEffects of Financial Incentives on Medical Practice Results from a Systematic Review of the Literature and Methodological Issuesrdquo International Journal for Quality in Health Care Journal of the International Society for Quality in Health Care ISQua 12 (2) 133ndash142 httpwwwncbinlmnihgovpubmed10830670
Chou ChiushyFang and Anthony T Lo Sasso 2009 ldquoPractice Location Choice by New Physicians The Importance of Malpractice Premiums Damage Caps and Health Professional Shortage Area Designationrdquo Health Services Research 44 (4) (August) 1271ndash89 doi101111j1475shy6773200900976x httpwwwpubmedcentralnihgovarticlerenderfcgiartid=2739028amptool= pmcentrezamprendertype=abstract
Clemens Jeffrey and Joshua D Gottlieb 2014 ldquoDo Physicians Financial Incentives Affect Medical Treatment and Patient Healthrdquo American Economic Review 104(4) pp 1320shy1349
Coburn A F S H Long and M S Marquis 1999 ldquoEffects of Changing Medicaid Fees on Physician Participation and Enrollee Accessrdquo Inquiry a Journal of Medical Care Organization Provision and Financing 36 (3) 265ndash279
Cunningham Peter J 2011 ldquoState Variation in Primary Care Physician Supply Implications for Health Reform Medicaid Expansionsrdquo Research Briefs Center for Studying Health System Change (19) 1ndash 11 httpsfolioiupuieduhandle102441004
Cunningham Peter J and Ann S OrsquoMalley 2008 ldquoDo Reimbursement Delays Discourage Medicaid Participation by Physiciansrdquo Health Affairs 28 (1) w17ndashw28 httpwwwncbinlmnihgovpubmed19017679
Decker S 2012 ldquoIn 2011 Nearly OneshyThird of Physicians Said They Would Not Accept New Medicaid Patients but Rising Fees May Helprdquo Health Affairs 31 no8 pp 1673shy1679
Doran Tim Catherine Fullwood Hugh Gravelle David Reeves Evangelos Kontopantelis Urara Hiroeh and Martin Roland 2006 ldquoPayshyforshyperformance Programs in Family Practices in the United
62
thinsp
Final Report Health Practitioner Bonuses
Kingdomrdquo The New England Journal of Medicine 355 (4) (July 27) 375ndash84 doi101056NEJMsa055505 httpwwwncbinlmnihgovpubmed16870916
Dummit LA 2008 ldquoPrimary Care Physician Supply Physician Compensation and Medicare Fees What Is the Connectionrdquo Issue Brief Natl Health Policy Forum (827) http7612169157libraryissueshybriefsIB827_Physician_Income_11shy03shy08pdf
Fournier Gary M and Cheryl Henderson 2005 ldquoIncentives and Physician Specialty Choice a Case Study of Floridarsquos Program in Medical Sciencesrdquo Inquiry a Journal of Medical Care Organization Provision and Financing 42 (2) 160ndash170
Gagneacute Robert and Pierre Thomas Leacuteger 2005 ldquoDeterminants of Physiciansrsquo Decisions to Specializerdquo Health Economics 14 (7) 721ndash735 httpwwwncbinlmnihgovpubmed15678516
Gibbons Robert and Kevin J Murphy 1992 ldquoOptimal Incentive Contracts in the Presence of Career Concerns Theory and Evidencerdquo Journal of Political Economy (3792) (September) httpwwwnberorgpapersw3792
Gosden T F Forland I S Kristiansen M Sutton B Leese A Giuffrida M Sergison and L Pedersen 2001 ldquoImpact of Payment Method on Behaviour of Primary Care Physicians a Systematic Reviewrdquo Journal of Health Services Research Policy 6 (1) 44ndash55 httpeprintswhiteroseacuk52996
Grobler Liesl Ben J Marais S A Mabunda P N Marindi Helmuth Reuter and Jimmy Volmink 2009 ldquoInterventions for Increasing the Proportion of Health Professionals Practising in Rural and Other Underserved Areasrdquo Cochrane Database of Systematic Reviews Online 2 (1) CD005314 doi10100214651858CD005314pub2 httpwwwncbinlmnihgovpubmed19160251
Hadley J J Reschovsky C Corey and S Zuckerman 2009 ldquoMedicare Fees and the Volume of physiciansrsquo Servicesrdquo Inquiry 1Vol 46 No 4 Winter 2009shy2010 372shy390
Henderson M C D K Hunt and J W Williams 1996 ldquoGeneral Internists Influence Students to Choose Primary Care Careers The Power of Role Modelingrdquo The American Journal of Medicine 101 (6) 648ndash653
Hernoes E Marte Sollie and S Stroslashm 2000 ldquoEarly Retirement and Economic Incentivesrdquo The Scandinavian Journal of 102 (3) 481ndash502 httponlinelibrarywileycomdoi1011111467shy944200211abstract
Hogan F Paul and Ellen Bouchery 2010 ldquo A Model of Subspecialty Choice for Internal medicine Residentsrdquo prepared by The Lewin Group for the American College of Cardiology
Holmes George M 2005 ldquoIncreasing Physician Supply in Medically Underserved Areasrdquo Labour Economics 12 (5) (October) 697ndash725 doi101016jlabeco200402003 httplinkinghubelseviercomretrievepiiS0927537104000284
Kuhmerker K and T Hartman 2007 ldquoPayshyforshyperformance in State Medicaid Programsrdquo New York (NY) Commonwealth Fund
Lynch D C D A Newton M S Grayson and T W Whitley 1998 ldquoInfluence of Medical School on Medical Studentsrsquo Opinions About Primary Care Practicerdquo AAMC Academic Medicine Journal of the Association of American Medical Colleges 73 (4) 433ndash435
Manning WG Newhouse JP Duan N Keeler EB Benjamin B Liebowitz A et al 1988 ldquoHealth insurance and the demand for medical care Evidence from a randomized experimentrdquo Santa Monica CA RAND Corporation
McDonald Ruth and Martin Roland 2009 ldquoPay for Performance in Primary Care in England and California Comparison of Unintended Consequencesrdquo Annals Of Family Medicine 7 (2) 121ndash127 httpwwwpubmedcentralnihgovarticlerenderfcgiartid=2653973amptool=pmcentrezamprendertype=abs tract
Midtsundstad Tove 2012 ldquoEffects of Companiesrsquo Initiatives to Reduce Early Retirement Among Older Workersrdquo Nordic Journal of Working Life Studies 2(3) 89-108
63
thinsp
Final Report Health Practitioner Bonuses
Morrow R W A D Gooding and C Clark 1995 ldquoImproving Physiciansrsquo Preventive Health Care Behavior Through Peer Review and Financial Incentivesrdquo Archives of Family Medicine 4 (2) 165ndash169
Nicholson S 2002 ldquoPhysician Specialty Choice Under Uncertaintyrdquo Journal of Labor Economics 20 (4) 816ndash847
Nicholson Sean and C Propper 2011 ldquoMedical Workforcerdquo In Handbook of Health Economics 873ndash 923
Petersen Laura A LeChauncy D Woodard Tracy Urech Christina Daw and Supicha Sookanan 2006 ldquoDoes Payshyforshyperformance Improve the Quality of Health Carerdquo Annals of Internal Medicine 145 (1 Suppl) 538 author reply 538ndash539 httpwwwncbinlmnihgovpubmed16908917
Petterson Stephen M and Andrew W Bazemore 2012 ldquoProjecting US Primary Care Physician Workforce Needs 2010shy2025rdquo Annals of Family Medicine Vol 10 (No 6) 503ndash509 doi101370afm1431INTRODUCTION httpwwwannfammedorgcontent106503abstract
Piper Kip and Sellers Dorsey 2009 Global Payments to Improve Quality and Efficiency in Medicaid
Rabinowitz H K J J Diamond F W Markham and N P Paynter 2001 ldquoCritical Factors for Designing Programs to Increase the Supply and Retention of Rural Primary Care Physiciansrdquo Jama The Journal Of The American Medical Association 286 (9) 1041ndash1048 httpjamaamashyassnorgcgidoi101001jama28691041
Ramsey P G J B Coombs D D Hunt S G Marshall and M D Wenrich 2001 ldquoFrom Concept to Culture The WWAMI Program at the University of Washington School of Medicinerdquo Academic Medicine 76 (8) 765ndash775
Reschovsky J A Ghosh and K Stewart 2012 Paying More for Primary Care Can It Help Bend the Medicare Cost Curve The Commonwealth Fund httpwwwcommonwealthfundorg~mediaFilesPublicationsIssueBrief2012Mar1585_Reschovsky _paying_more_for_primary_care_FINALv2pdf
Rizzo J A and D Blumenthal 1994 ldquoPhysician Labor Supply Do Income Effects Matterrdquo Journal of Health Economics 13 (4) 433ndash453 httpwwwncbinlmnihgovpubmed10140533
Rosenthal MB Li Z Epstein AM Frank R G 2005 ldquoEarly Experience with Payshyforshyperformance From Concept to Practicerdquo JAMA The Journal of the American Medical Association 294 (14) (October 12) 1788ndash1793 httpdxdoiorg101001jama294141788
Rosenthal Meredith B and R Adams Dudley 2007 ldquoPayshyforshyperformance Will the Latest Payment Trend Improve Carerdquo Jama The Journal Of The American Medical Association 297 (7) 740ndash744 httpwwwncbinlmnihgovpubmed17312294
Salinsky E 2010 ldquoHealth Care Shortage Designations HPSA MUA and TBDrdquo National Health Policy Forum Background Paper No 75 pp 1shy36
Saether Erik Magnus 2005 ldquoPhysiciansrsquo Labour Supply The Wage Impact on Hours and Practice Combinationsrdquo Labour 19 (4) (December) 673ndash703 doi101111j1467shy9914200500317x httpdoiwileycom101111j1467shy9914200500317x
Scott Anthony Peter Sivey Driss Ait Ouakrim Lisa Willenberg Lucio Naccarella John Furler and Doris Young 2011 ldquoThe Effect of Financial Incentives on the Quality of Health Care Provided by Primary Care Physiciansrdquo Cochrane Database of Systematic Reviews Online 9 (9) CD008451 httpwwwncbinlmnihgovpubmed21901722
Sempowski Ian P 2004 ldquoEffectiveness of Financial Incentives in Exchange for Rural and Underserviced Area Returnshyofshyservice Commitments Systematic Review of the Literaturerdquo Canadian Journal of Rural Medicine the Official Journal of the Society of Rural Physicians of Canada Journal Canadien De La Medecine Rurale Le Journal Officiel De La Societe De Medecine Rurale Du Canada 9 (2) 82ndash88 httpwwwncbinlmnihgovpubmed15603680
Shen YushyChu and Stephen Zuckerman 2005 ldquoThe Effect of Medicaid Payment Generosity on Access and Use Among Beneficiariesrdquo Health Services Research 40 (3) (June) 723ndash44 doi101111j1475shy
64
Final Report Health Practitioner Bonuses
6773200500382x httpwwwpubmedcentralnihgovarticlerenderfcgiartid=1361165amptool= pmcentrezamprendertype=abstract
Shugarman Lisa R and Donna O Farley 2003 ldquoShortcomings In Medicare Bonus Payments For Physicians In Underserved Areasrdquo Health Affairs 22 (4) (July 1) 173ndash178 doi101377hlthaff224173 httpcontenthealthaffairsorgcontent224173abstract
Shurgman Lisa R Donna O Farley Pat Taylor and J Scott Ashwood 2001 Trends in Bonus Payments for Physician Services to Rural Medicare Beneficiaries
Sivey Peter Anthony Scott Julia Witt Catherine Joyce and John Humphreys 2012 ldquoJunior Doctorsrsquo Preferences for Specialty Choicerdquo Journal of Health Economics 31 (6) (December) 813ndash23 doi101016jjhealeco201207001 httpwwwncbinlmnihgovpubmed22940638
Sloan Frank 1970 ldquoLifetime Earnings and Physiciansrsquo Choice of Specialtyrdquo Industrial and Labor Relations Review Vol 24 (No 1) (October 13) pp 47ndash56 httpdukespacelibdukeedudspacehandle101612547
Small David Marc and Tricia McGinnis 2014 Leveraging the Medicaid Primary Care Rate Increase The Role of Performance Measurement
Staiger Douglas O David I Auerbach and Peter I Buerhaus 2010 ldquoTrends in the Work Hours of Physicians in the United Statesrdquo The Journal of the American Medical Association 303 (8) (February 24) 747ndash53 doi101001jama2010168 httpwwwpubmedcentralnihgovarticlerenderfcgiartid=2915438amptool=pmcentrezamprendertype= abstract
Town Robert Robert Kane Paul Johnson and Mary Butler 2005 ldquoEconomic Incentives and Physiciansrsquo Delivery of Preventive Care a Systematic Reviewrdquo American Journal of Preventive Medicine 28 (2) (February) 234ndash40 doi101016jamepre200410013 httpwwwncbinlmnihgovpubmed15710282
Vaughn Bryan T Steven R DeVrieze Shelby D Reed and Kevin a Schulman 2010 ldquoCan We Close the Income and Wealth Gap Between Specialists and Primary Care Physiciansrdquo Health Affairs 29 (5) (May) 933ndash40 doi101377hlthaff20090675 httpwwwncbinlmnihgovpubmed20439883
Verby J E J P Newell S A Andresen and W M Swentko 1991 ldquoChanging the Medical School Curriculum to Improve Patient Access to Primary Carerdquo Jama The Journal Of The American Medical Association 266 (1) 110ndash113 httpjamaamashyassnorgcontent2661110short
Zuckerman Stephen 2004 ldquoChanges in Medicaid Physician Fees 1998shy2003 Implications for Physician Participationrdquo Health Affairs (June) 1998ndash2003 doi101377hlthaffW4374 httpwwwhealthaffairsorgRWJZuckerman_June04pdf
Zuckerman Stephen Aimee F Williams and Karen E Stockley 2009 ldquoTrends in Medicaid Physician Fees 2003shy2008rdquo Health Affairs 28 (3) w510ndashw519 httpwwwncbinlmnihgovpubmed19401290
Zuckerman S and D Goin 2012 ldquoHow Much Will Medicaid Physician Fees for Primary Care Rise in 2013 Evidence from a 2012 Survey of Medicaid Physician Feesrdquo Kaiser Commission on the Medicaid and the Uninsured Issue Paper December 2012
65
Final Report Health Practitioner Bonuses
Literature Matrix
Study Goal Results Data Type of Study Reference
Topic Effect of Earnings on the Supply of Primary Care Services and Providers Role of Medicare Primary Care Bonuses (Section III)
Estimate a model where medical Data set with the Econometric students consider entry The income elasticity estimates range from 103 in family preferred and realized model Nicholson probabilities when selecting a practicepediatrics to 220 in radiology specialties for 7200 (conditional 2002 specialty medical students logit)
Estimated career wealth The present value of career wealth from college accumulation across specialists primary care physicians physician assistants business school graduates and college graduates Comparing specialists represented by cardiologists to
graduation through age sixtyshyfive was estimated at $5171407 for cardiologists $2475838 for primary care physicians $1725171 for MBA graduates $846735 for physician assistants and $340628 for college graduates For a primary care physicianrsquos lifetime earnings to equal that of a cardiologist the primary care
Data from multiple sources included income income taxes living expenses and graduate school
Compound interest wealth accumulation model
Vaughn et al 2010
primary care physicians in physician would have to receive a bonus of $11 million expenses
scenarios upon completion of medical school
Determine effect of educational indebtedness on the specialty choices of new physicians especially in light of the perceived shortage of primary care physicians
Medical students are more likely to choose primary care when the expected earnings are relatively large A $10000 (20 percent of the mean earnings) increase in expected earnings in primary care relative to the nonshyprimary care yields a 14 percentage point increase in the probability of choosing primary care
Data set from American Medical Associationrsquos 1983 lsquoSurvey of Resident Physiciansrsquo
Econometric model (utility maximization)
Bazzoli 1985
Estimation of career choice and medical studentrsquos decision to specialize given lifetime utility maximization
In response to 91 percent reduction in relative feeshypershyconsultation for a general practitioner would lead to between a 04 percent reduction and a 229 percent reduction in the proportion of Medical students entering general practice
Data from multiple sources Model estimated from sample of 30184 physicians who practiced in Canada between 1989 and 1998 and whose year of graduation from medical school is between 1975 and 1991
Econometric model (multinomial logit)
Gagne and Leger 2005
Determine the causes of the primary careshyspecialist income gap why the ResourceshyBased Relative Value Scale failed to prevent the income gap
The RBSVS failed due to four factors (1) the volume of diagnostic and imaging procedures has increased more rapidly than the volume of office visits (2) the process of updating fees every five years is heavily influenced by the Relative Value Scale Update Committee which is composed of a majority of specialists (3) Medicarersquos formula for controlling physician payments penalizes primary care physicians and (4) private insurers tend to pay for procedures at higher rates than office visits relative to Medicare
Data from multiple sources income information between 1995 and 2005
Literature review Bodenheimer 2007
66
Final Report Health Practitioner Bonuses
Study Goal Results Data Type of Study Reference
Determine the effects of expected future earnings and other attributes on specialty choice
Simulated policy changes indicate increasing general practitioners earnings by $50000 or increasing opportunities for procedural or academic work (specifically limiting the amount of onshycall hours) can increase the number of junior doctors choosing general practice by between 8 and 13 percentage points This implies an earnings elasticity of specialty choice of 095
Data from the Medicine in Australia Balancing Employment and Life (MABEL) survey
Econometric model (logit)
Sivey amp Scott 2012
Estimate a model of physician labor supply focusing on the impacts of wage and nonshywage income
Evidence of significant income effects For male physicians the income effect of a wage change on labor supply is negative with an elasticity of shy 026 The pure substitution effect of a wage change increases labor supply a 1 percent increase in wages leads to a 049 percent increase in labor supply controlling for income effects
Data from the 1987 Practice Patterns of Young Physicians Survey (YPS)
Econometric model (log linear regression)
Rizzo and Blumenthal 1994
Estimate the labor supply of physicians employed at hospitals in Norway using personnel register data merged with other public records
Research indicates a 10 percent wage increase would lead to a 3 percent increase in physician labor supply (wage elasticity of 03) The magnitude of the wage elasticity in this case may be relatively small because of hospital employed physicians tendency to have a lower wage than selfshyemployed physicians though still larger than previous estimates
Data set used is a sample of 1303 male physicians observed over the period 1993 and 1997
Econometric model (GMM system GMM)
Baltagi et al 2005
Estimate wage elasticities for Norwegian nurses
40 percent of PCC students returned to New Mexico to practice compared to 32 percent of traditional students
Data includes detailed information on 18066 individuals over 5 years totaling 56832 observations between 1993 and 1997
Econometric model (fixed effects)
Askildsen amp Baltagi 2002
Effect of a permanent 10 percent increase in fees for primary care ambulatory visits on volume of services and cost to Medicare
Analysis shows the fee increase would increase primary care visits by 88 percent and raise the overall cost of primary care visits by 17 percent However these increases would yield more than a sixshyfold annual return in lower Medicare costs for other servicesmdashmostly inpatient and postshyacute caremdashonce the full effects on treatment patterns are realized The net result would be a drop in Medicare costs of nearly 2 percent These
Data set contains Medicare claims data (2004 to 2006) as well as physician data from the Community Tracking Study (CTS) Physician Survey (2004 to 2005)
Econometric model
Reschovsky et al 2012
Estimates the relationship between Medicare fees and quantities provided by physicians for eight specific services
Results show that Medicare fees are positively related to quantity provided for all eight services and are significantly different from zero and elastic for five Estimates are that a 10 percent reduction in Medicare fees would lead to 18 percent to 66 percent reduction in the volume of office visits
Data set contains 13707 physicians who responded to surveys in 20002001 andor 20042005 and were linked to all Medicare claims for their Medicare patients
Econometric model (GLM)
Hadley et al 2009
67
Final Report Health Practitioner Bonuses
Study Goal Results Data Type of Study Reference
Estimate trends in hours worked by US physicians and assess for association with physician fees
After remaining stable through the early 1990s mean hours worked per week decreased by 72 percent between 1996 and 2008 among all physicians (from 549 hours per week in 1996shy1998 to 510 hours per week in 2006shy2008 Excluding resident physicians whose hours decreased by 98 percent the last decade due to duty hour limits imposed in 2003 nonresident physician hours decreased by 57 percent
Data set from US Census Bureau Current Population Survey between 1976 and 2008 (N=116733)
Outcomes of a Problemshybased learning model (specialty and practice location)
Steiger et al 2010
Study Goal Results Data Type of Study Reference
Topic Financial Incentives for Primary Care Providers in Underserved Areas (Section IV)
Evaluate effectiveness and developing trends in bonus payments to rural physicians
In 1991 the total amount of HPSA bonus was almost 316 million dollars Estimates show that 583 percent of the total HPSA bonus payment went to rural HPSAs while the remaining 417 percent went to urban HPSAs They also observed that the total bonus payment grew to reach about 106 million dollars in 1996 but then gradually declined to almost 77 million dollars in 1998 The rural proportion of HPSA bonus payments decreased to 511 percent
Data set includes Area Resource File (ARF) and Medicare Part B claims data for multiple years
Trend examination
Shugarman et al 2001
Examine trends in Medicare spending for basic payments and bonus payments for physician services provided to beneficiaries residing in nonmetropolitan counties
Payments under the Congressionallyshymandated bonus payment program accounted for less than 1 percent of expenditures for physician services in nonmetropolitan underserved counties Physician payments increased from 1992 to 1998 while bonus payments increased through 1996 but then declined by 13 percent by 1998 The share of bonus payments to primary care physicians declined throughout the decade but the share for primary care services increased
Data set includes Area Resource File (ARF) and Medicare Part B claims data for multiple years
Trend examination
Shugarman and Farley 2003
Evaluate the effectiveness of programs that provide financial incentives to physicians in exchange for a rural or underserviced area returnshyofshyservice (ROS) commitment
The majority of studies reported effective recruitment despite high buyshyout rates in some USshybased programs Increasing Canadian tuition and debt among medical students may make these programs attractive The one prospective cohort study on retention showed that physicians who chose voluntarily to go to a rural area were far more likely to stay long term than those who located there as an ROS commitment Multidimensional programs appeared to be more successful than those relying on financial incentives alone
Limited literature available given quality limitations
Literature Review
Sempowski et al 2004
Assess the effect of various On average a 10 percent increase in the general practitioner Data for physicians come Econometric incentive measures fees for medical services in a region increases the propensity from la Corporation model (spatial Bolduc et introduced in Quebec of a beginning GP to work in this region by 7 percent Thus the Professionnelle des autoregressive al 1996 (Canada) to influence the implied elasticity of location choice probability with respect to Medecins du Qu6bec multinomial
68
Final Report Health Practitioner Bonuses
Study Goal Results Data Type of Study Reference geographical distribution of fee increases is about 07 However this elasticity varies Population data come probit) physicians across regions it is higher in remote regions (with a maximum from Canada Census
of 128) On the other hand on average the elasticity of (various years) and intershylocation choice probability with respect to nonshylabor incomes census estimations from such as study grants is estimated to be about 111 le Bureau de la Statistique
du Qu6bec (unpublished data)
Compare the types of locations chosen by alumni and nonshyalumni of a United States program charged with increasing physician supply
Eliminating the program would decrease the supply of physicians in medically underserved communities by roughly 10 percent
Data from multiple sources primarily the
American Medical Association (AMA) master file for 1981 1986 1991 and 1996
Econometric (multinomial logit)
Holmes 2005
Examine the history and results of The Physician Shortage Area Program (PSAP) of Jefferson Medical College and identify factors independently predictive of rural primary care supply and retention
Freshmanshyyear plan for family practice being in the PSAP having a National Health Service Corps scholarship male sex and taking an elective senior family practice rural preceptorship were independently predictive of physicians practicing rural primary care Among PSAP graduates taking a senior rural preceptorship was independently predictive of rural primary care However nonshyPSAP graduates with 2 key selection characteristics of PSAP students (having grown up in a rural area and freshmanshyyear plans for family practice) were 78 percent as likely as PSAP graduates to be rural primary care physicians and 75 percent as likely to remain suggesting that the admissions component of the PSAP is the most important reason for its success
Data includes a total of 3414 Jefferson Medical College graduates from the classes of 1978shy1993 including 220 PSAP graduates
Retrospective cohort study
Rabinowitz et al 2001
69
Final Report Health Practitioner Bonuses
Study Goal Results Data Type of Study Reference
Topic Impact of the Increase in Medicaid Reimbursement Rate Relative to the Medicare Rate (Section V)
Identify the causal effect of increases in Medicaid reimbursement rates relative to the Medicare rate on the propensity of primary care physicians accepting new Medicaid patients
For primary care physicians a 10 percentage point increase in the MedicaidMedicare fee ratio for primary care is associated with only a 21 percentageshypoint increase in Medicaid patient acceptance The average Medicaid reimbursement rate relative Medicare in 2008 was at 662 percent and the national average acceptance rate of new Medicaid patients by PCPs was 415 percent Therefore the implied elasticity of accepting primary care patients with respect to the payment rate is about 033 Excluding pediatricians it is 041
Data acquired from HSC 2008 Health Tracking Physician Survey and American Medical Association (AMA) master file
Econometric model (OLS)
Cunningha m 2011
Examine the effects of Medicaid payment generosity on access and care for adult and child Medicaid beneficiaries
Higher payments increase the probability of having a usual source of care and the probability of having at least one visit to a doctor and other health professional for Medicaid adults and produce more positive assessments of the health care received by adults and children However payment generosity has no effect on the other measures that we examined such as the probability of receiving preventive care or the probability of having unmet needs
Data from the National Surveys of Americarsquos Families (1997 1999 2002) and are linked to the Urban Institute Medicaid capitation rate surveys the Area Resource File and the American Hospital Association survey files
Econometric model (differenceshyinshydifference)
Shen amp Zuckerman 2005
Evaluation in California of whether the expansion of Medicaid managed care and a physician payment increase were associated with an increase over time in the percentage of physicians caring for Medicaid patients
Despite large increases in the use of MedishyCal
managed care and the implementation of MedishyCal physician fee increases between 1996 and 2001 there was no significant inshy crease in the percentage of primary care physicians accepting new MedishyCal patients or having any MedishyCal patients in practice over time
Dataset comprised of surveys of probability samples of primary care and specialist physicians in California in 1996 1998 and 2001 and AMA master file data
Chishysquare tests
Bindman et al 2003
Examine the impact of Californiarsquos Medicaid reshy imbursement for nursing homes which includes incentives directed at staffing
Consistent with the rate incentives and rational expectation behavior expected nursing home reimbursement rates in 2008 were associated with increased RN staffing levels in 2006 but had no relationship with licensed practical nurse and certified nursing assistant staffing The effect was estimated at 2 minutes per $10 increase in rate
Data from Medicaid master file for a total of 927 California freeshystanding nursing homes in 2006
Econometric model (twoshystage MLE)
Mukamel et al 2012
Assess the effects of Medicaid fee changes on physician participation enrollee access and shifts in the site of ambulatory care using several natural experiments in Maine and Michigan
The reimbursement changes included substantial percentage changes in fees however the value of the Medicaid fee improvements relative to the private market eroded very rapidly in the months following the interventions Implied elasticities ranged between 039 and shy0021
Dataset from Medicaid claims and enrollment data between 1988 and 1992
Program Overview amp Outcomes of communityshybased training
Coburn et al 1999
70
Final Report Health Practitioner Bonuses
Appendix B Additional Exhibits
Exhibit B1 Distribution of Primary Care Providers with PCIP Eligible Specialty by Age Sex and Year
Sex Age 2005 2006 2007 2008 2009 2010 2011
Male lt35 114 104 102 98 94 88 79
Male 35shy44 299 295 288 282 276 271 265
Male 45shy54 347 338 323 311 299 287 281
Male 55shy64 186 204 220 235 250 263 275
Male 65+ 53 59 66 74 82 90 100
Male Total 95911 101781 111971 116133 118868 121264 122048
Female lt35 215 205 206 204 201 197 189
Female 35shy44 368 367 359 353 347 342 340
Female 45shy54 315 312 304 298 291 284 278
Female 55shy64 91 104 117 128 142 155 168
Female 65+ 10 12 14 17 19 22 24
Female Total 59446 66054 78531 86972 93905 100930 106003
Missing SexAge
29633 33759 42945 49954 54580 60665 73232
Total 184990 201594 233447 253059 267353 282859 301283
Exhibit B2 Average Number of PCIP Eligible EampM Claims per PCP under Medicare by Specialty 2005shy2011
Specialty 2005 2006 2007 2008 2009 2010 2011
Internal Medicine 869 823 759 746 712 697 653
Family Medicine 722 694 651 649 631 626 605
Pediatrics 51 50 42 39 41 40 36
Geriatrics 989 1026 990 978 960 955 958
Clinical Nurse Specialist 86 85 77 87 97 107 118
Nurse Practitioner 258 257 230 219 219 228 228
Physician Assistant 125 128 120 121 124 134 140
71
Final Report Health Practitioner Bonuses
Exhibit B3 Average Allowed Charges ($) for the PCIP Eligible EampM Claims per PCP under Medicare 2005shy2011
Specialty 2005 2006 2007 2008 2009 2010 2011
Physicians
Internal Medicine $52896 $51477 $51149 $51737 $51438 $55188 $53641
Family Medicine $41019 $40557 $41279 $42369 $43075 $46833 $47163
Pediatrics $3008 $3028 $2705 $2533 $2771 $3055 $2835
Geriatrics $61243 $70593 $68845 $73829 $76317 $82230 $84453
NonshyPhysicians
Clinical Nurse Specialist $4219 $4446 $3974 $4883 $5824 $6841 $7890
Nurse Practitioner $12139 $13055 $11929 $12019 $12600 $14274 $14752
Physician Assistant $5724 $6122 $6064 $6333 $6765 $8133 $8831
Exhibit B4 Proportion of PCIP Eligible EampM Claims per 2011 PCIP Recipients by Specialty 2005shy2011
Specialty 2005 2006 2007 2008 2009 2010 2011
Physicians
Internal Medicine 45 45 44 44 41 42 41
Family Medicine 45 45 44 44 41 42 40
Pediatrics 45 47 47 47 45 41 39
Geriatrics 67 72 70 68 64 62 64
NonshyPhysicians
Clinical Nurse Specialist 64 66 64 60 57 57 56
Nurse Practitioner 66 66 69 68 65 67 68
Physician Assistant 55 56 56 55 51 52 50
Note the proportions are calculated out of all Medicare claims (excluding hospital inpatient ER drug and lab)
Exhibit B5 Average Number of PCIP Eligible EampM Claims per 2011 PCIP Recipients under Medicare by Specialty 2005shy2011
Specialty 2005 2006 2007 2008 2009 2010 2011
Physicians
Internal Medicine 1113 1088 1050 1057 1015 1035 1011
Family Medicine 808 785 752 756 729 752 743
Pediatrics 157 149 130 118 111 129 132
Geriatrics 1168 1237 1191 1187 1145 1181 1193
NonshyPhysicians
Clinical Nurse Specialist 375 384 361 346 335 382 389
Nurse Practitioner 384 403 369 392 405 457 492
Physician Assistant 251 266 260 268 266 301 301
72
Final Report Health Practitioner Bonuses
Exhibit B6 Average Allowed Charges for the PCIP Eligible EampM Claims per 2011 PCIP Recipients under Medicare 2005shy2011
Specialty 2005 2006 2007 2008 2009 2010 2011
Physicians
Internal Medicine $67863 $68281 $70869 $73505 $73494 $81629 $82500
Family Medicine $45958 $45878 $47781 $49440 $49827 $56350 $58004
Pediatrics $9336 $9051 $8460 $7864 $7631 $9836 $10450
Geriatrics $72412 $85046 $82732 $89548 $90821 $101283 $104284
NonshyPhysicians
Clinical Nurse Specialist $17795 $19741 $18922 $19279 $19557 $24141 $25405
Nurse Practitioner $19633 $21605 $19496 $22516 $24830 $29740 $32837
Physician Assistant $11628 $12949 $13457 $14496 $15128 $18717 $19363
Exhibit B7 Proportion of Allowed Charges for PCIP Eligible EampM Claims per 2011 PCIP Recipients 2005shy2011
Specialty 2005 2006 2007 2008 2009 2010 2011
Physicians
Internal Medicine 71 72 74 76 77 79 76
Family Medicine 73 75 77 77 78 80 77
Pediatrics 70 73 75 75 77 77 76
Geriatrics 77 87 88 89 89 90 89
NonshyPhysicians
Clinical Nurse Specialist 76 80 81 83 85 86 85
Nurse Practitioner 68 71 75 79 82 87 87
Physician Assistant 72 74 76 78 81 83 82
Note the proportions are of allowed charges for all Medicare claims (excluding hospital inpatient ER drug and lab)
73
Final Report Health Practitioner Bonuses
Exhibit B8 Distribution of the Number of NPs and PAs across HPSA and PSA regions
Profession Type 2005 2006 2007 2008 2009 2010 2011
Nurse Practitioners
Total Providers 23610 27450 35286 42144 46973 52472 59505
in HPSA x X 14171 16978 18858 20929 23045
in PSA 2946 3331 4139 4694 NA NA NA
in HPSA amp PSA x X 1638 1855 NA NA NA
PCIP 2011 Recipients 12267 14146 18008 23070 27698 25369 23707
in HPSA x X 7335 9344 11148 10178 9312
in PSA 1558 1754 2168 2571 NA NA NA
in PSA amp HPSA x X 861 1027 NA NA NA
Physician Assistants
Total Providers 21240 24439 30823 35593 39226 42871 47340
in HPSA x X 13246 15236 16889 18489 19828
in PSA 2166 2436 3098 3467 NA NA NA
in HPSA amp PSA x X 1230 1363 NA NA NA
PCIP 2011 Recipients 6168 7033 8852 10898 13038 11961 11288
in HPSA x X 3830 4732 5760 5226 4755
in PSA 760 839 1034 1217 NA NA NA
in PSA amp HPSA x X 408 494 NA NA NA
Note HPSA includes only full HPSA areas (data from Area Resource File and HPSA status data are not available prior to 2007) PSA status after 2008 is not applicable as 2008 was the final year of the PSA bonus
Exhibit B9a Distribution of Male Primary Care Physicians with PCIP Eligible Specialty by Age and Year
Note Primary care physicians include following specialties internal medicine family practice pediatrics geriatrics
74
Final Report Health Practitioner Bonuses
Exhibit B9b Distribution of Female Primary Care Physicians with PCIP Eligible Specialty by Age and Year
Note Primary care physicians include following specialties internal medicine family practice pediatrics geriatrics
Exhibit B10 Distribution of Male Primary Care NonshyPhysicians with PCIP Eligible Specialty by Age and Year
Note Primary care nonshyphysicians include following specialties PA NP and CNS
75
Final Report Health Practitioner Bonuses
Exhibit B11 Distribution of Female Primary Care NonshyPhysicians with PCIP Eligible Specialty by Age and Year
Note Primary care nonshyphysicians include following specialties PA NP and CNS
Exhibit B12 Average Number of PCIP Eligible EampM Claims Submitted by 2011 PCIP Recipients 2005 ndash 2011
76
2
0
7
3
4 0 4 6
Final Report Health Practitioner Bonuses
Exhibit B13 Allowed Charges for PCIP Eligible EampM Claims per 2011 PCIP Recipients 2005shy2011
Exhibit B14 Total Number of PCIP Eligible EampM Claims submitted by All Providers in the Control Group 2005shy2011
Specialty 2005 2006 2007 2008 2009 2010 2011
OBGYN 2597637 2612513 2728810 281347 2893204 3047849 3040383
Ophthalmology 5615010 5648040 6070483 597672 5832440 6361330 6164821
Pathology 46894 51364 54748 57005 57147 64078 63652
Urology 6964185 7202012 7571544 777585 7777728 8616096 8641898
Optometry 2464734 2550764 2758214 289154 2969244 3048668 3088461
Podiatry 7788889 8195973 8957163 973940 1001263 1064539 1089067
Psychology 42 11 27 64 1552 2440 2097
Neurophysiology 12609 13838 13858 15451 18142 17962 17714
77
shy
Final Report Health Practitioner Bonuses
Additional Regression Results
Exhibit B15 Impact of Medicare PCIP Policy on the Number of Primary Care Providers Who Have submitted any Medicare Claims (not necessarily under PCIP Eligible Services)
(2005shy2011)
Dependent Variable Number
of Providers per county All Providers (1) Physicians Only (2) Non Physicians Only (3)
PCIP Elig Specialty Indicator 6550 4054 4859
(3929) (4449) (2759)
Elig Specialty Ind x Post 2009 4408 3255 5710
(0503) (0758) (0482)
Post 2009 4588 3314 4187
(0505) (0593) (0350)
Median Income ($10k) 2306 2728 1643
(0424) (0513) (0241)
Percent in poverty 0466 0541 0360
(00535) (00653) (00332)
Population (10k) 0727 0771 0487
(00298) (00359) (00144)
Percent Population over 65 shy0406 shy0262 shy0337
(00407) (00502) (00280)
Unemployment Rate shy0660 shy0652 shy0493
(00522) (00621) (00392)
Intercept shy7242 shy7909 shy490
(4371) (4812) (3069)
Specialty Fixed Effects Yes Yes Yes
Year Fixed Effects Yes Yes Yes
State Fixed Effects Yes Yes Yes
N 140192 107526 95647
Adj Rshysq 0391 0396 0480
Note Robust standard errors are in parentheses + significance at 10 significance at 5 The number of observation is based on the number of counties the number of years and the number of provider specialties in each model (ie physicians include 4 primary care specialties and nonshyphysicians include 3 subshy specialties)
78
-
shy
Final Report Health Practitioner Bonuses
Exhibit B16 Impact of Medicare PCIP Policy on the Number of Primary Care Providers Who Met 60 PCIP Eligibility Threshold Each Year (2005shy2011)
Dependent Variable Number of
Providers per county
All Providers
(1)
Physicians Only
(2)
Non Physicians
Only (3)
PCIP Elig Specialty Indicator 2062 2194 6540
(1769) (2050) (0642)
Elig Specialty Ind x Post 2009 2322 1841 2776
(0341) (0543) (0243)
Post 2009 1252 0750+ 0994
(0348) (0427) (0143)
Median Income ($10k) 0549+ 0847 00118
(0305) (0380) (00942)
Percent in poverty 00663+ 00965 00165
(00379) (00473) (00137)
Population (10k) 0264 0298 00610
(00229) (00284) (000579)
Percent Population over 65 shy0155 shy0105 shy0127
(00277) (00355) (00111)
Unemployment Rate shy0252 shy0259 shy00864
(00357) (00444) (00166)
Intercept shy2281 shy2717 shy3777
(2029) (2419) (0775)
Specialty Fixed Effects Yes Yes Yes
Year Fixed Effects Yes Yes Yes
State Fixed Effects Yes Yes Yes
N 140192 107526 95647
Adj Rshysq 0174 0184 0119
Note Robust standard errors are in parentheses + significance at 10 significance at 5 The number of observation is based on the number of counties the number of years and the number of provider specialties in each model (ie physicians include 4 primary care specialties and nonshyphysicians include 3 subshy specialties)
79
-
Final Report Health Practitioner Bonuses
Appendix C Differenceshyinshydifference (DID) Methodology
C1 DID model and derivation for estimating the impact of PCIP policy
The following equation (Equation (1)) shows the econometric model to identify the effect of Medicare PCIP program on the magnitude of primary care EampM services
= + lowast + lowast 13 + lowast 13 lowast + lowast + (1)
We let Sit be the volume of eligible EampM services provided by provider i in period t Ti is an indicator for treatment group that takes the value 1 if the provider is a PCP and zero otherwise the variable is an indicator variable taking the value of 1 in the years when the PCIP policy is likely to impact the behavior of the providers and 0 otherwise the vector includes provider characteristics such as age and gender etc The term Eit represents random unobserved factors affecting EampM services
The DID methodology that we use here to identify the unbiased effect of PCIP policy on the volume of primary care EampM services is illustrated by considering two time periods preshyPCIP (pre) and postshyPCIP (post) periods with the latter being the years when the PCIP policy is likely to impact the behavior of the providers Equation (2) below shows the change in the volume of EampM services provided by PCPs between preshyPCIP and postshyPCIP periods holding other things constant
(2)
Similarly equation (3) below shows the change in the volume of EampM services provided by nonshyPCPs between preshyPCIP and postshyPCIP periods
(3)
Holding other provider characteristics (embedded in Xs) constant and assuming the changes in random shocks are zero in the limit for both the groups equation (4) below shows that the change in the magnitude of the primary care EampM services provided by PCPs due to the introduction of the Medicare PCIP program is 8
(4)
Thus the coefficient 8 from equation (1) represents an unbiased estimate of the effect of the Medicare PCIP policy on the volume of primary care EampM services Similar methodology can also be applied to estimate the effect of the PCIP policy on other outcomes of interest
C2 DID model and derivation for estimating the impact of HPSA bonus
Equation (5) below shows the empirical specification that we used to estimate the effect of HPSA status on the outcome variables discussed above
80
-0 minus -23 = + + 4 -0 minus -235 lowast + -0 minus -23
minus = + 466-0 66-23 66-0 minus
66-235 lowast + 66-0 minus 66-23
(-0 minus -23) minus (66-0 minus 66-23) =
13tit
7- = +
7- =
7- = + + +
7- = +
Final Report Health Practitioner Bonuses
The model is specified based on the physician level data in each year Here the dependent variable Dict is one of the other potential outcomes of interest of a primary care physician i in county c at time t H SA ict is an indicator of whether physician irsquos county is a HPSA at time t
is an indicator variable taking the value of 1 if the physicianrsquos county ever gained the HPSA status (from a nonshyHPSA) during the sample period and zero otherwise is an indicator variable taking the value of 1 if the physicianrsquos county ever lost the HPSA designation during the sample period and zero otherwise the vector ict includes variables
reflecting the physician characteristics their geographic locations etc and t is a vector of timeshyspecific fixed effect terms
The term Eict represents random unobserved factors affecting outcomes If the change of HPSA status is associated with any changes in the volume of services provided by primary care physicians in those areas then we should expect estimated values of 82 and λ2 in equation (5) will reflect them If the outcome of interest is the volume of services then a positive significant estimated value of 82 would imply higher volume of services due to gaining HPSA designation
For simplicity assume that we have physicians in the following four types of counties counties that are always HPSA (type C1) counties that are always nonshyHPSA (type C2) counties that gained HPSA status and remained HPSA afterwards (C3) and counties that lost HPSA status and remained nonshyHPSA afterwards (C4) Also consider the number of EampM claims submitted under Medicare as the outcome variable of interest Now for given values of and E let us focus on the first 7 terms of the above equation for a representative provider in each of these 4 types of counties
Equation (6) shows the expression of the model excluding the last three terms for County Type C1 (always HPSA)
(6)
Equation (7) shows the expression of the model excluding the last three terms for County Type C2 (always nonshyHPSA)
(7)
Equation (8) shows the expression of the model excluding the last three terms for County Type C3 (gained HPSA status) when these counties have HPSA status
(8)
Equation (9) shows the expression of the model excluding the last three terms for County Type C3 (gained HPSA status) when these counties have NonshyHPSA status
(9)
81
7- = + lowast 89- + lowast 1389- + lowast 89- lowast 1389- + lt lowast 13=13gt89- + lt lowast89- lowast 13=13gt89- +
lowast + lowast + -(5)
1389ic 13=13gt8Aic
Final Report Health Practitioner Bonuses
Thus ( + ) in equation (6) shows the estimated average number of claims per physician in HPSA counties (after controlling for other factors) while in equation (7) represents the estimated average number of claims per physician in nonshyHPSA counties Thus captures the persistent difference in the average number of claims between the HPSA and nonshyHPSA counties
On the other hand comparing equation (8) and (9) the model indicates that in counties that gained the HPSA status ( + 82) shows the difference between the estimated average number of claims per physician when the counties have the HPSA status and the average number of claims when they do not have the HPSA status However already captures the persistent difference in the average number of claims between the HPSA and nonshyHPSA counties Therefore the parameter 82 shows the additional impact of HPSA status on the average number of claims per physician in the counties that gained HPSA status If gaining HPSA status encourages physicians to increase the availability of primary care services then we expect 82 to be positive
Similarly equation (10) shows the expression of the model excluding the last three terms for County Type C4 (lost HPSA status) when these counties have HPSA status
Type C4 and HPSA
Dict = + + A1 + A2 (10)
Equation (11) shows the expression of the model excluding the last three terms for County Type C4 (lost HPSA status) when these counties have NonshyHPSA status
Dict = + A1 (11)
Once again comparing equation (10) and (11) the model indicates that in counties that lost the HPSA status ( + A2) shows the difference between the estimated average number of claims per physician when they have the HPSA status and the average claims when they do not have the HPSA status However already captures the persistent difference in the average number of claims between the HPSA and nonshyHPSA counties Therefore the parameter A2 shows the additional impact of HPSA status on the average number of claims per physician in the counties that lost HPSA status If losing the HPSA status induces physicians to decrease the availability of primary care services then we expect A2 to be positive implying higher average claims when the counties had the HPSA status
82
1 = A1( lowast (1 minus )) = 04( lowast (1 minus ))
7 = Fgt(0(1 minus 0)) minus 1 lowast G0
HIJKLIJM13N7JJ = Fgt(1(1 minus 1)) = 7 + 1 lowast G1
Final Report Health Practitioner Bonuses
Appendix D Simulation Methodology
Method of Calculating the Predicted Proportion of Officeshybased Physicians Accepting New Medicaid Patience as a Function of the MedicaidshytoshyMedicare Fee Index
Consider that
I0 is the observed value of the MedicaidshytoshyMedicare fee index 2008
I1 is the new value of the MedicaidshytoshyMedicare fee index (eg I1 could be 1 percent or 10 percent or x percent higher than I0 where x is a chosen value)
P0 is the observed proportion of officeshybased physicians accepting Medicaid patients in 2011
P1 is the predicted proportion of officeshybased physicians accepting Medicaid patients after the x percent increase in MedicaidshytoshyMedicare fee index
M1 is the estimated marginal effect of the MedicaidshytoshyMedicare fee ratio (2008) = 04 (reported in the study)
B1 is the estimated logit coefficient of the MedicaidshytoshyMedicare fee ratio (2008)
Given the fact that marginal is equal to the estimated logit coefficient times P times (1shyP) where P is the mean proportion of officeshybased physicians accepting Medicaid patients in the sample equation (12) shows the estimated logit coefficient of the MedicaidshytoshyMedicare fee ratio (2008)
(12)
Since Decker (2012) reports that P is 0694 this implies B1 is equal to 04(0694(1shy0694)) which is approximately equal to 188
Letrsquos name the part of the estimated logit model which incorporates the effect of other independent variables (other than MedicaidshytoshyMedicare fee ratio) and the intercept term in the model as ldquoOther Effectsrdquo or OE Equation (13) below shows the expression of ldquoOther Effectsrdquo (OE) based on a given value of P0 and a known value of B1 (where ldquolnrdquo is the natural log)
(13)
Then based on the estimated logit model we can predict the logshyodds of the proportion of officeshybased physicians accepting new Medicaid patients for a new value of the MedicaidshytoshyMedicare index (say I1) Equation (14) shows the logshyodds of the proportion of officeshybased physicians accepting new Medicaid patients
(14)
83
1HIJKLIJOH13O13HK13gt = 1 = [1 + X QI(RSTUlowastV ]Z)W
Final Report Health Practitioner Bonuses
Therefore equation (15) shows the implied predicted proportion of officeshybased physicians accepting new Medicaid patients (where ldquoexprdquo is the exponential function operation)
(15)
Example Based on Decker (2012)
(i) The national average of observed proportion of officeshybased physicians accepting Medicaid patients in 2011 (P0) is 0694
(ii) The Observed value of the MedicaidshytoshyMedicare fee index (I0) 2008 is 0742
We have already derived that the logit coefficient of the MedicaidshytoshyMedicare fee ratio (B1) is 188 This implies that OE is approximately 0576 (based on equation (13))
Now consider a 10 percent increase in the MedicaidshytoshyMedicare fee index from the national average in 2008 This implies that the new value of the MedicaidshytoshyMedicare fee index (I1) is 08162
This further implies that the predicted logshyodds of the proportion of officeshybased physicians accepting new Medicaid patients is equal to about 0958 (using equation (14))
Thus using the expression in equation (15) the predicted proportion of officeshybased physicians accepting new Medicaid patients (P1) is equal to 0723 or 723 percent
The same methodology is applied while calculating the predicted proportions for each state and the US in Exhibit 25
84
- Health Practitioner Bonuses and Their Impact on the Availability and Utilization of Primary Care Services Final Report
-
- Table of Contents
- Table of FiguresExhibits
- Acknowledgments
- Executive Summary
-
- Overview
- Key Findings
-
- 1 Impact of the Medicare Incentive Payment for Primary Care Providers (PCIP)
- 2 Impact of the Physician Shortage Area (PSA) bonus
- 3 Impact of the Health Professional Shortage Area (HPSA) Bonus
-
- Conclusions
-
- Introduction and Purpose Of The Study
- Literature Review
-
- A Effect of Earnings on the Supply of Primary Care Services and Providers Role of Medicare Primary Care Bonuses
-
- 1 Effects of Earnings on Specialty Choice by Physicians
- 2 Effects of Earnings on Labor Supply of Health Care Workforce
- 3 Effects of Earnings on the Volume of Primary Care Services
-
- B Financial Incentives for Primary Care Providers in Underserved Areas
- C Impact of the Increase in Medicaid Reimbursement Rate Relative to the Medicare Rate
-
- 1 Systemic Change in Medicaid Reimbursement Rates in All States
- 2 Stateshyspecific Experience on Changes in Medicaid Reimbursement Rates
-
- Conclusions
-
- Modeling the Impact of Medicare Incentive Payment for Primary Care Providers
-
- A Study Design Overview
- B Data Sources and Variables
-
- 1 Main Data Sets
- 2 Trends in Key Outcome Variables
-
- C Econometric Framework
- D Main Results
-
- 1 Impact of PCIP Policy on Number of Eligible Providers
- 2 Impact of PCIP Policy on Number of Claims for EampM Services
- 3 Impact of PCIP Policy on Allowed Charges for EampM Services
-
- Analyzing the Impact of Financial Incentives for Primary Care Providers in Shortage Areas
-
- A Background
- B Impact of the PSA Bonus on Primary Care Supply
- C Impact of the HPSA Bonus on Primary Care Supply
-
- Modeling the Impact of the Increase in Medicaid Reimbursement Rate Relative to the Medicare Rate
-
- A Study Design Overview
- B Simulation Exercise
-
- Conclusions
- Appendices
- Appendix A Bibliography and Literature Matrix
- Appendix B Additional Exhibits
-
- Additional Regression Results
-
- Appendix C Differenceshyinshydifference (DID) Methodology
-
- C1 DID model and derivation for estimating the impact of PCIP policy
- C2 DID model and derivation for estimating the impact of HPSA bonus
-
- Appendix D Simulation Methodology
-
- Example
-
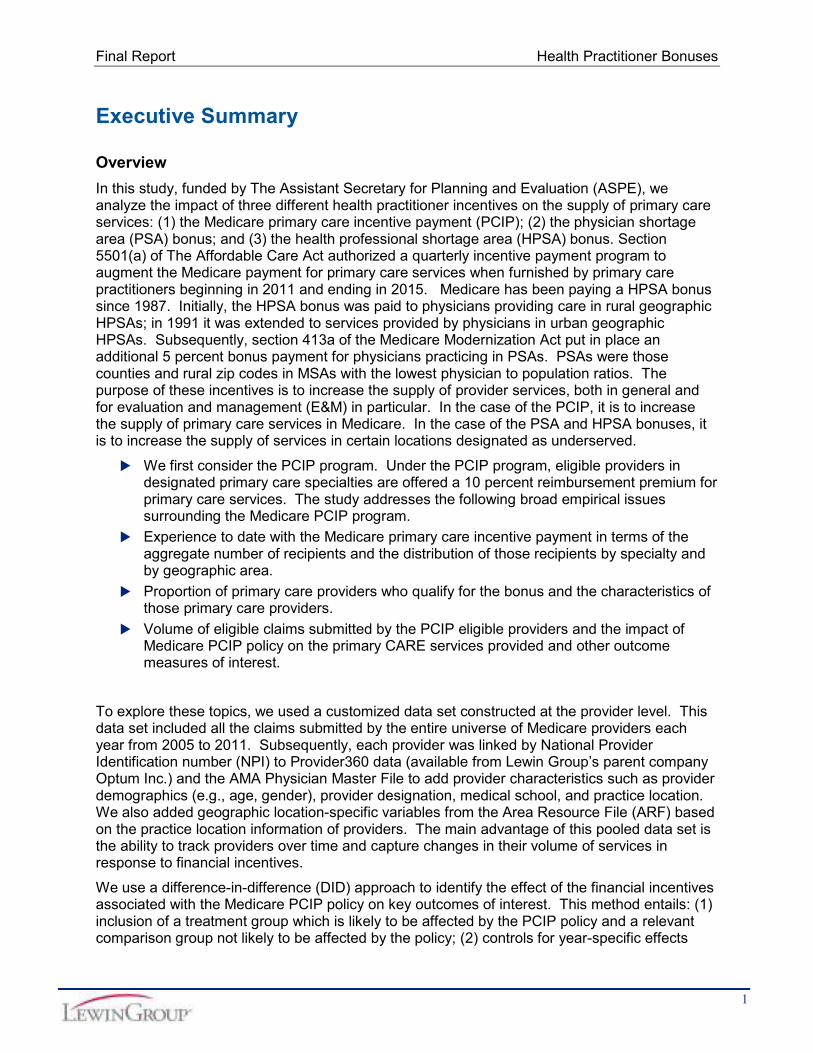
Final Report Health Practitioner Bonuses
common to both groups and (3) an interaction of the treatment group and the year effects to capture the distinct impact of the policy on the treatment group The model also controls for provider demographics and regional characteristics One advantage of the DID estimation approach is that it enables us to disentangle the net impact of the 10 percent PCIP policy from changes that coincided with the PCIP policy affecting both the treatment and comparison group
Policy makers have long been concerned about patient access to health care particularly primary care in underserved or shortage areas We also focus on two additional financial incentive programs Health Professionals Shortage Area (HPSA) bonus and Physician Shortage Area (PSA) bonus implemented in an attempt to improve access in shortage areas These programs offer a higher rate of reimbursement in Medicare for eligible providers should they provide services in designated shortage areas More specifically we examine the following issues surrounding HPSA and PSA bonus
The distribution of HPSA bonus recipients the overlap between HPSA and Medicare primary care incentive payment (PCIP) and the overlap between the HPSA and PSA bonus recipients
Impact of HPSA bonus on the number of primary care providers and subsequent impact on the volume of primary care services
Impact of PSA bonus on the number of primary care physicians and subsequent impact on the volume of primary care services
Finally we examine the existing evidence from the literature on the variation in Medicaid reimbursement rates relative to the Medicare rates to inform the impact of the Medicaid parity provision in the ACA We describe the variation in Medicaid reimbursement rates relative to the Medicare rates both for primary care and for all services across US states during the period 2008shy2012 Based on the empirical results from the PCIP analysis we perform an exercise to simulate the effect of a 10 percent increase in the MedicaidshytoshyMedicare fee index on the proportion of US officeshybased physicians accepting new Medicaid patients across all states
Key Findings
1 Impact of the Medicare Incentive Payment for Primary Care Providers (PCIP)
Number of Medicare Providers
Our estimates suggest that the number of Medicare providers with a PCIP bonusshyeligible specialty and at least one PCIP eligible claim increased annually by about 28 providers per county per year due to the Medicare PCIP bonus policy This represents a sizeable increase of almost 19 percent since there were about 15 providers per county per specialty per year under a PCIP bonus eligible specialty during the 2005shy2011 period When restricted to primary care physicians with a PCIP eligible specialty the estimated increase in the number of physicians is approximately 10 percent in response to the PCIP policy (ie elasticity of the number of primary care physicians with respect to the payment is about 1)1
1 The increase in the number of physicians with a PCIP eligible specialty attributable to the policy is about 2 per
county per year This is almost 10 percent of the average number of primary care physicians in a given PCIP eligible specialty per county per year (average is almost 19) Therefore given that PCIP policy provides 10
2
Final Report Health Practitioner Bonuses
Evaluation amp Management (EampM) Eligible Claims
The estimated impact of the PCIP policy on the volume of primary care services measured by the volume of claims is somewhat mixed
More specifically there were more PCIP eligible EampM claims submitted per provider in a particular claim type 25 minute office visits for established patients Specifically on average there was a 7 percent increase in the number of 25 minute office visits claims due to the PCIP policy Thus the implied elasticity of the number of 25 minute office visits with respect to the incentive payment is about 07 Hence it appears that the PCIP may have induced a substitution toward slightly longer visits for established patients
For PCIP eligible EampM claims in general the estimates from the DID model indicate that on average primary care providers with PCIPshyeligible specialties submitted fewer claims (per provider per year) related to PCIPshyeligible EampM services in response to the Medicare PCIP policy23
The positive impact of the PCIP bonus policy on the volume of EampM claims associated with 25 minute office visits for established patients is much stronger for providers near the PCIP eligibility threshold4 For the primary care providers near the PCIP eligibility threshold there was almost a 15 percent increase in the number of claims for 25 minute visits due to the PCIP policy
Allowed Charges for EampM Services
We estimated no significant incentive payment impact on allowed charges per provider for the full sample of providers However for the sample of providers who were near the PCIP eligibility threshold in 20095 we found that per provider charges increased by about $5611 annually in response to the policy This estimated effect represents about 93 percent of the mean allowed charges ($60235) per provider per year (ie the implied elasticity of allowed charges which do not include the bonus payment with respect to the payment is about 093)
percent incentive payment the implied elasticity of the number of physicians in PCIP eligible specialty with respect to the payment is about 1
2 Not all primary care providers are eligible for Medicare primary care incentive payments In summary primary care
physicians (with internal medicine family practice pediatrics and geriatrics specialty) who have at least 60 percent of the practitionerrsquos allowed charges under the Medicare physician fee schedule (excluding hospital inpatient care and emergency department visits) are for primary care services The PCIP eligible primary care services are defined by specific EampM codes Medicare PCIP is also provided to physician assistants nurse practitioners and clinical nurse specialists who also meet the similar eligibility criteria
3 Note that total eligible claims increased Claims per provider declined potentially because additional providers
were induced to submit eligible claims 4
For the purpose of our analysis we consider the primary care physicians (with the PCIP eligible specialty) who have 50 percentshy65 percent of their services for PCIP eligible EampM services (defined by specific EampM codes) to be near the eligibility threshold We apply the similar method to select nonshyphysicians (physician assistants nurse practitioners and clinical nurse specialists) near the eligibility threshold
5 The determination of the eligibility of providers in the first year (2011) of the PCIP is based on the extent of their
PCIP eligible services in 2009 Besides the announcement of the PCIP program was made in 2010 Thus we assumed that the providers with Medicare PCIP eligible specialties would be potentially responsive to the PCIP program as early as year 2010 and alter their behavior Subsequently it is more meaningful to examine providers who were near the PCIP eligibility threshold in 2009 which is the year just before the policy effect is expected to influence
3
Final Report Health Practitioner Bonuses
2 Impact of the Physician Shortage Area (PSA) bonus
Number of Medicare Providers
The number of providers with PSA bonusshyeligible specialties was estimated to increase by about 1 in PSA areas during the PSA period compared to the number of providers in nonshyPSA areas This represents a sizeable increase as there were about 6 primary care providers on average in PSA areas
EampMshyEligible Claims
We found that on average physicians with bonusshyeligible specialties who were located in PSA areas were estimated to have about 50 more claims submitted per year during the PSA period compared to providers with the same specialty who were located in nonshyPSA areas Given that these physicians have on average about 644 claims per year for primary care EampM services the impact of PSA bonus is not negligible
Allowed Charges for EampM Services
Our estimates indicate that on average physicians with PSA bonusshyeligible specialties located in PSA areas did not experience a statistically significant increase in total annual allowed charges per provider per year for EampM services compared to those in nonshyPSA
6 areas
3 Impact of the Health Professional Shortage Area (HPSA) Bonus
EampM Eligible Claims
We focused only on the behavior of primary care physicians who are eligible for a HPSA bonus We found that on average Medicare primary care physicians tend to submit about 17 more EampM claims annually specifically due to the gain of full HPSA status7
Allowed Charges for EampM Services
Medicare primary care physicians who are located in counties that ever lost primary care HPSA status tend to have about $1380 more allowed charges annually before the location lost full HPSA status
Conclusions
The Affordable Care Act includes two key provisions regarding reimbursement to primary care providers ) (a) it provides a 10 percent incentive payment under the Medicare PCIP program to eligible providers (effective January 1 2011) and (b) it raises the Medicaid primary care reimbursement rate at least up to 100 percent of the Medicare rate
We find that as a result of the Medicare incentive payment the number of Medicare PCPs has increased on average by about 28 providers per county annually in 2010 and 2011 Also the number of primary care physicians with PCIP eligible specialty increased by about 10 percent in
6 Although the number of EampM claims went up due to the PSA bonus it may be that within EampM services some
services experienced an increase in allowed charges due to the PSA bonus while others experienced a decrease accounting for the overall lack of impact
7 Health Resource and Services Administration (HRSA) publishes Area Health Resource File (ARF) that includes
HPSA status for each county within the US For the purpose of our analysis we focus on primary care HPSA status The ARF data classifies counties as full primary care HPSA if the whole county is considered as a HPSA
4
Final Report Health Practitioner Bonuses
response to the 10 percent incentive payment under the PCIP policy (ie elasticity of the number of primary care physicians with respect to the incentive payment is about 1) Eligible claims for some types of PCIP eligible EampM services and associated allowed charges have also increased For example on average there was a 7 percent increase in the number of claims for 25 minute office visits due to the PCIP policy On the other hand in response to the PCIP policy there was a 93 percent increase in the average allowed charges (for eligible services) among primary care providers with PCIP eligible specialties
The reader should exercise some caution in interpreting these results however The behavioral response to the PCIP was observed in our data only for one year The relatively short period may have resulted in insufficient time for a full provider behavioral response In addition the legislation provided for a program of only limited duration Some providers may have chosen explicitly or implicitly not to change their behavior for a program of limited duration
In addition we find that Medicare providers were attracted to PSA areas through the PSA bonus and submitted 78 percent more EampM claims annually during the PSA period Gaining HPSA status also generated an additional 17 EampM claims submitted by primary care physicians with HPSA bonusshyeligible specialties
The reader is again encouraged to exercise some caution in interpreting the results for the PSA bonus Because the criteria for the bonus include the actual supply of providers there is a risk that the results may be biased Though the methods we employ attempt to minimize the potential impact of this type of bias we cannot be completely sure that the results are unaffected by this
Finally we document the variation in Medicaid reimbursement rates relative to the Medicare rates both for primary care and for all services across US states during the period 2008shy2012 using the existing body of evidence Using the empirical results from our PCIP analysis we also perform an exercise to simulate the effect of a 10 percent increase in the MedicaidshytoshyMedicare fee index on the proportion of US officeshybased physicians accepting new Medicaid patients across all states The simulation suggests that a 10 percent increase in MedicaidshytoshyMedicare fee ratio would increase the US average of officeshybased primary care physicians accepting new Medicaid patients from 662 percent to 728 percent Again however caution is warranted in a literal interpretation of this result as it is based on an extrapolation from a different program
Introduction and Purpose Of The Study The Assistant Secretary for Planning and Evaluation (ASPE) has contracted with The Lewin Group to examine the role of physician bonus and supplemental payment programs in increasing the supply of primary care providers (PCP) and the access of patients to their services
The Congressional Budget Office has estimated that the implementation of the Patient Protection and Affordable Care Act (ACA) of 2010 will increase the number of nonelderly people who have health insurancemdashby about 13 million in 2014 20 million in 2015 and 25 million in each of the subsequent years through 2024 (CBO 2014)8 Because those with insurance typically use more services than those without insurance this increase in coverage will most likely result in additional pressure on a health care delivery system9 To address
8 CBO Report (February 2014) httpwwwcbogovsitesdefaultfilescbofilesattachments45010shybreakoutshy
AppendixBpdf 9
Manning WG Newhouse JP Duan N Keeler EB Benjamin B Liebowitz A et al (1988) Health insurance and the demand for medical care Evidence from a randomized experiment Santa Monica CA RAND Corporation
5
Final Report Health Practitioner Bonuses
concerns about maintaining an adequate supply and distribution of primary care services the ACA includes provisions that provide temporary financial incentives to primary care providers
1 Section 5501 provides that from January 1 2011 through December 31 2015 under Medicare eligible primary care practitioners will receive a 10 percent supplemental payment for primary care services they provide as defined by existing Evaluation and Management (EampM) codes under the new Medicare Primary Care Incentive Program (PCIP)
2 Section 1202 of the Act provides that for the period January 1 2013 to December 31 2014 under Medicaid primary care services provided by primary care physicians must be paid at rates no less than Medicare rates for primary care physicians
The Medicare primary care incentive payment is available to the eligible primary care practitioners for services provided under selected categories of EampM codes An eligible primary care practitioner is a physician nurse practitioner clinical nurse specialist or physician assistant who satisfies the following criteria (i) enrolled in Medicare with primary specialty designation of family practice internal medicine pediatrics and geriatrics and (ii) at least 60 percent of the practitionerrsquos allowed charges are for primary care services10 This temporary 10 percent incentive payment is made on a quarterly basis PCIP recipients with a family medicine Medicare specialty designation received an average incentive payment of $3450 ($212987540 61728) during the first year of the program11 This payment is equivalent to a two percent ($3450$201512) increase in annual income 12
In addition Medicaid payment rates for primary care services delivered by primary care physicians must be no less than Medicare rates for the same services in 2013 and 201413
Given the variability of Medicaid payments across states this could be a substantial boost in payments for physicians in some states and less so in others Medicare has been providing bonus payments to physicians in designated shortage areas to make these areas more attractive for physician practices The Health Professional Shortage Area (HPSA) bonus and the Physician Shortage Area (PSA) bonus are specifically intended to address the geographic distribution of physicians
The main purpose of this report is to present the key findings from our examination of the proposed research questions the main data sources used for the empirical analysis the methodologies used to identify the impact of payment incentives and detailed discussion of our analytical findings
10shyAllowed charges refer to all charges under the physician fee schedule excluding hospital inpatient care drug laboratory and emergency department visits (source httpwwwcmsgovMedicareMedicareshyFeeshyforshyServiceshyPaymentPhysicianFeeSchedDownloadsPCIPshy2011shyPaymentspdf)
11shySource httpwwwcmsgovMedicareMedicareshyFeeshyforshyServiceshyPaymentPhysicianFeeSchedDownloadsPCIPshy2011shyPaymentspdf
12shyACA Medicare PCIP Practitioners (MDs and Non‐MDs) with primary care specialty designation meeting a threshold of 60 percent of primary care serviceswill receive 10 percent bonus on the Medicare paid amount from CY 2011 to CY 2016 $558 million in 2011 translates to an average of 2 percent increase in annual income for primary care physicians
13shyThe Administration is proposing to extend this payment through Calendar Year 2015 and make it available to primary care nurse practitioners and physician assistants who practice independently (add citation to 2015 Budget in Brief when it becomes available)
6
Final Report Health Practitioner Bonuses
The report covers the three main categories of the empirical analysis
1 Examine the magnitude and the distribution of Medicare primary care incentive payments and quantitatively estimate the impact of the bonus on the supply of PCPs and their services
2 Assess the geographic distribution of HPSA bonus recipients understand the overlap between HPSA and Medicare primary care incentive payment (PCIP) and overlap between the HPSA and PSA bonus recipients and quantitatively estimate the impact of the bonuses on the supply of PCPs and their services
3 Explore any evidence of the impact of changes in state Medicaid primary careshyreimbursement rates on the supply of primary care servicesshy
A substantial portion of the empirical undertaking entailed analyzing existing Medicare claims data to understand the magnitude of these supplemental payments under Medicare and to estimate their impact on the supply of PCPs and their services In this report we provide a detailed description of the data we use our analytical approach and a thorough discussion of our analytical findings The discussion in the report is organized as follows section II presents findings from the review of relevant existing literature in section III we lay out the empirical methodology and main evidence related to the impact of the Medicare 10 percent primary care incentive payment section IV describes the empirical analysis of the HPSA and PSA bonuses section V presents the findings regarding the impact of higher primary care physician fees under Medicaid finally section VI is the conclusion
Literature Review The Lewin Group has reviewed the existing key health and labor economics literature for evidence regarding the potential impact of financial incentives on the supply of health care providers and services The objectives of the literature review were to (1) document the likely quantitative range of the effects of earnings increases (in the form of bonuses or other financial incentives) on the supply of primary care providers and services nationally or in underserved areas and (2) explore the likely impact of the increase in Medicaid reimbursement rates for primary care providers on the volume of these providers and their services under Medicaid This work can contribute to the broader understanding of provider behavior and the type and level of financial incentives that are likely to achieve the desired supply responses
The literature that directly examines the Medicare bonuses and resultant impact on the supply of primary care providers and services is very limited To address this limitation we expand our focus to include the labor economics literature This broadened search then includes studies that address the behavioral impact of earnings on medical workforce In what follows we discuss the major findings from the existing literature on the effects of financial incentives (such as Medicare bonuses and increased Medicaid reimbursement rates) on primary care workforce and services Overall the scope of the literature review can be classified under the following categories
1 Effects of earnings on (a) specialty choice by physicians (b) the labor supply of physicians and nurses in terms of work hours and labor force participation and (c) the volume of services
2 Effects of financial incentives on the supply and retention of primary care providers in designated underserved areas (HPSAPSA) and statesrsquo experiences thereof
7
Final Report Health Practitioner Bonuses
3 Impact of increases in Medicaid reimbursement rates on the supply of primary care providers and the volume of patient care under Medicaid on a state by state basis as well as systemic effects
There is considerable concern regarding a potential future primary care physician shortage and potential constriction of access to primary care The availability of primary care is particularly important for public payer programs such as Medicaid and Medicare A recent Medicare Payment Advisory Committee (MedPAC) data book indicates that six percent of Medicare beneficiaries were looking for a new primary care physician in 2011 In addition among those who tried to get an appointment with a new physician in 2011 35 percent reported having difficulties14
It is worth noting that several studies (Bodenheimer et al 2007 Vaughn et al 2010) illustrated the large income gap between primary care providers and other specialties Therefore whether a very small increase in annual income through the Medicare PCIP would significantly influence provider behavior remains unclear In addition the time limited nature of the provisions may prove to be a major deterrent to a change in provider behavior Any evidence around time‐limited bonus programs will likely show only a partial behavioral response from the targeted population Lower bound take up rates should be expected in these programs because medical students and early career providers are unlikely to base career choices on temporary policy changes
Historically the Medicaid program has reimbursed physicians at a much lower rate than Medicare paying just 66 percent of Medicare rates on average (Cunningham 2011) Cunningham (2011) also documents that due to the low Medicaid reimbursement rates in several states fewer physicians accept Medicaid patients In 2013 and 2014 ACA increases Medicaid reimbursement rates for certain services provided by primary care physicians to 100 percent of Medicare rates Given the variability of Medicaid payments across states this will be a substantial boost in payments for physicians in some states and less so in others Current differential payment levels across states and any changes in payments over time can be exploited to examine the effect of raising Medicaid primary care reimbursement rates on the provision of primary care providers and services
The discussion of the literature review is organized as follows section A reviews the literature on the effect of earnings on the supply of primary care providers and services section B discusses the evidence regarding the impact of financial incentives for primary care providers in underserved areas section C examines the empirical evidence on the impact of stateshyspecific changes in Medicaid reimbursement rates and section D concludes with a summary of the major findings from the literature and their implications for understanding the allocative effects of bonus payments and other financial incentives
A Effect of Earnings on the Supply of Primary Care Services and Providers Role of Medicare Primary Care Bonuses
The ACA stipulates multiple programs with the aim of increasing the supply and utilization of primary care services These programs all operate on the assumption that financial incentives specifically directed toward increased earnings are an effective way to promote an increase in primary care services and primary care providers While these assumptions are based upon established economic theory the evidence as to the programsrsquo effectiveness in practice is mixed
14 MedPAC ldquo A Data Book Health Care Spending and the Medicare Programrdquo June 2012 p 97
8
Final Report Health Practitioner Bonuses
While there is general consensus that expected earnings are a key driver of medical specialty choice (Bazzoli 1985 Nicholson and Propper 2011 Nicholson 2002 Vaughn et al 2010) the evidence regarding the effectiveness of programs designed to attract medical students in certain specialties is inconclusive Vaughn et al (2010) argue that programs designed to affect the number of medical students choosing primary care have largely failed while others (Fournier amp Henderson 2005 Lynch 1998 Ramsey 2001) argue that these programs have had a wide range of results that can be attributed to each programsrsquo individual composition
The effect of earnings on labor supply in relation to the healthcare workforce is also a complex issue There is wide consensus that increased earnings lead to an increase in the labor supply of health services providers (Askildsen and Baltagi 2002 Baltagi 2005 Rizzo and Blumenthal 1994) but the reported magnitude of this increase in labor supply varies widely Values reported for the wage elasticity of the primary care labor supply range from 023 to 08 Furthermore the effect of income on retirement decisions of physicians is not well understood
Finally the effect of earnings on the volume of primary care services is a related but distinct issue Much like its counterparts the effect of earnings on the volume of services is recognized to be significant and positive but reported effects range widely from a 10 percent reduction in Medicare fees leading to 18 percent to 66 percent reduction in the volume of office visits to 10 percent higher fees for primary care services raising the primary care EampM visits by 88 percent (Hadley et al 2009 Reschovsky et al 2012)
1 Effects of Earnings on Specialty Choice by Physicians
While the estimated effect of earnings on specialty choice is present and significant the magnitude of this income effect and its relative importance as compared to other factors in deciding a specialty is contentious Recent data from the residency match program in the US reveals that among 16875 US Medical school senior applicants in 2012 about 355 percent were matched to primary care specialties such as internal medicine family practice and pediatrics15 In 2010 the proportion matched to primary care (internal medicine family practice and pediatrics) was 341 percent of 16427 US Medical school senior applicants 16 Between 1995 and 2006 the total number of physician residents in the US in primary care training programs increased by 6 percent from 38753 to 40982 (Exhibit 1) Physician residents in specialty care increased by about 8 percent during the same period
Exhibit 1 Number of Physicians in Residency Programs17
Type of Resident Number of Resident Physicians
Percentage Change 1995 2006
Primary Care Residents 38753 40982 575
Specialty Care Residents 59282 63897 778
All Physician Residents 97416 104526 730
15 Source NRMP Results and Datashy2012 Main Residency Match (httpwwwnrmporgdataresultsanddata2012pdf)
16 US Medical school seniors who are matched into internal medicine can subspecialize later on in nonshyprimary care
specialty such as cardiology endocrinology oncology etc 17
Steinwald B Primary Care Professionals Recent Supply Trends Projections and Valuation of Services Statement in Testimony before the Senate Committee on Health Education Labor and Pensions Washington (DC) GAO 2008 Available from httpwwwgaogovnewitemsd08472tpdf
9
Final Report Health Practitioner Bonuses
Nicholson and Propper (2011) argue that the rate of return to medical training and specialization is the key driver of choosing medical occupation and the choice of specialty within the area of medicine The gap in median income between primary care physicians and specialists is wellshypublicized For instance using crossshysectional earnings data from 2008 Vaughn et al (2010) report that the average primary care physician could expect to earn $25 million over his lifetime net of income taxes living expenses and education costs versus $52 million for a cardiologist Berenson et al (2007) report that according to the Medical Group Management Association (MGMA) between 2000 and 2004 median physician income for all primary care increased by 99 percent while average incomes of all nonshyprimary care specialists increased by 158 percent Arguably given the income gap raising the payment rate for primary care services relative to other services would impact the number of primary care physicians and raise the amount of primary care services they provide Moreover if the reimbursement rates vary by geographic region this strategy can also affect the geographic distribution of services of primary care services
In a related study Bodenheimer (2007) attempts to explain this disparity in incomes The author notes that the ResourceshyBased Relative Value Scale which was initially designed to reduce the inequality between fees for office visits and for procedures has failed to reduce the primary carendashspecialty income gap He finds that this failure is due to four factors (1) the volume of diagnostic and imaging procedures has increased more rapidly than the volume of office visits (2) the process of updating the relative values units (RVUs) 18 associated with covered procedures is heavily influenced by the recommendations of the Relative Value Scale Update Committee (RUC) a majority of whose membership are specialists (3) Medicarersquos formula for controlling physician payments penalizes primary care physicians and (4) private insurers tend to pay for procedures at higher rates than office visits relative to Medicare They conclude that the program was designed with the correct motives but ultimately was weak and cannot achieve its purpose as currently formulated Furthermore incentives that favor specialists remain in the private market
Nicholson (2002) also provides econometric evidence that the disparity in the expected earnings between primary care and other specialties has a significant influence on medical studentsrsquo decisions to choose primary care or another specialty He observes that there is a persistent excess supply of residents to most specialties with relatively high lifetime earnings and a persistent excess demand for residents in primary care with relatively low lifetime earnings His main contribution is to examine how differences in expected earnings affect the number of students who desire to enter a specialty rather than the number who actually enter the specialty The study finds that the income elasticity ranges from 103 in family practicepediatrics to 220 in radiology19 In other words a 1 percent increase in the lifetime earnings of primary care providers such as family practitioners will increase the number of students ranking family practice as the most preferred choice by 1 percent which can be translated into an increase of equal magnitude in the supply of family practitioners
18 RVU is a key component of the formula used under Medicare Physician Fee Schedule (PFS) to calculate payment
rates for an individual service There are three different RVUs work RVU practice expense (PE) RVU and malpractice (MP) RVU Work RVU reflects the relative time and intensity associated with Medicare PFS service PE RVU reflects the costs of maintaining a practice and MP RVU reflects the cost of malpractice insurance Source httpwwwcmsgovOutreachshyandshyEducationMedicareshyLearningshyNetworkshyMLNMLNProductsdownloadsmedcrephysfeeschedfctshtpdf
19 Earlier studies of JW Hay (ldquoPhysiciansrsquo specialty choice and specialty incomerdquo Econometrics of Health Care
edited by G Duru and J Paelinck Netherland Klwer Academic 1991) and J Hurley (ldquoPhysician choices of specialty location and moderdquo Journal of Human Resources No 26 1991 pp 47shy71) did not account for uncertainty in entry to a specialty However they find that medical students are substantially responsive to expected income These studies report income elasticities that range from 1 to 3
10
Final Report Health Practitioner Bonuses
However there are studies that report comparatively less impact of expected earnings on the decision to choose primary care Bazzoli (1985) found that medical students are more likely to choose primary care when the expected earnings are relatively large but the effect is quite small More specifically a $10000 (about 20 percent of the mean earnings in 1981) increase in the expected earnings in primary care relative to the nonshyprimary care yields a 14 percentage point increase in the probability of choosing primary care
Gagne and Leger (2005) have studied the specialty choice decision of Canadian physicians who practiced between 1989 and 1998 They find that a 91 percent reduction in relative feeshypershyconsultation for a general practitioner in Quebec and Saskatchewan for example would lead to a 04 percent reduction in the proportion of medical students entering general practice The largest response is observed in Manitoba where the proportion of medical students entering general practice is estimated to decrease by 229 percent as a result of a 91 percent reduction in relative feeshypershyconsultation The implied responsiveness of specialty choice to changes in earnings from this study and from other studies discussed in this section is summarized in Exhibit 2
Vaughn et al (2010) bolster this point by noting that programs designed to affect the number of medical students choosing primary care have largely failed because of the programsrsquo inability to affect relative incomes By estimating career wealth accumulation across specialists primary care physicians physician assistants business school graduates and college graduates the authors try to elucidate the true difference between payment of physicians and nonshyphysicians and between specialists and generalists within the physician group They note that this result is to be expected as programs have done little and continue to do little to affect the disparity in expected lifetime earnings between primary care physicians and specialists The authors also find that for a primary care physicianrsquos lifetime earnings to equal those of a cardiologist the primary care physician would have to receive a bonus of $11 million upon completion of medical school
Sivey and Scott (2012) use an econometric approach to address the question of the effect of lifetime earnings on training specialty choice based on a sample of Australian postgraduate doctors Using a generalized multinomial logit model the authors find a statistically significant positive impact of earnings on the probability of choosing general practice training versus specialty training Subsequently they use the same model to simulate the effect of a $50000 increase in annual earnings of general practitioners (GPs) on the probability of junior doctors choosing GP training Specifically the simulation result suggests that $50000 additional earnings for GPs (a 278 percent increase over their current salary of $180000) would lead to a 263 percent increase in the propensity of junior doctors to choose GP training Therefore the implied earnings elasticity of the propensity to choose GP training is 095 which is consistent with previous findings (Nicholson 2002)
11
Final Report Health Practitioner Bonuses
Exhibit 2 Summary of Responsiveness of Specialty Choice to Changes in Earnings (Earnings Elasticity)
StudyArticle Description Earnings
Elasticity
Nicholson (2002) Elasticity of ranking Family Practice Pediatrics as the 1
st specialty choice with
respect to lifetime earnings (among US medical school residents) 103
Nicholson (2002) Elasticity of ranking Radiology as the 1
st specialty choice with respect to lifetime
earnings (among US medical school residents) 220
Gagne and Leger (2005)
Elasticity of proportion of medical students (in 8 Canadian provinces) entering General Practice with respect to relativeshyfeeshypershyconsultation
0044 to 025
Sivey and Scott (2012)
Elasticity of probability of junior doctors (in Australia) choosing General Practice with respect to annual earnings
095
Hogan and Bouchery (2010)
Elasticity of percentage of male US medical school Internal Medicine graduates choosing Cardiology subspecialty with respect to annual compensation
250
Note earnings elasticity gives the percentage change in the outcome measure of interest (eg proportion ofshystudents ranking family practice or radiology as the 1
st choice) due to 1 percent change in earningsshy
In an unpublished piece Hogan and Bouchery (2010) estimate a multinomial logit model of the choices of internal medicine residents to remain in internal medicine and practice primary care or to obtain a fellowship for further training in one of nine subspecialties of internal medicine and ultimately practice in that subspecialty20 The authors find that a 1 percent increase in earnings from one of the career paths holding earnings in other specialties constant increases entrants of male US medical graduates into that the examined specialty (Cardiology) by about 25 percent but increases female entrants by about only 03 percent They also find that increases in the length of additional training required for a subspecialty have a negative effect on the number of US medical graduates pursing that subspecialty and reduces the probability that US medical graduates pursue the specialty but increases the probability that international medical school graduates pursue that subspecialty21
Expected lifetime earnings are not the only factor that influences decision making during specialty choice Medical students assign a low level of prestige to a primary care career compared to other specialties Students surveyed associate primary care with low income expectation low class rank and high educational debt (Henderson 1996) Students often enter medical school with a positive perception of primary care but by the time they reach their fourth year they are increasingly likely to disagree with the assertions that primary practice is prestigious adequately compensated and allows more control over working hours (Lynch 1998) It appears that studentsrsquo positive perceptions concerning primary care may change as they experience the more realistic professional demands on primary care physicians that can develop during medical school and as they observe their peers and role models both within primary care and outside
20 Paul F Hogan and Ellen Bouchery ldquo A Model of Subspecialty Choice for Internal medicine Residentsrdquo prepared by
The Lewin Group for the American College of Cardiology 2010 21
After simulating the impact of decreasing cardiology training requirements from three years to two the study finds that oneshyyear decrease in training requirements would increase the percentage of male US medical school graduates choosing cardiology from 171 percent to 182 percent
12
Final Report Health Practitioner Bonuses
2 Effects of Earnings on Labor Supply of Health Care Workforce
Consistent with the economic theory a large number of studies find evidence in support of a positive correlation between earnings and the labor supply of the health care workforce This is in contrast to much earlier studies that relied only on aggregate time series data on physician services and fees to conclude that physician labor supply functions were backwardshybending and physicians responded negatively to wage increases22 For instance Steiger et al (2010) observe that inflationshyadjusted physician fees (weighted average of Medicare and private sector fees) decreased substantially between 1995 and 2005 The timing of the reduction in fees closely matched the observed decline in nonshyresident physician work hours The study finds that the mean hours worked per week by physicians practicing in the US decreased by almost 7 percent between 1996 and 2008 Additionally by 2006 physician fees were 25 percent lower than their inflationshyadjusted 1995 levels More recent studies which use micro data to estimate traditional labor supply equation generally find a small positive elasticity of physiciansrsquo work hours with respect to wage increases For instance Rizzo and Blumenthal (1994) use the instrumental variable approach to estimate the unbiased effect of physicianrsquos wage on the annual hours the physician spends on patient care Their results based on all physicians suggest that a 10 percent increase in the wage rate yields a 27 percent increase in the physicianrsquos annual work hours (ie wage elasticity of 027) When restricted to selfshyemployed male physicians they find a wage elasticity of 023 However for female physicians they find a higher elasticity with a 10 percent increase in the wage rate leading to a 49 percent increase in annual work hours This work is generally supported by Baltagi et al (2005) who find that a 10 percent wage increase would lead to a 3 percent increase in physician labor supply among hospital employed male physicians in Norway Baltagi et al (2005) note that the magnitude of the wage elasticity in this case may be relatively small because of hospital employed physiciansrsquo tendency to earn a lower wage relative to selfshyemployed physicians 23
There are few studies that examine the effect of earnings on a physicianrsquos decision to retire Using micro data from Norway over the period of 1990shy1992 Herneas et al (2000) estimated a model to predict retirement behavior and simulated the effect of financial incentives on retirement decisions among those who were eligible to retire early (during 1990 shy 1992) and who worked fullshytime in 1990 In their simulation the annual pension from 1993 onwards is increased by 72 percent if the retirement eligible individuals continue to work fullshytime through 1992 This increase is equivalent to a 723 percent increase of the annual disposable pension24 The simulation result suggests that the average estimated probability of continuing to work fullshytime throughout 1992 will increase by almost 100 percent (from 384 percent to 706 percent) in response to the 7234 percent hike in annual disposable pensions described above25 In other words in the absence of any pension hike after 1993 only 384 percent of physicians working full time in 1990 would still work full time through 1992 However if pension is raised by 723 percent from 1993 onwards for those who would continue to work full time through 1992 the
22 For an inshydepth exposition of the empirical evidence and lack of support for a backwardshybending physician labor
supply pleas e see Handbook of Health Economic Vol 2 Chapter 14 Section 310 23
The nature of labor supply for Physicians and nurses differ greatly There are some studies on the effect of wages on the labor supply of nurses For example Askildsen and Baltagi (2002) estimates a wage elasticity of nursesrsquo supply of labor between 07 and 08 depending upon the method of estimation The authors argue that while theirs is a larger effect than other estimations have suggested it is still not a large effect relative to other professions They also note that contract structure and type of work being performed significantly impact labor supply decisions and should not be ignored
24 Wealth is defined as the discounted value of future annual disposable pensions and the increase in wealth is
evaluated at the means of the data 25
The expected remaining lifetime was then set at 18 years which is close to the actual average for people in the relevant age groups in 1992
13
Final Report Health Practitioner Bonuses
simulation shows that 706 percent of physicians working full time in 1990 would still do so through 1992 They also estimated that the same financial incentives will lower the average estimated probability of partial retirement in 1992 (of retirement eligible workers) by about 547 percent (from 362 percent to 164 percent) Additionally they find that other decisive factors influencing retirement decisions are the level of education income and marital status
3 Effects of Earnings on the Volume of Primary Care Services
The effect of earnings on the volume of primary care services is related to the previous questions but is a distinct issue that incorporates the ability of providers to impact the demand for services as a result of changes in their income Dummit (2008) argues that as the largest single payer Medicare affects physician practice revenues directly through its payments and indirectly through its fee schedule which many private payers use Lower compensation for primary care physicians is one of the reasons that these specialties are less desirable Reschovsky et al (2012) report that over the past decade Medicare fees and spending for specialist services (such as diagnostic tests and procedures) have gone up more rapidly than fees for EampM services which primary care providers (PCPs) typically provide Those higher payments have contributed to faster growth in specialist services than in EampM patient visits Commercial insurers and state Medicaid plans often build their fee schedules on Medicarersquos further widening the income gap between PCPs and other physician specialists and contributing to the shrinking number of medical students choosing to enter primary care In this section we review how improvements in Medicare fees can influence the volume of health care services provided under Medicare
Hadley et al (2009) estimate the relationship between Medicare fees and the volume of eight specific services provided by physicians using data for 13000 physicians from 2000shy2001 and 2004shy2005 Community Tracking Study Physicians Surveys Since the fee schedule is one of the few policy tools that Medicare potentially has available to influence service volume it is critical to have a better understanding of how changes in Medicare fees affect Medicare service volume Their study finds that a 10 percent reduction in Medicare fees leads to 18 percent to 66 percent reduction in the volume of office visits (of various degrees of complexity) They argue that physicians may be more likely to respond to fee cuts by limiting their acceptance of new Medicare patients rather than limiting visits by established patients
Clemens and Gottlieb (2014) examine the changes in physiciansrsquo reimbursement rates under Medicare before and after year 1997 when consolidation of geographic regions across which Medicare adjusts physician payments led to area specific price shocks The study measures health care supply of all services using RVU They find that health care supplied to Medicare patients (RVUs per patient) exhibits a relatively large long run elasticity of around 15 with respect to reimbursement rates Their results are mostly driven by the stronger positive elasticity among elective procedures (eg eye and orthopedic procedures) When restricted to the analysis of the supply of EampM services their estimates lack precision and they find statistically insignificant short (1997shy98) and long run (2001 to 2005) impact of the price shock on the supply of EampM services However the medium run (1999 and 2000) elasticity is precisely estimated to be 097 for EampM They argue that the observed responses imply that the overall composition of services shifts toward more elective procedures as reimbursement rates increase Finally the number of patients and physicians per patient are almost unaffected by the change in the reimbursement rates
Reschovsky et al (2012) simulate the effect of a permanent 10 percent fee increase for primary care EampM services under Medicare Their estimated primary care supply model suggests that higher primary care fees lead to increases in both the likelihood that PCPs will treat Medicare beneficiaries and more importantly the quantity of EampM services PCPs provide to Medicare
14
Final Report Health Practitioner Bonuses
patients According to their analysis higher fees (10 percent increase permanently) for primary care beginning in 2011 raise the primary care EampM visits by 88 percent
Thus the likely range of changes in the volume of primary care visits in response to a longshyterm increase in Medicare primary care fees appears to be wide Based on Hadley et al (2009) and Reschovsky et al (2012) a 10 percent increase in Medicare fees for primary care can potentially increase the volume of primary care visits in the range of 18 percent to 88 percent However due to the shortshyterm nature of the Medicare PCIP (only 5 years) the observed impact of the incentive payment on the volume of EampM visits may be closer to the lower bound
B Financial Incentives for Primary Care Providers in Underserved Areas
Access to health care in areas with insufficient health professionals has been an ongoing source of concern among policy makers Expansion of health insurance coverage through the implementation of the ACA is likely to stimulate the demand for primary care in general including underserved areas Health Resources and Services Administration (HRSA) designates such areas HPSAs These geographic areas meet a defined threshold of primary care physician to population ratio Since 1987 Medicare has been paying bonuses to physicians providing primary care in rural HPSAs In 1991 the bonus payment was increased from 5 to 10 percent and eligibility extended to services provided by physicians in urban HPSAs Thus this particular form of bonus payment has been in place for almost 25 years Section 413(a) of the Medicare Modernization Act of 2003 put in place an additional 5 percent bonus payment for physicians practicing in Physician Scarcity Areas (PSAs) PSAs were those counties and rural zip codes in metropolitan statistical areas (MSAs) that represented the 20 percent of the Nationrsquos population with the lowest physician to population ratios These areas often coincided with geographic HPSAs so that physicians practicing in those areas received a 15 percent additional bonus payment during 2005shy2008 when the PSA bonuses were in effect (ie from January 2005 through June 2008)
In this section we review the literature related to the volume of these bonus programs and their potential effects on primary care services and providers Programs to address this issue have historically been implemented with the assumption that financial incentives to practice in rural areas are effective in addressing the health professional shortage in given areas This assumption is largely validated by the literature with the effect of financial incentives shown to influence the distribution of physicians and health professionals Importantly the literature generally suggests a multifaceted approach to incentives financial or otherwise Many of the most successful programs evaluated below use recruitment of medical students with specific demographic markers to influence the distribution of physicians Financial incentives have a broad range of reported specialty choice elasticities that range from 001 to 095 These discrepancies may also be somewhat determined by the type of financial incentive (eg grant loan postgraduate bonus)
In an early article on the HPSA bonus Shugarman et al (2001) estimate that in 1991 the total amount of HPSA bonus was almost 316 million dollars Their estimate shows that 583 percent of the total HPSA bonus payment went to the rural HPSAs while the remaining 417 percent went to urban HPSAs They also find that the total bonus payment grew to reach about 106 million dollars in 1996 but then gradually declined to almost 77 million dollars in 1998 The proportion of rural HPSA bonus decreased to 511 percent
In a more recent study Shugarman and Farley (2003) examined the trends in HPSA bonus payments for primary care specialties (family practice general practice and internal medicine) under Medicare over the period of 1992shy1998 using Medicare claims data for nonshymetropolitan area beneficiaries They argue that the bonus payments largely targeted primary care They
15
Final Report Health Practitioner Bonuses
find that in 1992 the payments for primary care services represented 297 percent of the total Medicare bonus payments for physician services to rural Medicare beneficiaries The proportion gradually went up to 37 percent in 1998 Their analysis also showed that in 1992 payments for primary care services represented 14 percent of total basic Medicare payments for physician services and this share rose to 186 percent by 1998 However 559 percent of all Medicare HPSA bonus payments for services to beneficiaries in nonshymetropolitan areas were made to primary care physicians This proportion declined gradually to 497 percent in 1998 The authors claim that low levels of bonus payments in general coupled with the documented declines in those amounts since 1994 may have undermined their future potential to support physicians practicing in rural areas Their findings suggest that physicians were not claiming the extra payments that were available to them Factors that could be contributing to such low uses of bonus payments include the extent to which physicians know about the payments perceived value of the bonus to physicians effects of administrative procedures on the ease of receiving them and concerns about the risk of audits Nevertheless their study highlights the role of bonuses in improving the payments and the supply of primary care services in HPSAs
The literature regarding the effect of financial incentives in underserved areas on the choice of practice location of physicians is relatively scarce Chou and Lo Sasso (2009) examined the impact of local characteristics on the practice location choices for newly trained physicians in New York between 1998 and 2003 Their empirical results suggest that PCPs without educational debt are attracted to HPSAs In other words they estimate that the propensity of choosing a location by a PCP is higher if the location is designated as an HPSA However the estimated propensity is lower if physicians have larger educational debt Their study however addresses the effect of the HPSA status in general rather than any specific effect of the amount of HPSA bonuses
In a review of rural incentive programs Sempowski et al (2004) compare rural recruitment and retention programs in the United States against those in other countries (notably Canada and New Zealand) The authors look specifically at Return of Service (ROS) commitments wherein financial incentive is provided though assistance with medical school payment in return for a commitment to serve in a rural area The authors note that programs offering financial incentives in exchange for ROS commitments to rural or underserviced areas have achieved their primary goal of short term recruitment However the authors note that in the US the lenient buyout opportunities have hindered the programs and limited their effectiveness Sempowski et al (2004) argue that the programs in Canada and New Zealand may have greater success with retention as compared to the US programs because the programs in Canada and New Zealand have a multishyfaceted approach that includes the use of financial incentives along with prudent recruitment strategies
Bolduc et al (1996) provide a theoretical framework of physicianrsquos choice of location They develop a model to assess the effect of various incentive measures introduced in Quebec (Canada) on the geographical distribution of physicians across 18 regions during 1976shy1988 The study specifically examines general practitionersrsquo choice of initial practice locations in Quebec The utility of a particular alternative depends on among other things a measure of expected discounted value of lifetime earnings associated with this alternative It is through changes in this variable that the impact of various incomeshybased physicianshylocation programs is simulated Before 1982 there were substantial variations in the population to general practitioner (GP) ratio across different regions of Quebec In order to redress geographic imbalances in the distribution of physicians the Quebec government introduced the Differential Remuneration Program (DRP) in 1982 that raised the fees (relative to the base fees to general practitioners in underserved regions compared to the regions with relatively lower population to GP ratios Among other incentive measures annual study grants of $10000 have been offered
16
Final Report Health Practitioner Bonuses
(since 1982) tied to a commitment to work in these underserved regions during a number of years equal to the number of grants received A settlement grant program has also been available since 1984 for physicians who choose to practice in these regions This program provides an annual allowance for a maximum of 4 years It varies from $5000 to $10000 (nontaxable) for a physician paid by unit of service depending on the shortage of physicians in the locality Whereas the differential remuneration program influences location choices through differential pricing of physiciansrsquo services by location the grant program affects location choices through a lump sum increase in income for a short duration (4 years)
Bolduc et al (1996) find that on average a 10 percent increase in the general practitioner fees for medical services in a region increases the propensity of a beginning GP to work in this region by 7 percent Thus the implied elasticity of location choice probability with respect to fee increases is about 07 However this elasticity varies across regions it is higher in remote regions (with a maximum of 128) On the other hand on average the elasticity of location choice probability with respect to nonshylabor incomes such as study grants is estimated to be about 111 In other words a 10 percent increase in the study grants tied to a commitment to work in the underserved regions leads to an 111 percent increase in the probability of GPs choosing these underserved regions as their starting practice location However their findings largely depict redistribution of GPs across regions within Quebec rather than showing any increase in the total number of GPs in Quebec
Despite differences in the institutional framework between the US and Canada the findings from Bolduc et al (1996) provide some valuable insights into the potential effects of financial incentives that vary across locations The remaining important issue is to identify how bonus payments affect the annual earnings of physicians in HPSAs Only then based on findings from the literature can one assess the potential impact of the earnings shock in HPSAs on primary care physiciansrsquo choice of practice location Holmes (2005) addresses this question directly Using a database containing the location of physicians at 5shyyear intervals the author compares the locations chosen by alumni and nonshyalumni of programs within the United States charged with increasing physician supply in underserved areas This analysis provides insight into the types of students that choose to enroll in programs such as the National Health Service Corps (NHSC) The author notes that participation in this program consists disproportionately of minorities from private expensive schools This suggests that scholarships (and hence the lack of debt burden) may be an influential factor in participation in the NHSC The multinomial logit model employed by Holmes (2005) shows that students which graduate from an institution with a focus on primary care are also more likely to enroll in the NHSC Using this model Holmes (2005) concludes that the elimination of the NHSC program would lead to a 10shy11 percent decrease in the supply of recent graduates in underserved communities
Rabinowitz et al (2001) examine the history and results of The Physician Shortage Area Program (PSAP) of Jefferson Medical College (Philadelphia PA) The PSAP is intended to address the shortage of primary care physicians in rural Pennsylvania The authorsrsquo analysis uses a cross section of Jefferson Medical College Graduates from 1978 to 1993 to determine which characteristics are predictive of becoming a rural primary care physician (PCP) Of the characteristic variables collected in the data freshman year plans for family practice being in PSAP having a NHSC scholarship male sex and taking elective senior family practice rural preceptorship were independently predictive of primary care in a rural area However among nonshyPSAP graduates with two key selection characteristics of PSAP students (having grown up in a rural area and freshman year plans for family practice) were 78 percent as likely as PSAP graduates to be a rural primary care physician and 75 percent to remain rural PCPs The authors note that this result suggests the most influential area of the program is the admissions component not the financial component Supporting evidence for this conclusion is provided by
17
Final Report Health Practitioner Bonuses
Brooks (2002) who found that rural upbringing and specialty preference were most strongly correlated with recruitment of physicians to rural areas Growing up in a rural area along with the studentrsquos expressed plan to become a primary care physician were associated with a 36 percent likelihood of a graduate practicing in a rural area compared with 7 percent for individuals without these preferences
Although most studies found that there was no correlation with age gender race or marital status (Horner 1993 Looney 1998 Rabinowitz 1999) a few studies determined that men have a greater likelihood of rural practice than women (Fryer 1997 West 1996) However women PSAP graduates were more than twice as likely as nonshyPSAP women to practice in rural areas (317 percent versus 123 percent) (Rabinowitz 2011) Importantly none of these articles list financial incentives as an important factor in recruitment and retention of primary care physicians in rural areas
C Impact of the Increase in Medicaid Reimbursement Rate Relative to the Medicare Rate
The availability of primary care is particularly important for public payer programs such as Medicaid and Medicare Historically Medicaid has been the lowest payer for primary care services relative to Medicare paying just 66 percent of Medicare rates on average26
Cunningham et al (2009) report that fewer physicians accept new Medicaid patients in response to the low Medicaid reimbursement rates in several states Zuckerman et al (2009) describe that in 2008 average primary care physician fees under Medicaid ranged from 57 percent of the national average in Rhode Island to 226 percent of national average in Alaska They also find that after a strong Medicaid fee growth during 1998shy2003 Medicaid fees fell relative to inflation during 2003shy2008 Despite the slowdown in overall fee growth Medicaid fees for primary care services kept pace with inflation ACA increases Medicaid reimbursement rates for certain services provided by primary care physicians to 100 percent of Medicare rates in 2013 and 2014 Given the variability of Medicaid payments across states this could be a substantial boost in payments for physicians in some states and less so in others
The findings in this section focus on the comprehensive effect of a relative rate increase both on services provided and patientrsquos utilization of those services While evidence is mixed the literature indicates significant effects of increased Medicare reimbursement on both the provision and utilization of primary care services Reported elasticities range between 041 in national estimates to shy006 in some state level analyses This broad range suggests varying evidence and a need for greater examination given the importance of this question
1 Systemic Change in Medicaid Reimbursement Rates in All States
Systemic Medicaid changes have the potential to alter the primary care environment across all states Cunningham (2011) considers a regressionshybased approach to identify the causal effect of increases in Medicaid reimbursement rates relative to the Medicare rate on the propensity of primary care physicians accepting new Medicaid patients He reported prior to the 2012 Supreme Court decision (National Federation of Independent Business et al vs Sebelius et al27) that once the ACA is implemented Medicaid eligibility will expand to cover as many as 16 million more poor and lowshyincome adults by 2019 (an increase of more than 25 percent) To
26 Small DM and T McGinnis (2012) ldquoLeveraging the Medicaid Primary Care Rate Increase The Role of
Performance Measurementrdquo Center for Health Care Strategies Inc 27
US Supreme Courtrsquos decision in the case challenging the constitutionality of the Affordable Care Act (ACA httpwwwsupremecourtgovopinions11pdf11shy393c3a2pdf
18
Final Report Health Practitioner Bonuses
meet the resultant surge in demand for primary care services ACA provides financial incentives to encourage higher participation of primary care physicians in Medicaid Specifically the ACA raises the Medicaid reimbursement rates for certain services provided by primary care physicians up to 100 percent of Medicare rates in 2013 and 2014 This study uses primary care physicians from the HSC 2008 Health Tracking Physician Survey and exploits the existing state level variation in Medicaid reimbursement rates (as a percentage of the Medicare rate) The author groups the states in three categories (low medium and high) based on PCPs to population ratios
This study shows that in 2008 the average Medicaid reimbursement rate for lowshyPCP states was about 816 percent of the Medicare rate while for medium and highshyPCP states the average rates were 643 percent and 548 percent respectively The national average of the Medicaid reimbursement rate was 662 percent of the Medicare rate Cunningham (2011) examines the effects of Medicaid reimbursement rates on PCP acceptance of Medicaid patients while accounting for differences in physician practice patient and health care market characteristics The results show that higher Medicaid reimbursement rates are associated with a greater probability of PCPs accepting all or most new Medicaid patients although the effects are relatively modest For PCPs a 10shypercentage point increase in the MedicaidMedicare fee ratio for primary care is associated with only a 21shypercentageshypoint increase in PCP Medicaid patient acceptance The study reports that the national average Medicaid reimbursement rate relative Medicare in 2008 was at 662 percent and the national average acceptance rate of new Medicaid patients by PCPs was 415 percent Therefore the implied elasticity of accepting primary care patients with respect to the payment rate is about 03328 In other words if the Medicaid fee relative to the Medicare rate goes up by 10 percent then the acceptance of new Medicaid patients by PCPs goes up by 33 percent Excluding pediatricians the effect of reimbursement on Medicaid acceptance is slightly higher the implied elasticity of accepting primary care patients with respect to the payment rate is about 041 In the context of the parity in Medicaid and Medicare reimbursement rate under the ACA empirical findings by Cunningham (2011) can serve as a benchmark for the likely positive effect of higher Medicaid reimbursement rates on the access to primary care services
Other studies bolster this finding Shen and Zuckerman (2005) study the effects of Medicaid payment generosity on access and care for adult and child Medicaid beneficiaries The authors use data comparing the experiences of Medicaid beneficiaries with groups that should not be affected by Medicaid payment policies (the uninsured) using a differenceshyinshydifferences model Shen and Zuckerman (2005) find that higher payments do increase the probability of having a usual source of care and the probability of having at least one visit to a doctor or other health professional Specifically they find that a one unit increase (equivalent to a 10 percent increase) in the payment generosity index29 leads to a 15 percentage point increase in the probability of having a usual source of care and a 16 percentage point increase in having at least one visit to a health professional30 Importantly payment generosity was noted to have no effect on the probability of receiving preventive care or the probability of having unmet needs The authors argue that this weak association between increased payments and utilization of services is due to the higher correlation between payment increases and participation by physicians with a secondary effect on utilization
28 Implied Elasticity is (21415)(10662) or 033 After excluding Pediatricians the acceptance rate of Medicaid
patients among PCPs is about 385 percent and a 10shypercentage point increase in the MedicaidMedicare fee ratio for primary care is associated with only a 24shypercentageshypoint increase in PCP Medicaid patient acceptance Therefore the implied elasticity is (24385)(10662) or 041
29 The Medicare payment generosity index is defined as the Medicare capitation rate in a county divided by the
median Medicare capitation rate in the nation in a given year Average is defined to be 10 30
These can be interpreted as elasticities Implied elasticity would be 015 and 016 respectively
19
Final Report Health Practitioner Bonuses
2 Stateshyspecific Experience on Changes in Medicaid Reimbursement Rates
To better understand the mechanism by which systemic changes in the Medicaid system will be implemented and the broad range of environments affected it is informative to review Medicaid changes at the state level Zuckerman et al (2004) illustrate that Medicaid physician fees increased on average by 274 percent between 1998 and 2003 with primary care fees growing the most On average the cumulative percentage change in the Medicaid primary care fee was about 412 percent between 1998 and 2003 The authors note that there was considerable variation in primary care fees across states Seven states (District of Columbia Georgia Indiana Kentucky Maine Rhode Island and South Dakota) left primary care fees almost unchanged while two states (Iowa and New York) raised them by more than 100 percent States with the lowest relative fees in 1998 increased their fees the most but almost no states changed their position relative to other states or Medicare since Medicare rates also increased over the period Subsequently the study finds that primary care physiciansrsquo acceptance of Medicaid patients in highshyfee states was about 18 percentage points higher than the lowshyfee states (61 percent versus 43 percent) in 1997 while in 2001 the gap is reduced to 11 percentage points (58 percent versus 47 percent) The national average of primary care physiciansrsquo acceptance of most or all new Medicaid patients was 53 percent in 1997 and 54 percent in 2001 Moreover large fee increases (eg lowshyfee states experienced the largest fee change on average) were associated with primary care physiciansrsquo greater willingness to accept new Medicaid patients the rate of primary care physiciansrsquo acceptance of new Medicaid patients in these lowshyfee states went up from 43 percent in 1997 to 47 percent in 2001 Although their study shows some evidence that a Medicaid fee increase is associated with increased Medicaid participation among primary care physicians it does not provide a direct link between Medicaid reimbursement rates relative to Medicare and physiciansrsquo acceptance of Medicaid patients
Bindman et al (2003) examine California in particular and focus on the relationship between Medicaid fee increases and the prevalence of managed care in the MedishyCal system The authors note that in August of 2000 a fee increase raised physician Medicaid reimbursement from an average of 577 percent to 652 percent of the average Medicare payment in California This amounts to a fee increase for a typical office visit from approximately $18 to $24 The study used crossshysectional surveys in 1996 and 2001 on both primary care physicians and specialists Controlling for physician demographics and specialties the authors found no increase in MedishyCal participation Their study notes that between 1996 and 2001 despite payment increases the number of MedishyCal primary care physician equivalents dropped from 57 to 46 per 100000 patients31
Mukamel et al (2012) address the effect of similar financial incentives in Californiarsquos Medicaid system but from the standpoint of nurse staffing levels Using separate models for three staffing types RNs LPNs and CNAs the authors determined that financial incentives were only a significant factor in increasing hours per resident day (hprd) for RNs They note that expected nursing home reimbursement rate increases in 2008 were associated with increased RN staffing levels in 2006 They estimate the effect at around a 2shyminute increase (0035 hrpd) for each $10 increase in payment rate This amounts to a 10 percent increase in staffing over 2005 base levels The authors explain that this relatively small increase in staffing might be partially explained by the financial incentives original intent that is to influence labor expenditures and
31 A physician equivalent is defined as one full time physician providing full time working hours per week (40 hrs) in a
given specialty For example a physician who provides 20 hours of Family Medicine is counted as 05 of a physician equivalent in Family Medicine
20
Final Report Health Practitioner Bonuses
not directly influence staffing levels The authors note there may have been a change in wages and benefits for all three groups but that it was not measured in this study
Finally Coburn et al (1999) examined the effect of Medicaid fee changes on physician participation and enrollee access in Maine and Michigan using multiple natural experiments The authors found that changes in Medicaid fees observed in either state over any observed period had no substantial impact on either physician participation or enrollee access and utilization32 In one case in Maine after an increase of 475 percent in Medicaid reimbursement rates primary care physician participation fell by 1 percent (from 477 to 471)33 After a second increase of 245 percent participation increased by only 2 percent34 This result is mirrored in Michigan where participation increased by only 2 percent after a reimbursement increase of 79 percent and decreased by 06 percent after a cut of 166 percent and fell again by 02 percent after a restoration of 196 percent The authors note that these small changes in physician participation hold even when adjusting for lagged responses in both cases The authors found similar results when examining the utilization of services Using ambulatory care as a proxy for utilization of services in general the authors found that changes in the proportion of beneficiaries with at least one visit in a month and in the average number of visits by beneficiaries with at least one visit are not in a direction consistent with the fee changes and are all very small in magnitude The authors note that these results also do not change when estimated in the long run However a major confounding factor in these results as the authors note is the relative size of Medicaid payment rate increases compared to those of the private sector fees The authors state that most gains relative to the private market were quickly eroded
Conclusions
In order to inform our empirical estimation the Lewin Group has explored the health and labor economics literature to understand the nature and the size of the impact of any financial incentives on the labor supply behavior of PCPs and the resultant impact on the availability of primary care services The main objective of this review is to document the prior empirical evidence of the impact of financial incentives on raising the supply of primary care workforce the volume of services impact on medical graduatesrsquo propensity to participate in primary care PCPsrsquo retirement decision etc This review also evaluates the past evidence on the effect of bonuses shortage areas and their effectiveness in redistributing and retaining primary care workforce Finally the review of the literature also focuses on the stateshyspecific experiences with changes in their respective Medicaid payment rates for primary care and the resultant impact on the supply of PCPs their rate of acceptance of Medicaid patients and the volume of primary care services such as office visits or visits for EampM services
Affecting the choice of specialty by a medical student is one way by which the supply of primary care services may be increased Several studies (eg Nicholson 2002 Sivey and Scott 2012) find that the propensity of medical graduates choosing primary care as their specialty would go up by 95shy10 percent in response to a 10 percent increase in their earnings (ie earnings elasticity of 095shy10) Thus even if bonus payments have the potential to influence the inflow of
32 The study has given due consideration to the changes in Medicaid payment relative to the payments by other
payers The authors use the ratio of Medicaid payments to charges as an index of changes in relative payments They have also confirmed with Blue Cross Blue Shield (BCBS) of Michigan (which serves 49 percent of the statersquos health insurance market) that BCBSrsquos paymentsshytoshycharge ratio for all physician services did not change substantially
33 The corresponding relative fee change (ie Medicare relative to charges) is 402 percent
34 The corresponding relative fee change (ie Medicare relative to charges) is 258 percent
21
Final Report Health Practitioner Bonuses
medical students into primary care the magnitude of that impact would depend largely on the size of actual bonus payments relative to PCPsrsquo earnings and how long such payments are in place These two factors will determine the contribution of the Medicare bonus to the lifeshytime earnings of primary care providers
Another way to affect the supply of primary care services is to provide financial incentives for existing providers with the aim of increasing their labor supply Past research (eg Rizzo and Blumenthal 1994 Baltagi et al 2005) estimates that a 10 percent increase in wage earnings would yield a 23 3 percent increase in their annual work hours This low wage elasticity suggests that influencing the supply of primary care labor with direct fee increases alone is likely to be costly The increased fee payments will also likely have an effect on the volume of primary care services However compared to the wage elasticity the change in volume of services in response to fee increases is relatively low Empirical evidence from the literature (eg Hadley et al 2009 Reschovsky et al 2012) suggests that a 10 percent change in Medicare fees would change the volume of office visits or EampM related visits by 18 to 88 percent in the same direction
The numerical estimates of the effect of financial incentives in underserved areas on the choice of practice location of physicians in the US are relatively scarce An important study based on Canadian data finds that on average a 10 percent increase in the general practitioner (GP) fees for medical services in a region increases the propensity of a beginning GP to work in this region by 7 percent (Bolduc et al 1996) Thus the implied elasticity of location choice probability with respect to fee increases is about 07 Several studies highlight the role of bonuses in improving the payments and the supply of primary care services in HPSAs in the US However estimating the true contribution of bonuses in underserved areas in boosting physiciansrsquo earnings would require additional research
Past research on stateshyspecific increases in Medicaid and their resultant impact is relatively sparse However several studies find a positive correlation between the Medicaid reimbursement rate and acceptance rate of Medicaid patients among PCPs Cunningham (2011) finds that the effect of increase in Medicaid reimbursement rate on the propensity of accepting primary care patients is positive but small in magnitude Coburn et al (1999) finds positive impact of Medicaid fee changes on physician participation and enrollee access in Maine and Michigan while Bindman et al (2003) did not find significant effect of Medicaid fee increase on the participation rate of primary care physicians in California
Despite several empirical results regarding the potential magnitude of the effect of different financial incentives the estimated effect of Medicare bonuses or improvement in Medicaid reimbursement rates under ACA may not be substantial This is primarily due to the size and the temporary nature of these positive earnings shocks The empirical evidence on the effect of this type of shortshyterm pay increase is almost nonshyexistent in the literature However the ranges of the effects of longshyterm earnings shocks from our review of the literature can inform policy makers about the likely magnitude of the impacts of these incomeshyaugmenting policies for PCPs if they are sustained for a longer duration
Modeling the Impact of Medicare Incentive Payment for Primary Care Providers
A Study Design Overview
The Medicare primary care incentive is available to eligible primary care practitioners for services provided under selected categories of EampM An eligible primary care practitioner is a
22
Final Report Health Practitioner Bonuses
physician nurse practitioner clinical nurse specialist or a physician assistant who satisfies the following criteria
1 Enrolled in Medicare with a primary specialty designation of family practice internal medicine pediatrics or geriatrics and
2 At least 60 percent of the practitionerrsquos allowed charges under the Medicare physician fee schedule (excluding hospital inpatient care and emergency department visits) are for primary care services
This temporary payment is available for primary care services furnished by an eligible primary care practitioner on or after January 1 2011 and before January 1 2016 The payment is made on a quarterly basis and it amounts to 10 percent of the payment amount for the Part Bshycovered primary care services furnished by the eligible provider
Based on data regarding all the Medicare PCIP recipients in 2011 and 2012 we observe that in 2011 there were 162342 providers that received the PCIP with the majority of physicians specialized in family medicine and internal medicine (Exhibit 3) Also nurse practitioners account for more than half of nonshyphysician recipients in both 2011 and 2012 Finally there was an increase in the number of physician PCIP recipients across all eligible specialties in the second year the payment was in effect The number of all eligible types of nonshyphysician PCIP recipients also increased These estimates are consistent with the statistics reported by CMS35
Exhibit 3 Number of PCIP Recipients under Medicare by Specialty 2011shy2012
Specialty Year 2011 Year 2012
Physicians 121140 133880
Internal Medicine 54062 62554
Family Medicine 63227 66560
Pediatrics 2711 3426
Geriatrics 1140 1340
NonshyPhysicians 41202 51432
Clinical Nurse Specialist 466
Nurse Practitioner 27698 33940
Physician Assistant 13038 16899
Total 162342 185312
Note Actual PCIP recipients eligibility based on conditions 2 years prior to the PCIP payment year
The specific PCIPshyeligible services and their corresponding Current Procedural Terminology (CPT) codes are as follows (1) office and other outpatient visits (99201 through 99215) (2) nursing facility domiciliary rest home or custodial care (99304 through 99340) and (3) home services (99341 through 99350)
Medicare claims data include the Healthcare Common Procedure Coding System (HCPCS) corresponding to each claim submitted by providers Since level I of HCPCS codes is comprised of CPT codes HCPCS codes associated with claims can be used to determine bonusshyeligible EampM services
35 Source Center for Medicare and Medicaid Services (httpwwwcmsgovMedicareMedicareshyFeeshyforshyServiceshy
PaymentPhysicianFeeSchedDownloadsPCIPshy2011shyPaymentspdf)
23
Final Reportshy Health Practitioner Bonuses
The key questions that we examined using the Medicare data include
What is the aggregate number of Medicare PCIP recipients
What proportion of primary care providers qualify for the PCIP
What are the characteristics of primary care providers who qualify for the PCIP
How many eligible claims were submitted by PCIP eligible providers
What is the impact of Medicare incentive payments on services provided patients seen providers accepting Medicare and other related outcome measures
B Data Sources and Variables
1 Main Data Sets
To explore these topics we used a customized data set constructed at the provider level This data set includes all the claims submitted by the entire universe of Medicare providers in each year from 2005 to 2011 The content of this customized data set is similar to the Limited Data Set (LDS) version of the Medicare Carrier File (which is also known as the PhysicianSupplier Part B Claims) available from CMS Research Data Assistance Center (RESDAC) Subsequently in the discussion that follows we will refer to the customized claims level data set for all Medicare providers as the Provider Carrier File (PCF) Most of the claims in our PCF are from nonshyinstitutional providers such as physicians physician assistants clinical social workers and nurse practitioners Key variables in this file include
Procedure codes (HCPCS) corresponding to each claim
Provider total allowable charges associated with all claims
Provider specialty place of service and geographic location (such as zip code)
We constructed a provider level pooled data set (PPD) from the claims level data in the PCF over the period 2005shy2011 This pooled data set includes information such as provider specialty volume of primary care services (based on HCPCS codes) volume of PCIP eligible services distribution of providers by volume of services their annual Medicare allowed charges their geographic location and other related information over a longer time horizon In addition the original PCF included a National Provider Identifier (NPI) for each provider Subsequently each provider was linked by NPI to Provider360 data (available from Lewin Grouprsquos parent company Optum Inc) and the AMA Physician Master File to add provider characteristics such as provider demographics (eg age gender) provider designation medical school practice group information specialty and practice location We also added geographic location specific characteristics by linking the provider level data with the Area Resource File (ARF) based on the practice location information of providers The ARF data are maintained by the Health Resources and Services Administration (HRSA) The main advantage of this pooled data set is the ability to track providers over time and capture changes in their volume of services in response to Medicare payment incentives using a preshyandshypost analysis design
2 Trends in Key Outcome Variables
We were interested in estimating the impact of the PCIP on the supply of PCPs and patientsrsquo access to their services We measured improvements in access to care by studying changes in the volume of primary care services provided and the number of PCP providers Both the supply of PCPs and volume of services are measures of access to care previously used in the
24
Final Report Health Practitioner Bonuses
literature36 In addition we investigated the impact of the PCIP on the allowed charges associated with eligible EampM claims
Primary Care Providers with PCIP Eligible Specialties
First we examined the trend in the number of eligible providers submitting Medicare claims An increase in the number of primary care providers relative to the population is expected to improve access to primary care As shown in Exhibit 4 the number of PCPs accepting Medicare patients increased steadily over the study period with an approximate 40 percent increase in the number of providers treating Medicare patients from 2005 to 2011 This trend is common to all four physician specialties under study37 In addition the number of nonshyphysician practitioners more than doubled over this period This significant increase in the number of nonshyphysician providers especially nurse practitioners has been documented elsewhere38
Exhibit 4 Number of Primary Care Providers under Medicare by Specialty 2005shy2011
Specialty 2005 2006 2007 2008 2009 2010 2011
Physicians 138356 147771 165150 173018 178784 185070 191930
Internal Medicine 69391 74411 83117 87090 90291 93904 97526
Family Medicine 61438 65205 72247 75132 77536 79891 82298
Pediatrics 6539 7045 8527 9447 9543 9757 10555
Geriatrics 988 1110 1259 1349 1414 1518 1551
NonshyPhysicians 46634 53823 68297 80041 88569 97789 109353
Clinical Nurse Specialist 1784 1934 2188 2304 2370 2446 2508
Nurse Practitioner 23610 27450 35286 42144 46973 52472 59505
Physician Assistant 21240 24439 30823 35593 39226 42871 47340
Total 184990 201594 233447 253059 267353 282859 301283
Volume of EampM PCIP Eligible Claims
Our second measure of supply of primary care services is the volume of claims submitted by primary care providers for EampM services As presented in Exhibit 5 the volume of EampM claims submitted by physicians increased by roughly 9 percent between 2005 and 2008 EampM claims took a slight dip in 2009 increased in 2010 and then stabilized in 2011 at roughly the levels in 2008 The same general increasing trend applied to each of the four eligible physician specialties with the exception of geriatrics which experienced a constant and substantial increase in EampM claims of 52 percent over the study period Internal medicine physicians provided the majority of services generating more than 50 percent of EampM claims each year over the study period Family physicians are the second largest group of providers to supply
36 For instance see Stensland et al 2013
37 In 2005 almost half of the primary care providers (PCPs) were male but the share of male PCPs declined to almost
40 percent in 2011 (Exhibit B1 Appendix B) On the other hand the share of PCPs aged 55 and above among all male PCPs increased from 24 percent in 2005 to 375 percent in 2011 (Exhibit B1 Appendix B) As observed in Appendix Exhibit B1 the physician population appears to be aging The share of male physicians aged 65 and above underwent the largest increase recently from 186 percent in 2010 to 21 percent in 2011 (Exhibit B9a Appendix B) A similar increasing trend is also observed among female physicians aged 55 and above (Exhibit B9b Appendix B) Finally in the case of nonshyphysicians we observe the same steady increase in the share of providers aged 55 and above for both male and female providers (Exhibit B10shy11 Appendix B)
38 Source GAO (2008) ndash ldquoPrimary care Professionals Recent Supply Trends Projections and Valuation of Services
ldquo GAO 08shy472T
25
Final Report Health Practitioner Bonuses
EampM services representing about 40 percent of the total followed by geriatricians and pediatricians
Consistent with the increase in the number of nonshyphysicians documented above we observe an even more dramatic increase in the total number of EampM claims submitted by nonshyphysicians (clinical nurses nurse practitioners and physician assistants) The volume of EampM claims more than doubled over the study period from roughly 9 million in 2005 to more than 20 million in 2011
Exhibit 5 Total Number of PCIP Eligible EampM Claims submitted by All PCPs under Medicare by PCP Specialty 2005shy2011
Specialty 2005 2006 2007 2008 2009 2010 2011
Physicians 105943390 107978615 111700420 115408741 114881401 117265160 115329828
Internal Medicine
60279101 61222893 63082429 64946744 64244760 65447440 63698392
Family Medicine
44352228 45264171 47011232 48776874 48891712 49977085 49767310
Pediatrics 334997 352594 360508 365170 387636 391312 377604
Geriatrics 977064 1138957 1246251 1319953 1357293 1449323 1486522
NonshyPhys 8885528 10366281 11979963 13710969 15376840 18008471 20477006
Clinical Nurse Specialist
6083315 7068153 8117610 9212329 10298679 11987059 13561380
Nurse Practitioner
153463 165033 168030 200074 228899 260618 296206
Physician Assistant
2648750 3133095 3694323 4298566 4849262 5760794 6619420
With both the aggregate number of EampM claims and the number of providers rising over time we further explore the change in the volume of claims per provider over time In other words we examined whether the increase in the aggregate number of claims could be due to the increase in claims per provider or whether it is just due to the increase in the number of providers
Inspection of Exhibit 6 reveals that in the case of all physicians the average number of eligible EampM claims per provider in 2011 was lower than in 2005 For instance the average number of eligible EampM claims for internal medicine was 653 in 2011 compared to the higher value of 869 in 2005 The decreasing trend in average claims per physicians may be due to the increase in the number of PCPs in the absence of a substantial increase in the patient population
26
Final Report Health Practitioner Bonuses
Exhibit 6 Average Number of PCIP Eligible EampM Claims per PCP under Medicare by Specialty 2005shy2011
Finally in the case of nonshyphysicians there was an overall increase in the average number of EampM claims submitted by physician assistants (PA) nurse practitioners (NP) and clinical nurse specialists (CNS) after 2009 (see Exhibit B2 Appendix B) For example the number of claims per PA increased from 125 in 2005 to almost 140 in 2011 On the other hand the number of claims per NP was 253 in 2005 then declined to 219 in 2009 and then increased to about 228 in 2011 The increase in the average number of claims submitted suggests that the dramatic increase in services provided is due to both an increase in the number of providers and in the number of services provided by each nonshyphysician The average number of claims per PCIP recipients by specialty and the average allowed charges per PCIP recipients by specialty are presented in Appendix B Exhibit 12 and 13 respectively
Allowed Charges for PCIP Eligible EampM Claims
So far we have focused on the level of EampM services provided measured in terms of number of claims and the number of providers Next we turn to the dollar value associated with EampM claims measured using allowed charges As shown in Exhibit 7 the total allowed charges (in million dollars) for eligible EampM claims increased for all providers over the period of analysis Overall total allowed charges increased by 58 percent with internal medicine and family medicine physicians accounting for most of this increase It is also noteworthy that the value of claims submitted by nonshyphysicians increased substantially over the same period by a factor between 2 and 3
27
Final Report Health Practitioner Bonuses
Exhibit 7 Total Allowed Charges (in million $) for the PCIP Eligible EampM Claims submitted by All PCPs under Medicare 2005shy2011
Specialty 2005 2006 2007 2008 2009 2010 2011
Physicians $6271 $6575 $7343 $7813 $8119 $9079 $9274
Internal Medicine $3671 $3830 $4251 $4506 $4644 $5182 $5231
Family Medicine $2520 $2645 $2982 $3183 $3340 $3742 $3881
Pediatrics $20 $21 $23 $24 $26 $30 $30
Geriatrics $61 $78 $87 $100 $108 $125 $131
NonshyPhysicians $416 $517 $617 $743 $871 $1114 $1316
Clinical Nurse Specialist $287 $358 $421 $507 $592 $749 $878
Nurse Practitioner $8 $9 $9 $11 $14 $17 $20
Physician Assistant $122 $150 $187 $225 $265 $349 $418
Total $6687 $7091 $7960 $8556 $8990 $10193 $10589
As shown in Exhibit 8 the average allowed charge per PCP for EampM claims increased slightly for internal medicine physicians and pediatricians after 2009 (also see Appendix B Exhibit B2) The average value of EampM claims increased for the other PCPs but not as fast as the total value of these claims Given the moderate increase in the average allowed charges for EampM claims the substantial increase in the aggregate allowed charges is likely due to the increase in the number of claims which in turn as discussed above may be driven by the increase in the number of providers Another important observation is that although the average number of claims submitted by physicians declined over the 2005shy2011 period the average allowed charges remained the same or even increased This observed increase in allowed charges per provider despite the documented decline in the number of claims may reflect changes in the composition of services that physicians are providing We hypothesize that this change in the composition is due to an increase in the supply of services that take more time and which are typically associated with higher charges We explore this hypothesis in the following section
28
Final Report Health Practitioner Bonuses
Exhibit 8 Average Allowed Charges ($) for the PCIP Eligible EampM Claims per PCP under Medicare by Specialty 2005shy2011
Finally we constructed the proportion of practitionerrsquos allowed charges under the Medicare fee schedule (excluding hospital inpatient admission and emergency room visits) that are for PCIP eligible primary care services As observed in Exhibit 9 for both physicians and nonshyphysicians the proportion of services that are PCIP eligible varies across specialties and is in general steadily increasing over the observation period However compared to primary care physicians the nonshyphysicians experienced a much larger percentage change in the share of allowed charges that are associated with PCIP eligible services
Exhibit 9 Share of Allowed Charges for PCIP Eligible EampM Claims by Specialty2005shy2011
Specialty 2005 2006 2007 2008 2009 2010 2011
Physicians
Internal Medicine 583 590 611 609 612 651 632
Family Medicine 692 699 724 722 725 750 734
Pediatrics 289 376 439 426 446 517 480
Geriatrics 754 845 851 858 855 879 867
NonshyPhysicians
Clinical Nurse Specialist 239 249 258 299 333 364 407
Nurse Practitioner 616 649 647 663 666 708 715
Physician Assistant 506 514 529 534 543 598 591
Note the proportions are of allowed charges for all Medicare claims (excluding hospital inpatient ER drug and lab)
29
Exhibit 8 Average Allowed Charges ($) for the PCIP Eligible EampM Claims per PCP under Medicare by Specialty 2005-2011
Final Report Health Practitioner Bonuses
While the proportion of services that are PCIP eligible is increasing over the observation period the opposite is true for the proportion of EampM claims (Exhibit 10) Consistent with the decrease in the aggregate number of EampM claims documented above we observe that the share of EampM claims out of the total Medicare claims is also slightly decreasing over the period For example in the case of providers specializing in internal medicine the share decreased from 411 percent in 2005 to 375 percent in 2011
Exhibit 10 Share of PCIP Eligible EampM Claims by Specialty 2005shy2011
Specialty 2005 2006 2007 2008 2009 2010 2011
Physicians
Internal Medicine 411 411 401 393 373 383 375
Family Medicine 432 430 419 409 386 392 384
Pediatrics 309 338 347 347 330 342 341
Geriatrics 648 696 677 641 610 600 603
NonshyPhysicians
Clinical Nurse Specialist 272 262 259 276 288 309 329
Nurse Practitioner 558 567 548 519 485 503 500
Physician Assistant 455 461 450 438 410 434 431
Note the proportions are calculated out of all Medicare claims (excluding hospital inpatient ER drug and lab)
The trends in primary care services and providers discussed above apply in general to the more restricted sample of PCIP recipients (Exhibits B4shy7 in Appendix B) When we limit the number of providers to 2011 PCIP recipients we observe a slight decrease in the average number of eligible claims submitted by physicians (Exhibit B5 Appendix B) and an overall increase in the average allowed charges over the study period (Exhibit B6 Appendix B)
C Econometric Framework
We used the providershylevel data to address the key research questions related to the Medicare PCIP We estimated several regressionshybased models using the DID method to obtain consistent estimates of the PCIP policy effect39 In order to implement the DID model we
1 Form a group of providers (treatment group) who are likely to be affected by the PCIP program including the following specialties family practice internal medicine pediatrics and geriatrics
2 Identify a natural relevant comparisoncontrol group (other nonshyprimary careshypractitioners) who are not likely to be affected by the PCIPshy
3 Assess the changes in our key outcomes of interest for the treatment group relative to the control group before and after the PCIP policy is in effect
We estimate the following econometric model to identify the effect of Medicare PCIP program on the magnitude of primary care EampM services
39 An alternative estimation method is a preshypost analysis but if there are unobserved factors that affect the
magnitude of EampM services supplied by any provider (primary or nonshyprimary care) and the effect of these unobserved factors varies over time a preshypost model would not yield an unbiased incentive effect
30
Final Report Health Practitioner Bonuses
Sit = + lowast Ti + lowast t + 8 lowast t lowast Ti + it lowast + Eit
We let Sit be the volume of eligible EampM services provided by provider i in period t Ti is anindicator for treatment group that takes the value 1 if the provider is a PCP and zero otherwise the variable Postt is an indicator variable taking the value of 1 in the years when the PCIP policyis likely to impact the behavior of the providers and 0 otherwise the vector Xit includes providercharacteristics such as age and gender The term Eit represents the net influence of randomunobserved factors affecting EampM services Importantly the estimated coefficient 8 (the coefficient of the interaction term between the treatment group indicator and the postshyPCIP policy period indicator) in equation (1) represents an unbiased estimate of the effect of the Medicare primary care incentive payment on the volume of primary care EampM services The derivation of this estimated effect is presented in Appendix C (C1) A similar methodology can be applied to estimate the effect of the incentive payment on other outcomes of interest
The choice of the control group for the DID model was based on several criteria Ideally we would have included providers with nonshyeligible specialties who also supplied EampM services In order to determine some preferred comparison group providers we
1 Evaluated the frequency of PCIP eligible and nonshyeligible providers by (primary) specialtyavailable in the Provider360 dataset after merging that data set with the list of NPIs of 2011PCIP recipients
2 Examined the volume of claims related to evaluation and management (EampM) servicesby specialty based on 2009 Medicare claims by service and specialty
3 Chose based on the volume of claims and the number of providers 8 PCIP nonshyeligiblespecialties These PCIP nonshyeligible specialties are (1) Psychiatry amp Neurology (2)Obstetrics amp Gynecology (3) Urology (4) Ophthalmology (5) Pathology (6)Psychologist (7) Podiatrist and (8) Optometrist Total number of PCIP eligible claimssubmitted by these providers with PCIP nonshyeligible specialties is presented in AppendixB Exhibit B14
D Main Results
The estimation of DID regression models is based on the number of eligible providers the volume of claims for PCIP eligible EampM services and the allowed chargespayments associated with those claims The volume of EampM claims and payments analyzed here excludes those for hospital inpatient ER drug and laboratory services As we explain above Medicare providers with a PCIPshyeligible specialty (ie family practice internal medicine geriatrics pediatrics NP PA and clinical nurse specialists) that have at least one Medicare claim are included in the ldquotreatmentrdquo group These are the providers who are likely to be affected by the Medicare PCIP policy Given that the announcement of the PCIP program was made in 201040 we assumed that the providers with Medicare PCIP eligible specialties would be potentially responsive to the
40 Source Patient Protection and Affordable Care Act (lsquolsquoPPACArsquorsquo Public Law 111ndash148) For our analysis we report a
single estimate of PCIP impact under each regression model where year 2010 and 2011 are considered as the postshypolicy periods We performed several sensitivity analyses to investigate if the estimated impact is significantly different between 2010 and 2011 we also checked if the results change once we consider 2011 as the only post period Based on such detailed analysis we did not find any systematic evidence that the estimated impact is different between these two years and they are not sensitive to the choice of postshypolicy period
31
Final Report Health Practitioner Bonuses
incentive as early as year 2010 Therefore years 2010 and 2011 represent the postshypolicy period
The DID regression models were estimated using several subshysamples (1) all providers (2) only providers that appear in all 7 years of data (roughly 44 percent of all providers) (3) providers who were near the PCIP eligibility criteria in 2009 (ie restricted to providers who had the share of total Medicare claim payments shyshy allowed chargesshyshy between 50 percent and 65 percent for PCIP eligible EampM services About 15 percent of all providers in the sample met this restriction
In Exhibit 11 we summarize the average volume of PCIP eligible EampM claims and the allowed chargespayments associated with those claims by select patient category and CPT code for providers in the ldquotreatmentrdquo group Comparing the first and last columns we observe that providers near the 60 percent eligibility threshold generate more EampM claims on average compared to the average PCP accepting Medicare (895 vs 590)
Exhibit 11 Number of PCIP Eligible EampM Claims and Mean Allowed Charges per Provider per Year by Types of Claims for Providers with PCIP Eligible Specialty 2005shy2011
All Providers Providers in
All Years
Providers Near
Eligibility
Analysis Sample
Number of Unique Providers with PCIP Eligible Specialty
264141 129587 17081
Annual Average Number of PCIP Eligible EampM Claims per provider
All EampM Claims 590 752 895
New Patient Claims 19 21 25
Established Patient Claims 487 628 813
Other Claims 84 103 57
Claims in 3 Major CPT Codes
Established Patients (15 mins) 243 315 403
Established Patients (25 mins) 177 227 282
Established Patients (40 mins) 20 25 34
Annual Average Allowed Charges for PCIP Eligible EampM Claims per Provider
All EampM Payments $40208 $51016 $60235
New Patient Payments $1941 $2223 $2661
Established Patient Payments $32409 $41764 $53755
Other Payments $5858 $7029 $3819
Payments in 3 Major CPT Codes
Established Patients (15 mins) $13613 $17635 $22712
Established Patients (25 mins) $15217 $19524 $24581
Established Patients (40 mins) $2313 $2976 $4051
Note Summary of PCIP eligibility criteria Primary care physicians (with internal medicine family practice pediatrics and geriatrics specialty) who have at least 60 percent of the practitionerrsquos allowed charges under the Medicare physician fee schedule (excluding hospital inpatient care and emergency department visits) are eligible for primary care services The PCIP eligible primary care services are defined by specific EampM codes Medicare PCIP is also provided to physician assistants nurse practitioners and clinical nurse specialists who meet the similar eligibility criteria For the purpose of our analysis we consider the PCPs (with the PCIP eligible specialty) who have
32
Final Report Health Practitioner Bonuses
50 percentshy65 percent of their services for PCIP eligible EampM services (defined by specific EampM codes) in 2009 are considered to be near the eligibility threshold
For the control group the number of providers the volume of their Medicare claims for EampM services and the associated allowed charges for the providers with the PCIP nonshyeligible specialties are presented in Exhibit 12 As expected providers in the control group generated much fewer EampM claims compared to providers in the treatment group Specifically providers in the control group supplied less than half the volume of EampM services compared to providers in the treatment group (ie 296 vs 590)
Exhibit 12 Number of PCIP Eligible EampM Claims and Mean Allowed Charges per Provider per Year by Types of Claims for Providers with PCIP NonshyEligible Specialty 2005shy2011
All Providers Providers in All Year
Analysis Sample
Number of Unique Providers with PCIP NonshyEligible Specialty
108302 70583
Annual Average Number of PCIP Eligible EampM Claims per Provider
All EampM Claims 296 333
New Patients Claims 35 38
Established Patients Claims 243 276
Other Claims 18 19
Claims in 3 Major CPT Codes
Established Patients (15 mins) 129 146
Established Patients (25 mins) 47 53
Established Patients (40 mins) 5 6
Annual Average Allowed Charges for PCIP Eligible EampM Claims per Provider
All EampM Payments $18618 $20868
New Patients Payments $3421 $3724
Established Patients Payments $14108 $15975
Other Payments $1089 $1169
Payments in 3 Major CPT Codes
Established Patients (15 mins) $7321 $8288
Established Patients (25 mins) $4048 $4578
Established Patients (40 mins) $641 $711
1 Impact of PCIP Policy on Number of Eligible Providers
We examined the changes in the number of providers with a Medicare PCIP eligible specialty in a county who have at least one claim for PCIP eligible services to identify the potential impact of the PCIP policy on these providers Exhibit 13 shows the results from the DID regression models in which we use the number of providers in a county and in a specific year as the outcome variable (Model 1) the number of physicians in each county and year (Model 2) and the number of nonshyphysicians (ie NP PA and CN) The key variable in each model is the interaction between the indicator for PCIP eligible specialty and the indicator for the period after 2009
33
shy
Final Report Health Practitioner Bonuses
In Model 1 the first estimated coefficient suggests that on average the number of Medicare providers with a PCIP eligible specialty and at least one PCIP eligible claim increased by about 28 providers per county in each year after 2009 due to the Medicare PCIP This represents an economically meaningful increase given that on average there were about 15 providers per county per year in a PCIP eligible specialty during the sample period This increase (almost 19 percent) in the number of providers in PCIP eligible specialties may be the primary reason for the estimated reduction in the number of EampM claims per provider due to the PCIP policy
In addition when we restrict the estimation to physicians (Model 2) the increase in the number of physicians with a PCIP eligible specialty attributable to the policy is about 2 per county per year This is almost 10 percent of the average number of primary care physicians in a given PCIP eligible specialty per county per year (average is almost 19) Furthermore the estimated policy impact in Model 3 indicates that the number of PCIP eligible nonshyphysicians increased by over 36 providers per county per year Thus all three models confirm that the introduction of the PCIP policy generated an increase in the number of PCIP eligible providers above and beyond the general increasing time trend Subsequently this increased number of providers may have resulted in the reduction in the average number of EampM claims submitted by these Medicare providers after 200941
Exhibit 13 Impact of Medicare PCIP on the Number of PCPs with Medicare Claims for PCIP Eligible Services (2005shy2011)
Dependent Variable Number of
Providers per county
All Providers
(1)
Physicians Only
(2)
Non Physicians Only
(3)
PCIP Elig Specialty Indicator 4247 3400 2721
(3133) (3647) (2078)
Elig Specialty Ind x Post 2009 2759 1950 3632
(0444) (0674) (0375)
Post 2009 2929 1884 2895
(0455) (0541) (0304)
Median Income ($10k) 1591 2218 1061
(0385) (0468) (0206)
Percent in poverty 0254 0339 0210
(00479) (00587) (00285)
Population (10k) 0536 0607 0317
(00280) (00339) (00128)
Percent Population over 65 shy0307 shy0196 shy0234
(00363) (00452) (00238)
Unemployment Rate shy0518 shy0510 shy0400
41 We have also estimated similar models for the primary care providers who have any Medicare claims (not
necessarily under PCIP eligible services) and the estimated effects of the PCIP policy are slightly larger in those cases These additional results are included in Appendix B Exhibit B 15 In addition we have estimated similar models of providers who met the 60 PCIP eligibility threshold in each year (2005shy2011) As expected the estimated impact of PCIP policy on the number of primary care providers is relatively lower for this restricted set of providers However if we focus on this restricted set of providers then we are likely to lose those providers who may have been induced to provide PCIP eligible services in response to the policy but may not have reached the 60 threshold Similarly we would lose the information on the providers who have reduced the proportion to below 60 The estimated results on this restricted set of providers are presented in Appendix B Exhibit B16
34
-
shy
Final Report Health Practitioner Bonuses
Dependent Variable Number of
Providers per county
All Providers
(1)
Physicians Only
(2)
Non-Physicians Only
(3)
(00461) (00557) (00324)
Intercept shy4970 shy5988 shy3006
(3489) (3996) (2344)
Specialty Fixed Effects Yes Yes Yes
Year Fixed Effects Yes Yes Yes
State Fixed Effects Yes Yes Yes
N 140192 107526 95647
Adj Rshysq 0310 0338 0365
Note Robust standard errors are in parentheses + significance at 10 percent significance at 5 percent Thenumber of observation is based on the number of counties the number of years and the number of providerspecialties in each model (ie physicians include 4 primary care specialties and nonshyphysicians include 3 subshyspecialties)shy
The PCIP policy could impact the number of Medicare providers submitting PCIP eligible claims through several channels First the policy may induce an established PCP to start to treat Medicare patients (new or established patient) under PCIP eligible services that they may not have done before In addition the policy may also encourage new providers fresh out of their completion of residency training to provide PCIP eligible services under Medicare Lastly one can also argue that the PCIP policy may encourage providers with a PCIP nonshyeligible specialty to switch to a PCIPshyeligible specialty and increase their chance to receive the incentive payment This last scenario could be especially relevant for internal medicine subshyspecialties such as cardiology pulmonary disease nephrology and endocrinology which are not PCIPshyeligible although the internal medicine specialty is PCIPshyeligible Without judging whether such specialty switching is a desired outcome under the PCIP policy we first examine to what extent such switching of specialty is prevalent in our dataset and second whether such phenomenon is large enough to influence the impact of the PCIP policy on the number of providers who submit at least one Medicare claim under PCIP eligible services
Based on our 2005shy2011 claims data we have estimated that during the postshyPCIP policy period (2010 and 2011) there are about 30864 new primary care physicians (family practice internal medicine pediatrics and geriatrics) and 27927 new primary care nonshyphysicians who have submitted at least one claim under Medicare (Note that in this accounting we do not attempt to distinguish between ldquonewrdquo providers who were induced by the PCIP to participate and providers that would have entered the Medicare program anyway) Based on our Medicare data we have estimated that 3057 physicians with at least one Medicare claim switched their specialty to a PCIP eligible specialty during the postshypolicy period Over 50 percent (1645) of these specialty switches are switches into internal medicine mainly from internal medicine subshyspecialties The number of specialty switchers is substantially smaller than the number of total new Medicare physicians with a PCIP eligible specialty in the postshypolicy periods Thus switching of specialty could not account for the estimated impact of the PCIP policy on the number of primary care physicians
Based on our claims data we estimate that during the postshyPCIP policy period (2010 and 2011) there are 17662 new primary care physicians (family practice internal medicine pediatrics and geriatrics) who have submitted at least one PCIP eligible claim Additionally we have estimated from published sources that during the post policy period there are about 10000 residency
35
Final Report Health Practitioner Bonuses
positions filled under primary care annually from 2009 to 201142 If the Medicare PCIP policy attracts part of these providers under Medicare to provide PCIP eligible services then such evidence would be consistent with our estimated impact of the PCIP policy in Exhibit 13
Exhibit 14 shows the impact of the PCIP policy on the number of providers accepting new Medicare patients (Model 1) and on the number of new Medicare providers (Model 2) The estimated coefficient on the main variable of interest mdash the interaction between the PCIP eligibility indicator and the postshy2009 indicator mdash suggests that due to the PCIP policy on average the number of PCPs accepting new Medicare patients increased by about 1 provider per county per year for a given PCIP eligible specialty This estimated impact is not negligible given that there are about 9 Medicare PCPs for a given primary care specialty who accept new Medicare patients per county per year during the sample period
Similarly Model (2) in Exhibit 14 shows the impact of the PCIP policy on the number of new Medicare providers who have submitted Medicare claims for PCIP eligible services The estimated coefficient on the main variable of interest suggests that due to the PCIP policy on average the number of new Medicare primary care providers with at least one claim submitted for PCIP eligible services increased by 0148 per county per year for a given PCIP eligible specialty Given that on average there are about 14 new Medicare primary care providers per county per year in a PCIP eligible specialty with at least one PCIP eligible claim during the sample period the estimated impact is again not negligible
Exhibit 14 Impact of Medicare PCIP on the Number of Providers Accepting New Medicare Patients and the Number of New Primary Care Providers under Medicare with Claims for
PCIP Eligible Services (2005shy2011)
Number of Providers Accepting
New Medicare Patients (1)
Number of New
Medicare Providers (2)
PCIP Elig Specialty Indicator 2819 4367
(1959) (0297)
Elig Specialty Ind x Post 2009 0883 0148
(0345) (00440)
Post 2009 1605 0293
(0369) (00460)
Median Income ($10k) 1455 00508
(0295) (00445)
Percent in poverty 0143 00160
(00366) (000545)
Population (10k) 0351 00482
(00204) (000328)
Percent Population over 65 shy0177 shy00443
(00295) (000436)
Unemployment Rate shy0314 shy00512
(00374) (000544)
Intercept shy3432 shy3926
42 Estimates include the following primary care specialties family practice internal medicine (including pediatrics)
pediatrics Source National Resident Matching Program Results and Data 2011 Main Residency Match National Resident Matching Program Washington DC 2011
36
Final Report Health Practitioner Bonuses
Number of Providers Accepting
New Medicare Patients (1)
Number of New
Medicare Providers (2)
(2461) (0330)
Specialty Fixed Effects Yes Yes
Year Fixed Effects Yes Yes
State Fixed Effects Yes Yes
N
Adj Rshysq
140192
0250
121084
0255
Note Robust standard errors are in parentheses + significance at 10 percent significance at 5 percent
2 Impact of PCIP Policy on Number of Claims for EampM Services
The DID estimates from the model using the volume of EampM claims as the outcome variable are presented in Exhibit 15 The estimated coefficient of that interaction term in the first column of Exhibit 15 (ie column (1)) indicates that in response to the Medicare PCIP policy PCPs with PCIP eligible specialties reduced their number of PCIP eligible EampM claims by about 52 on average 43 This represents a reduction in the volume of claims per provider of a little less than 9 percent Furthermore we estimate that on average providers with PCIP eligible specialties had about 187 more EampM claims submitted under Medicare during the sample period than the providers with PCIP nonshyeligible specialties Also for the providers with both PCIP eligible and nonshyeligible specialties the average number of EampM claims submitted went down by 70 claims after 2009
In addition we find that as the number of primary care providers per 10000 population increases the number of claims per provider decreases Finally the volume of claims per provider increases with the providerrsquos age and with the increase in the size of the Medicare population The effect of unemployment on the number of EampM claims per provider is also positive and statistically significant
When the sample is restricted to providers who were near the PCIP eligibility threshold in 2009 (column (3)) the estimated reduction in the number of claims per provider due to the PCIP policy is smaller only about 33 claims44 The reduction in the number of claims per provider in response to the PCIP policy may appear counterintuitive However the total number and value of claims may still increase as a result of the policy as long the number of providers with a PCIP
43 The postshypost policy period in our analysis comprises of two years 2010 and 2011 We have also estimated the
impact of the PCIP policy on the volume of claims and other outcomes discussed later for each postshypolicy year separately and the effects in these two years are not statistically different for a given outcome of interest
44 We focus on the primary care providers who are near the PCIP eligibility threshold because these providers are at
the margin to improve the volume of their PCIP eligible services by incurring a relatively low cost and gain the PCIP incentive payment (ie marginal benefit is much higher relative to the marginal cost) Therefore we would expect the impact of PCIP policy (if there is any) would be more substantial among the providers near the eligibility threshold However if we only focus on those who met the 60 criteria then we would lose the behavioral changes among the providers who are below the threshold may have tried to reach the 60 threshold in response to PCIP This may bias the PCIP impact By focusing only on those providers who met the 60 eligibility criteria we would face the typical problem of selection bias Hence focusing on those providers who are near the eligibility threshold circumvents this problem but captures the essence of the hypothesis that we are referring to In addition we have estimated several models with different ranges (50shy65 50shy70 55shy65 and 40shy80) of the proportion of allowed charges on PCIP eligible primary care services and tested the sensitivity of our results At least for the first three ranges mentioned we find that results are not sensitive to those three ranges However once we broaden the analysis to 40shy80 the estimated impact is in between the effects we observed for all providers and the providers in 50shy65 threshold (as expected) Also the mean value of this proportion in the sample is about 53
37
Final Report Health Practitioner Bonuses
eligible specialty increases at a higher rate than the decline in the number of claims submitted per provider Thus a reduction in the number of claims per provider should not be interpreted as evidence of decreased access to primary care services if the number of providers is increasing at the same time
Exhibit 15 Impact of Medicare PCIP Policy on PCIP Eligible EampM Claims (2005shy2011)
Dependent Variable PCIP Eligible
EampM Claims per Provider
Analysis Sample
(1) EampM
Claims
(2) EampM Claims
(Providers in All Years)
(3) EampM Claims
(Near Eligib 09)
PCIP Elig Specialty Indicator 1869 1166 1176
(1293) (1838) (1246)
Elig Specialty Ind x Post 2009 shy5173 shy3696 shy3259
(1814) (2412) (5762)
Post 2009 shy7442 shy7727 shy3728
(2692) (3423) (3155)
Age 8450 6980 2241
(00450) (00637) (00547)
Male 1657 1989 9039
(0965) (1243) (1162)
Urban shy3978 shy5101 shy4900
(1712) (2153) (2190)
Median Income ($10k) shy7296 shy5815 00475
(0886) (1137) (1057)
Percent in poverty shy4678 shy4105 1523
(0222) (0283) (0272)
Population (10k) shy0107 shy0134 shy00710
(000441) (000576) (000531)
Percent Population over 65 1784 2072 1844
(0256) (0319) (0322)
Unemployment Rate 1307 1766 6838
(0425) (0560) (0522)
Primary Care Phypop10k shy0156 shy0172 shy0258
(000716) (00102) (00146)
PC Nonshyphypop10k shy0452 shy0627 shy0208
(00154) (00234) (00228)
Intercept shy34610 shy30330 shy11460
(1669) (2263) (1734)
Specialty Fixed Effects Yes Yes Yes
Year Fixed Effects Yes Yes Yes
State Fixed Effects Yes Yes Yes
N 2014835 1397760 746845
Adj Rshysq 0222 0241 0380
Note Robust standard errors are in parentheses + significance at 10 percent significance at 5 percent
38
Final Report Health Practitioner Bonuses
3 Impact of PCIP Policy on Allowed Charges for EampM Services
The estimated effect of the PCIP policy on the allowed charges associated with the EampM claims is in general positive and statistically significant (Exhibit 16) While we estimate no significant policy impact on charges for our full sample of providers (Model 1) we do find a significant policy effect when we restrict the sample to those providers most likely to change their behavior in response to the PCIP ie the providers that were near eligibility More specifically for the sample of providers who were near the PCIP eligibility threshold in 2009 (ie Model 3) the estimated coefficient of the interaction term in the last column of Exhibit 16 shows that in response to the Medicare PCIP policy on average the allowed charges of primary care providers with a PCIP eligible specialty increased by about $5611 The estimated effect represents about 93 percent of the mean allowed charges ($60235) per provider per year for the providers with PCIP eligible specialties who were near the eligibility threshold in 2009 This estimated effect on the allowed charges in response to a 10 percent Medicare PCIP program suggests an implied elasticity of the allowed charges per provider per year with respect to the payment is about 1 (ie 9310) The effect is smaller if we restrict the sample to all the providers who submitted EampM claims under Medicare in all seven years The mean allowed charges per provider per year for these providers were $51016 Thus due to the Medicare PCIP policy they experienced an additional 56 percent increase ($2839$51016) in allowed charges One caveat surrounding these results is that since the actual Medicare payment may be smaller in magnitude compared to the allowed charges the increase in actual Medicare payments may be lower than our estimated increases in allowed charges
Exhibit 16 Impact of Medicare PCIP Policy on Allowed Charges for PCIP Eligible EampM Claims (2005shy2011)
Dependent Variable Allowed
Charges for PCIP Eligible EampM
Claims per Provider (EampM
Payments)
Analysis Sample
(1)
EampM Charges
(2)
EampM Charges
(Providers in All Years)
(3)
EampM Charges
(Near Eligib 09)
PCIP Elig Specialty Indicator 74741 11382 7518
(10776) (15832) (10475)
Elig Specialty Ind x Post 2009 5944 28393 56109
(1328) (1769) (4206)
Post 2009 8285 12090 24180
(1835) (2327) (2120)
Age 5501 4099 1234
(3093) (4324) (3721)
Male 110676 131571 61031
(6897) (8780) (8071)
Urban shy10435 shy15097 shy19719
(1116) (1389) (1394)
Median Income ($10k) 8678 12737 9787
(6178) (7872) (7147)
Percent in poverty shy2473 shy1804 1343
(1470) (1862) (1750)
Population (10k) shy2646 shy3481 shy0464
(0322) (0416) (0384)
39
Final Report Health Practitioner Bonuses
Dependent Variable Allowed
Charges for PCIP Eligible EampM
Claims per Provider (EampM
Payments)
Analysis Sample
(1)
EampM Charges
(2)
EampM Charges
(Providers in All Years)
(3)
EampM Charges
(Near Eligib 09)
Percent Population over 65 12427 14194 12150
(1764) (2177) (2170)
Unemployment Rate 12175 15928 7567
(2998) (3869) (3632)
Primary Care Phypop10k shy7423 shy7227 shy1433
(0503) (0703) (0952)
PC Nonshyphypop10k shy3412 shy4836 shy1718
(1082) (1629) (1540)
Intercept shy371778 shy337862 shy158347
(12927) (18147) (13208)
Specialty Fixed Effects Yes Yes Yes
Year Fixed Effects Yes Yes Yes
State Fixed Effects Yes Yes Yes
N 2014835 1397760 746845
Adj Rshysq 0222 0246 0367
Note Robust standard errors are in parentheses + significance at 10 percent significance at 5 percent
So far we have found that the PCIP program resulted in increased allowed charges for EampM services per provider despite some decline in the corresponding number of EampM claims We have already discussed that one potential reason for the decline in the average volume of claims could be due the increase in the number of providers under PCIP eligible specialties that can be specifically attributed to the PCIP policy However the question still remains regarding a shift in the composition of services that may have resulted in increased allowed charges or payments despite the decline in the number of claims per provider
In order to gain a deeper understanding of this issue we estimate the impact of the Medicare PCIP policy on each key component of EampM services (Exhibit 17) More specifically we examine the impact of the policy on the volume of claims associated with services for new patients established patients and EampM claims for all other services EampM claims associated with services for established patients account for more than 80 percent of all the EampM claims (and allowed charges) submitted by providers with PCIP eligible specialties45 Furthermore 15 and 25 minute visits account for 40 percent and 30 percent of all EampM claims for established patients respectively Moreover the 25 minute visits account for a slightly higher share of allowed charges ie 38 percent relative to 34 percent for 15 minute visits
In Exhibit 17 we present the estimated impact of the PCIP on the average number of EampM claims per provider for three relevant samples of providers We find that the introduction of the Medicare PCIP policy reduced the average number of EampM claims submitted for both new and established patients The estimated impact suggests that on average the number of EampM claims per provider for 15 minute visits declined by an additional 46 among PCIPshyeligible providers compared to nonshyeligible providers Similarly results using the sample of all providers
45 For the providers near the PCIP eligibility threshold this share of EampM claims is almost 90 percent
40
lsquo
Final Report Health Practitioner Bonuses
suggest that EampM claims per provider for 25 minute visits increased by an additional 13 among PCIPshyeligible providers compared to nonshyeligible providers When we restrict the sample to providers near the PCIP eligibility threshold in 2009 the decline for EampM claims for 15 minutes visits due to PCIP policy is about 57 claims while the EampM claims associated with 25 minute visits increased by about 42 claims due to the PCIP policy
Exhibit 17 Estimated Impact of Medicare PCIP Policy on the Number of PCIP Eligible EampM Claims (2005shy2011)
Estimated coefficient of variable Elig Specialty Ind x Post 2009 from each DID Model
Dependent Variable Analysis Sample
All Providers in All Years Providers Near Eligibility lsquo09
All EampM Claims shy5173 shy3696 shy3259
New Patient Claims shy1354 shy1591 shy1172
Established Patient Claims shy3525 shy2091 shy2224
Other Claims shy2941 shy0150 1369
Claims by Duration (Minutes)
New Patient Visits
10 00673 00850 00551
20 0160 00269 0209+
30 shy5102 shy5894 shy4607
45 shy7697 shy8930 shy6854
60 shy0966 shy1194 shy0528
Established Patient Visits
5 shy3926 shy3621 shy6227
10 1611 1702 shy2487
15 shy4554 shy4716 shy5649
25 1257 2679 4155
40 00347 1382 1417
Note Robust standard errors are in parentheses + significance at 10 percent significance at 5 percent
The above findings raise the question of whether the policyshyinduced net decrease in the number of EampM claims will be reflected in the corresponding allowed charges To answer this question we estimated the potential impact of the PCIP policy on the allowed charges associated with the each component of the EampM claims (Exhibit 18)
The estimated impact of the PCIP policy on allowed charges associated with 15 minute visits for established patients suggests that on average the policy additionally reduced the total allowed charges by about $1577 per provider per year after 2009 However the estimated policy induced reduction in allowed charges is smaller for providers near the PCIP eligibility threshold ie a reduction of about $602
Moreover the PCIP policy additionally increased the total annual allowed charges by about $2740 per provider after 2009 for 25 minute visits for established patients This is a substantial increase considering that providers with PCIP eligible specialties had about $15217 in allowed charges per year for 25 minute visits for established patients The impact is even larger once the sample is restricted to providers near the PCIP eligibility threshold increase in
41
lsquo
Final Report Health Practitioner Bonuses
total annual allowed charges by about $6807 a 28 percent increase Similarly allowed charges associated with all EampM services for all established patients increased substantially by about $6544 or 12 percent for providers near the PCIP eligibility threshold In the case of all providers the estimated increase in total annual allowed charges for established patients was $1245 per provider We find that the PCIP policy resulted in increased Medicare allowed charges across all providers with PCIP eligible specialties This increase in allowed charges is likely to have also resulted in increased payments for these primary care EampM services
Exhibit 18 Estimated Impact of Medicare PCIP on the Allowed Charges for PCIP Eligible EampM Claims (2005shy2011)
Estimated coefficient of the variable Elig Specialty Ind x Post 2009 from each DID Model
Dependent Variable Analysis Sample
All Providers in All Years Providers Near Eligibility lsquo09
All EampM Payments 5944 28393 56109
New Patient Payments shy19109 shy22065 shy16024
Established Patient Payments 12446 39059 65439
Other Payments 7258 11400 6694
Payments by Duration (Minutes)
New Patient Payments
10 0951 1407+ 0706
20 shy1710 shy2891 shy1237+
30 shy5445 shy6203 shy4922
45 shy11845 shy13594 shy10331
60 shy1658 shy1993 shy6551
Established Patient Payments
5 shy7515 shy7066 shy1223
10 shy3412 shy3594+ shy1183
15 shy15772 shy10952 shy6017
25 27404 46709 68070
40 1906 4367 5792
Note Robust standard errors are in parentheses + significance at 10 percent significance at 5 percent
42
Final Report Health Practitioner Bonuses
Analyzing the Impact of Financial Incentives for Primary Care Providers in Shortage Areas
A Background
Access to health care in underserved areas has been an ongoing source of concern among policy makers A 2013 CRS report for the congress (Physician Supply and the ACA by EJ Heisler) indicates that the expansion of health insurance coverage under the ACA is likely to stimulate the demand for primary care in general and also in the underserved areas HRSA designates certain underserved areas as primary care Health Profession Shortage Areas (HPSAs) These areas meet a defined threshold of physicians to population ratio46 HPSA designations are currently limited to primary medical care HPSAs dental HPSAs and mental health HPSAs In this section we focus on only primary care HPSAs All nonshyfederal Doctors of Medicine (MD) and Doctors of Osteopathy (DO) providing direct patient care and who practice principally in one of the four primary care specialties shy general or family practice general internal medicine pediatrics and obstetricsgynecology shy will be counted under the definition of primary care HPSA As previously noted since 1987 Medicare has been paying bonus payments initially five percent to physicians providing care in rural geographic HPSAs In 1991 the bonus payment was increased to 10 percent and eligibility extended to services provided by physicians in urban geographic HPSAs Thus this particular form of bonus payment has been in place for almost 25 years Although the HPSA bonus is available to nonshyprimary care providers such as dentists and mental health care providers for the purpose of this study we focus only on primary care providers eligible for primary care HPSA bonus
Section 413a of the Medicare Modernization Act put in place an additional 5 percent bonus payment for physicians practicing in Physician Scarcity Areas (PSAs)47 PSAs were those counties and rural zip codes in MSAs with the lowest physician to population ratios These areas often coincided with geographic HPSAs so that physicians practicing in those areas received a 15 percent additional bonus payment during 2005shy2008 when the PSA bonuses were in effect
Some key points to note regarding the PSA bonus are the following
Medicare paid the 5 percent PSA bonus on a quarterly basis and the bonus was based on what Medicare actually paid not the Medicareshyapproved payment amount
The same service could be eligible for the PSA bonus and the HPSA bonus
The payment was based on where the service is performed not on the address of the beneficiary
46 Health Professionals Shortage Areas (HPSAs) are based upon criteria set forth under Section 332 of the Public
Health Service Act HPSAs are defined to include 1) urban and rural geographic areas 2) population groups and 3) facilities with shortages of health professionals HPSA designations are currently limited to primary medicalcare HPSAs dental HPSAs and mental health HPSAs in the past similar designations identified shortages in a wide variety of health professions including podiatry pharmacy and veterinary medicine (Salinsky 2010) For primary care HPSAs one of the following two conditions must prevail within the area a) a ratio of population to fullshytimeshyequivalent primary care physician of at least 35001 or b) a ratio of population to fullshytimeshyequivalent primary care physician of less than 35001 but greater than 30001 and an unusually high need for primary care services or insufficient capacity of existing primary care providers
47 The expiration of the PSA bonus in 2008 was likely a result of Medicare expenditures being capped by law In
House Bill HR 6331 of 2008 the cut was equivalent to 106 percent In order to avoid the 106 percent loss PSA designations were allowed to expire which automatically led to the expiration of the PSA bonus Source httpwwwgrahamshycenterorgonlineetcmedialibgrahamdocumentsmedicareshypaymentmaPar0001Filetmpmapdf
43
Final Report Health Practitioner Bonuses
The PSA bonus was paid on services rendered on or after January 1 2005 through June 30 2008
Only the physician designations of General Practice Family Practice Internal Medicine and ObstetricsGynecology were paid the bonus for the ZIP code areas designated as primary care PSAs All other physician provider specialties were eligible for the specialty PSA area bonus for the ZIP codes areas designated as specialty PSAs48 Once again for the purpose of this study we focus only on the primary care physicians with PSA bonus eligible specialties
Our main claimsshylevel data includes a variable that indicates the location of each provider Additionally CMS provides the list of HPSA and PSA areas In this section we review the PSA geographic areas and the extent of overlap with HPSAs Physicians practicing in these overlap areas received a 15 percent additional bonus payment during 2005shy2008 when the PSA bonuses were in effect
In the exhibits below we present the distribution of primary care providers across HPSA and PSA areas Due to limited data we do not present provider counts for HPSA areas prior to 2007 while the PSA bonus was no longer in place after 2008 Moreover we do not use data from 2011 for the DID analysis as it will include the confounding effect of Medicare PCIP49
Although the PSA bonus does not apply to nonshyphysicians we report the number of nonshyphysicians in PSA areas (in italics) for comparison purposes
We consider only those counties that have a full rather than partial primary care HPSA designation In 2011 we identified 1279 full HPSA counties covering 40 percent of the total US population Exhibits 19 amp 20 show the distribution of PCPs and 2011 PCIP recipients across HPSA and PSA areas over the 2005shy2011 period
48 Dentist Podiatrists Optometrists and Chiropractors were not eligible for PSA bonus Source
httpwwwcmsgovMedicareMedicareshyFeeshyforshyServiceshyPaymentHPSAPSAPhysicianBonusesPSAhtml For zip codes that are not in CMS PSA zip code list the bonus payment cannot be made automatically In these cases physicians have to check whether the county where service is provided is included in CMS PSA county list If the county is included in the PSA county list then physicians need to include ldquoARrdquo modifier in their claims to collect PSA bonus
49 If a region switched its HPSA status in 2011 which is also the first year Medicare PCIP was available
econometrically it would be difficult to disentangle the effects of these two changes The indicator variables showing change in HPSA status and availability of PCIP would be perfectly collinear
44
Final Report Health Practitioner Bonuses
Exhibit 19 Distribution of Primary Care (PC) Providers by HPSA and PSA Regions
2005 2006 2007 2008 2009 2010 2011
PC Physicians Total Total Total Total Total Total Total
All Providers 13835 6
100 14777 1
100 16515 0
100 17301 8
100 17878 4
100 18507 0
100 19193 0
100
in HPSA x x x x 72804 441 77656 449 79620 445 82101 444 81855 426
in PSA 14446 104 15336 104 17026 103 17323 10 NA NA NA NA NA NA
Both in HPSA amp PSA x x x x 6267 38 6461 37 NA NA NA NA NA NA
PCIP 2011 Recipients 93886 100 99359 100 10896 6
100 11505 0
100 12114 0
100 11749 0
100 11400 2
100
in HPSA x x x x 46578 427 50451 439 52871 436 50762 432 47458 416
in PSA 9771 104 10282 103 11290 104 11605 101 NA NA NA NA NA NA
Both in PSA amp HPSA x x x x 3927 36 4143 36 NA NA NA NA NA NA
PC NonshyPhysicians
All Providers 46634 100 53823 100 68297 100 80041 100 88569 100 97789 100 10935 3
100
in HPSA x x x x 28248 414 33148 414 36700 414 40411 413 43902 401
in PSA 5221 112 5894 11 7379 108 8301 104 NA NA NA NA NA NA
Both in HPSA amp PSA x x x x 2919 43 3270 41 NA NA NA NA NA NA
PCIP 2011 Recipients 18681 100 21456 100 27188 100 34363 100 41202 100 37756 100 35380 100
in HPSA x x x x 11310 416 14279 416 17150 416 15614 414 14256 403
in PSA 2328 125 2603 121 3214 118 3802 111 NA NA NA NA NA NA
Both in PSA amp HPSA x x x x 1273 47 1527 44 NA NA NA NA NA NA
Note HPSA includes only full HPSA areas (data from Area Resource File and HPSA status data are not available prior to 2007) PSA status after 2008 is not applicable as 2008 was the final year of the PSA bonus
45
Final Report Health Practitioner Bonuses
Around 40 percent of all primary care providers supplied services in primary care HPSA counties while roughly 10 percent did so in PSA counties The extent of overlap between these two designations amounts to approximately 3 to 4 percent of providers working in dualshydesignation areas We do not observe important differences in these distributions between all providers and PCIP recipients The same general observations apply to the two most represented specialties ie family practice and internal medicine (Exhibit 20)
Exhibit 20 Distribution of the Number of Internal Medicine and Family Practice Physicians by HPSA and PSA regions
Practice Area 2005 2006 2007 2008 2009 2010 2011
Internal Medicine
All Physicians 69391 74411 83117 87090 90291 93904 97526
in HPSA x x 38011 40382 41411 43461 43188
in PSA 5428 5770 6390 6521 NA NA NA
in HPSA amp PSA x x 2304 2372 NA NA NA
PCIP 2011 Recipients 43188 45502 49451 51813 54062 52576 51007
in HPSA x x 22166 23824 24682 24113 22537
in PSA 3423 3585 3915 4009 NA NA NA
in PSA amp HPSA x x 1303 1386 NA NA NA
Family Practice
All Physicians 61438 65205 72247 75132 77536 79891 82298
in HPSA x x 29652 31700 32602 32954 32834
in PSA 8673 9168 10181 10361 NA NA NA
in HPSA amp PSA x x 3776 3921 NA NA NA
PCIP 2011 Recipients 48448 51377 56622 59902 63227 61584 59931
in HPSA x x 22979 24971 26284 24998 23450
in PSA 6220 6546 7199 7417 NA NA NA
in PSA amp HPSA x x 2561 2695 NA NA NA
Note HPSA includes only full primary care HPSA areas (data from Area Resource File and HPSA status data are not available prior to 2007) PSA status after 2008 is not applicable as 2008 was the final year of the PSA bonus
In the case of nonshyphysicians in 2008 around 40 percent were practicing in primary care HPSA areas (Exhibit B8 in Appendix B) Nurse practitioners and physician assistants alike were distributed almost equally between shortage and nonshyshortage areas in 2008 The same is true whether we look across all providers or only 2011 PCIP recipients
B Impact of the PSA Bonus on Primary Care Supply
Since the PSA bonus was in effect from 2005 to 2008 we applied a DID estimation method to identify the effect of elimination of PSA bonus on the following outcome variables number of eligible providers practitionersrsquo volume of services and their total payments We used the provider level data on the number of EampM claims and allowed charges associated with those claims from 2005 to 2011 The data from 2005 to June 2008 show the scenarios in the preshyelimination (of PSA bonus) period and the data from 2009 to 2010 provide outlook on the postshyelimination period Data from 2011 will not be used for the DID analysis as it will include the confounding effect of the Medicare PCIP bonus The sample is restricted to physicians with the
46
τ
Final Report Health Practitioner Bonuses
following PSA bonus eligible primary care specialties family practice internal medicine and OBshyGYN
Equation (1) below shows the econometric model we estimated to assess the impact of PSA bonus policy
lowast = + lowast + + lowast lowast + lowast + + (1)
The model in equation (I) is specified based on the provider level data in each year Here the dependent variable Sit is the volume of primary care (EampM) services provided by primary or nonshyprimary care practitioner i at time t Ti is an indicator for the treatment group that takes a value of 1 if the provider is in a primary care PSA area and zero otherwise PREt is an indicator variable taking the value of 1 if the services are provided during 2005shy2008 period (when PSA bonus program was in effect) and zero otherwise the vector Xit includes variables reflecting the provider characteristics features of their geographic locations etc and is a timeshyspecific fixed effect term The term εit represents random unobserved factors affecting services
If elimination of the PSA bonus was associated with a reduction in the volume of primary care EampM services provided by practitioners in those areas then we should expect the estimated value of 8 to be positive A positive estimated value of 8 would imply higher volume of services during the period when the PSA bonus was in effect In addition the interpretation of the first four terms in equation (I) is as follows
(α + β + θ + δ) = the average number of EampM claims during the PSA period (PRE) for providers located in the PSA regions
(α + β) = the average number of EampM claims during the PostshyPSA period for providers located in the PSA regions
(θ + δ) = the difference in the average number of EampM claims between the PSA and PostshyPSA period for providers located in the PSA regions
θ = the difference in the average number of EampM claims between the PSA and PostshyPSA period for providers regardless of location
Exhibit 21 shows the results from the estimated DID model to identify the impact of the PSA bonus policy on the supply of primary care services We found that on average providers with PSA bonus eligible specialties irrespective of location were estimated to have about 153 more claims submitted during the PSA period compared to the postshyPSA period However bonusshyeligible providers located in PSA areas had on average an additional 50 claims per year compared to those located in nonshyPSA areas We attribute this additional increase in the volume of primary care EampM services to the PSA bonus policy On the other hand we do not find a statistically significant impact of the PSA bonus policy on the total annual allowed charges per physician (column 2)
47
Final Report Health Practitioner Bonuses
Exhibit 21 Impact of PSA Bonus on the Number of EampM Claims under Medicare 2005shy2010
Number of EampM Claims(1) Allowed Charges for
EampM Claims ($)(2)
Location PSA PC Indicator (PSAPC) 7055 56220
(6177) (4154)
PSA Year Indicator (2005shy2008) 1526 8709
(4405) (2964)
PSAPC PSA Year Ind 4984 shy2412
(7276) (4765)
Age 1376 8845
(00757) (5104)
Male 2069 134952
(1453) (1026)
Urban shy3192 shy4230
(2892) (1849)
Median Income ($10k) shy1047 9267
(1430) (9766)
Percent under poverty shy6671 shy3527
(0359) (2332)
shy0144 shy4476
(000680) (0483)
Percent Population over 65 1936 13894
(0424) (2815)
Unemployment Rate 1574 13370
(0720) (4964)
Primary Care Phymcarepop10k shy0110 shy2049
(00139) (0939)
PC Nonshyphymcarepop10k shy0977 shy7510
(00390) (2675)
Intercept shy6872 shy560014
(1898) (12556)
Specialty Fixed Effects Yes Yes
Year Fixed Effects Yes Yes
State Fixed Effects Yes Yes
N 1006453 1006453
Adj Rshysq 0182 0175
Note Robust standard errors are in parentheses + significance at 10 percent significance at 5 percent The sample is restricted to only providers with the following PSA eligible specialty family practice internal medicine and OBshyGYN
Exhibit 22 shows the results from the estimated DID model to identify the impact of the PSA bonus policy on the number of primary care providers at the zip code level As explained above our primary focus is the estimated coefficient of the interaction term between the PSA status indicator of the location of physicians and the PSA period (ie 2005shy2008) The number
48
Population (10k)
Final Report Health Practitioner Bonuses
of providers with PSA bonus eligible specialties is estimated to increase by about one in PSA areas during the PSA period compared to the number of providers in nonshyPSA areas This represents a meaningful increase given that on average there are about six primary care providers in PSA areas We attribute this additional increase in the number of primary care providers to the PSA bonus policy
Exhibit 22 Impact of PSA Bonus on the Number of Primary Care Providers per County (2005shy2010)
Number of Providers with PSA
Bonus Eligible Specialty
Location PSA PC Indicator (PSAPC) shy4951
(0371)
PSA Year Indicator (2005shy2008) shy1722
(0439)
PSAPC PSA Year Ind 1149
(0301)
Urban 5950
(0221)
Median Income ($10k) 0468
(0150)
Percent in poverty 0256
(0040)
Population (10k) 0007
(0001)
Percent Population over 65 0139
(0033)
Unemployment Rate shy0037
(0057)
Primary Care Phymcarepop10k 0146
(0024)
PC Nonshyphymcarepop10k 0037
(0017)
Intercept shy5250
(1522)
Year Fixed Effects Yes
State Fixed Effects Yes
N 78519
Rshysq 00856
Note Robust standard errors are in parentheses + significance at 10 percent significance at 5 percent The sample is restricted to only providers with the following PSA eligible specialty family practice internal medicine and OBshyGYN
C Impact of the HPSA Bonus on Primary Care Supply
Access to health care in shortage areas has been an ongoing source of concern among policy makers Expansion of health insurance coverage through the implementation of the ACA is
49
Final Report Health Practitioner Bonuses
likely to stimulate the demand for primary care in general and specifically in these shortage areas HRSA designates these shortage areas as primary care Health Profession Shortage Areas (HPSAs) using a defined threshold of primary care physicians to population ratio The HPSA bonus has been in place since 1987 and since 1991 the bonus payment remained at 10 percent of the fees associated with the bonus eligible Medicare claims50
In the absence of any variation in the HPSA bonus percentage in the recent past we rely on the change in the primary care HPSA status of different counties in the US over the period between 2007 and 2010 In other words we rely on the variation in HPSA status over time and across counties to identify the effect of the policy We detail the econometric model and exact interpretation of estimated coefficients in Appendix C2 Our analysis of the Area Resource File indicates that 205 US counties gained primary care HPSA status during 2007shy2011 while 257 counties lost their HPSA status51 Subsequently we analyze the changes in the outcomes of interest among primary care providers over time due to changes in the countyrsquos HPSA status during this period It is important to note that although HPSA bonus applies to physicians generally in this section we only focus on primary care physicians with primary care HPSA bonus eligible specialties described earlier The primary outcome variables that we analyzed to identify the changes in physiciansrsquo practice behavior are the volume of primary care services and total Medicare allowed charges associated with those services as captured in Medicare claims data In this framework we have assumed that the HPSA status of an area is exogenous to an individual providerrsquos decision to serve a certain number of patients or provide a given volume of services or any other individualshylevel outcomes However the HPSA status of an area may not be exogenous in models where the outcome of interest is the number of providers relative to the size of population in a given geographic area at the aggregate level This is specifically due to the fact that the HPSA status is designated based on the physicianshy toshypopulation ratio in the area as a whole
The coefficient of the interaction term between the county primary care HPSA status indicator (HPSAPC) and the indicator of whether the county ever gained the HPSA status shows the additional impact of HPSA status on the average number of claims per physician in column 1 (or payments in column 2) in the counties that ever gained the HPSA status (full model specification detailed in Appendix C2) As shown in Exhibit 23 we found that on average Medicare physicians with primary care specialties who are located in counties that ever gained the HPSA status tend to have about 17 more EampM claims submitted annually specifically due to the gain of full HPSA status The effect is statistically significant at 10 percent significance level On the other hand the loss of HPSA status does not seem to have any statistically significant impact on the number of EampM claims
50 Physicians who furnish services to Medicare beneficiaries in areas designated as primary care geographic HPSAs by HRSA as of December 31 of the prior year are eligible for the Medicare HPSA bonus during the current year Since 2005 the HPSA physician bonus payment has been automatically made to physicians who furnish services to Medicare beneficiaries in a ZIP code on the list of ZIP codes eligible for automatic HPSA bonus payment This list is updated annually and is effective for services furnished on and after January 1 of each calendar year Physicians who furnish services to Medicare beneficiaries in a geographic HPSA that is not on the list of ZIP codes eligible for automatic payment must use the AQ modifier ldquoPhysician providing a service in an unlisted Health Professional Shortage Area (HPSA)rdquo on the claim to receive the bonus payment Services that are submitted with the AQ modifier are subject to validation by Medicare The bonus is paid quarterly and is based on the amount paid for professional services
51 Area Resource File (ARF) or Area Health Resource File is an extensive county level database assembled annually
by Health Resources and Services Administration (HRSA) from over 50 sources Source httparfhrsagov
50
Final Report Health Practitioner Bonuses
Exhibit 23 Impact of HPSA Bonus on the Number of EampM Claims and Allowed Charges per Physician under Medicare 2007shy2010
Number of EampM Claims
per Physician(1)
Allowed Charges for
EampM Claims per
Physician ($)(2)
County HPSA PC Indicator (HPSAPC) shy4386 shy30245
(2500) (1721)
Ever Gained HPSA Status Indicator (ToHPSA) shy3991 shy25934
(6900) (4593)
Ever Lost HPSA Status Indicator (ToNonHPSA) shy6122 shy51496
(6772) (4673)
HPSAPCToHPSA 1741+ 4070
(9500) (6491)
HPSAPCToNonHPSA 1137 13804
(8005) (5506)
Age 1268 8544
(00845) (5927)
Male 1927 131368
(1645) (1208)
Urban shy4187 shy6167
(3324) (2220)
Median Income ($10k) shy6798 10347
(1636) (1162)
Percent under poverty shy5469 shy3003
(0416) (2838)
Population (10k) shy0116 shy3253
(000808) (0591)
Percent Population over 65 2129 15447
(0481) (3361)
Unemployment Rate 2043 16501
(0803) (5655)
Primary Care Phymcarepop10k shy000218 4187
(00126) (0881)
PC Nonshyphymcarepop10k shy0951 shy6878
(00362) (2535)
Intercept shy5943 shy578914
(2007) (13846)
Specialty Fixed Effects Yes Yes
Year Fixed Effects Yes Yes
State Fixed Effects Yes Yes
N 743907 743907
Adj Rshysq 0188 0184
Note Robust standard errors are in parentheses + significance at 10 percent significance at 5 percent The sample is restricted to only providers with HPSA eligible specialty family practice internal medicine pediatrics and OBshyGYN
51
Final Report Health Practitioner Bonuses
Next we focus on the impact of primary care HPSA status on the Medicare allowed charges per physicians associated with EampM claims (Exhibit 23 column 2) Column 2 indicates that Medicare primary care physicians who are located in counties that ever gained HPSA status do not experience significant changes in annual allowed charges per physician for EampM claims specifically due to the gain of full HPSA status However Medicare physicians with primary care who are located in counties that ever lost HPSA status tend to have about $1380 more allowed charges annually when the location has the full HPSA status This effect is statistically significant at 5 percent significance level
For our analysis of the impact of HPSA status on the volume of services in terms of EampM claims we focused only on the behavior of primary care physicians We found that on average Medicare primary care physicians tend to submit about 17 more EampM claims annually specifically due to the gain of full HPSA status This may suggest that HPSA bonus may encourage primary care providers to increase access to primary care services In addition based on our analysis of allowed charges for EampM Services we find that the Medicare primary care physicians who are located in counties that ever lost primary care HPSA status tend to have about $1380 more allowed charges annually before the location lost full HPSA status Thus gaining HPSA status is also associated with gain in additional earnings for primary care physicians Hence our analysis finds supportive evidence that HPSA bonus may improve access to primary care services in shortage areas
Finally when the outcome of interest is the PCP to population ratio at the county level relying on the change in primary care HPSA status as the primary source of variation to identify an effect of HPSA status poses additional estimation challenges The phenomena that cause decision makers to change the status may be highly correlated with our outcome of interest In this sense the HPSA status would be an endogenous variable in the regression model where the outcome of interest is the number of primary care providers per county Specifically this endogeneity problem may bias the effect of HPSA status on the number of primary care physicians toward zero One potential way to circumvent the issue of endogeneity of the HPSA status above would be to use the instrumental variable (IV) approach The IV approach relies on the identification of variables ie instruments that would be correlated with HPSA status and that would affect the providershytoshypopulation ratio only through the HPSA status variable These IVs will then be used in the regression framework to tease out the unbiased effect of the HPSA status on the providershytoshypopulation ratio However IVs are not always readily available In future upon availability of appropriate IVs a more inshydepth study can be carried out to resolve the problem of this endogeneity to estimate the unbiased effect of HPSA status on the providershytoshypopulation ratio52
52 Despite the issue of endogeneity of HPSA status we analyze the changes in the number of Medicare primary care
physicians per 10 thousand Medicare populations and the changes in the absolute number of Medicare primary care physicians over time due to changes in the countyrsquos HPSA status during the period of 2007shy2011 using the same DID framework laid out earlier The results from these estimated models are available upon request
52
Final Report Health Practitioner Bonuses
Modeling the Impact of the Increase in Medicaid Reimbursement Rate Relative to the Medicare Rate
A Study Design Overview
The availability of primary care is particularly important for public payer programs such as Medicaid and Medicare Historically Medicaid has been the less generous payer for primary care services relative to Medicare paying just 66 percent of Medicare rates on average53 In this section we first describe the variation in Medicaid reimbursement rates relative to those for Medicare both for primary care and for all services across US states during the period 2008shy2012 and second simulate the effect of a 10 percent increase in the MedicaidshytoshyMedicare fee index on the proportion of US officeshybased physicians accepting new Medicaid patients across all states
Cunningham et al (2011) report that fewer physicians accept new Medicaid patients in response to the low Medicaid reimbursement rates in several states Decker (2012) used data on officeshybased physicians from the 2011 National Ambulatory Medical Care Survey Electronic Medical Records Supplement to summarize the percentage of physicians currently accepting any new patients She finds that 694 percent of physicians in the sample accepted new patients with Medicaid This was lower than the percentage accepting new selfshypay (917 percent) Medicare (830 percent) or privately insured patients (817 percent) Logit regression model estimates showed that raising Medicaid fees to Medicare levels for all physicians a 258 percentageshypoint (35 percent) increase in the current average ratio of 742 would increase the acceptance rate of new Medicaid patients by 86 percentage points (12 percent) shy from an average of 694 percent across physicians to an average of 786 percent
Zuckerman et al (2009) reported that in 2008 stateshylevel average primary care physician fees under Medicaid ranged from 57 percent of the national average Medicaid fees in Rhode Island to 226 percent of national average in Alaska They also found that after strong Medicaid fee growth during 1998shy2003 Medicaid fees fell relative to inflation during 2003shy2008 Despite the slowdown in overall fee growth Medicaid fees for primary care services kept pace with inflation The ACA increases Medicaid reimbursement rates for certain services provided by primary care physicians to 100 percent of Medicare rates in 2013 and 2014 Given the variability of Medicaid payments across states this could be a substantial boost in payments for physicians in some states and less so in others
Zuckerman et al (2009 2012) provided stateshylevel MedicaidshytoshyMedicare fee indices for 2008 and 2012 These studies show that the national average Medicaid reimbursement rate for primary care services declined from 66 percent of the Medicare rate in 2008 to 59 percent in 2012 (about 106 percent decline) However the national average MedicaidshytoshyMedicare fee index for all services declined by about 83 percent (from 72 percent in 2008 to 66 percent in 2012) during the same period
Exhibit 24 reveals wide stateshytoshystate variation in the Medicaid fee relative to the Medicare rate in both 2008 and 2012 In several states including California Florida Michigan New York and Rhode Island the Medicaid primary care fee in 2012 was less than 50 percent of the Medicare rate In several other states including Alaska Delaware Montana North Dakota Oklahoma and Wyoming the Medicaid primary care fee was above 90 percent of the Medicare rate in the same year
53 Small DM and T McGinnis (2012) ldquoLeveraging the Medicaid Primary Care Rate Increase The Role of
Performance Measurementrdquo Center for Health Care Strategies Inc
53
Final Report Health Practitioner Bonuses
There is substantial variation in the percentage change in the MedicaidshytoshyMedicare fee index across these states too During 2008shy2012 most of the states except Maine Mississippi New Jersey New York North Dakota and DC experienced a decline in the MedicaidshytoshyMedicare fee index for all services and for primary care services Another exception is Minnesota where the MedicaidshytoshyMedicare fee index for all services declined by 66 percent during the same period but the index for primary care services increased by about 259 percent In Arizona Georgia Louisiana Michigan Nevada Virginia and Wyoming the decline in MedicaidshytoshyMedicare fee index for primary care is more than 15 percent
Decker (2012) and Cunningham (2011) exploit the stateshylevel variation in the Medicaid reimbursement rates and they examine the impact of an increase in Medicaid fee relative to Medicare on physiciansrsquo propensity to accept Medicaid patients
Cunningham (2011) uses 2008 Health Tracking Physician Survey on 1748 primary care physicians (PCPs) The empirical analysis includes the estimation of a linear probability regression model of whether a PCP is accepting new Medicaid patients using the stateshylevel Medicaid reimbursement rate relative to Medicare rate as one of the independent variables The key findings of this study can be summarized as follows
Average MedicaidshytoshyMedicare fee ratio for primary care in 2008 was 662 percent
On average PCPs accepting all or new Medicaid patients in the US in 2008 was 415 percent
One percentage point increase in MedicaidshytoshyMedicare fee ratio increases theshyproportion of PCPs accepting Medicaid patients by 0214shy
Thus based on the findings in Cunningham (2011) the implied elasticity of accepting primary care patients with respect to the MedicaidshytoshyMedicare fee is about 03454 In other words a 10 percent increase in the Medicaid fee relative to Medicare across all states would imply an increase in the acceptance rate of Medicaid patients from 415 percent to 429 percent nationally The estimated elasticity also suggests that under MedicaidshyMedicare payment parity the national average acceptance rate would go up from 415 percent to 487 percent55
The analytical findings presented here can be improved further if the data on proportion of physicians accepting new Medicaid patients in 2012 are available for each state Similarly availability of the stateshylevel MedicaidshytoshyMedicare fee index in 2011 can also refine the simulation results
54 The implied elasticity is calculated by The Lewin Group and it is based on the following statistics reported in the
study the national average MedicaidshytoshyMedicare fee ratio in 2008 (662 percent) the national average of PCPs accepting all or new Medicaid patients (415 percent) in 2008 and the estimated coefficient of MedicaidshytoshyMedicare fee ratio (0214) The estimated coefficient of 0214 implies that if the MedicaidshytoshyMedicare fee ratio increases by 1 percent from the national average (ie from 662 to 6686) then national average proportion of PCPs accepting Medicaid patients goes up by 0214(6686shy662) asymp 014 This is about 034 percent (100014415) increase in the proportion of PCPs accepting Medicaid patients Therefore the implied elasticity = ( percent change in proportion of PCPs accepting Medicaid patients) ( percent change in MedicareshytoshyMedicare fee ratio) = 0341 = 034
55 Lewinrsquos calculation of the new acceptance rate under MedicaidshyMedicare payment parity = [034(100shy
662)662+1]415 asymp 487
54
shy shy
shy shy
shy shy
shy
Final Report Health Practitioner Bonuses
Exhibit 24 MedicaidshytoshyMedicare Fee Index
States Medicare Fee Index Medicare Fee Index
Medicare Fee Index 2008
2012
All Services Primary care
All Services Primary care
All Services Primary care
US 072 066 066 059 shy83 shy106
AL 089 078 078 070 shy124 shy103
AK 140 140 124 127 shy114 shy93
AZ 106 097 082 075 shy226 shy227
AR 089 078 079 070 shy112 shy103
CA 056 047 051 043 shy89 shy85
CO 086 087 071 074 shy174 shy149
CT 099 078 087 071 shy121 shy90
DE 100 100 097 098 shy30 shy20
DC 058 047 080 080 379 702
FL 063 055 057 049 shy95 shy109
GA 090 086 075 070 shy167 shy186
HI 073 064 062 057 shy151 shy109
ID 103 103 088 089 shy146 shy136
IL 063 057 062 054 shy16 shy53
IN 069 061 062 055 shy101 shy98
IA 096 089 082 077 shy146 shy135
KS 093 094 078 082 shy161 shy128
KY 086 080 077 072 shy105 shy100
LA 092 090 075 075 shy185 shy167
ME 063 053 065 063 32 189
MD 087 082 073 070 shy161 shy146
MA 088 078 077 068 shy125 shy128
MI 063 059 051 046 shy190 shy220
MN 076 058 071 073 shy66 259
MS 087 084 090 090 34 71
MO 072 065 059 057 shy181 shy123
MT 103 096 097 094 shy58 shy21
NE 101 082 087 076 shy139 shy73
NV 104 093 074 068 shy288 shy269
NH 073 067 058 060 shy205 shy104
NJ 037 041 045 050 216 220
NM 107 098 092 085 shy140 shy133
NY 043 036 055 042 279 167
NC 095 095 082 085 shy137 shy105
ND 102 101 134 135 314 337
OH 069 066 061 059 shy116 shy106
OK 100 100 097 097 shy30 shy30
55
2008 Medicaid-to- 2012 Medicaid-to- Change in Medicaid-to-
-
shy shy
shy shy
shy shy
shy
Final Report Health Practitioner Bonuses
States Medicare Fee Index Medicare Fee Index
Medicare Fee Index 2008
2012
All Services Primary care
All Services Primary care
All Services Primary care
OR 090 078 081 072 shy100 shy77
PA 073 062 070 056 shy41 shy97
RI 042 036 037 033 shy119 shy83
SC 093 086 081 074 shy129 shy140
SD 095 085 076 069 shy200 shy188
TX 074 068 065 061 shy122 shy103
UT 082 076 074 074 shy98 shy26
VT 095 091 080 081 shy158 shy110
VA 090 088 080 074 shy111 shy159
WA 093 092 076 066 shy183 shy283
WV 085 077 080 074 shy59 shy39
WI 085 067 077 060 shy94 shy104
WY 143 117 116 096 shy189 shy179
Source Zuckerman et al (2009 and 2012) data on Tennessee were not available
Decker (2012) used data from the 2011 National Ambulatory Medical Care Survey Electronic Medical Records Supplement of 3979 officeshybased physicians (PCPs and nonshyPCPs) The studyrsquos empirical analysis included estimation of a logit regression model of whether an officeshybased physician is accepting new Medicaid patients A key variable in this analysis was the stateshylevel MedicaidshytoshyMedicare fee index of 200856 The key findings of this analysis were
Average MedicaidshytoshyMedicare fee ratio for all services (2008) was 72 percent
The average officeshybased physician new Medicaid patient acceptance rate for 2011 was 694 percent
Among PCPs the acceptance rate was 662 percent among nonshyPCPs the acceptance rate was 717 percent
Based on the logit parameter estimates she finds that an increase in the fee ratio from 742 to 100 would be expected to increase acceptance of new Medicaid patients from 694 percent to 786 percent
In other words a 10 percent increase in MedicaidshytoshyMedicare fee index for all services across all states would suggest a rise in the acceptance rate from 694 percent to 723 percent nationally57 Thus the implied elasticity of officeshybased physicians accepting new Medicaid patients with respect to the MedicaidshytoshyMedicare fee is about 04358 The study also finds that
56 One of the key limitations of the study is that the MedicaidshytoshyMedicare fee index is not available for year 2011
There may be substantial difference in stateshywide variation in these indices between 2008 and 2011 period In that case 2008 indices may not explain well the variation in the proportion of physicians accepting Medicaid patients
57 Lewinrsquos method of calculating the predicted proportion of accepting new Medicaid patients based on the estimated
logit model is explained in Appendix D 58
Lewinrsquos method of calculating the predicted proportion of accepting new Medicaid patients based on the estimated logit model is explained in Appendix D Using that method a 1 percent change in the 2008 national average
56
2008 Medicaid-to- 2012 Medicaid-to- Change in Medicaid-to-
-
shy shy
shy
shy shy
shy
Final Report Health Practitioner Bonuses
holding other things constant primary care officeshybased physicians are about 73 percentage point less likely to accept new Medicaid patients Decker also estimated the impact on the primary care physicians only and she found that the estimated impact is similar to the one reported above for all physicians More specifically she found that an increase in the MedicaidshytoshyMedicare fee ratio for primary care to 100 was predicted to increase acceptance of new Medicaid patients among primary care physicians from 647 percent to 717 percent
B Simulation Exercise
We simulated the effect of a 10 percent increase in the stateshylevel MedicaidshytoshyMedicare fee indices (for all services) from their 2008 level on the proportion of US officeshybased physicians accepting new Medicaid patients in each state59 A detailed description of the simulation methodology used to predict the proportion of officeshybased physicians accepting Medicaid patients is presented in Appendix D The simulation exercise is based on the empirical findings of Decker (2012) and the data on the proportion of US officeshybased physicians accepting new Medicaid patients for each state reported in the same study
Exhibit 25 summarizes the predicted proportion of US officeshybased physicians accepting new Medicaid patients by state For example in California the MedicaidshytoshyMedicare fee ratio in 2008 was substantially lower than the national average Subsequently only 571 percent of the officeshybased physicians in California were accepting new Medicaid patients Based on the simulation we find that a 10 percent increase in the MedicaidshytoshyMedicare fee index in California (from 056 to 062) would increase the proportion of officeshybased physicians accepting new Medicaid patients in California from 571 percent to 597 percent (about 46 percent increase)
Exhibit 25 Proportion of US Officeshybased Physicians Accepting New Medicaid Patients
States Medicare Fee Index
All Services 2008
physicians accepting
new Medicaid patients
2011
Predicted acceptance rate under
Fee Index (Based on Decker 2012)
(Non -Linear Projection)
US 072 694 722
AL 089 685 720
AK 140 821 857
AZ 106 785 817
AR 089 907 920
CA 056 571 597
CO 086 661 696
CT 099 607 650
DE 100 783 813
DC 058 752 772
MedicaidshytoshyMedicare fee index reported in the study (from 742 percent to 7492 percent) increases the proportion of officeshybased physicians accepting new Medicaid patients from 694 percent to 697 percent Therefore the implied elasticity = ( percent change in proportion of PCPs accepting Medicaid patients) ( percent change in MedicareshytoshyMedicare fee ratio) = ((697shy694)694)1 = 043
59 At this point stateshylevel MedicaidshytoshyMedicare fee index are not available for 2011 and the proportion of physicians
accepting new Medicaid patients are not readily available to Lewin by state in any year other than 2011 In future Lewin Group will explore the availability of such data to strengthen the analysis
57
Medicaid-to- of US office-based
10 rise in Medicaid-to-Medicare
shy
shy shy
shy
Final Report Health Practitioner Bonuses
States
Medicaid-to-
Medicare Fee Index
All Services 2008
of US office based
physicians accepting
new Medicaid patients
2011
Predicted acceptance rate under
10 rise in Medicaid-to-Medicare
Fee Index (Based on Decker 2012)
(Non Linear Projection)
FL 063 591 619
GA 090 674 710
HI 073 699 727
ID 103 847 870
IL 063 649 676
IN 069 706 732
IA 096 876 894
KS 093 682 719
KY 086 794 819
LA 092 621 661
ME 063 740 762
MD 087 659 695
MA 088 806 831
MI 063 811 829
MN 076 963 968
MS 087 796 821
MO 072 676 705
MT 103 899 915
NE 101 870 890
NV 104 752 787
NH 073 817 837
NJ 037 404 421
NM 107 863 885
NY 043 616 635
NC 095 764 795
ND 102 946 955
OH 069 720 745
OK 100 673 713
OR 090 795 821
PA 073 680 709
RI 042 689 706
SC 093 841 863
SD 095 941 950
TN 614
TX 074 699 727
UT 082 835 855
58
-
-
shy shy
shy
shy shy
shy
Final Report Health Practitioner Bonuses
States
Medicaid to
Medicare Fee Index
All Services 2008
of US office based
physicians accepting
new Medicaid patients
2011
Predicted acceptance rate under
10 rise in Medicaid to Medicare
Fee Index (Based on Decker 2012)
(Non Linear Projection)
VT 095 784 813
VA 090 760 790
WA 093 764 794
WV 085 809 833
WI 085 930 940
WY 143 993 995
Note The predicted proportions are based on the estimated logit model in Decker (2012)
Next we analyzed the implication of our findings from the Medicare PCIP policy analysis in the context of the MedicaidshyMedicare payment parity We have already discussed that based on our analysis the number of Medicare primary care providers accepting new Medicare patients increased by almost 10 percent in response to the Medicare 10 percent PCIP policy (Exhibit 14) According to Zuckerman et al (2012) the US average MedicaidshytoshyMedicare fee ratio for primary care services in 2012 was about 059 Thus MedicaidshyMedicare payment parity would imply almost a 70 percent increase in Medicaid fees over the 2012 US average Further the findings by Decker (2012) suggest that in 2011 almost 662 percent officeshybased primary care physicians accepted new Medicaid patients
Given the magnitude of the impact of the Medicare PCIP policy if the MedicaidshyMedicare payment parity policy at least triggers a 10 percent increase in MedicaidshytoshyMedicare fee ratio then we would expect the US average of officeshybased primary care physicians accepting new Medicaid patients to go up to at least 728 percent However considering the 2012 US average MedicaidshyMedicare payment parity would imply a much bigger percentage increase in payments than 10 percent payment increase under the Medicare PCIP policy It is challenging to use the estimated impact of PCIP program to extrapolate the impact of MedicaidshytoshyMedicare parity This is because (1) in general parity would require a much bigger change in MedicaidshytoshyMedicare fee ratio (compared to the 10 percent PCIP payment) and (2) our PCIP analysis is limited in the sense that it is not capturing continuous variation in the incentive payment due to the nature of the program Finally the actual increase in the absolute value of payment under the Medicare and Medicaid payment policies would depend on the volume of primary care services and the current state MedicaidshyMedicare fee index
Conclusions The Affordable Care Act includes two key provisions regarding reimbursement to primary care providers (a) it provides a 10 percent supplemental payment under the Medicare PCIP program to eligible providers (effective January 1 2011) and (b) it raises the Medicaid primary care reimbursement rate at least up to 100 percent of the Medicare rate ASPE has contracted with the Lewin Group to examine the role of Medicare PCIP and supplemental payment programs including the HPSA and PSA incentives in increasing the supply of primary care providers (PCP) and the access of patients to their services
We reviewed the health and labor economics literature to understand the nature and the size of the impact of any financial incentives on the labor supply behavior of PCPs and the resultant impact on the availability of primary care services estimated in the existing body of research
59
-- -
--
-
Final Report Health Practitioner Bonuses
We documented the prior empirical evidence of the impact of financial incentives on raising the supply of primary care workforce the volume of services impact on medical graduatesrsquo propensity to participate in primary care PCPsrsquo retirement decision etc This review also evaluated the past evidence on the effect of bonuses in shortage areas and their effectiveness to redistribute and retain primary care workforce Finally the review of the literature also focused on the stateshyspecific experiences with changes in their respective Medicaid payment rates for primary care and the resultant impact on the supply of PCPs their rate of acceptance of Medicaid patients and the volume of primary care services such as office visits or visits for EampM services
To explore these topics we constructed a provider level data set including all the claims submitted by the entire universe of Medicare providers in each year from 2005 to 2011 We linked Provider360 data (available from Lewin Grouprsquos parent company Optum Inc) and the AMA Physician Master File to add provider characteristics such as demographics (eg age gender) provider designation medical school and practice location We also added geographic location specific variables from the Area Resource File (ARF) based on the practice location information of providers
We find that as a result of the Medicare incentive payment the number of Medicare primary care providers has increased on average annually by about 28 providers per county from 2009 to 2011 The number of primary care physicians with PCIP eligible specialty increased by about 10 percent in response to the 10 percent incentive payment under the PCIP policy (ie elasticity of the number of primary care physicians with respect to the incentive payment is about 1) Eligible claims for some types of PCIP eligible EampM services and associated allowed charges have also increased For example on average there was a 7 percent increase in the number of 25 minute office visits claims due to the PCIP policy On the other hand in response to the PCIP policy there was a 93 percent increase in the average allowed charges (for the eligible services) among primary care provider with PCIP eligible specialties Our results regarding the PCIP impact should be interpreted with caution due to several reasons First we only observe one year after the PCIP was in effect and as data becomes available for the full 2011shy2015 period the magnitude and precision of our estimates may change Second given the limited timeframe of this incentive providers may not be willing to make longshylasting adjustments in their decision to supply primary care services Finally as Medicare providers become more familiar PCIP users in time and adjust their behavior the full impact of the incentive on provider behavior may change
In addition we find that Medicare providers were attracted to PSA areas through the PSA bonus and submitted 78 percent more EampM claims annually during the PSA period Gaining HPSA status also generated an additional 17 EampM claims submitted by primary care physicians with HPSA bonusshyeligible specialties Estimation of HPSA and PSA bonuses impact on primary care supply has been hindered by the existence of biases rising from the fact that the HPSA and PSA designation is a function of the current supply of providers While we try to mitigate some of these sources of bias future research is needed to provide a causal estimate of these bonuses
Finally we document the variation in Medicaid reimbursement rates relative to the Medicare rates both for primary care and for all services across US states during the period 2008shy2012 using the existing body of evidence Using the empirical results from our PCIP analysis we also perform an exercise to simulate the effect of a 10 percent increase in the MedicaidshytoshyMedicare fee index on the proportion of US officeshybased physicians accepting new Medicaid patients across all states The simulation suggests that a 10 percent increase in MedicaidshytoshyMedicare fee ratio would increase the US average of officeshybased primary care physicians accepting new Medicaid patients from 662 to 728 percent We caution against using the
60
Final Report Health Practitioner Bonuses
estimated impact of PCIP program to extrapolate the impact of MedicaidshytoshyMedicare parity This is because (1) in general parity would require a much bigger change in MedicaidshytoshyMedicare fee ratio (compared to the 10 percent PCIP payment) and (2) our PCIP analysis is limited in the sense that it is not capturing continuous variation in the incentive payment due to the nature of the program
61
Final Report Health Practitioner Bonuses
Appendices
Appendix A Bibliography and Literature Matrix Askildsen Jan Erik and Badi H Baltagi 2002 ldquoWill Increased Wages Reduce Shortage of Nurses A
Panel Data Analysis of Nursesrsquo Labour Supplyrdquo Health San Francisco 1ndash28 httpovidsptxovidcomspshy331aovidwebcgiampS=HIBGFPGCKJDDJIGINCCLIAGCBOJCAA00amp Complete+Reference=Ssh36|2|1
Aurlien H G Falck and G Jacobsen 1991 ldquoThe Physicianrsquos Choice of a Specialtyrdquo Tidsskrift for Den Norske Laegeforening Tidsskrift for Praktisk Medicin Ny Raekke 111 (17) 2133ndash2136
Bazzoli G J 1985 ldquoDoes Educational Indebtedness Affect Physician Specialty Choicerdquo Journal of Health Economics 4 (1) 1ndash19
Bindman Andrew B Jean Yoon and Kevin Grumbach 2003 ldquoTrends in Physician Participation in Medicaid The California Experiencerdquo The Journal of Ambulatory Care Management 26 (4) 334ndash43 httpwwwncbinlmnihgovpubmed14567277
Bloom Matt and George T Milkovich 1998 ldquoRelationships Among Risk Incentive Pay and Organizational Performancerdquo Academy of Management Journal 41 (3) 283ndash297 doi102307256908 httpconnectionebscohostcoman953549
Bodenheimer Thomas 2007 ldquoThe Primary Careshyspecialty Income Gap Why It Mattersrdquo Annals of Internal Medicine httpwebmailwendellmurraytaxescomhealthcarepolicypay_gappdf
Bolduc Denis B Fortin and MA Fournier 1996 ldquoThe Effect of Incentive Policies on the Practice Location of Doctors a Multinomial Probit Analysisrdquo Journal of Labor Economics httpwwwjstororgstable1023072535445
ChaixshyCouturier C I DurandshyZaleski D Jolly and P Durieux 2000 ldquoEffects of Financial Incentives on Medical Practice Results from a Systematic Review of the Literature and Methodological Issuesrdquo International Journal for Quality in Health Care Journal of the International Society for Quality in Health Care ISQua 12 (2) 133ndash142 httpwwwncbinlmnihgovpubmed10830670
Chou ChiushyFang and Anthony T Lo Sasso 2009 ldquoPractice Location Choice by New Physicians The Importance of Malpractice Premiums Damage Caps and Health Professional Shortage Area Designationrdquo Health Services Research 44 (4) (August) 1271ndash89 doi101111j1475shy6773200900976x httpwwwpubmedcentralnihgovarticlerenderfcgiartid=2739028amptool= pmcentrezamprendertype=abstract
Clemens Jeffrey and Joshua D Gottlieb 2014 ldquoDo Physicians Financial Incentives Affect Medical Treatment and Patient Healthrdquo American Economic Review 104(4) pp 1320shy1349
Coburn A F S H Long and M S Marquis 1999 ldquoEffects of Changing Medicaid Fees on Physician Participation and Enrollee Accessrdquo Inquiry a Journal of Medical Care Organization Provision and Financing 36 (3) 265ndash279
Cunningham Peter J 2011 ldquoState Variation in Primary Care Physician Supply Implications for Health Reform Medicaid Expansionsrdquo Research Briefs Center for Studying Health System Change (19) 1ndash 11 httpsfolioiupuieduhandle102441004
Cunningham Peter J and Ann S OrsquoMalley 2008 ldquoDo Reimbursement Delays Discourage Medicaid Participation by Physiciansrdquo Health Affairs 28 (1) w17ndashw28 httpwwwncbinlmnihgovpubmed19017679
Decker S 2012 ldquoIn 2011 Nearly OneshyThird of Physicians Said They Would Not Accept New Medicaid Patients but Rising Fees May Helprdquo Health Affairs 31 no8 pp 1673shy1679
Doran Tim Catherine Fullwood Hugh Gravelle David Reeves Evangelos Kontopantelis Urara Hiroeh and Martin Roland 2006 ldquoPayshyforshyperformance Programs in Family Practices in the United
62
thinsp
Final Report Health Practitioner Bonuses
Kingdomrdquo The New England Journal of Medicine 355 (4) (July 27) 375ndash84 doi101056NEJMsa055505 httpwwwncbinlmnihgovpubmed16870916
Dummit LA 2008 ldquoPrimary Care Physician Supply Physician Compensation and Medicare Fees What Is the Connectionrdquo Issue Brief Natl Health Policy Forum (827) http7612169157libraryissueshybriefsIB827_Physician_Income_11shy03shy08pdf
Fournier Gary M and Cheryl Henderson 2005 ldquoIncentives and Physician Specialty Choice a Case Study of Floridarsquos Program in Medical Sciencesrdquo Inquiry a Journal of Medical Care Organization Provision and Financing 42 (2) 160ndash170
Gagneacute Robert and Pierre Thomas Leacuteger 2005 ldquoDeterminants of Physiciansrsquo Decisions to Specializerdquo Health Economics 14 (7) 721ndash735 httpwwwncbinlmnihgovpubmed15678516
Gibbons Robert and Kevin J Murphy 1992 ldquoOptimal Incentive Contracts in the Presence of Career Concerns Theory and Evidencerdquo Journal of Political Economy (3792) (September) httpwwwnberorgpapersw3792
Gosden T F Forland I S Kristiansen M Sutton B Leese A Giuffrida M Sergison and L Pedersen 2001 ldquoImpact of Payment Method on Behaviour of Primary Care Physicians a Systematic Reviewrdquo Journal of Health Services Research Policy 6 (1) 44ndash55 httpeprintswhiteroseacuk52996
Grobler Liesl Ben J Marais S A Mabunda P N Marindi Helmuth Reuter and Jimmy Volmink 2009 ldquoInterventions for Increasing the Proportion of Health Professionals Practising in Rural and Other Underserved Areasrdquo Cochrane Database of Systematic Reviews Online 2 (1) CD005314 doi10100214651858CD005314pub2 httpwwwncbinlmnihgovpubmed19160251
Hadley J J Reschovsky C Corey and S Zuckerman 2009 ldquoMedicare Fees and the Volume of physiciansrsquo Servicesrdquo Inquiry 1Vol 46 No 4 Winter 2009shy2010 372shy390
Henderson M C D K Hunt and J W Williams 1996 ldquoGeneral Internists Influence Students to Choose Primary Care Careers The Power of Role Modelingrdquo The American Journal of Medicine 101 (6) 648ndash653
Hernoes E Marte Sollie and S Stroslashm 2000 ldquoEarly Retirement and Economic Incentivesrdquo The Scandinavian Journal of 102 (3) 481ndash502 httponlinelibrarywileycomdoi1011111467shy944200211abstract
Hogan F Paul and Ellen Bouchery 2010 ldquo A Model of Subspecialty Choice for Internal medicine Residentsrdquo prepared by The Lewin Group for the American College of Cardiology
Holmes George M 2005 ldquoIncreasing Physician Supply in Medically Underserved Areasrdquo Labour Economics 12 (5) (October) 697ndash725 doi101016jlabeco200402003 httplinkinghubelseviercomretrievepiiS0927537104000284
Kuhmerker K and T Hartman 2007 ldquoPayshyforshyperformance in State Medicaid Programsrdquo New York (NY) Commonwealth Fund
Lynch D C D A Newton M S Grayson and T W Whitley 1998 ldquoInfluence of Medical School on Medical Studentsrsquo Opinions About Primary Care Practicerdquo AAMC Academic Medicine Journal of the Association of American Medical Colleges 73 (4) 433ndash435
Manning WG Newhouse JP Duan N Keeler EB Benjamin B Liebowitz A et al 1988 ldquoHealth insurance and the demand for medical care Evidence from a randomized experimentrdquo Santa Monica CA RAND Corporation
McDonald Ruth and Martin Roland 2009 ldquoPay for Performance in Primary Care in England and California Comparison of Unintended Consequencesrdquo Annals Of Family Medicine 7 (2) 121ndash127 httpwwwpubmedcentralnihgovarticlerenderfcgiartid=2653973amptool=pmcentrezamprendertype=abs tract
Midtsundstad Tove 2012 ldquoEffects of Companiesrsquo Initiatives to Reduce Early Retirement Among Older Workersrdquo Nordic Journal of Working Life Studies 2(3) 89-108
63
thinsp
Final Report Health Practitioner Bonuses
Morrow R W A D Gooding and C Clark 1995 ldquoImproving Physiciansrsquo Preventive Health Care Behavior Through Peer Review and Financial Incentivesrdquo Archives of Family Medicine 4 (2) 165ndash169
Nicholson S 2002 ldquoPhysician Specialty Choice Under Uncertaintyrdquo Journal of Labor Economics 20 (4) 816ndash847
Nicholson Sean and C Propper 2011 ldquoMedical Workforcerdquo In Handbook of Health Economics 873ndash 923
Petersen Laura A LeChauncy D Woodard Tracy Urech Christina Daw and Supicha Sookanan 2006 ldquoDoes Payshyforshyperformance Improve the Quality of Health Carerdquo Annals of Internal Medicine 145 (1 Suppl) 538 author reply 538ndash539 httpwwwncbinlmnihgovpubmed16908917
Petterson Stephen M and Andrew W Bazemore 2012 ldquoProjecting US Primary Care Physician Workforce Needs 2010shy2025rdquo Annals of Family Medicine Vol 10 (No 6) 503ndash509 doi101370afm1431INTRODUCTION httpwwwannfammedorgcontent106503abstract
Piper Kip and Sellers Dorsey 2009 Global Payments to Improve Quality and Efficiency in Medicaid
Rabinowitz H K J J Diamond F W Markham and N P Paynter 2001 ldquoCritical Factors for Designing Programs to Increase the Supply and Retention of Rural Primary Care Physiciansrdquo Jama The Journal Of The American Medical Association 286 (9) 1041ndash1048 httpjamaamashyassnorgcgidoi101001jama28691041
Ramsey P G J B Coombs D D Hunt S G Marshall and M D Wenrich 2001 ldquoFrom Concept to Culture The WWAMI Program at the University of Washington School of Medicinerdquo Academic Medicine 76 (8) 765ndash775
Reschovsky J A Ghosh and K Stewart 2012 Paying More for Primary Care Can It Help Bend the Medicare Cost Curve The Commonwealth Fund httpwwwcommonwealthfundorg~mediaFilesPublicationsIssueBrief2012Mar1585_Reschovsky _paying_more_for_primary_care_FINALv2pdf
Rizzo J A and D Blumenthal 1994 ldquoPhysician Labor Supply Do Income Effects Matterrdquo Journal of Health Economics 13 (4) 433ndash453 httpwwwncbinlmnihgovpubmed10140533
Rosenthal MB Li Z Epstein AM Frank R G 2005 ldquoEarly Experience with Payshyforshyperformance From Concept to Practicerdquo JAMA The Journal of the American Medical Association 294 (14) (October 12) 1788ndash1793 httpdxdoiorg101001jama294141788
Rosenthal Meredith B and R Adams Dudley 2007 ldquoPayshyforshyperformance Will the Latest Payment Trend Improve Carerdquo Jama The Journal Of The American Medical Association 297 (7) 740ndash744 httpwwwncbinlmnihgovpubmed17312294
Salinsky E 2010 ldquoHealth Care Shortage Designations HPSA MUA and TBDrdquo National Health Policy Forum Background Paper No 75 pp 1shy36
Saether Erik Magnus 2005 ldquoPhysiciansrsquo Labour Supply The Wage Impact on Hours and Practice Combinationsrdquo Labour 19 (4) (December) 673ndash703 doi101111j1467shy9914200500317x httpdoiwileycom101111j1467shy9914200500317x
Scott Anthony Peter Sivey Driss Ait Ouakrim Lisa Willenberg Lucio Naccarella John Furler and Doris Young 2011 ldquoThe Effect of Financial Incentives on the Quality of Health Care Provided by Primary Care Physiciansrdquo Cochrane Database of Systematic Reviews Online 9 (9) CD008451 httpwwwncbinlmnihgovpubmed21901722
Sempowski Ian P 2004 ldquoEffectiveness of Financial Incentives in Exchange for Rural and Underserviced Area Returnshyofshyservice Commitments Systematic Review of the Literaturerdquo Canadian Journal of Rural Medicine the Official Journal of the Society of Rural Physicians of Canada Journal Canadien De La Medecine Rurale Le Journal Officiel De La Societe De Medecine Rurale Du Canada 9 (2) 82ndash88 httpwwwncbinlmnihgovpubmed15603680
Shen YushyChu and Stephen Zuckerman 2005 ldquoThe Effect of Medicaid Payment Generosity on Access and Use Among Beneficiariesrdquo Health Services Research 40 (3) (June) 723ndash44 doi101111j1475shy
64
Final Report Health Practitioner Bonuses
6773200500382x httpwwwpubmedcentralnihgovarticlerenderfcgiartid=1361165amptool= pmcentrezamprendertype=abstract
Shugarman Lisa R and Donna O Farley 2003 ldquoShortcomings In Medicare Bonus Payments For Physicians In Underserved Areasrdquo Health Affairs 22 (4) (July 1) 173ndash178 doi101377hlthaff224173 httpcontenthealthaffairsorgcontent224173abstract
Shurgman Lisa R Donna O Farley Pat Taylor and J Scott Ashwood 2001 Trends in Bonus Payments for Physician Services to Rural Medicare Beneficiaries
Sivey Peter Anthony Scott Julia Witt Catherine Joyce and John Humphreys 2012 ldquoJunior Doctorsrsquo Preferences for Specialty Choicerdquo Journal of Health Economics 31 (6) (December) 813ndash23 doi101016jjhealeco201207001 httpwwwncbinlmnihgovpubmed22940638
Sloan Frank 1970 ldquoLifetime Earnings and Physiciansrsquo Choice of Specialtyrdquo Industrial and Labor Relations Review Vol 24 (No 1) (October 13) pp 47ndash56 httpdukespacelibdukeedudspacehandle101612547
Small David Marc and Tricia McGinnis 2014 Leveraging the Medicaid Primary Care Rate Increase The Role of Performance Measurement
Staiger Douglas O David I Auerbach and Peter I Buerhaus 2010 ldquoTrends in the Work Hours of Physicians in the United Statesrdquo The Journal of the American Medical Association 303 (8) (February 24) 747ndash53 doi101001jama2010168 httpwwwpubmedcentralnihgovarticlerenderfcgiartid=2915438amptool=pmcentrezamprendertype= abstract
Town Robert Robert Kane Paul Johnson and Mary Butler 2005 ldquoEconomic Incentives and Physiciansrsquo Delivery of Preventive Care a Systematic Reviewrdquo American Journal of Preventive Medicine 28 (2) (February) 234ndash40 doi101016jamepre200410013 httpwwwncbinlmnihgovpubmed15710282
Vaughn Bryan T Steven R DeVrieze Shelby D Reed and Kevin a Schulman 2010 ldquoCan We Close the Income and Wealth Gap Between Specialists and Primary Care Physiciansrdquo Health Affairs 29 (5) (May) 933ndash40 doi101377hlthaff20090675 httpwwwncbinlmnihgovpubmed20439883
Verby J E J P Newell S A Andresen and W M Swentko 1991 ldquoChanging the Medical School Curriculum to Improve Patient Access to Primary Carerdquo Jama The Journal Of The American Medical Association 266 (1) 110ndash113 httpjamaamashyassnorgcontent2661110short
Zuckerman Stephen 2004 ldquoChanges in Medicaid Physician Fees 1998shy2003 Implications for Physician Participationrdquo Health Affairs (June) 1998ndash2003 doi101377hlthaffW4374 httpwwwhealthaffairsorgRWJZuckerman_June04pdf
Zuckerman Stephen Aimee F Williams and Karen E Stockley 2009 ldquoTrends in Medicaid Physician Fees 2003shy2008rdquo Health Affairs 28 (3) w510ndashw519 httpwwwncbinlmnihgovpubmed19401290
Zuckerman S and D Goin 2012 ldquoHow Much Will Medicaid Physician Fees for Primary Care Rise in 2013 Evidence from a 2012 Survey of Medicaid Physician Feesrdquo Kaiser Commission on the Medicaid and the Uninsured Issue Paper December 2012
65
Final Report Health Practitioner Bonuses
Literature Matrix
Study Goal Results Data Type of Study Reference
Topic Effect of Earnings on the Supply of Primary Care Services and Providers Role of Medicare Primary Care Bonuses (Section III)
Estimate a model where medical Data set with the Econometric students consider entry The income elasticity estimates range from 103 in family preferred and realized model Nicholson probabilities when selecting a practicepediatrics to 220 in radiology specialties for 7200 (conditional 2002 specialty medical students logit)
Estimated career wealth The present value of career wealth from college accumulation across specialists primary care physicians physician assistants business school graduates and college graduates Comparing specialists represented by cardiologists to
graduation through age sixtyshyfive was estimated at $5171407 for cardiologists $2475838 for primary care physicians $1725171 for MBA graduates $846735 for physician assistants and $340628 for college graduates For a primary care physicianrsquos lifetime earnings to equal that of a cardiologist the primary care
Data from multiple sources included income income taxes living expenses and graduate school
Compound interest wealth accumulation model
Vaughn et al 2010
primary care physicians in physician would have to receive a bonus of $11 million expenses
scenarios upon completion of medical school
Determine effect of educational indebtedness on the specialty choices of new physicians especially in light of the perceived shortage of primary care physicians
Medical students are more likely to choose primary care when the expected earnings are relatively large A $10000 (20 percent of the mean earnings) increase in expected earnings in primary care relative to the nonshyprimary care yields a 14 percentage point increase in the probability of choosing primary care
Data set from American Medical Associationrsquos 1983 lsquoSurvey of Resident Physiciansrsquo
Econometric model (utility maximization)
Bazzoli 1985
Estimation of career choice and medical studentrsquos decision to specialize given lifetime utility maximization
In response to 91 percent reduction in relative feeshypershyconsultation for a general practitioner would lead to between a 04 percent reduction and a 229 percent reduction in the proportion of Medical students entering general practice
Data from multiple sources Model estimated from sample of 30184 physicians who practiced in Canada between 1989 and 1998 and whose year of graduation from medical school is between 1975 and 1991
Econometric model (multinomial logit)
Gagne and Leger 2005
Determine the causes of the primary careshyspecialist income gap why the ResourceshyBased Relative Value Scale failed to prevent the income gap
The RBSVS failed due to four factors (1) the volume of diagnostic and imaging procedures has increased more rapidly than the volume of office visits (2) the process of updating fees every five years is heavily influenced by the Relative Value Scale Update Committee which is composed of a majority of specialists (3) Medicarersquos formula for controlling physician payments penalizes primary care physicians and (4) private insurers tend to pay for procedures at higher rates than office visits relative to Medicare
Data from multiple sources income information between 1995 and 2005
Literature review Bodenheimer 2007
66
Final Report Health Practitioner Bonuses
Study Goal Results Data Type of Study Reference
Determine the effects of expected future earnings and other attributes on specialty choice
Simulated policy changes indicate increasing general practitioners earnings by $50000 or increasing opportunities for procedural or academic work (specifically limiting the amount of onshycall hours) can increase the number of junior doctors choosing general practice by between 8 and 13 percentage points This implies an earnings elasticity of specialty choice of 095
Data from the Medicine in Australia Balancing Employment and Life (MABEL) survey
Econometric model (logit)
Sivey amp Scott 2012
Estimate a model of physician labor supply focusing on the impacts of wage and nonshywage income
Evidence of significant income effects For male physicians the income effect of a wage change on labor supply is negative with an elasticity of shy 026 The pure substitution effect of a wage change increases labor supply a 1 percent increase in wages leads to a 049 percent increase in labor supply controlling for income effects
Data from the 1987 Practice Patterns of Young Physicians Survey (YPS)
Econometric model (log linear regression)
Rizzo and Blumenthal 1994
Estimate the labor supply of physicians employed at hospitals in Norway using personnel register data merged with other public records
Research indicates a 10 percent wage increase would lead to a 3 percent increase in physician labor supply (wage elasticity of 03) The magnitude of the wage elasticity in this case may be relatively small because of hospital employed physicians tendency to have a lower wage than selfshyemployed physicians though still larger than previous estimates
Data set used is a sample of 1303 male physicians observed over the period 1993 and 1997
Econometric model (GMM system GMM)
Baltagi et al 2005
Estimate wage elasticities for Norwegian nurses
40 percent of PCC students returned to New Mexico to practice compared to 32 percent of traditional students
Data includes detailed information on 18066 individuals over 5 years totaling 56832 observations between 1993 and 1997
Econometric model (fixed effects)
Askildsen amp Baltagi 2002
Effect of a permanent 10 percent increase in fees for primary care ambulatory visits on volume of services and cost to Medicare
Analysis shows the fee increase would increase primary care visits by 88 percent and raise the overall cost of primary care visits by 17 percent However these increases would yield more than a sixshyfold annual return in lower Medicare costs for other servicesmdashmostly inpatient and postshyacute caremdashonce the full effects on treatment patterns are realized The net result would be a drop in Medicare costs of nearly 2 percent These
Data set contains Medicare claims data (2004 to 2006) as well as physician data from the Community Tracking Study (CTS) Physician Survey (2004 to 2005)
Econometric model
Reschovsky et al 2012
Estimates the relationship between Medicare fees and quantities provided by physicians for eight specific services
Results show that Medicare fees are positively related to quantity provided for all eight services and are significantly different from zero and elastic for five Estimates are that a 10 percent reduction in Medicare fees would lead to 18 percent to 66 percent reduction in the volume of office visits
Data set contains 13707 physicians who responded to surveys in 20002001 andor 20042005 and were linked to all Medicare claims for their Medicare patients
Econometric model (GLM)
Hadley et al 2009
67
Final Report Health Practitioner Bonuses
Study Goal Results Data Type of Study Reference
Estimate trends in hours worked by US physicians and assess for association with physician fees
After remaining stable through the early 1990s mean hours worked per week decreased by 72 percent between 1996 and 2008 among all physicians (from 549 hours per week in 1996shy1998 to 510 hours per week in 2006shy2008 Excluding resident physicians whose hours decreased by 98 percent the last decade due to duty hour limits imposed in 2003 nonresident physician hours decreased by 57 percent
Data set from US Census Bureau Current Population Survey between 1976 and 2008 (N=116733)
Outcomes of a Problemshybased learning model (specialty and practice location)
Steiger et al 2010
Study Goal Results Data Type of Study Reference
Topic Financial Incentives for Primary Care Providers in Underserved Areas (Section IV)
Evaluate effectiveness and developing trends in bonus payments to rural physicians
In 1991 the total amount of HPSA bonus was almost 316 million dollars Estimates show that 583 percent of the total HPSA bonus payment went to rural HPSAs while the remaining 417 percent went to urban HPSAs They also observed that the total bonus payment grew to reach about 106 million dollars in 1996 but then gradually declined to almost 77 million dollars in 1998 The rural proportion of HPSA bonus payments decreased to 511 percent
Data set includes Area Resource File (ARF) and Medicare Part B claims data for multiple years
Trend examination
Shugarman et al 2001
Examine trends in Medicare spending for basic payments and bonus payments for physician services provided to beneficiaries residing in nonmetropolitan counties
Payments under the Congressionallyshymandated bonus payment program accounted for less than 1 percent of expenditures for physician services in nonmetropolitan underserved counties Physician payments increased from 1992 to 1998 while bonus payments increased through 1996 but then declined by 13 percent by 1998 The share of bonus payments to primary care physicians declined throughout the decade but the share for primary care services increased
Data set includes Area Resource File (ARF) and Medicare Part B claims data for multiple years
Trend examination
Shugarman and Farley 2003
Evaluate the effectiveness of programs that provide financial incentives to physicians in exchange for a rural or underserviced area returnshyofshyservice (ROS) commitment
The majority of studies reported effective recruitment despite high buyshyout rates in some USshybased programs Increasing Canadian tuition and debt among medical students may make these programs attractive The one prospective cohort study on retention showed that physicians who chose voluntarily to go to a rural area were far more likely to stay long term than those who located there as an ROS commitment Multidimensional programs appeared to be more successful than those relying on financial incentives alone
Limited literature available given quality limitations
Literature Review
Sempowski et al 2004
Assess the effect of various On average a 10 percent increase in the general practitioner Data for physicians come Econometric incentive measures fees for medical services in a region increases the propensity from la Corporation model (spatial Bolduc et introduced in Quebec of a beginning GP to work in this region by 7 percent Thus the Professionnelle des autoregressive al 1996 (Canada) to influence the implied elasticity of location choice probability with respect to Medecins du Qu6bec multinomial
68
Final Report Health Practitioner Bonuses
Study Goal Results Data Type of Study Reference geographical distribution of fee increases is about 07 However this elasticity varies Population data come probit) physicians across regions it is higher in remote regions (with a maximum from Canada Census
of 128) On the other hand on average the elasticity of (various years) and intershylocation choice probability with respect to nonshylabor incomes census estimations from such as study grants is estimated to be about 111 le Bureau de la Statistique
du Qu6bec (unpublished data)
Compare the types of locations chosen by alumni and nonshyalumni of a United States program charged with increasing physician supply
Eliminating the program would decrease the supply of physicians in medically underserved communities by roughly 10 percent
Data from multiple sources primarily the
American Medical Association (AMA) master file for 1981 1986 1991 and 1996
Econometric (multinomial logit)
Holmes 2005
Examine the history and results of The Physician Shortage Area Program (PSAP) of Jefferson Medical College and identify factors independently predictive of rural primary care supply and retention
Freshmanshyyear plan for family practice being in the PSAP having a National Health Service Corps scholarship male sex and taking an elective senior family practice rural preceptorship were independently predictive of physicians practicing rural primary care Among PSAP graduates taking a senior rural preceptorship was independently predictive of rural primary care However nonshyPSAP graduates with 2 key selection characteristics of PSAP students (having grown up in a rural area and freshmanshyyear plans for family practice) were 78 percent as likely as PSAP graduates to be rural primary care physicians and 75 percent as likely to remain suggesting that the admissions component of the PSAP is the most important reason for its success
Data includes a total of 3414 Jefferson Medical College graduates from the classes of 1978shy1993 including 220 PSAP graduates
Retrospective cohort study
Rabinowitz et al 2001
69
Final Report Health Practitioner Bonuses
Study Goal Results Data Type of Study Reference
Topic Impact of the Increase in Medicaid Reimbursement Rate Relative to the Medicare Rate (Section V)
Identify the causal effect of increases in Medicaid reimbursement rates relative to the Medicare rate on the propensity of primary care physicians accepting new Medicaid patients
For primary care physicians a 10 percentage point increase in the MedicaidMedicare fee ratio for primary care is associated with only a 21 percentageshypoint increase in Medicaid patient acceptance The average Medicaid reimbursement rate relative Medicare in 2008 was at 662 percent and the national average acceptance rate of new Medicaid patients by PCPs was 415 percent Therefore the implied elasticity of accepting primary care patients with respect to the payment rate is about 033 Excluding pediatricians it is 041
Data acquired from HSC 2008 Health Tracking Physician Survey and American Medical Association (AMA) master file
Econometric model (OLS)
Cunningha m 2011
Examine the effects of Medicaid payment generosity on access and care for adult and child Medicaid beneficiaries
Higher payments increase the probability of having a usual source of care and the probability of having at least one visit to a doctor and other health professional for Medicaid adults and produce more positive assessments of the health care received by adults and children However payment generosity has no effect on the other measures that we examined such as the probability of receiving preventive care or the probability of having unmet needs
Data from the National Surveys of Americarsquos Families (1997 1999 2002) and are linked to the Urban Institute Medicaid capitation rate surveys the Area Resource File and the American Hospital Association survey files
Econometric model (differenceshyinshydifference)
Shen amp Zuckerman 2005
Evaluation in California of whether the expansion of Medicaid managed care and a physician payment increase were associated with an increase over time in the percentage of physicians caring for Medicaid patients
Despite large increases in the use of MedishyCal
managed care and the implementation of MedishyCal physician fee increases between 1996 and 2001 there was no significant inshy crease in the percentage of primary care physicians accepting new MedishyCal patients or having any MedishyCal patients in practice over time
Dataset comprised of surveys of probability samples of primary care and specialist physicians in California in 1996 1998 and 2001 and AMA master file data
Chishysquare tests
Bindman et al 2003
Examine the impact of Californiarsquos Medicaid reshy imbursement for nursing homes which includes incentives directed at staffing
Consistent with the rate incentives and rational expectation behavior expected nursing home reimbursement rates in 2008 were associated with increased RN staffing levels in 2006 but had no relationship with licensed practical nurse and certified nursing assistant staffing The effect was estimated at 2 minutes per $10 increase in rate
Data from Medicaid master file for a total of 927 California freeshystanding nursing homes in 2006
Econometric model (twoshystage MLE)
Mukamel et al 2012
Assess the effects of Medicaid fee changes on physician participation enrollee access and shifts in the site of ambulatory care using several natural experiments in Maine and Michigan
The reimbursement changes included substantial percentage changes in fees however the value of the Medicaid fee improvements relative to the private market eroded very rapidly in the months following the interventions Implied elasticities ranged between 039 and shy0021
Dataset from Medicaid claims and enrollment data between 1988 and 1992
Program Overview amp Outcomes of communityshybased training
Coburn et al 1999
70
Final Report Health Practitioner Bonuses
Appendix B Additional Exhibits
Exhibit B1 Distribution of Primary Care Providers with PCIP Eligible Specialty by Age Sex and Year
Sex Age 2005 2006 2007 2008 2009 2010 2011
Male lt35 114 104 102 98 94 88 79
Male 35shy44 299 295 288 282 276 271 265
Male 45shy54 347 338 323 311 299 287 281
Male 55shy64 186 204 220 235 250 263 275
Male 65+ 53 59 66 74 82 90 100
Male Total 95911 101781 111971 116133 118868 121264 122048
Female lt35 215 205 206 204 201 197 189
Female 35shy44 368 367 359 353 347 342 340
Female 45shy54 315 312 304 298 291 284 278
Female 55shy64 91 104 117 128 142 155 168
Female 65+ 10 12 14 17 19 22 24
Female Total 59446 66054 78531 86972 93905 100930 106003
Missing SexAge
29633 33759 42945 49954 54580 60665 73232
Total 184990 201594 233447 253059 267353 282859 301283
Exhibit B2 Average Number of PCIP Eligible EampM Claims per PCP under Medicare by Specialty 2005shy2011
Specialty 2005 2006 2007 2008 2009 2010 2011
Internal Medicine 869 823 759 746 712 697 653
Family Medicine 722 694 651 649 631 626 605
Pediatrics 51 50 42 39 41 40 36
Geriatrics 989 1026 990 978 960 955 958
Clinical Nurse Specialist 86 85 77 87 97 107 118
Nurse Practitioner 258 257 230 219 219 228 228
Physician Assistant 125 128 120 121 124 134 140
71
Final Report Health Practitioner Bonuses
Exhibit B3 Average Allowed Charges ($) for the PCIP Eligible EampM Claims per PCP under Medicare 2005shy2011
Specialty 2005 2006 2007 2008 2009 2010 2011
Physicians
Internal Medicine $52896 $51477 $51149 $51737 $51438 $55188 $53641
Family Medicine $41019 $40557 $41279 $42369 $43075 $46833 $47163
Pediatrics $3008 $3028 $2705 $2533 $2771 $3055 $2835
Geriatrics $61243 $70593 $68845 $73829 $76317 $82230 $84453
NonshyPhysicians
Clinical Nurse Specialist $4219 $4446 $3974 $4883 $5824 $6841 $7890
Nurse Practitioner $12139 $13055 $11929 $12019 $12600 $14274 $14752
Physician Assistant $5724 $6122 $6064 $6333 $6765 $8133 $8831
Exhibit B4 Proportion of PCIP Eligible EampM Claims per 2011 PCIP Recipients by Specialty 2005shy2011
Specialty 2005 2006 2007 2008 2009 2010 2011
Physicians
Internal Medicine 45 45 44 44 41 42 41
Family Medicine 45 45 44 44 41 42 40
Pediatrics 45 47 47 47 45 41 39
Geriatrics 67 72 70 68 64 62 64
NonshyPhysicians
Clinical Nurse Specialist 64 66 64 60 57 57 56
Nurse Practitioner 66 66 69 68 65 67 68
Physician Assistant 55 56 56 55 51 52 50
Note the proportions are calculated out of all Medicare claims (excluding hospital inpatient ER drug and lab)
Exhibit B5 Average Number of PCIP Eligible EampM Claims per 2011 PCIP Recipients under Medicare by Specialty 2005shy2011
Specialty 2005 2006 2007 2008 2009 2010 2011
Physicians
Internal Medicine 1113 1088 1050 1057 1015 1035 1011
Family Medicine 808 785 752 756 729 752 743
Pediatrics 157 149 130 118 111 129 132
Geriatrics 1168 1237 1191 1187 1145 1181 1193
NonshyPhysicians
Clinical Nurse Specialist 375 384 361 346 335 382 389
Nurse Practitioner 384 403 369 392 405 457 492
Physician Assistant 251 266 260 268 266 301 301
72
Final Report Health Practitioner Bonuses
Exhibit B6 Average Allowed Charges for the PCIP Eligible EampM Claims per 2011 PCIP Recipients under Medicare 2005shy2011
Specialty 2005 2006 2007 2008 2009 2010 2011
Physicians
Internal Medicine $67863 $68281 $70869 $73505 $73494 $81629 $82500
Family Medicine $45958 $45878 $47781 $49440 $49827 $56350 $58004
Pediatrics $9336 $9051 $8460 $7864 $7631 $9836 $10450
Geriatrics $72412 $85046 $82732 $89548 $90821 $101283 $104284
NonshyPhysicians
Clinical Nurse Specialist $17795 $19741 $18922 $19279 $19557 $24141 $25405
Nurse Practitioner $19633 $21605 $19496 $22516 $24830 $29740 $32837
Physician Assistant $11628 $12949 $13457 $14496 $15128 $18717 $19363
Exhibit B7 Proportion of Allowed Charges for PCIP Eligible EampM Claims per 2011 PCIP Recipients 2005shy2011
Specialty 2005 2006 2007 2008 2009 2010 2011
Physicians
Internal Medicine 71 72 74 76 77 79 76
Family Medicine 73 75 77 77 78 80 77
Pediatrics 70 73 75 75 77 77 76
Geriatrics 77 87 88 89 89 90 89
NonshyPhysicians
Clinical Nurse Specialist 76 80 81 83 85 86 85
Nurse Practitioner 68 71 75 79 82 87 87
Physician Assistant 72 74 76 78 81 83 82
Note the proportions are of allowed charges for all Medicare claims (excluding hospital inpatient ER drug and lab)
73
Final Report Health Practitioner Bonuses
Exhibit B8 Distribution of the Number of NPs and PAs across HPSA and PSA regions
Profession Type 2005 2006 2007 2008 2009 2010 2011
Nurse Practitioners
Total Providers 23610 27450 35286 42144 46973 52472 59505
in HPSA x X 14171 16978 18858 20929 23045
in PSA 2946 3331 4139 4694 NA NA NA
in HPSA amp PSA x X 1638 1855 NA NA NA
PCIP 2011 Recipients 12267 14146 18008 23070 27698 25369 23707
in HPSA x X 7335 9344 11148 10178 9312
in PSA 1558 1754 2168 2571 NA NA NA
in PSA amp HPSA x X 861 1027 NA NA NA
Physician Assistants
Total Providers 21240 24439 30823 35593 39226 42871 47340
in HPSA x X 13246 15236 16889 18489 19828
in PSA 2166 2436 3098 3467 NA NA NA
in HPSA amp PSA x X 1230 1363 NA NA NA
PCIP 2011 Recipients 6168 7033 8852 10898 13038 11961 11288
in HPSA x X 3830 4732 5760 5226 4755
in PSA 760 839 1034 1217 NA NA NA
in PSA amp HPSA x X 408 494 NA NA NA
Note HPSA includes only full HPSA areas (data from Area Resource File and HPSA status data are not available prior to 2007) PSA status after 2008 is not applicable as 2008 was the final year of the PSA bonus
Exhibit B9a Distribution of Male Primary Care Physicians with PCIP Eligible Specialty by Age and Year
Note Primary care physicians include following specialties internal medicine family practice pediatrics geriatrics
74
Final Report Health Practitioner Bonuses
Exhibit B9b Distribution of Female Primary Care Physicians with PCIP Eligible Specialty by Age and Year
Note Primary care physicians include following specialties internal medicine family practice pediatrics geriatrics
Exhibit B10 Distribution of Male Primary Care NonshyPhysicians with PCIP Eligible Specialty by Age and Year
Note Primary care nonshyphysicians include following specialties PA NP and CNS
75
Final Report Health Practitioner Bonuses
Exhibit B11 Distribution of Female Primary Care NonshyPhysicians with PCIP Eligible Specialty by Age and Year
Note Primary care nonshyphysicians include following specialties PA NP and CNS
Exhibit B12 Average Number of PCIP Eligible EampM Claims Submitted by 2011 PCIP Recipients 2005 ndash 2011
76
2
0
7
3
4 0 4 6
Final Report Health Practitioner Bonuses
Exhibit B13 Allowed Charges for PCIP Eligible EampM Claims per 2011 PCIP Recipients 2005shy2011
Exhibit B14 Total Number of PCIP Eligible EampM Claims submitted by All Providers in the Control Group 2005shy2011
Specialty 2005 2006 2007 2008 2009 2010 2011
OBGYN 2597637 2612513 2728810 281347 2893204 3047849 3040383
Ophthalmology 5615010 5648040 6070483 597672 5832440 6361330 6164821
Pathology 46894 51364 54748 57005 57147 64078 63652
Urology 6964185 7202012 7571544 777585 7777728 8616096 8641898
Optometry 2464734 2550764 2758214 289154 2969244 3048668 3088461
Podiatry 7788889 8195973 8957163 973940 1001263 1064539 1089067
Psychology 42 11 27 64 1552 2440 2097
Neurophysiology 12609 13838 13858 15451 18142 17962 17714
77
shy
Final Report Health Practitioner Bonuses
Additional Regression Results
Exhibit B15 Impact of Medicare PCIP Policy on the Number of Primary Care Providers Who Have submitted any Medicare Claims (not necessarily under PCIP Eligible Services)
(2005shy2011)
Dependent Variable Number
of Providers per county All Providers (1) Physicians Only (2) Non Physicians Only (3)
PCIP Elig Specialty Indicator 6550 4054 4859
(3929) (4449) (2759)
Elig Specialty Ind x Post 2009 4408 3255 5710
(0503) (0758) (0482)
Post 2009 4588 3314 4187
(0505) (0593) (0350)
Median Income ($10k) 2306 2728 1643
(0424) (0513) (0241)
Percent in poverty 0466 0541 0360
(00535) (00653) (00332)
Population (10k) 0727 0771 0487
(00298) (00359) (00144)
Percent Population over 65 shy0406 shy0262 shy0337
(00407) (00502) (00280)
Unemployment Rate shy0660 shy0652 shy0493
(00522) (00621) (00392)
Intercept shy7242 shy7909 shy490
(4371) (4812) (3069)
Specialty Fixed Effects Yes Yes Yes
Year Fixed Effects Yes Yes Yes
State Fixed Effects Yes Yes Yes
N 140192 107526 95647
Adj Rshysq 0391 0396 0480
Note Robust standard errors are in parentheses + significance at 10 significance at 5 The number of observation is based on the number of counties the number of years and the number of provider specialties in each model (ie physicians include 4 primary care specialties and nonshyphysicians include 3 subshy specialties)
78
-
shy
Final Report Health Practitioner Bonuses
Exhibit B16 Impact of Medicare PCIP Policy on the Number of Primary Care Providers Who Met 60 PCIP Eligibility Threshold Each Year (2005shy2011)
Dependent Variable Number of
Providers per county
All Providers
(1)
Physicians Only
(2)
Non Physicians
Only (3)
PCIP Elig Specialty Indicator 2062 2194 6540
(1769) (2050) (0642)
Elig Specialty Ind x Post 2009 2322 1841 2776
(0341) (0543) (0243)
Post 2009 1252 0750+ 0994
(0348) (0427) (0143)
Median Income ($10k) 0549+ 0847 00118
(0305) (0380) (00942)
Percent in poverty 00663+ 00965 00165
(00379) (00473) (00137)
Population (10k) 0264 0298 00610
(00229) (00284) (000579)
Percent Population over 65 shy0155 shy0105 shy0127
(00277) (00355) (00111)
Unemployment Rate shy0252 shy0259 shy00864
(00357) (00444) (00166)
Intercept shy2281 shy2717 shy3777
(2029) (2419) (0775)
Specialty Fixed Effects Yes Yes Yes
Year Fixed Effects Yes Yes Yes
State Fixed Effects Yes Yes Yes
N 140192 107526 95647
Adj Rshysq 0174 0184 0119
Note Robust standard errors are in parentheses + significance at 10 significance at 5 The number of observation is based on the number of counties the number of years and the number of provider specialties in each model (ie physicians include 4 primary care specialties and nonshyphysicians include 3 subshy specialties)
79
-
Final Report Health Practitioner Bonuses
Appendix C Differenceshyinshydifference (DID) Methodology
C1 DID model and derivation for estimating the impact of PCIP policy
The following equation (Equation (1)) shows the econometric model to identify the effect of Medicare PCIP program on the magnitude of primary care EampM services
= + lowast + lowast 13 + lowast 13 lowast + lowast + (1)
We let Sit be the volume of eligible EampM services provided by provider i in period t Ti is an indicator for treatment group that takes the value 1 if the provider is a PCP and zero otherwise the variable is an indicator variable taking the value of 1 in the years when the PCIP policy is likely to impact the behavior of the providers and 0 otherwise the vector includes provider characteristics such as age and gender etc The term Eit represents random unobserved factors affecting EampM services
The DID methodology that we use here to identify the unbiased effect of PCIP policy on the volume of primary care EampM services is illustrated by considering two time periods preshyPCIP (pre) and postshyPCIP (post) periods with the latter being the years when the PCIP policy is likely to impact the behavior of the providers Equation (2) below shows the change in the volume of EampM services provided by PCPs between preshyPCIP and postshyPCIP periods holding other things constant
(2)
Similarly equation (3) below shows the change in the volume of EampM services provided by nonshyPCPs between preshyPCIP and postshyPCIP periods
(3)
Holding other provider characteristics (embedded in Xs) constant and assuming the changes in random shocks are zero in the limit for both the groups equation (4) below shows that the change in the magnitude of the primary care EampM services provided by PCPs due to the introduction of the Medicare PCIP program is 8
(4)
Thus the coefficient 8 from equation (1) represents an unbiased estimate of the effect of the Medicare PCIP policy on the volume of primary care EampM services Similar methodology can also be applied to estimate the effect of the PCIP policy on other outcomes of interest
C2 DID model and derivation for estimating the impact of HPSA bonus
Equation (5) below shows the empirical specification that we used to estimate the effect of HPSA status on the outcome variables discussed above
80
-0 minus -23 = + + 4 -0 minus -235 lowast + -0 minus -23
minus = + 466-0 66-23 66-0 minus
66-235 lowast + 66-0 minus 66-23
(-0 minus -23) minus (66-0 minus 66-23) =
13tit
7- = +
7- =
7- = + + +
7- = +
Final Report Health Practitioner Bonuses
The model is specified based on the physician level data in each year Here the dependent variable Dict is one of the other potential outcomes of interest of a primary care physician i in county c at time t H SA ict is an indicator of whether physician irsquos county is a HPSA at time t
is an indicator variable taking the value of 1 if the physicianrsquos county ever gained the HPSA status (from a nonshyHPSA) during the sample period and zero otherwise is an indicator variable taking the value of 1 if the physicianrsquos county ever lost the HPSA designation during the sample period and zero otherwise the vector ict includes variables
reflecting the physician characteristics their geographic locations etc and t is a vector of timeshyspecific fixed effect terms
The term Eict represents random unobserved factors affecting outcomes If the change of HPSA status is associated with any changes in the volume of services provided by primary care physicians in those areas then we should expect estimated values of 82 and λ2 in equation (5) will reflect them If the outcome of interest is the volume of services then a positive significant estimated value of 82 would imply higher volume of services due to gaining HPSA designation
For simplicity assume that we have physicians in the following four types of counties counties that are always HPSA (type C1) counties that are always nonshyHPSA (type C2) counties that gained HPSA status and remained HPSA afterwards (C3) and counties that lost HPSA status and remained nonshyHPSA afterwards (C4) Also consider the number of EampM claims submitted under Medicare as the outcome variable of interest Now for given values of and E let us focus on the first 7 terms of the above equation for a representative provider in each of these 4 types of counties
Equation (6) shows the expression of the model excluding the last three terms for County Type C1 (always HPSA)
(6)
Equation (7) shows the expression of the model excluding the last three terms for County Type C2 (always nonshyHPSA)
(7)
Equation (8) shows the expression of the model excluding the last three terms for County Type C3 (gained HPSA status) when these counties have HPSA status
(8)
Equation (9) shows the expression of the model excluding the last three terms for County Type C3 (gained HPSA status) when these counties have NonshyHPSA status
(9)
81
7- = + lowast 89- + lowast 1389- + lowast 89- lowast 1389- + lt lowast 13=13gt89- + lt lowast89- lowast 13=13gt89- +
lowast + lowast + -(5)
1389ic 13=13gt8Aic
Final Report Health Practitioner Bonuses
Thus ( + ) in equation (6) shows the estimated average number of claims per physician in HPSA counties (after controlling for other factors) while in equation (7) represents the estimated average number of claims per physician in nonshyHPSA counties Thus captures the persistent difference in the average number of claims between the HPSA and nonshyHPSA counties
On the other hand comparing equation (8) and (9) the model indicates that in counties that gained the HPSA status ( + 82) shows the difference between the estimated average number of claims per physician when the counties have the HPSA status and the average number of claims when they do not have the HPSA status However already captures the persistent difference in the average number of claims between the HPSA and nonshyHPSA counties Therefore the parameter 82 shows the additional impact of HPSA status on the average number of claims per physician in the counties that gained HPSA status If gaining HPSA status encourages physicians to increase the availability of primary care services then we expect 82 to be positive
Similarly equation (10) shows the expression of the model excluding the last three terms for County Type C4 (lost HPSA status) when these counties have HPSA status
Type C4 and HPSA
Dict = + + A1 + A2 (10)
Equation (11) shows the expression of the model excluding the last three terms for County Type C4 (lost HPSA status) when these counties have NonshyHPSA status
Dict = + A1 (11)
Once again comparing equation (10) and (11) the model indicates that in counties that lost the HPSA status ( + A2) shows the difference between the estimated average number of claims per physician when they have the HPSA status and the average claims when they do not have the HPSA status However already captures the persistent difference in the average number of claims between the HPSA and nonshyHPSA counties Therefore the parameter A2 shows the additional impact of HPSA status on the average number of claims per physician in the counties that lost HPSA status If losing the HPSA status induces physicians to decrease the availability of primary care services then we expect A2 to be positive implying higher average claims when the counties had the HPSA status
82
1 = A1( lowast (1 minus )) = 04( lowast (1 minus ))
7 = Fgt(0(1 minus 0)) minus 1 lowast G0
HIJKLIJM13N7JJ = Fgt(1(1 minus 1)) = 7 + 1 lowast G1
Final Report Health Practitioner Bonuses
Appendix D Simulation Methodology
Method of Calculating the Predicted Proportion of Officeshybased Physicians Accepting New Medicaid Patience as a Function of the MedicaidshytoshyMedicare Fee Index
Consider that
I0 is the observed value of the MedicaidshytoshyMedicare fee index 2008
I1 is the new value of the MedicaidshytoshyMedicare fee index (eg I1 could be 1 percent or 10 percent or x percent higher than I0 where x is a chosen value)
P0 is the observed proportion of officeshybased physicians accepting Medicaid patients in 2011
P1 is the predicted proportion of officeshybased physicians accepting Medicaid patients after the x percent increase in MedicaidshytoshyMedicare fee index
M1 is the estimated marginal effect of the MedicaidshytoshyMedicare fee ratio (2008) = 04 (reported in the study)
B1 is the estimated logit coefficient of the MedicaidshytoshyMedicare fee ratio (2008)
Given the fact that marginal is equal to the estimated logit coefficient times P times (1shyP) where P is the mean proportion of officeshybased physicians accepting Medicaid patients in the sample equation (12) shows the estimated logit coefficient of the MedicaidshytoshyMedicare fee ratio (2008)
(12)
Since Decker (2012) reports that P is 0694 this implies B1 is equal to 04(0694(1shy0694)) which is approximately equal to 188
Letrsquos name the part of the estimated logit model which incorporates the effect of other independent variables (other than MedicaidshytoshyMedicare fee ratio) and the intercept term in the model as ldquoOther Effectsrdquo or OE Equation (13) below shows the expression of ldquoOther Effectsrdquo (OE) based on a given value of P0 and a known value of B1 (where ldquolnrdquo is the natural log)
(13)
Then based on the estimated logit model we can predict the logshyodds of the proportion of officeshybased physicians accepting new Medicaid patients for a new value of the MedicaidshytoshyMedicare index (say I1) Equation (14) shows the logshyodds of the proportion of officeshybased physicians accepting new Medicaid patients
(14)
83
1HIJKLIJOH13O13HK13gt = 1 = [1 + X QI(RSTUlowastV ]Z)W
Final Report Health Practitioner Bonuses
Therefore equation (15) shows the implied predicted proportion of officeshybased physicians accepting new Medicaid patients (where ldquoexprdquo is the exponential function operation)
(15)
Example Based on Decker (2012)
(i) The national average of observed proportion of officeshybased physicians accepting Medicaid patients in 2011 (P0) is 0694
(ii) The Observed value of the MedicaidshytoshyMedicare fee index (I0) 2008 is 0742
We have already derived that the logit coefficient of the MedicaidshytoshyMedicare fee ratio (B1) is 188 This implies that OE is approximately 0576 (based on equation (13))
Now consider a 10 percent increase in the MedicaidshytoshyMedicare fee index from the national average in 2008 This implies that the new value of the MedicaidshytoshyMedicare fee index (I1) is 08162
This further implies that the predicted logshyodds of the proportion of officeshybased physicians accepting new Medicaid patients is equal to about 0958 (using equation (14))
Thus using the expression in equation (15) the predicted proportion of officeshybased physicians accepting new Medicaid patients (P1) is equal to 0723 or 723 percent
The same methodology is applied while calculating the predicted proportions for each state and the US in Exhibit 25
84
- Health Practitioner Bonuses and Their Impact on the Availability and Utilization of Primary Care Services Final Report
-
- Table of Contents
- Table of FiguresExhibits
- Acknowledgments
- Executive Summary
-
- Overview
- Key Findings
-
- 1 Impact of the Medicare Incentive Payment for Primary Care Providers (PCIP)
- 2 Impact of the Physician Shortage Area (PSA) bonus
- 3 Impact of the Health Professional Shortage Area (HPSA) Bonus
-
- Conclusions
-
- Introduction and Purpose Of The Study
- Literature Review
-
- A Effect of Earnings on the Supply of Primary Care Services and Providers Role of Medicare Primary Care Bonuses
-
- 1 Effects of Earnings on Specialty Choice by Physicians
- 2 Effects of Earnings on Labor Supply of Health Care Workforce
- 3 Effects of Earnings on the Volume of Primary Care Services
-
- B Financial Incentives for Primary Care Providers in Underserved Areas
- C Impact of the Increase in Medicaid Reimbursement Rate Relative to the Medicare Rate
-
- 1 Systemic Change in Medicaid Reimbursement Rates in All States
- 2 Stateshyspecific Experience on Changes in Medicaid Reimbursement Rates
-
- Conclusions
-
- Modeling the Impact of Medicare Incentive Payment for Primary Care Providers
-
- A Study Design Overview
- B Data Sources and Variables
-
- 1 Main Data Sets
- 2 Trends in Key Outcome Variables
-
- C Econometric Framework
- D Main Results
-
- 1 Impact of PCIP Policy on Number of Eligible Providers
- 2 Impact of PCIP Policy on Number of Claims for EampM Services
- 3 Impact of PCIP Policy on Allowed Charges for EampM Services
-
- Analyzing the Impact of Financial Incentives for Primary Care Providers in Shortage Areas
-
- A Background
- B Impact of the PSA Bonus on Primary Care Supply
- C Impact of the HPSA Bonus on Primary Care Supply
-
- Modeling the Impact of the Increase in Medicaid Reimbursement Rate Relative to the Medicare Rate
-
- A Study Design Overview
- B Simulation Exercise
-
- Conclusions
- Appendices
- Appendix A Bibliography and Literature Matrix
- Appendix B Additional Exhibits
-
- Additional Regression Results
-
- Appendix C Differenceshyinshydifference (DID) Methodology
-
- C1 DID model and derivation for estimating the impact of PCIP policy
- C2 DID model and derivation for estimating the impact of HPSA bonus
-
- Appendix D Simulation Methodology
-
- Example
-