health insurance coverage of california’s working latinos howard greenwald suzanne o'keefe...
TRANSCRIPT
Health Insurance Coverage of California’s Working Latinos
Howard Greenwald
Suzanne O'Keefe
Mark DiCamillo
University of Southern CaliforniaCalifornia State University, Sacramento
The Field Institute
Research supported by the California HealthCare Foundation
Facts AboutHealth Insurance Among Latinos
• According to the National Center for Health Statistics, 34% of non-elderly Latinos nationwide do not have health insurance, twice the national average.
• In California, 41% of Latino adults under age 65 do not have health insurance
• Most California Latinos without insurance are employed, or live in households headed by someone employed.
• The purpose of this survey is to understand specific causes of this lack of health insurance among the employed Latino population.
About the Survey
• Statewide survey of 1,000 employed California Latinos conducted by The Field Institute.
• Interviewing completed January 27–February 17, 2001 by telephone in English and Spanish.
• Sampling carried out using a random digit dial methodology, screening for Latino adults who are employed full or part-time.
• About half of the interviews were conducted in English and half in Spanish.
Differences Between Employed California Latinos and the Overall California Labor Force
• Industry Type:About half (47%) are employed in retail trade, manufacturing or construction, almost twice the statewide average.
• Tenure:About half (47%) have worked for their current employer for two years or less, compared to 39% among the overall CA labor force.
• Company Size:About half (49%) work for small businesses employing fewer than 50 employees, compared to 37% among all employed Californians.
• Educational Attainment:One in three (33%) do not have a high school degree, more than twice the proportion found in the overall CA labor force.
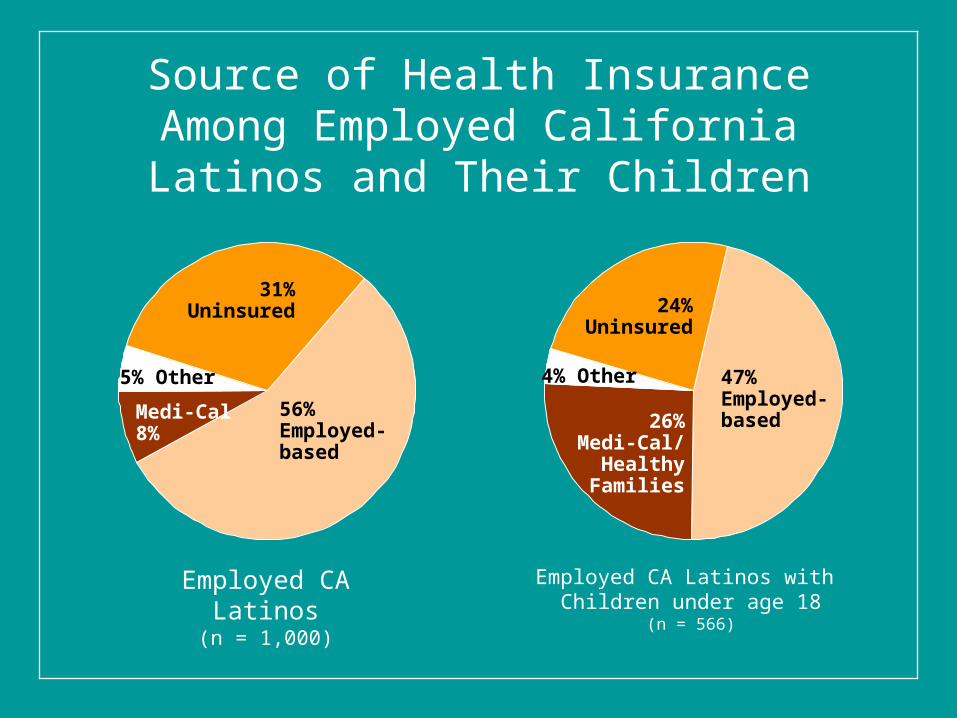
Source of Health Insurance Among Employed California Latinos and Their Children
Employed CA Latinos with Children under age 18
(n = 566)
24%Uninsured
26%Medi-Cal/
HealthyFamilies
47%Employed-based
4% Other
Employed CA Latinos(n = 1,000)
31%Uninsured
Medi-Cal8%
56%Employed-based
5% Other

Reasons Offered by Employed CA Latinosfor Not Having Health Insurance
25%
26%
31%
35%
36%
43%
46%
65%Costs too much
Not offered by employer
Deductibles/co-payments too high
Healthy and don’t need it
Prefer to pay for health care directly
Trouble understanding plans, completing forms
Have access to free, inexpensive care
Benefits with former employer ran out
(n for each = 299 employed Latinos without health insurance)

Reasons Given By Employed CA Latinos with Children for Not Having Health Insurance for Their Kids
26%
26%
30%
31%
32%
39%
44%
70%Too expensive
Trouble understandingplans, completing forms
Employer doesn’tprovide insurance
Don’t know where to get insurance for kids
Prefer paying for health care directly
Child not eligible for any coverages
(n for each = 133 employed Latinos with uninsured children)
Don’t need insurance
Afraid to apply because itmight affect immigration status
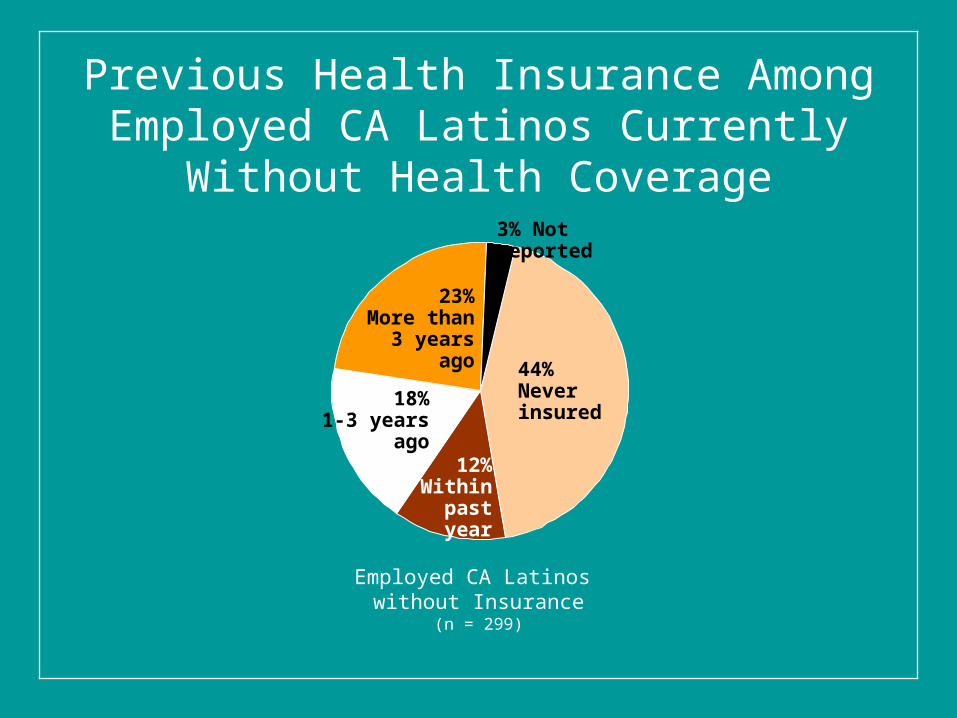
Previous Health Insurance Among Employed CA Latinos Currently Without Health Coverage
Employed CA Latinos without Insurance
(n = 299)
23%More than
3 years ago
12%Within
past year
44%Never insured
18%1-3 years
ago
3% Not reported
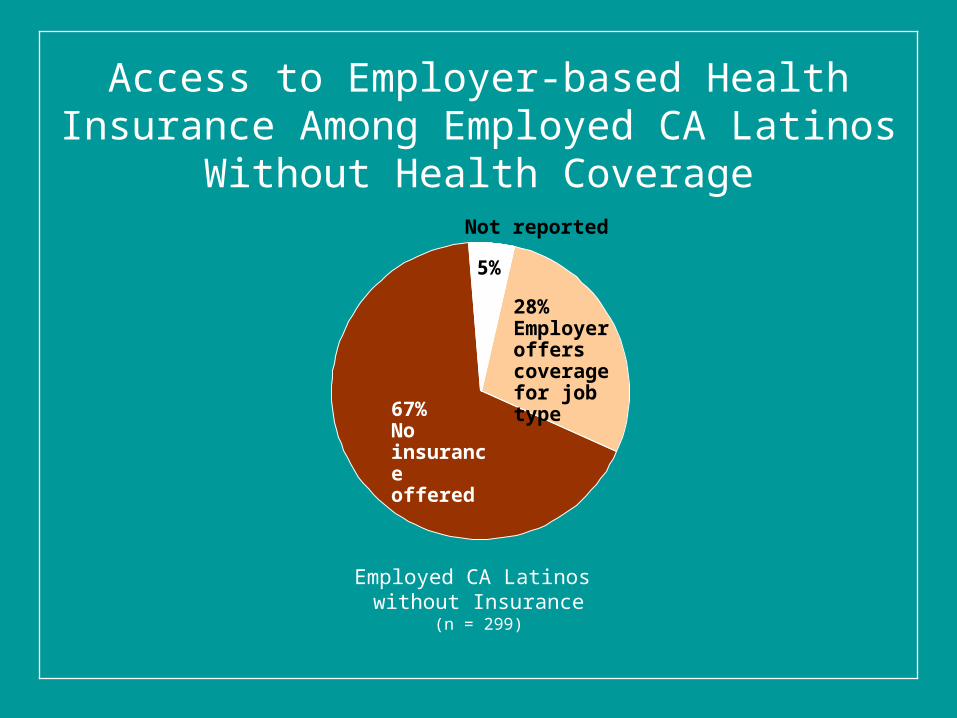
Access to Employer-based Health Insurance Among Employed CA Latinos Without Health Coverage
Employed CA Latinos without Insurance
(n = 299)
67%No insurance offered
28%Employer offers coveragefor job type
Not reported
5%

Reasons Given by Employed CA Latinos Without Insurance Whose Income is <200% of FPL and Who Have Not Applied
for Government-Sponsored Health Insurance
15%
21%
24%
29%
32%
36%
37%Don’t know where to apply
It costs too much
Don’t need insurance
Don’t think I’m eligible
Don’t understand plans/have trouble with forms
Don’t have the time
Don’t want to give out personal info to government
(n for each = 117 employed CA Latinos without insurance whose income is < 200% of FPL and who haven’t applied for government health insurance)
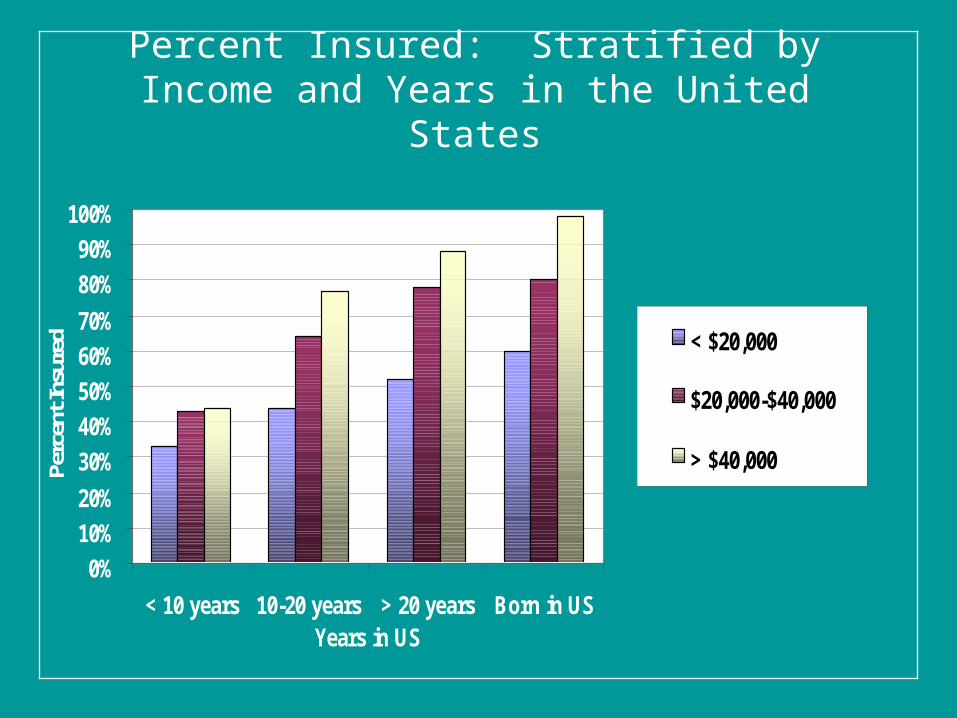
Percent Insured: Stratified by Income and Years in the United States
0%
10%
20%
30%
40%
50%
60%
70%
80%
90%
100%
< 10 years 10-20 years > 20 years Born in USYears in US
Perc
ent I
nsur
ed < $20,000
$20,000-$40,000
> $40,000
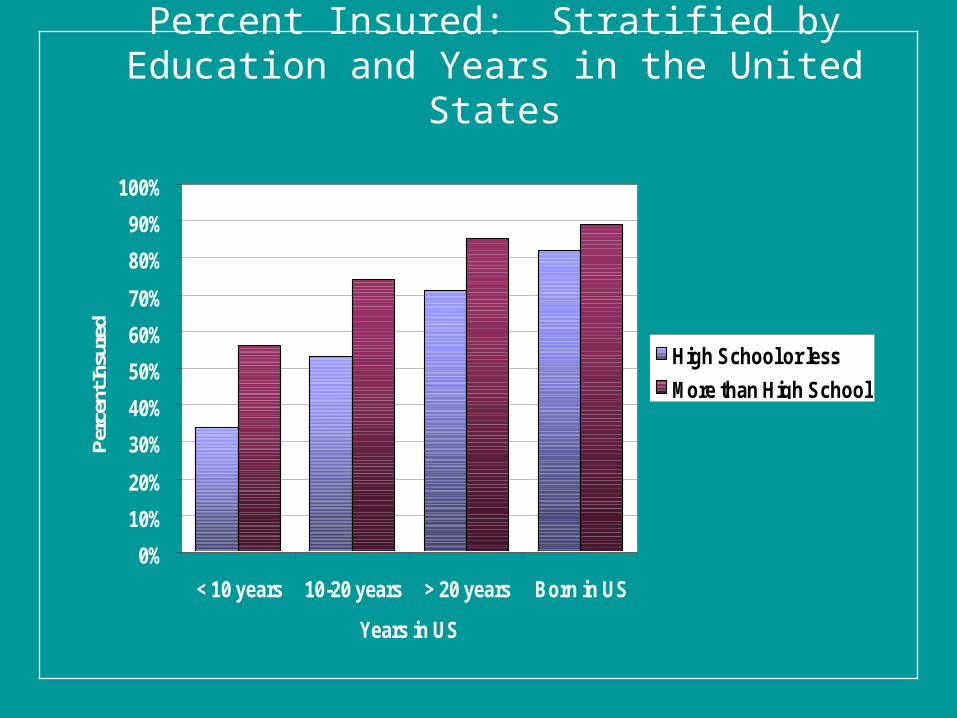
Percent Insured: Stratified by Education and Years in the United States
0%
10%
20%
30%
40%
50%
60%
70%
80%
90%
100%
< 10 years 10-20 years > 20 years Born in US
Years in US
Perc
ent I
nsur
ed
High School or less
More than High School
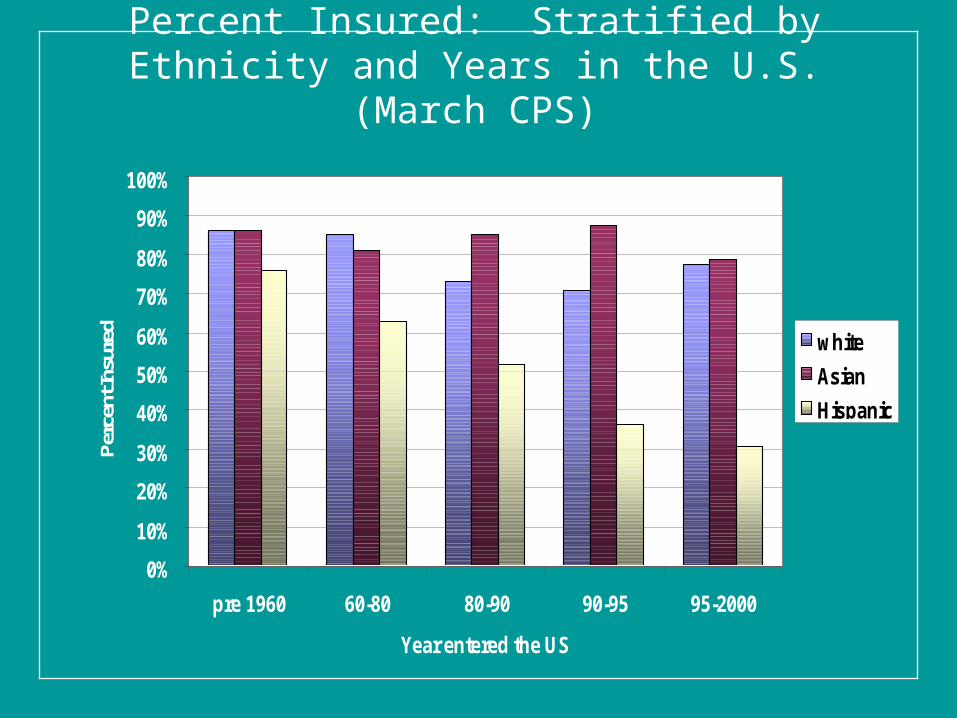
Percent Insured: Stratified by Ethnicity and Years in the U.S. (March CPS)
0%
10%
20%
30%
40%
50%
60%
70%
80%
90%
100%
pre 1960 60-80 80-90 90-95 95-2000
Year entered the US
Perc
ent I
nsur
ed white
Asian
Hispanic
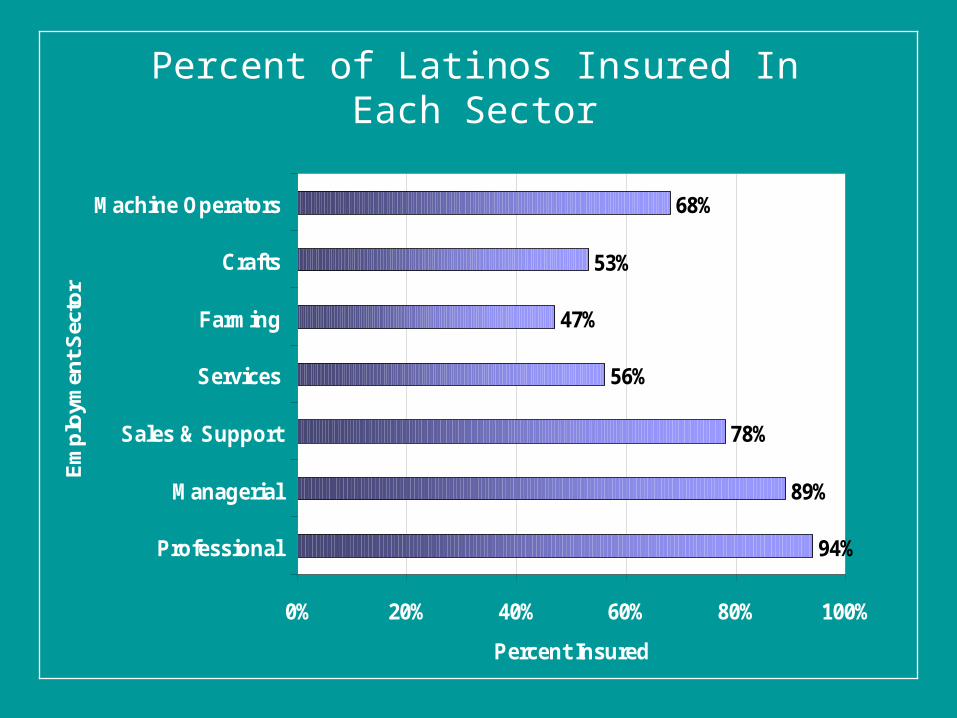
Percent of Latinos Insured In Each Sector
94%
89%
78%
56%
47%
53%
68%
0% 20% 40% 60% 80% 100%
Professional
Managerial
Sales & Support
Services
Farming
Crafts
Machine Operators
Em
plo
ymen
t S
ecto
r
Percent Insured
.
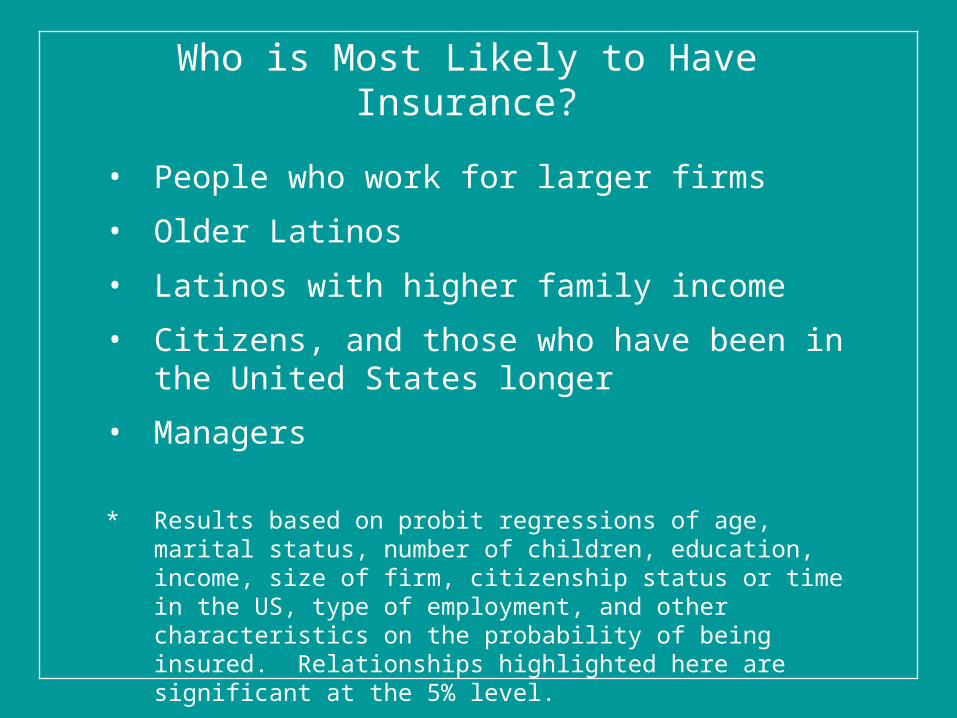
Who is Most Likely to Have Insurance?
• People who work for larger firms
• Older Latinos
• Latinos with higher family income
• Citizens, and those who have been in the United States longer
• Managers
* Results based on probit regressions of age, marital status, number of children, education, income, size of firm, citizenship status or time in the US, type of employment, and other characteristics on the probability of being insured. Relationships highlighted here are significant at the 5% level.
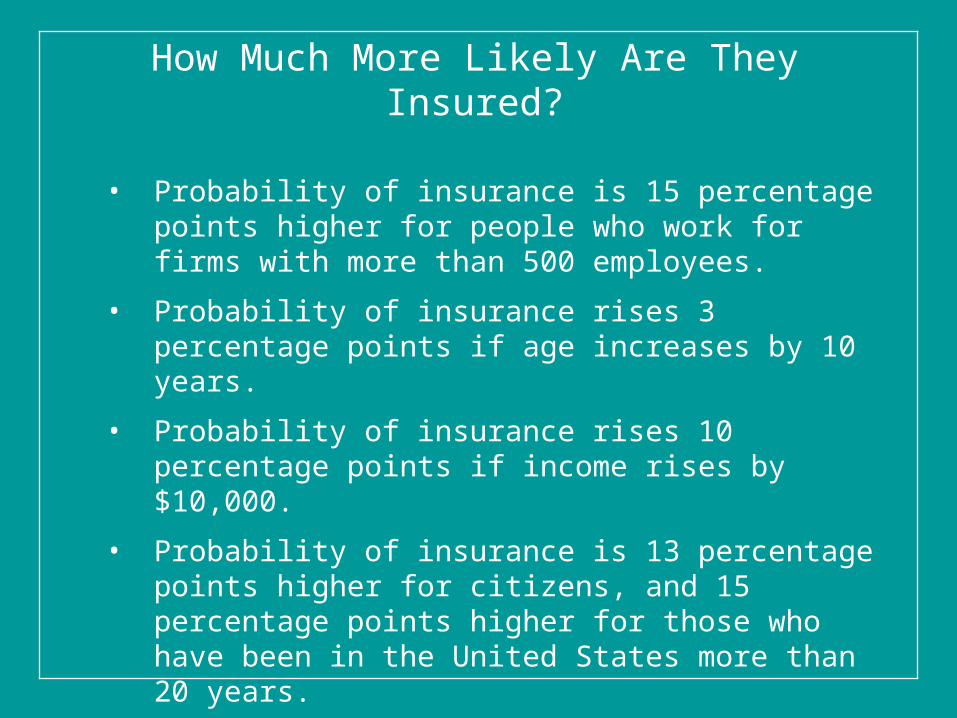
How Much More Likely Are They Insured?
• Probability of insurance is 15 percentage points higher for people who work for firms with more than 500 employees.
• Probability of insurance rises 3 percentage points if age increases by 10 years.
• Probability of insurance rises 10 percentage points if income rises by $10,000.
• Probability of insurance is 13 percentage points higher for citizens, and 15 percentage points higher for those who have been in the United States more than 20 years.
• Probability of insurance is 12 percentage points higher for managers
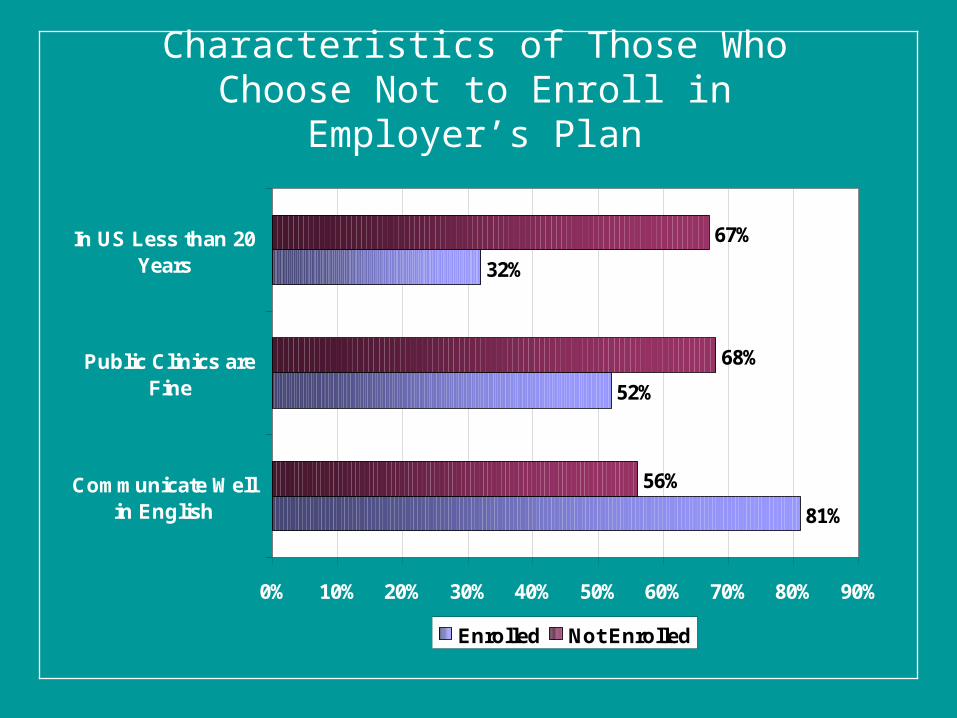
Characteristics of Those Who Choose Not to Enroll in Employer’s Plan
81%
52%
32%
56%
68%
67%
0% 10% 20% 30% 40% 50% 60% 70% 80% 90%
Communicate Wellin English
Public Clinics areFine
In US Less than 20Years
Enrolled Not Enrolled
Children of Employed Latinos
• 76% of employed Latinos with children have insurance for their children.
• 33% of these families insure their children through Medi-Cal or Healthy Families.
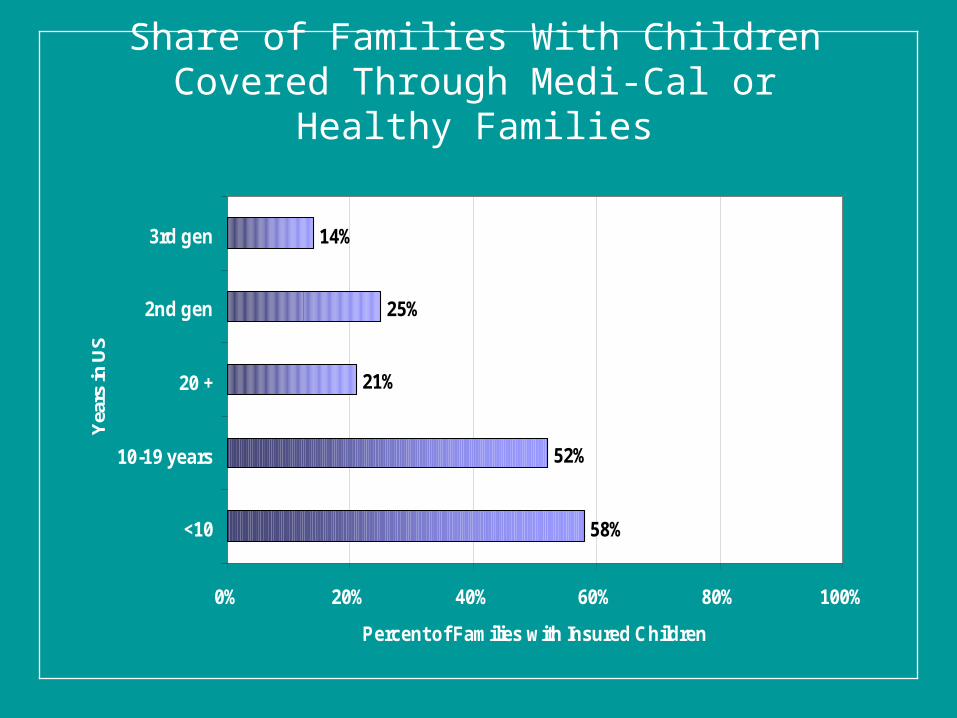
Share of Families With Children Covered Through Medi-Cal or Healthy Families
58%
52%
21%
25%
14%
0% 20% 40% 60% 80% 100%
<10
10-19 years
20 +
2nd gen
3rd gen
Yea
rs in
US
Percent of Families with Insured Children
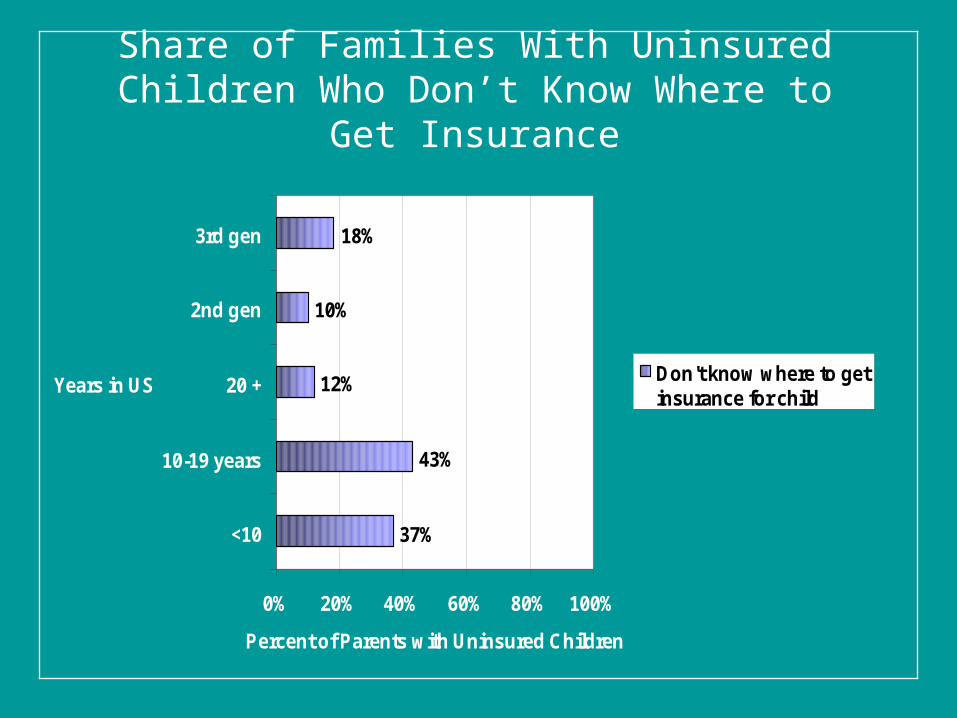
Share of Families With Uninsured Children Who Don’t Know Where to Get Insurance
37%
43%
12%
10%
18%
0% 20% 40% 60% 80% 100%
<10
10-19 years
20 +
2nd gen
3rd gen
Years in US
Percent of Parents with Uninsured Children
Don't know where to getinsurance for child
Conclusions
• Many working Latinos cannot afford health insurance.
• Latino workers often hold jobs that do not offer health insurance.
• Cultural differences, language skills, and recent immigration to the United States all contribute to low levels of insurance.
• Length of time in the United States is a strong predictor of insurance status, implying that acculturation may lead to higher levels of insurance.

Innovative Policy
• Due to the unique nature of this large population in California, innovative policy solutions are needed to meet the health care needs of employed Latinos.
• Solutions must address cost and access, but this is not sufficient.
• Cultural barriers limit use of insurance even if it is affordable, so cultural friendliness of health care organizations should be addressed.
• Improving access to information about insurance programs and simplifying the application process is also necessary.