health information needs of older women final report v1.1 ·...
TRANSCRIPT
The Health Information Needs of Older Women in the UK Report of a survey undertaken by the Women’s Network of the Royal College of Obstetricians and Gynaecologists

The Health Information Needs of Older Women in the UK
September 2015 Page 1
Contents
Glossary 2
Executive summary 4
1 Introduction 6
2 Methodology and the respondents 7
3 Health conditions and knowledge about them 11
4 Sources of help and information 20
5 The impact of age 22
6 Women’s ideas for improving the information available 27
7 Conclusions and recommendations 30
Annex 1: Detailed tabulations 32
Annex 2: The questionnaire 37
Annex 3 Members of the RCOG Women’s Network (June 2015) 45
Annex 4 References 46

The Health Information Needs of Older Women in the UK
September 2015 Page 2
Glossary
RCOG
The Royal College of Obstetricians and Gynaecologists (RCOG) works to improve health care for women everywhere, by setting standards for clinical practice, providing doctors with training and lifelong learning, and advocating for women’s health care worldwide.
Founded in 1929, the RCOG has over 12,500 members worldwide and works with a range of partners both in the UK and globally to improve the standard of care delivered to women, encourage the study of obstetrics and gynaecology (O&G), and advance the science and practice of O&G.
RCOG Women’s Network
The purpose of the RCOG Women’s Network (WN) is to provide lay input to the College so that the RCOG receives an impartial patient and public perspective on whatever is under discussion, consideration or development.
The WN also proactively raises to the RCOG issues of concern and interest to women with respect to O&G.
To illustrate this purpose, the WN’s objectives include the following:
• Act as a critical friend of the College, providing a patient/public perspective to support the work and strategy of the College
• Identify and bring the views, interests and concerns of patients and the public on any matter relating to the practice or study of O&G with a view to informing and developing College policy, topics under debate and statements
• Work with the College to find solutions and strategies to improve women’s health and the quality of O&G services
There are 14 lay members, 2 clinical members plus an O&G trainee member. Ex-‐officio members include the Vice President Strategic Development, the Executive Director Quality and Knowledge and the PEPE Facilitator.
The members of the WN are listed in Annex 3.
Organisations which supported the survey
Women’s Health Concern
Women’s Health Concern (WHC), which is the patient arm of the British Menopause Society, provides an independent service to advise, reassure and educate women of all ages about their health, wellbeing and lifestyle concerns, to enable them to work in partnership with their own medical practitioners and health advisers. It offers unbiased information by telephone, by email, in print, online and through conferences, seminars and symposia.
The Health Information Needs of Older Women in the UK
September 2015 Page 3
The Eve Appeal
The Eve Appeal is a registered charity, formed in 2002. Its purpose is to raise money to fund the world-‐class research programme at the Department of Women’s Cancer based at University College London (UCL). The Department’s vital and much-‐needed research benefits women in the UK and worldwide.
Wellbeing of Women
Wellbeing of Women is a charity dedicated to improving the health of women and babies across the UK. Every year it invests in special research projects and allocates funds towards the training of specialist doctors and midwives. Established in 1964, it has enabled major breakthroughs in obstetrics and gynaecology.
National Osteoporosis Society
The National Osteoporosis Society is the only UK-‐wide charity dedicated to improving the diagnosis, prevention and treatment of osteoporosis and fragility fractures. The charity was established in 1986 and has since grown into a national charity with approximately 25,000 members and over 50 members of staff.
Menopause Matters
Menopausematters.co.uk is an independent website providing up-‐to-‐date, accurate information about the menopause, menopausal symptoms and treatment options.
Acknowledgement
The WN would like to express their appreciation for the help and advice they have received in designing the survey and producing the report from Mr Edward Morris, consultant obstetrician and gynaecologist, Norfolk & Norwich University Hospital NHS Trust.

The Health Information Needs of Older Women in the UK
September 2015 Page 4
Executive summary
Introduction
This report describes a survey conducted by the Women’s Network (WN) of the RCOG in June/July 2015. The WN wanted to contribute to the challenge of how the growing population of women who are approaching, experiencing or who are post-‐reproductive age can be supported and enabled to access information and services.
The survey was designed around seven conditions which were identified as being the most relevant to women of post-‐reproductive age: menopause, osteoporosis, prolapse of the womb, incontinence, depression and mood change, problems with sexual relations, and gynaecological cancer.
The survey was posted on the RCOG website and those of the following organisations: Women’s Health Concern, The Eve Appeal, Wellbeing of Women, National Osteoporosis Society and Menopause Matters. It was also promoted through the social media channels of the above organisations.
The survey received 2109 responses. Younger women were over-‐represented and women over 60 were under-‐represented. The respondents were predominantly of White British ethnicity and from England, rather than other parts of the UK.
Key findings
Almost three-‐quarters thought the seven conditions were the most important ones affecting older women. The most frequently suggested additions were breast cancer and arthritis.
The two conditions of greatest current concern were the menopause (58%) and depression and mood change (45%). Arthritis was the additional condition most often mentioned as a current concern.
Around three-‐quarters had been to see their GP or Practice Nurse regarding a condition they were concerned about. The highest proportion was for women who were concerned about gynaecological cancer followed by prolapse of the womb, osteoporosis, depression and mood change and menopause. Women were least likely to go to their GP about incontinence or problems with sexual relations. The key reasons women gave for not going to see their GP were that they were not suffering symptoms, they were managing themselves or they were too embarrassed.
The level of knowledge about the seven conditions was quite low. A third or less said they knew a lot about the symptoms of each of the conditions and no more than 20% felt they knew a lot about the treatment options for any of them. Women who were concerned about a condition were more likely to say they knew more, but this added only about 10% to these figures.
Women were most likely to identify their GP (87%), Google (70%) or friends and family (53%) as their preferred specific sources of advice and information. When asked to rank more generic sources, the GP again was most likely to be top ranked, followed this time by website pages and online symptom checkers.

The Health Information Needs of Older Women in the UK
September 2015 Page 5
Looking at differences in age groups, menopause was the dominant issue for women aged between 45 and 59, peaking in the 50–54 age group; depression and mood change was the largest issue for women aged under 45; concern about osteoporosis increased steadily with age; there was also an age-‐related trend regarding concerns about incontinence; problems with sexual relations peaked in the 55–59 age group and then declined; there was no age-‐related pattern of concern about prolapse and gynaecological cancer.
The proportion of women who have seen their GP about a condition is generally higher in each succeeding age group. There is a clear general trend for the proportion of each age band who say they know a lot about the symptoms and treatments of different conditions to rise with increasing age. Given that our sample has an over-‐representation of younger women, it follows that the figures for knowledge of symptoms and treatment options reported above must be over-‐estimates.
Finally, women were asked for their ideas about how the provision of information could be improved. The responses covered a wide range of suggestions. The main themes were a plea for more reliable, up-‐to-‐date information being made accessible and available to women and to their employers. There were also suggestions about well-‐woman clinics, making women’s health issues less of a taboo subject and automatic check-‐ups at specific ages.
Conclusions
Consistent with the low level of knowledge about the symptoms and treatment options for the main conditions, there was a high proportion of respondents requesting reliable, up-‐to-‐date, consistent information. We conclude that more could be done to meet this need.
Given that the GP was the most popular source of information, followed by online channels, it seems clear that improved information should be delivered via GPs or online. A next step could be to share the survey results with the RCGP, in order to start the conversation about how GPs prefer to give information to women and how that process could be helped.
Although the sample was not wholly representative, the people who filled in this survey were more likely to be technologically competent and familiar with using the internet. This suggests that this survey underestimates the challenge of ensuring that women are well informed.
Given that our respondents are looking for a trustworthy, up-‐to-‐date source of information on women’s health conditions, there is a real opportunity for the RCOG to fill that need, particularly for those conditions that women did not go to their GP about. The preferences for online information/online symptom checkers, as opposed to downloadable leaflets, should feed into a broader discussion about how the College produces patient information and in what format. To support the College fulfilling its aim of being an advocate for women’s health, it could consider providing information about osteoporosis, depression and mood change, sexual relations and breast cancer, which were found to be important health conditions for our respondents but that are not currently addressed by the RCOG.
Finally, there were many comments that more understanding was needed in the workplace about women’s health issues around the menopause.

The Health Information Needs of Older Women in the UK
September 2015 Page 6
1. Introduction
Background
One of the objectives of the RCOG Strategic Plan is to demonstrate advocacy for women’s health. Within the RCOG, the Women’s Network (WN) has defined an aim to actively promote the College as a provider of health information to support women to better understand their health. Within this broad objective, it was decided by the WN that the health information needs of older women in the UK should be a priority.
In the 2011 census, the Office for National Statistics data1 showed that there were 12.5 million women over 45 years of age in the UK, representing 39% of all women. Additionally, a recent analysis has shown that life expectancy at birth in 2012 in England and Wales was 83.3 years for women.2 This means that a substantial number of women are and will be living an increasing proportion of their lives post-‐menopause.
The RCOG WN wanted to contribute to the challenge of how this large population can be supported and enabled to access information and services and to express their views and opinions about health information of relevance to them. Giving women reliable information about their health conditions enables them to take more responsibility for their own health, which will ultimately lead to a healthier population and bring benefits to the NHS.
Additionally, the NICE guideline on ‘The Management of the Menopause’ will be published in November 2015 and this is expected to increase the demand from women for help and advice.
We defined our target group as ‘older women’. The term ‘older women’ was intended to include all those women approaching, experiencing or beyond the menopause.
Recognising that women enter the menopause at various ages, we did not want to define a firm lower age limit. We saw that this would include a wide age range, potentially from age 45 or earlier to the end of life, and that it therefore could include women with very different needs. We also saw that women in their 40s and 50s might object to being labelled ‘older’, but this seemed the most succinct way to define the group of women who were the focus of our attention.
Our objectives for the overall project were: • To raise awareness of self-‐help and wellness-‐enhancing strategies among older
women • To facilitate provision of relevant materials for older women • To improve the quality of life of older women in coping with the menopause and
thereafter
This project aims to support the provision of information that women need in order to lead healthy lives post-‐menopause. It supports the life-‐course approach to preventative strategies first introduced by RCOG in 2011 (High Quality Women’s Healthcare) and will enable women to take responsibility for their own health and wellbeing. The first stage of this project was to find out what information needs women have and how they want these to be met. This report describes the results of a survey conducted to answer these questions.
The Health Information Needs of Older Women in the UK
September 2015 Page 7
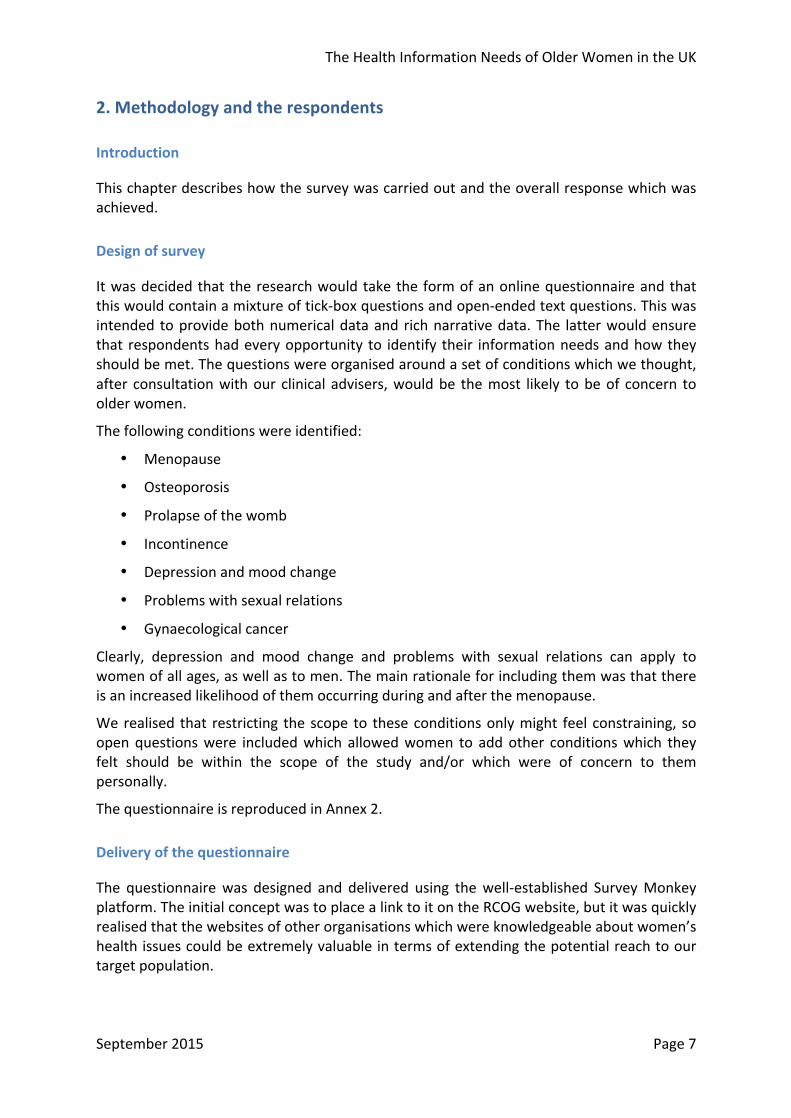
2. Methodology and the respondents
Introduction
This chapter describes how the survey was carried out and the overall response which was achieved.
Design of survey
It was decided that the research would take the form of an online questionnaire and that this would contain a mixture of tick-‐box questions and open-‐ended text questions. This was intended to provide both numerical data and rich narrative data. The latter would ensure that respondents had every opportunity to identify their information needs and how they should be met. The questions were organised around a set of conditions which we thought, after consultation with our clinical advisers, would be the most likely to be of concern to older women.
The following conditions were identified:
• Menopause
• Osteoporosis
• Prolapse of the womb
• Incontinence
• Depression and mood change
• Problems with sexual relations
• Gynaecological cancer
Clearly, depression and mood change and problems with sexual relations can apply to women of all ages, as well as to men. The main rationale for including them was that there is an increased likelihood of them occurring during and after the menopause.
We realised that restricting the scope to these conditions only might feel constraining, so open questions were included which allowed women to add other conditions which they felt should be within the scope of the study and/or which were of concern to them personally.
The questionnaire is reproduced in Annex 2.
Delivery of the questionnaire
The questionnaire was designed and delivered using the well-‐established Survey Monkey platform. The initial concept was to place a link to it on the RCOG website, but it was quickly realised that the websites of other organisations which were knowledgeable about women’s health issues could be extremely valuable in terms of extending the potential reach to our target population.

The Health Information Needs of Older Women in the UK
September 2015 Page 8
Contact was made with the following bodies, who agreed to host a link to the survey. We are grateful for their support.
• Wellbeing of Women
• The Eve Appeal
• Women’s Health Concern
• National Osteoporosis Society
• Menopause Matters
The survey ran for 5 weeks in June and July 2015.
Analysis
The survey data was downloaded from Survey Monkey as an Excel spreadsheet and imported into the IBM’s SPSS Statistics software for analysis. The textual data was analysed in the usual way by developing sets of categories for each question and then coding the individual responses into these categories.
In some of the tables the percentages do not exactly add up to 100% – this is because rounding has been applied to give whole numbers.
Overall response
Altogether 2140 women responded to the survey. 31 of these identified themselves as living outside the UK and as our scope was the needs of women living in the UK, their answers have not been included in the analysis. The effective sample size was therefore 2109.
It was noticeable that many women did not answer every question. Percentages in this report relate to the total number who answered each individual question. This created some problems in the cross-‐tabulations by age group as 267/2109 did not give their age.
Characteristics of respondents
Three questions offered a basic profile of respondents and they can also be used to assess how representative the sample is of women in the UK as a whole.
Age
We look first at age. Table 1 shows the age composition of the sample and, for comparison, of women in the UK in the relevant age groups. The latter data comes from the 2011 Census.3
The sample has about a quarter in the under 45, 45–49 and 50–54 categories, 13% in the 55–59 category, 10% aged between 60 and 69, and 2% who are 70 and over. It is clear from the comparison that women under 55 are over-‐represented and those 60 and over are under-‐represented.

The Health Information Needs of Older Women in the UK
September 2015 Page 9
Age group Sample UK Number % Number %
Under 45* 449 24 2,341,000 14 45 to 49 523 28 2,350,000 14 50 to 54 416 23 2,066,000 13 55 to 59 234 13 1,829,000 11 60 to 70 178 10 3,494,000 21 70 and over** 42 2 4,228,000 26 Not answered 267 Total 2109 100 16,308,000 100
Table 1: Age distribution of respondents and of women in the UK
* This the category used in the survey. The Census data is for women aged 40–44, which seemed the most appropriate comparison.
** This was originally two categories, 70–79 and 80 or over, but as only 5 people identified themselves as 80 or over, the categories have been combined for this report.
This is disappointing and perhaps it is the price to pay for doing an online survey, which older women may be inherently less likely to complete and where it is hard to ensure that a survey reaches only those for whom it is intended.
However, we have done detailed cross-‐tabulations of the tick-‐box questions by age (reported in Chapter 6), which makes it possible to identify the extent to which different age groups hold different views and therefore to compensate for any distortion caused by the sample not being totally representative.
Location
As Table 2 shows, most respondents live in England. The comparison with the Census 2011 data for women aged over 40 shows that women from England are over-‐represented in the sample, while those from Scotland and Northern Ireland are under-‐represented.4 It is not obvious why this should be.
Residence Sample UK Number % Number %
England 1,708 93 13,580,990 83 Wales 87 5 833,794 5 Scotland 34 2 1,454,000 9 Northern Ireland 7 0 439,731 3 Not answered 273 16,308,515 100 Total 2109 100 16,308,515 100
Table 2: Area of residence of respondents and of women in the UK

The Health Information Needs of Older Women in the UK
September 2015 Page 10
Ethnicity
The third question addressed ethnicity. It is clear from Table 3 that the overwhelming majority of respondents were White British.
Ethnicity Number % White British 1702 93 White Irish 30 2 Mixed White and Black Caribbean 4 0 Mixed White and Black African 3 0 Mixed White and Asian 7 0 Asian or Asian British Indian 8 0 Asian or Asian British Pakistani 6 0 Asian or Asian British Bangladeshi 0 0 Asian or Asian British Chinese 2 0 Black or Black British Caribbean 13 1 Black or Black British African 1 0 Other 60 3 Total 1836 100
Table 3: Ethnicity of respondents
Clearly, White British respondents are over-‐represented. The results of the 2010 census showed that the population of the UK was 86% white ethnic groups.5 However, if it was a problem to get many non-‐White British respondents to complete this survey, there will probably be at least as much difficulty in getting them to access information which the RCOG and other bodies may provide.

The Health Information Needs of Older Women in the UK
September 2015 Page 11
3. Health conditions and knowledge about them
The common health conditions facing older women
We asked first if women thought there were other important health conditions than the ones we had identified. The answers are shown in Table 4. Almost three-‐quarters thought this list was sufficient, while just over a quarter thought there were other additional conditions.
Are there other important health conditions?
Number %
No 1463 73 Yes 558 27 Not answered 117 Total 2109 100
Table 4: Are there other important health conditions?
Those who thought there were other conditions were asked to identify them. 433 women responded and altogether they made 574 suggestions. These were categorised into 103 potentially additional conditions.
Table 5 categorises these suggestions. 37 (36%) conditions were only mentioned once. Clearly, breast cancer is by far the most commonly mentioned (90 mentions), followed by arthritis (69 mentions).
Other health conditions which were suggested Number % of all suggestions
Breast cancer 90 16 Arthritis 69 12 Heart disease/blood pressure 37 6 Joint pain/issues 34 6 Alzheimer’s/dementia 33 6 Endometriosis 32 6 Thyroid conditions 31 5 Weight issues 29 5 Cancer – other forms 28 5 Fatigue 22 4 Memory loss 19 3 Other suggestions 150 26 Total 574 100
Table 5: Other health conditions which were suggested
Breast cancer is in fact the only condition on this list that falls even partly within the scope of this project, as it is almost exclusively confined to women and affects women of all ages. The other conditions, apart from endometriosis, are not peculiar to women or linked to the menopause.
The Health Information Needs of Older Women in the UK
September 2015 Page 12
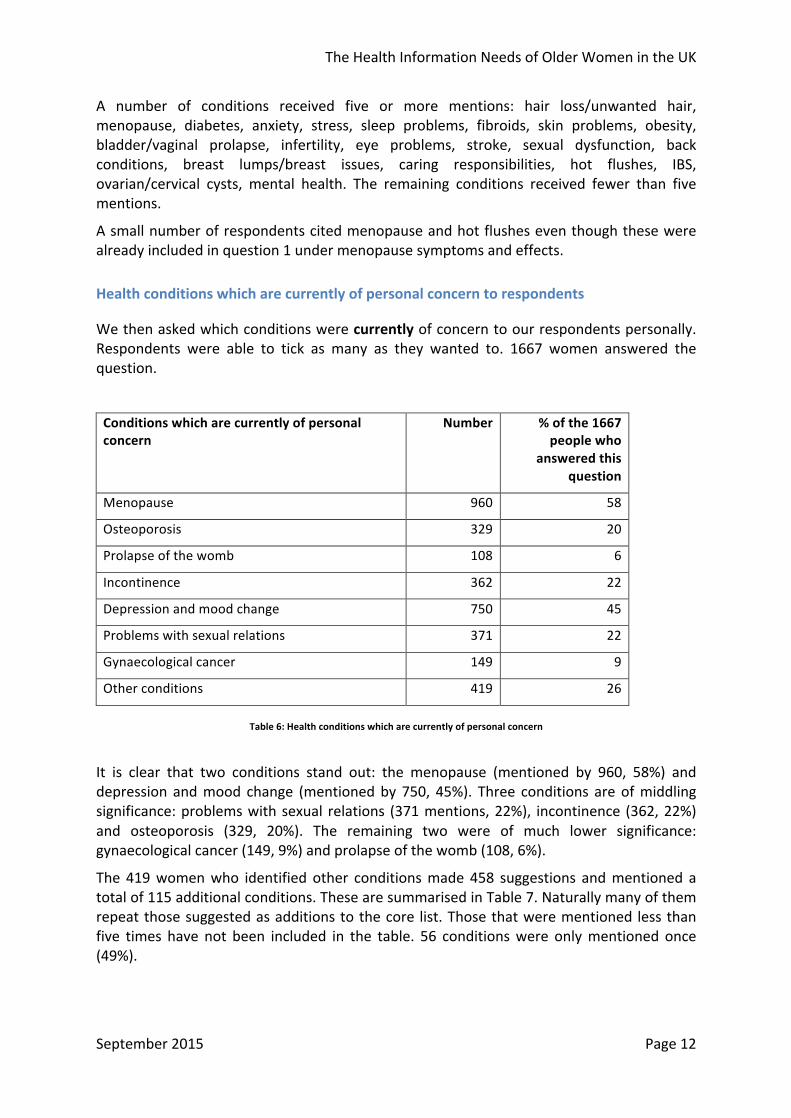
A number of conditions received five or more mentions: hair loss/unwanted hair, menopause, diabetes, anxiety, stress, sleep problems, fibroids, skin problems, obesity, bladder/vaginal prolapse, infertility, eye problems, stroke, sexual dysfunction, back conditions, breast lumps/breast issues, caring responsibilities, hot flushes, IBS, ovarian/cervical cysts, mental health. The remaining conditions received fewer than five mentions.
A small number of respondents cited menopause and hot flushes even though these were already included in question 1 under menopause symptoms and effects.
Health conditions which are currently of personal concern to respondents
We then asked which conditions were currently of concern to our respondents personally. Respondents were able to tick as many as they wanted to. 1667 women answered the question.
Conditions which are currently of personal concern
Number % of the 1667 people who
answered this question
Menopause 960 58
Osteoporosis 329 20
Prolapse of the womb 108 6
Incontinence 362 22
Depression and mood change 750 45
Problems with sexual relations 371 22
Gynaecological cancer 149 9
Other conditions 419 26
Table 6: Health conditions which are currently of personal concern
It is clear that two conditions stand out: the menopause (mentioned by 960, 58%) and depression and mood change (mentioned by 750, 45%). Three conditions are of middling significance: problems with sexual relations (371 mentions, 22%), incontinence (362, 22%) and osteoporosis (329, 20%). The remaining two were of much lower significance: gynaecological cancer (149, 9%) and prolapse of the womb (108, 6%).
The 419 women who identified other conditions made 458 suggestions and mentioned a total of 115 additional conditions. These are summarised in Table 7. Naturally many of them repeat those suggested as additions to the core list. Those that were mentioned less than five times have not been included in the table. 56 conditions were only mentioned once (49%).

The Health Information Needs of Older Women in the UK
September 2015 Page 13
As with question 1, it was noted that a small number of respondents cited ‘menopause’ or ‘stress incontinence’ even though these were already included in question 2 under ‘menopause symptoms and effects’ and ‘incontinence’.
Other health conditions which are currently of personal concern
Number % of all other suggestions
Arthritis 55 12 Thyroid conditions 27 6 Endometriosis 25 5 Breast cancer 24 5 Joint pain/issues 22 5 Fibroids 19 4 Period problems 17 4 Fatigue 16 3 Further suggestions 253 55 Total 458 100
Table 7: Other health conditions which are currently of concern to respondents
Arthritis stands out as the most mentioned condition. The further conditions which were mentioned more than once were: heart disease/blood pressure, weight issues, stress, diabetes, vaginal atrophy/dryness, cancer – other forms, back conditions, anxiety, fibromyalgia, memory loss, sleep problems, PCOS, urinary tract infection, menopause, gastrointestinal issues, migraine, Alzheimer’s/dementia, hair loss/unwanted hair, fitness level, stress incontinence.
Had women gone to their GP or Practice Nurse?
We asked whether women had been to their GP or Practice Nurse about the conditions that were of concern to them. Table 8 presents the number who had for each condition and the percentage of those who said they were concerned about each condition.
As might be expected, gynaecological cancer tops the list: 96% had been to their GP or Practice Nurse. Four other conditions have rates of around three-‐quarters: prolapse of the womb (81%), osteoporosis (77%), depression and mood change (74%), and menopause (73%).
In the case of two conditions, however, the proportion who went to their GP or Practice Nurse was much lower: incontinence (49%) and problems with sexual relations (just 30%).

The Health Information Needs of Older Women in the UK
September 2015 Page 14
If these conditions are of concern to you personally, have you been to your GP or Practice Nurse?
Number answering Yes
% of the women who were concerned about
each condition
Menopause 703 73
Osteoporosis 254 77
Prolapse of the womb 87 81
Incontinence 177 49
Depression and mood change 562 74
Problems with sexual relations 112 30
Gynaecological cancer 155 96
Other conditions 377
Table 8: Extent to which women had been to GP or Practice Nurse about conditions which concerned them
Why did women not go to their GP or Practice Nurse?
There were 754 responses to this question, some people giving more than one reason. 93 have been subtracted because they were invalid (e.g. they did have an appointment booked at their GP or were too young to be experiencing these conditions). The main themes are summarised in Table 9. They are then described in more detail and illustrated with examples of what women said (direct quotations are in italics).
Reasons for not going to the GP/Practice Nurse Number % of all reasons
Can manage on my own/can cope/seeing someone else
189 25
Not necessary/not appropriate/not suffering 166 22
Embarrassment/too personal 70 9
Just an age thing/put up with it 66 9
GPs could not help/there is nothing they can do/nothing can be done
57 8
Not treated seriously 31 4
Don’t want treatment/HRT/drugs 32 4
Don’t want to waste doctor’s time 30 4
Don’t want to face it/fear 14 2
Can’t get an appointment 11 1
Other reason 79 11
Total 745 100
Table 9: Reasons for not going to the GP or Practice Nurse
The Health Information Needs of Older Women in the UK
September 2015 Page 15
Can manage on my own/can cope/seeing someone else (25%)
This category included responses referring to the person either managing symptoms on their own or seeing someone else, e.g. chiropractor or a consultant. In terms of women taking responsibility for their own health, this could be regarded as a good outcome.
I have managed the issues myself; being seen privately; I can mostly sort myself out.
Not necessary/not appropriate/not suffering (22% of reasons)
This covered answers which said that there wasn’t any need for them to go to the GP because they weren’t experiencing any symptoms or they were too minor or trivial.
appear to have been ok through the menopause; I do not have any symptoms; I have not experienced any of the conditions; not been an issue.
Embarrassment/too personal (9%)
This category included all the responses which referred to either embarrassment or the issue being too personal to discuss with the GP.
because I’m embarrassed and don’t really want to acknowledge I have problems; because I don’t want to discuss sexual issues; feel embarrassed discussing this with a doctor, male or female.
Just an age thing/put up with it (9%)
This category referred to respondents saying that they were putting up with it and accepting they had problems which happen to women of a certain age and are just tolerated.
this is something that just happens and we have no control over it as we get older; just part of getting older; you’re getting on, it’s to be expected.
GPs could not help/there is nothing they can do/nothing can be done (8%)
This category included all those responses referring to there being no point in going to the GP because they wouldn’t be able to help.
not very much can be done other than medication; not sure what he can do about it; I do not believe doctor can help.
Not treated seriously (4%)
This category referred to those responses where women said they would not be taken seriously by the GP or they would be dismissed.
I don’t feel confident that this will be taken seriously; GP not interested; especially when it’s a male doctor being told it’s my age.
Don’t want treatment/HRT/drugs (4%)
This category included those who said that they didn’t want drugs, medication or specifically HRT.
don’t want to be given just pills; I didn’t want medication so I didn’t want to talk to my doctor.
The Health Information Needs of Older Women in the UK
September 2015 Page 16
Don’t want to waste doctor’s time (4%)
This category referred to answers which referred to wasting their GP’s time either because they thought the GPs were overworked or their conditions were too trivial.
don’t want to waste doctor’s time with discussion issues; I feel that I would be wasting GP time by discussing conditions; believe the conditions to be personal problems rather than medical and don’t want to waste the doctor’s time.
Don’t want to face it/fear (2%)
These responses all described the woman not wanting to face an issue or being fearful of what might be the outcome of seeing the GP.
I think I don’t really want to accept it; actually I’m burying my head in the sand; fear of hearing the bad news; fear of stigma and mental health label.
Can’t get an appointment (1%)
This category is self-‐explanatory.
very, very difficult to get appointment with GP; too difficult getting an appointment and getting the time off work; it’s difficult to get a doctor’s appointment for something that’s not an emergency.
Other reasons (11%)
There not enough of any one to make a separate category.
have enough problems to deal with; I have type 2 diabetes so focus is squarely on that; I feel that this would be seen as a weakness.
Current knowledge about these conditions
We asked two questions on knowledge of symptoms and knowledge of treatment options for each of our chosen conditions. The results are shown in Charts 1 and 2. Detailed tabulations are in Annex 1.
The first overall impression is that relatively few women felt knowledgeable about symptoms. For only two of our seven conditions do more than 30% say they know a lot about the symptoms.
Prolapse of the womb and gynaecological cancer are the two conditions which women know least about. More than half say they know nothing about prolapse of the womb.

The Health Information Needs of Older Women in the UK
September 2015 Page 17
Chart 1: Knowledge of symptoms
Knowledge of the treatment options for these conditions is even lower, with no more than 20% saying they know a lot about any of these conditions.
Chart 2: Knowledge of treatment options
We look next at whether being concerned about a condition is associated with a higher level of knowledge.
0 10 20 30 40 50 60 70 80
How much do you feel you know about the symptoms of each of these condi^ons?
A lot
Some
Nothing
0 10 20 30 40 50 60 70
How much do you feel you know about the treatment op^ons for each of these condi^ons?
A lot
Some
Nothing

The Health Information Needs of Older Women in the UK
September 2015 Page 18
Are people who have a concern better informed than women in general?
Chart 4 shows the percentage of all respondents who said they knew a lot about each condition (blue bars) against the percentage of women who said they were concerned about each condition who said they knew a lot (red bars). (More detailed figures are in Annex 1.) It is clear that concerned women are more likely to say they know a lot for every condition. The difference is greatest for more specialised conditions like prolapse and cancer and least for menopause.
Chart 3: Knowledge of symptoms, comparing all women and women who were concerned about each condition
The same pattern can be seen in Chart 4 in relation to knowledge about treatment options, although the percentages are lower: concerned women are more likely to be knowledgeable than women in general.
Chart 4: Knowledge of treatment options, comparing all women and women who were concerned about each condition
0 5 10 15 20 25 30 35 40 45 50
How much do you feel you know about the symptoms of each of these condi^ons?
All women
Concerned women
0 5 10 15 20 25 30 35
How much do you feel you know about the treatment op^ons for each of these condi^ons?
All women
Concerned women

The Health Information Needs of Older Women in the UK
September 2015 Page 19
Key points
Almost three-‐quarters thought the list of seven conditions were the important ones. The most frequently suggested additions were breast cancer and arthritis.
The two conditions of greatest current concern were the menopause (58%) and depression and mood change (45%). Arthritis was the additional condition most often mentioned.
Around three-‐quarters had been to see their GP or Practice Nurse regarding a condition they were concerned about. The highest proportion was for gynaecological cancer (96%). Four other conditions had rates of around three-‐quarters: prolapse of the womb, osteoporosis, depression and mood change, and menopause.
The key reasons for not going to see the GP or Practice Nurse were because they were managing their symptoms by themselves, because they were not experiencing any symptoms, or because they were too embarrassed.
The level of knowledge about the seven conditions was quite low. A third or less said they knew a lot about the symptoms of each of the six conditions and no more than 20% felt they knew a lot about the treatment options for any of them. Women who were concerned about a condition were more likely to say they knew a lot, but this added only about 10% to these figures.
Chapter 5 explores whether or not these findings were consistent across age groups.
The Health Information Needs of Older Women in the UK
September 2015 Page 20
4. Sources of help and information
Actual sources of advice and information
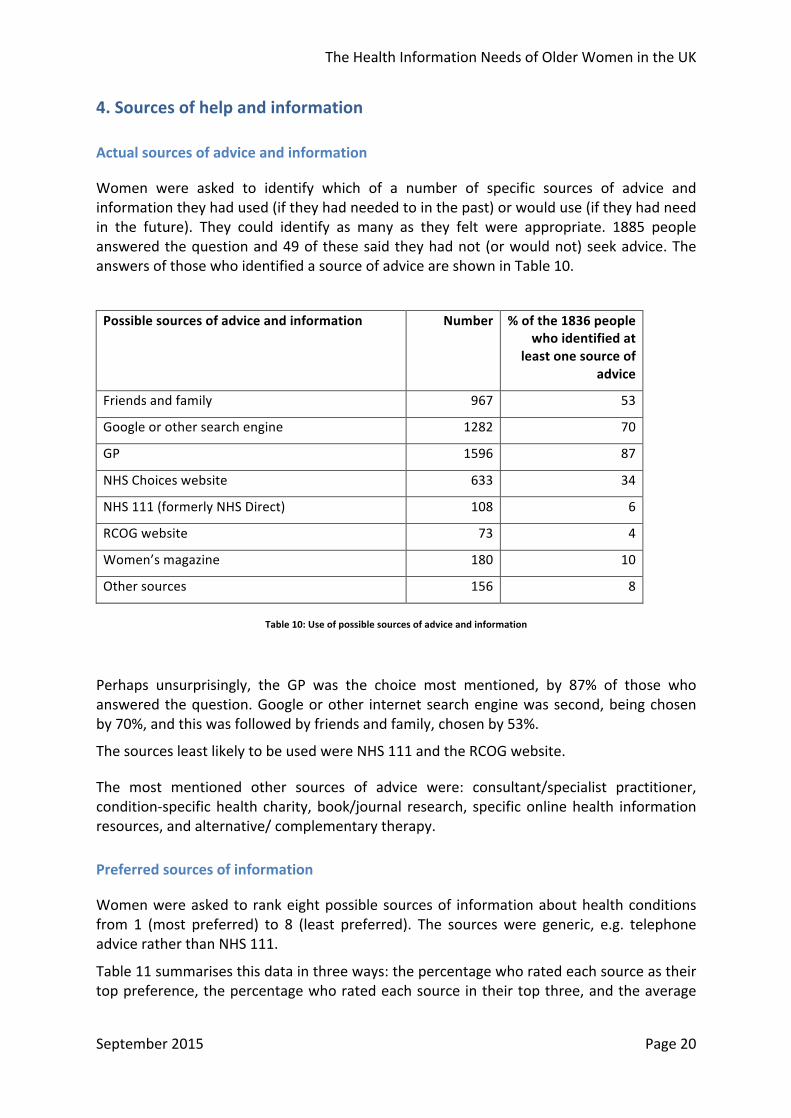
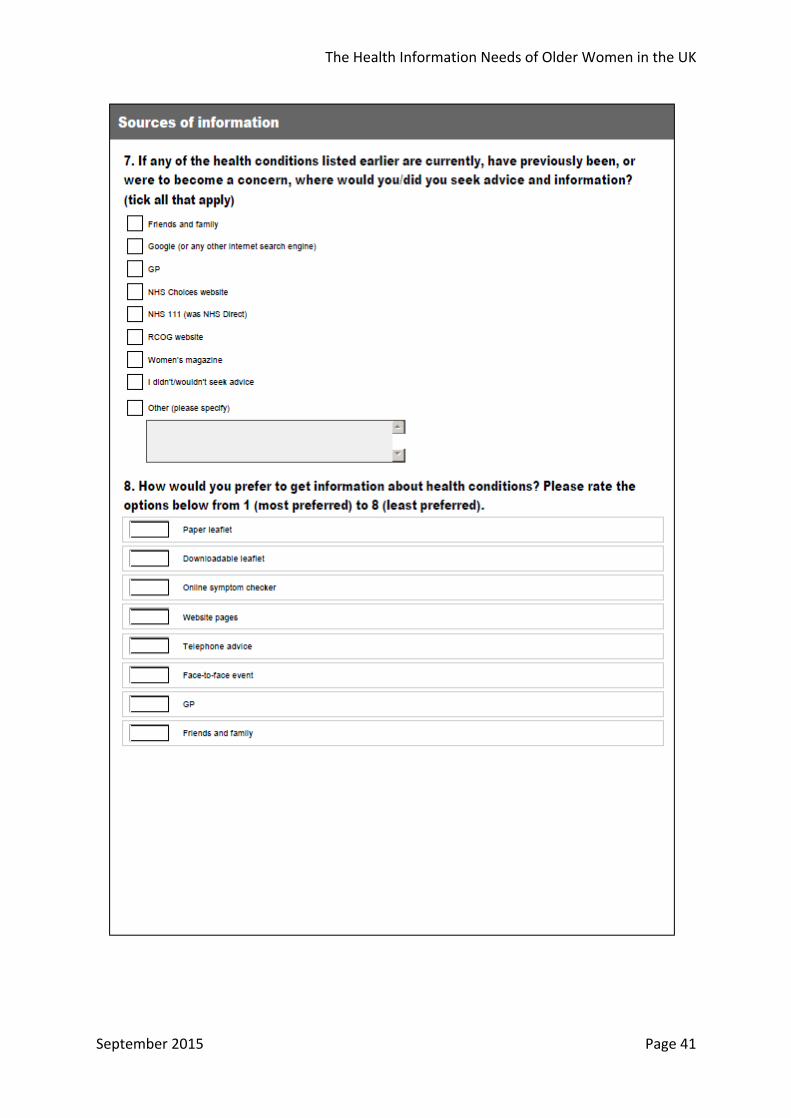
Women were asked to identify which of a number of specific sources of advice and information they had used (if they had needed to in the past) or would use (if they had need in the future). They could identify as many as they felt were appropriate. 1885 people answered the question and 49 of these said they had not (or would not) seek advice. The answers of those who identified a source of advice are shown in Table 10.
Possible sources of advice and information Number % of the 1836 people who identified at
least one source of advice
Friends and family 967 53
Google or other search engine 1282 70
GP 1596 87
NHS Choices website 633 34
NHS 111 (formerly NHS Direct) 108 6
RCOG website 73 4
Women’s magazine 180 10
Other sources 156 8
Table 10: Use of possible sources of advice and information
Perhaps unsurprisingly, the GP was the choice most mentioned, by 87% of those who answered the question. Google or other internet search engine was second, being chosen by 70%, and this was followed by friends and family, chosen by 53%.
The sources least likely to be used were NHS 111 and the RCOG website.
The most mentioned other sources of advice were: consultant/specialist practitioner, condition-‐specific health charity, book/journal research, specific online health information resources, and alternative/ complementary therapy.
Preferred sources of information
Women were asked to rank eight possible sources of information about health conditions from 1 (most preferred) to 8 (least preferred). The sources were generic, e.g. telephone advice rather than NHS 111.
Table 11 summarises this data in three ways: the percentage who rated each source as their top preference, the percentage who rated each source in their top three, and the average

The Health Information Needs of Older Women in the UK
September 2015 Page 21
rating given to each source, bearing in mind that 1 is the best and so the lower the average the more highly preferred a source is.
Possible sources of information Percentage who rated
this #1
Percentage who rated this in their top three
Average rating
(lowest is most
preferred)
GP 43 67 3.38
Online symptom checker 15 46 4.16
Website pages 14 47 4.04
Face-‐to-‐face event 11 37 4.86
Downloadable leaflet 9 39 4.46
Paper leaflet 9 30 4.76
Friends and family 5 24 5.98
Telephone advice 4 22 5.59
Table 11: Preference for possible sources of information
It is clear that whichever indicator is chosen, the GP is the most preferred source of information by a considerable distance. The next two most popular options were online symptom checkers and website pages.
Face-‐to-‐face events, paper leaflets and downloadable leaflets were the next most popular.
It is interesting that telephone advice and friends and family are the two least preferred sources on all three measures. Can one conclude that friends and family are used more in practice because other sources are held to be lacking?
Key points
When asked to identify which of a number of sources of advice and information they had or would use, women were most likely to identify their GP (87%), Google (70%) and friends and family (53%).
When asked to rank more generic sources, the GP again was most likely to be top ranked, followed this time by online symptom checkers and website pages.
Friends and family were rated much less highly as a preferred rather than a current source of information.
Telephone advice/NHS 111 was the lowest ranked in the two questions.
Chapter 5 explores whether or not these findings were consistent across age groups.
The Health Information Needs of Older Women in the UK
September 2015 Page 22
5. The impact of age
Introduction
It seems possible that the health issues affecting women and their information needs might be related to age. Given that the age profile of our sample is not in line with the national picture, it is important to understand to what extent this has distorted the overall findings. This chapter explores the nature of the relationships between age and all the pre-‐coded questions in the survey.
What issues women are concerned about
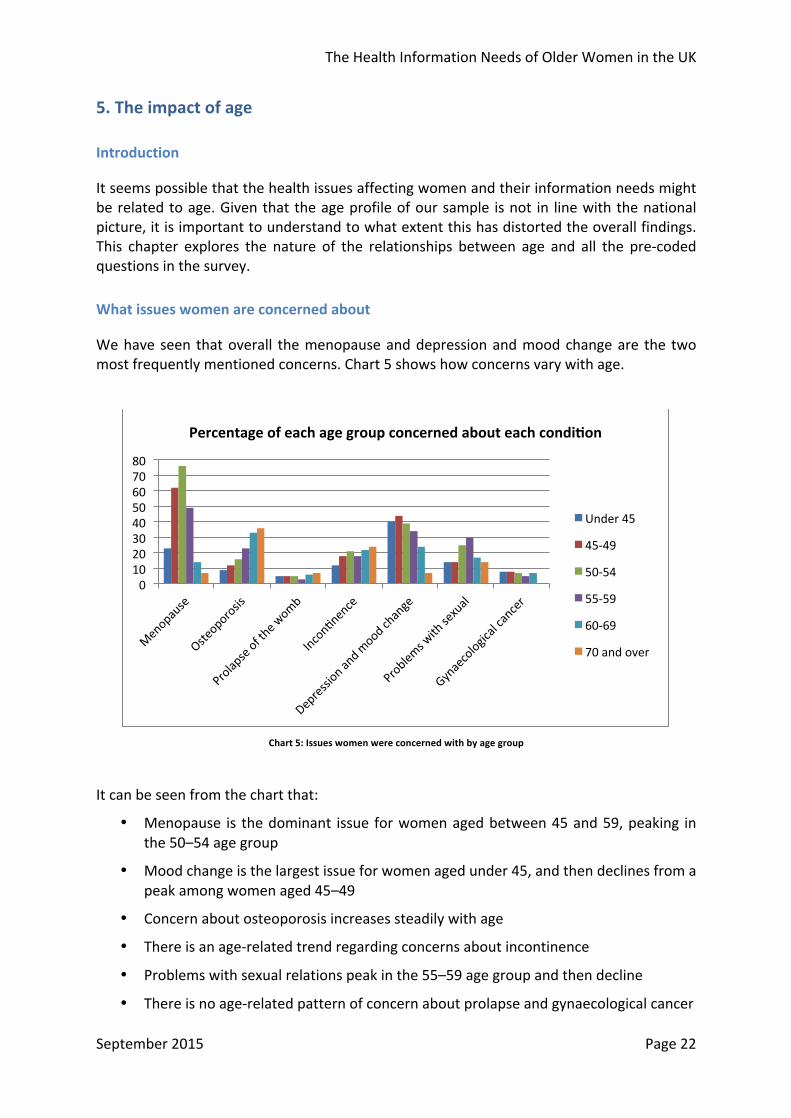
We have seen that overall the menopause and depression and mood change are the two most frequently mentioned concerns. Chart 5 shows how concerns vary with age.
Chart 5: Issues women were concerned with by age group
It can be seen from the chart that:
• Menopause is the dominant issue for women aged between 45 and 59, peaking in the 50–54 age group
• Mood change is the largest issue for women aged under 45, and then declines from a peak among women aged 45–49
• Concern about osteoporosis increases steadily with age
• There is an age-‐related trend regarding concerns about incontinence
• Problems with sexual relations peak in the 55–59 age group and then decline
• There is no age-‐related pattern of concern about prolapse and gynaecological cancer
0 10 20 30 40 50 60 70 80
Percentage of each age group concerned about each condi^on
Under 45
45-‐49
50-‐54
55-‐59
60-‐69
70 and over

The Health Information Needs of Older Women in the UK
September 2015 Page 23
Whether women have seen their GP
Chart 6 shows the proportion of women who are concerned about each condition and who have seen their GP for each separate age group. The proportion who have been to their GP about a condition is generally higher in each succeeding age group. The conditions that women are least likely to go to their GP about across all age groups are incontinence and problems with sexual relations. In the two oldest age groups the proportion several times reaches 100. A higher percentage of women are shown as going to their GP than overall expressed concern about gynaecological cancer and this is probably because many did not record their age.
Chart 6: Proportion of women who had seen their GP about a condition they were concerned about with by age group
Knowledge about symptoms and treatments
The relationship between knowledge about symptoms and age is shown in Chart 7. There is a clear general trend for the proportion of each age band who say they know a lot about the symptoms of different conditions to rise with increasing age. The 70 and over group however report lower knowledge than the 60–69 age group of five of the seven conditions and for other conditions.
0
20
40
60
80
100
120
Percentage of women concerned about each condi^on who had seen their GP by age group
Under 45
45-‐49
50-‐54
55-‐59
60-‐69
70 and over

The Health Information Needs of Older Women in the UK
September 2015 Page 24
Chart 7: Knowledge of symptoms by age group
The same pattern is apparent in relation to levels of knowledge about the treatment options for each condition, shown in Chart 8, although the percentages are consistently lower than for knowledge of symptoms.
Chart 8: Knowledge of treatment options by age group
Given that our sample has an over-‐representation of younger women, it follows that the figures for knowledge of symptoms and treatment options among the whole sample reported in chapter 3 must be over-‐estimates. However, the only instance where more than
0 10 20 30 40 50 60 70
Percentage of each age group who say they know 'a lot' about the symptoms of each condi^on
Under 45
45-‐49
50-‐54
55-‐59
60-‐69
70 and over
0 5 10 15 20 25 30 35 40
Percentage of each age group who say they know 'a lot' about the treatment op^ons available for each condi^on
Under 45
45-‐49
50-‐54
55-‐59
60-‐69
70 and over

The Health Information Needs of Older Women in the UK
September 2015 Page 25
half of any group of women say that they know a lot about a condition is women over 60 in relation to the menopause.
Sources of information
Which sources of information had women used or would they use? Chart 9 presents the data by age group.
Chart 9: Use of sources of information by age group
Generally the picture repeats the overall one: the GP is the most popular source with all age groups, then Google, then friends and family.
There are two points of note:
• The proportion of friends and family declines with age (from 59% to 33%)
• There is a sharp drop in Google use in the over 70s compared with other age groups
The preferred information channels for each age group are shown on the next page. The chart shows the proportion of each age group who identified each of the possible channels as their number one preference. This seemed to be the simplest comparative measure.
0 10 20 30 40 50 60 70 80 90 100
Friends and family
Google (or other internet search engine)
GP NHS Choices website
NHS 111 (was NHS Direct)
RCOG website
Women’s magazine
Percentage of each age group who have used, or would use, different sources of informa^on
Under 45
45-‐49
50-‐54
55-‐59
60-‐69
70 and over

The Health Information Needs of Older Women in the UK
September 2015 Page 26
Chart 10: Preference for sources of information by age group
Chart 10 shows a wide consensus that the GP is by far the preferred first choice. Women over 70 are the most likely to make this their first choice. It can also be seen that the oldest age group are most likely to favour paper leaflets and least likely to nominate website pages as their first choice.
Apart from this, website pages and online symptom checkers are most popular with the younger age groups, and friends and family gradually decreases in popularity as age increases.
Key points
Menopause is the dominant issue for women aged between 45 and 59, peaking in the 50–54 age group; mood change is the largest issue for women aged under 45, and then declines from a peak among women aged 45–49; concern about osteoporosis increases steadily with age; there is an age-‐related trend regarding concerns about incontinence; problems with sexual relations peak in the 55–59 age group and then decline; there is no age-‐related pattern of concern about prolapse and gynaecological cancer.
The proportion of women who have seen their GP about a condition is generally higher in each succeeding age group. The conditions that women are least likely to go to their GP about are incontinence and problems with sexual relations.
There is a clear general trend for the proportion of each age band who say they know a lot about the symptoms and treatments of different conditions to rise with increasing age
The GP is the most popular source of information with all age groups, then Google (although there is a sharp drop in use by the over 70s), then friends and family, which also declines with age. A similar pattern was seen with the ranking of preferred information sources.
0 5 10 15 20 25 30 35 40 45
Percentage of each age group making each informa^on source their first preference
Under 45
45-‐49
50-‐54
55-‐59
60-‐69
70 and over

The Health Information Needs of Older Women in the UK
September 2015 Page 27
6. Women’s ideas for improving the information available
Introduction
The final question in the survey (apart from the personal information ones) was ‘What specific improvements would you like to see regarding information about health issues for older women?’ There were 1248 responders to this question, who supplied 1490 suggestions. 151 of the respondents answered ‘not sure’, ‘no issues’, ‘not applicable’ or ‘don’t know’ so were subtracted from the total, making the total number of answers 1339.
The responses covered a wide range of suggestions, with the plea for more reliable up-‐to-‐date information being made accessible and available to women and their employers as the main theme. It was noted that there was a large number of respondents who referred to working in the police force. The headings are shown in the table below and then explained and illustrated. Direct quotations are presented in italics.
Ideas for improvement Number % of all suggestions
More information/advice/guidance including validated, reliable up-‐to-‐date website and leaflets being made available
337 25
More understanding by employers/in the work place
181 14
Well woman clinic/specialist staff clinic/walk-‐in clinic
176 13
Treat women’s health issues less like taboo/stigma – raise profile
119 9
Health screening/regular check/invite from GP
116 9
More media coverage (TV, advertising, social media)
84 6
GPs listening/expressing sympathy/not being dismissive
80 6
Discussion groups/forums/face-‐to-‐face meetings with other women
67 5
Better training and knowledge of health workers
42 3
More female doctors 8 1
Other 129 10
Total 1339 100
Table 12: Ideas for improvement

The Health Information Needs of Older Women in the UK
September 2015 Page 28
More information/advice/guidance including validated, reliable up-‐to-‐date website and leaflets being made available (25%)
This category included any suggestion which referred to a need for information either generally or about a specific condition. It includes requests for guidance, advice, being kept informed, leaflets, phone apps and internet.
It is striking that, although there is so much information available on the menopause and conditions linked to women’s health in their post-‐reproductive years, a quarter of the responses are requesting something different/better/more easily available/more trustworthy. What is available isn’t reaching them for whatever reason.
leaflets available at doctors’ surgeries; advice about preventing and managing symptoms; definitive information – it is difficult to sort out the reliable from the unreliable especially online.
More understanding by employers/in the work place (14%)
This category covers suggestions for employers to provide acknowledgement and support for women going through the menopause and associated conditions. It was noted that many of these answers referred to working for the police service.
more sensitivity and knowledge amongst men and women in the workplace; predominantly managers are male and for them to be aware and comfortable speaking about health problems women have; I would like managers to be made more aware of the effects these issues can have on women.
Well-‐woman clinic/specialist staff clinic/walk-‐in clinic (13%)
This category included drop-‐in clinics, clinics where specialists were available to give advice, well-‐woman clinics. This was about there being a facility the woman could decide to use if she wanted, when she wanted. Taken together with the previous category, almost a quarter of the women’s answers are asking for an improved service from their GP clinic specifically addressing their menopause-‐related health needs.
drop–in centre rather than appointment with GP; I’d like to pop in to a nurse who will reassure me; more specialisms within GP practices i.e. specialist nurses and doctors
Treat women’s health issues less like taboo/stigma – raise profile (9%)
This category was about women wanting an improvement in society’s attitude to women’s health issues, especially the menopause, namely more openness and it being treated less as a taboo subject.
for it to be more acceptable in social media to talk about women’s health problems; for the conditions not to be a joke and taken seriously so they can be spoken about without embarrassment; I think it is a taboo subject within the workplace especially and that needs to change.
Health screening/regular check/invite from GP (9%)
This group of responses covered being required or invited by their local surgery to attend for screening/health checks with the GP at certain ages.

The Health Information Needs of Older Women in the UK
September 2015 Page 29
a one-‐to-‐one with your GP at age 50; annual health checks; call-‐up/invite to go for regular checks; targeted campaigns.
More media coverage (6%)
This was about anything to do with raising the profile of women’s health needs/issues through social media, magazines, TV and advertising.
national campaigns advertising website links/editorial content in national publications; more exposure on media and social media about these problems; more publicity and events; more factual and informative documentaries.
GPs listening/expressing sympathy/not being dismissive (6%)
This category covered references to GPs’ perceived negative behaviour, particularly with regard to dismissing symptoms and disregarding their problems.
address medical professionals’ attitude of ‘live with it’; not patronising and stereotyping; more understanding by doctors of the issues; I would like to see GPs being more understanding and helpful.
Discussion groups/forums/face-‐to-‐face meetings with other women (5%)
This category referred to suggestions for women getting together to offer mutual support or to attend an event.
more events for women to be able to discuss with professionals; more community events; more conferences/meetings to get together to discuss; more local group meetings with IT support.
Better training and knowledge of health workers (3%)
This category covered suggestions referring to the expertise of doctors and nurses and how up-‐to-‐date they were.
I would like to be reassured that my GP is mandatorily updated and that there were protocols in place for them to follow; more up-‐to-‐date training and information for GPs.
More female doctors (1%)
This final category, with 1% of the responses, was suggesting more female doctors be available.
Other
Finally, there were 123 responses which were very varied and did not fit in to any of the above categories. Two themes stand out – some referring to their objection to the use of the term ‘older women’, and others who were asking for a more ‘holistic’ approach to medicine and for doctors to consider the whole woman, not just her symptoms.

The Health Information Needs of Older Women in the UK
September 2015 Page 30
7. Conclusions and recommendations
The level of knowledge about the symptoms and treatment options for the main conditions affecting older women was quite low and, consistent with this, there was a high proportion of respondents requesting reliable, up-‐to-‐date, consistent information to be made available. We conclude that more could be done to meet this need.
The GP is the most popular source of information, both for those who have sought advice about their condition and for those who anticipate needing it in the future. Women were least likely to go their GP about incontinence and problems with sexual relations. Those who haven’t spoken to their GP said it was because they are managing on their own or they were too embarrassed. Online channels were next most popular and the survey showed very little desire for information by telephone across all age groups. It seems clear that improved information should be delivered via GPs or online. A next step could be to share the survey results with the RCGP, in order to start the conversation about how GPs prefer to give information to women and how that process could be helped.
Although the sample was not wholly representative, the people who filled in this survey were more likely to be technologically competent and familiar with using the internet. This suggests that this survey underestimates the challenge of ensuring that women are well informed.
For the RCOG, two main points stand out. Firstly, the RCOG website is very low down on the list of sources of advice and information, with only 4% of respondents mentioning it. Given that our respondents are looking for a trustworthy, up-‐to-‐date source of information on women’s health conditions, there is a real opportunity for the College to raise its profile and to fill that need, particularly for those conditions that women did not go to their GP about.
More specifically, the patient information on the RCOG website could usefully be reviewed. The responses to this survey about preferences for online information/online symptom checkers as opposed to downloadable leaflets, should feed into a broader discussion about how the College produces patient information and in what format.
Secondly, our list of common conditions included osteoporosis, depression and mood change, and sexual relations. Breast cancer was found to be the most important health condition for our respondents that was not on our list. If the College wants to fulfil its aim of being an advocate for women’s health, it could consider whether there is a way of including these conditions in its information offering. Developing a specific page/section in the Patients area of the RCOG website bringing together all relevant information, including website links (from both the RCOG and other organisations), could be a way forward.
The survey found an appreciable variation in the conditions which are of most concern to women in different age groups – this needs to be reflected in any information improvement strategy.
Finally, there were many comments that more understanding was needed in the workplace about women’s health issues around the menopause. Employers would typically have policies concerning pregnancy and IVF but nothing similar for women’s health issues after reproductive age. There may be scope for engagement with organisations such as the Chartered Institute for Personnel and Development, once other recommendations about

The Health Information Needs of Older Women in the UK
September 2015 Page 31
the creation and collation of health information have been acted upon, to explore ways of raising awareness among employers.

The Health Information Needs of Older Women in the UK
September 2015 Page 32
Annex 1: Detailed tabulations
Knowledge of symptoms and treatment options
How much do you feel you know about the symptoms of each of these conditions?
A lot Some Nothing Total
No. % No. % No. % No. %
Menopause 608 33 1161 62 93 5 1862 100
Osteoporosis 259 15 1140 65 355 20 1754 100
Prolapse of the womb 135 8 631 37 956 56 1722 100
Incontinence 238 14 1172 67 329 19 1739 100
Depression and mood change 538 30 1143 63 123 7 1804 100
Problems with sexual relations 171 10 1172 67 401 23 1744 100
Gynaecological cancer 164 10 990 58 566 33 1720 100
Other conditions 251 27 333 36 336 37 920 100
How much do you feel you know about the treatment options for each of these conditions?
A lot Some Nothing Total
No. % No. % No. % No. %
Menopause 327 17 1228 65 323 17 1878 100
Osteoporosis 157 9 834 47 790 44 1781 100
Prolapse of the womb 89 5 522 30 1130 65 1741 100
Incontinence 112 6 824 47 827 47 1763 100
Depression and mood change 346 19 1155 63 319 18 1820 100
Problems with sexual relations 81 5 848 48 833 47 1762 100
Gynaecological cancer 119 7 874 50 747 43 1740 100
Other conditions 191 20 347 37 409 43 947 100

The Health Information Needs of Older Women in the UK
September 2015 Page 33
Knowledge of symptoms and treatment options (women who are concerned about each condition)
How much do you feel you know about the symptoms of each of these conditions? (Only women who are concerned about each condition.)
A lot Some Nothing Total
No. % No. % No. % No. %
Menopause 343 38 552 61 17 2 912 100
Osteoporosis 117 38 175 57 16 5 308 100
Prolapse of the womb 32 34 43 46 18 19 93 100
Incontinence 97 29 217 65 20 6 334 100
Depression and mood change 317 45 366 52 17 2 700 100
Problems with sexual relations 65 19 232 68 45 13 342 100
Gynaecological cancer 43 32 76 57 14 11 133 100
How much do you feel you know about the treatment options for each of these conditions? (Only women who are concerned about each condition.)
A lot Some Nothing Total
No. % No. % No. % No. %
Menopause 199 22 611 67 108 12 918 100
Osteoporosis 85 27 167 54 60 19 312 100
Prolapse of the womb 22 23 45 47 28 29 95 100
Incontinence 47 14 204 61 84 25 335 100
Depression and mood change 204 29 430 61 66 9 700 100
Problems with sexual relations 30 9 195 57 118 34 343 100
Gynaecological cancer 39 29 73 54 23 17 135 100

The Health Information Needs of Older Women in the UK
September 2015 Page 34
Cross-‐tabulations by age group
Are there other important health conditions? (%)
Age group Whole sample Under
45 45–49 50–54 55–59 60–69 70 and
over No 76 75 72 66 61 72 73 Yes 24 25 28 34 39 28 27 Total % 100 100 100 100 100 100 100 Total respondents 433 499 396 217 168 36 2109
Health conditions currently of personal concern (%)
Age group Whole sample Under
45 45–49 50–54 55–59 60–69 70 and
over Menopause 23 62 76 49 14 7 58
Osteoporosis 9 12 16 23 33 36 20
Prolapse of the womb 5 5 5 3 6 7 6
Incontinence 12 18 21 18 22 24 22
Depression and mood change 40 44 39 34 24 7 45
Problems with sexual relations 14 14 25 30 17 14 22
Gynaecological cancer 8 8 7 5 7 0 9
Total respondents 449 523 416 234 178 42 1667
Women concerned about each condition who had seen their GP or Practice Nurse (%)
Age group Whole sample Under
45 45–49 50–54 55–59 60–69 70 and
over Menopause 50 66 76 99 100 100 73
Osteoporosis 59 75 63 87 100 100 77
Prolapse of the womb 78 88 85 100 100 100 81
Incontinence 58 53 41 54 49 70 49
Depression and mood change 79 73 78 80 77 67 74
Problems with sexual relations 38 17 30 34 40 67 30
Gynaecological cancer 75 100 100 100 100 100 96

The Health Information Needs of Older Women in the UK
September 2015 Page 35
How much do you feel you know about the symptoms of each of these conditions? (% answering ‘A lot’)
Age group Whole sample Under
45 45–49 50–54 55–59 60–69 70 and
over
Menopause 13 24 41 48 62 61 33
Osteoporosis 6 8 14 26 36 45 15
Prolapse of the womb 4 5 7 11 19 21 8
Incontinence 10 9 13 19 26 24 14
Depression and mood change 32 27 30 32 34 14 30
Problems with sexual relations 7 5 11 15 20 14 10
Gynaecological cancer 6 7 11 10 20 9 10
Other conditions 19 28 25 37 45 10 27
How much do you feel you know about the treatment options for each of these conditions? (% answering ‘A lot’)
Age group Whole sample Under
45 45–49 50–54 55–59 60–69 70 and
over
Menopause 6 11 23 26 36 30 17
Osteoporosis 2 5 6 16 25 35 9
Prolapse of the womb 2 3 4 8 13 19 5
Incontinence 4 4 6 11 12 13 6
Depression and mood change 19 16 21 20 25 6 19
Problems with sexual relations 2 3 5 7 12 6 5
Gynaecological cancer 3 5 7 8 17 3 7
Other conditions 13 19 19 29 33 9 20
Proportion of women who have or would use each information source (%)
Age group Whole sample Under
45 45–49 50–54 55–59 60–69 70 and
over Family and friends 59 56 51 47 37 33 53
Google (or other internet search engine) 66 71 72 67 67 43 70
GP 84 85 84 88 88 90 87
NHS Choices website 32 33 35 37 37 33 34
NHS 111 (was NHS Direct) 6 5 5 5 8 0 6
RCOG website 1 3 6 6 5 7 4
Women’s magazine 6 10 12 12 10 12 10

The Health Information Needs of Older Women in the UK
September 2015 Page 36
Proportion of women rated this their number 1 choice (%)
Age group Whole sample Under
45 45–49 50–54 55–59 60–69 70 and
over Paper leaflet 6 7 7 9 8 17 9 Downloadable leaflet 6 7 7 9 8 7 9 Online symptom checker 15 14 11 10 11 7 15 Website pages 14 10 13 13 10 2 14 Telephone advice 3 2 4 3 6 0 4 Face-‐to-‐face event 8 11 9 7 11 12 11 GP 38 41 38 41 39 48 43 Friends and family 7 5 5 4 2 2 5

The Health Information Needs of Older Women in the UK
September 2015 Page 37
Annex 2: The questionnaire

The Health Information Needs of Older Women in the UK
September 2015 Page 38

The Health Information Needs of Older Women in the UK
September 2015 Page 39

The Health Information Needs of Older Women in the UK
September 2015 Page 40
The Health Information Needs of Older Women in the UK
September 2015 Page 41

The Health Information Needs of Older Women in the UK
September 2015 Page 42

The Health Information Needs of Older Women in the UK
September 2015 Page 43

The Health Information Needs of Older Women in the UK
September 2015 Page 44

The Health Information Needs of Older Women in the UK
September 2015 Page 45
Annex 3 Members of the RCOG Women’s Network (June 2015)
Cath Broderick
Gerda Loosemore-‐Reppen
Angela Hyde
Lesley Briggs
Leah Morantz
Penny Robson
Rosemary Harris
Julia Buckley
Linda Pepper
Priscilla McGuire
Angelina Namiba
Sajda Shah
Katy Tuncer
Janet Evans (Clinical)
Alison Wright (Clinical)
Matthew Miles

The Health Information Needs of Older Women in the UK
September 2015 Page 46
Annex 4 References
1 2011 Census: Key Statistics for England and Wales, March 2011 http://www.ons.gov.uk/ons/rel/census/2011 2 Bennett J E, Li G, Foreman K, Best N, Kontis V, Pearson C, Hambly P, Ezzati M. The future of life expectancy and life expectancy inequalities in England and Wales: Bayesian spatiotemporal forecasting. Lancet 2015, Volume 386, No. 9989, pp163–170. 3 http://www.ons.gov.uk/ons/publications/re-‐reference-‐tables.html?edition=tcm%3A77-‐270247 4 http://www.ons.gov.uk/ons/publications/re-‐reference-‐tables.html?edition=tcm%3A77-‐270247 5 2011 Census: Key Statistics for England and Wales, March 2011 http://www.ons.gov.uk/ons/rel/census/2011