health financinggp experience and lessons finding … financinggp experience and lessons finding...
TRANSCRIPT

Health Financing Experience and LessonsHealth Financing Experience and Lessonsg p
Finding Paths to Universal Coverage
g p
Finding Paths to Universal CoverageFinding Paths to Universal CoverageFinding Paths to Universal Coverage
East Asia and Pacific (EAP) RegionEast Asia and Pacific (EAP) Region
J. J. LangenbrunnerLangenbrunner and A. and A. TandonTandon
OutlineOutline
Framework
Establishing the Baseline: Health Outcomes and Current Establishing the Baseline: Health Outcomes and Current Expenditures
Challenges: Changing Demographics & Disease Profile, Inequality and Poor Financial Protectionand Poor Financial Protection
Sources of Revenues
Pooling and Management of Funds
Resource Allocation and Purchasing• Coverage/Targeting, Benefits Package, Contracting, Payment Methods
2 What is Ahead: Fiscal Space and Universal Coverage

Investing in Health and Thinking about HF
Flow of Funds and Functions for Health Financing
Health services
Provision of services
ance
,
atio
n)
Cost sharing/user fees
Th
e po
Purchasing of servicesCoverage
ing
(g
ove
rna
on
of
info
rma
op
ulatio
n
Purchasing of services
Pooling and M anagem entof funds
Coverage
Choice?
Choice?
ip o
f fi
nan
ci
and
pro
visi
o
C ollection of fundsContributions
Entitlement?
Ste
war
dsh
reg
ula
tio
n a
3
Contributions
Source: WHO, 2006.
A Dynamic RegionAnnual Economic Growth Rates in EAP countries: 2004-15
Cambodia
15
Annual economic growth ratesActual: 2004-2009; Projected: 2010-2015
China
Vietnam Lao PDR
10
wth
rat
e (%
)
Indonesia Philippines
Malaysia
Korea
5ual
GD
P g
row
Malaysia
Thailand
-50
Annu
4
-
2003 2005 2007 2009 2011 2013 2015Year
Source: IMF World Economic Outlook

Outcomes Good Relative toOutcomes Good Relative toOutcomes Good Relative to Outcomes Good Relative to Level of Economic DevelopmentLevel of Economic Development
Performace relative to income and health spendinger
age
Infant Mortality, 2009
erag
e
Under-Five Mortality, 2009
Malaysia
Philippines
SingaporeThailand
Chi
KoreaMongolia
VietnamJapan
Bet
ter th
an a
ve
tive
to in
com
e
Mongolia
Malaysia
Philippines
Singapore
ChinaJapan
Korea
VietnamThailand
Bet
ter th
an a
ve
tive
to in
com
e
IndonesiaLao PDR
PhilippinesChina
Cambodia
an a
vera
ge
Per
form
ance
rel
at
IndonesiaLao PDR
PhilippinesChina
Cambodia
an a
vera
ge
Per
form
ance
rel
atWorse than average Better than average
Wor
se th
aP
P f l ti t h lth di
Worse than average Better than average
Wor
se th
aPP f l ti t h lth di
5
Performance relative to health spending Performance relative to health spending
Source: WBI & WHONote: Plots are residuals of regressions of outcome on income and health spending separately
Maternal Mortality and Life Expectancy
Performace relative to income and health spending
erag
e
Life expectancy, 2008
erag
e
Maternal mortality, 2008
p g
Indonesia
M li
PhilippinesChina
CambodiaSingapore
Vietnam
Lao PDRBet
ter th
an a
ve
tive
to in
com
e
Mongolia
MalaysiaPhilippines
China
Japan
Cambodia
Vietnam
ThailandBet
ter th
an a
ve
tive
to in
com
e
MongoliaThailand
Singapore
an a
vera
ge
Per
form
ance
rel
at
Indonesia
MalaysiaSingapore
CambodiaKorea
Lao PDR
han
aver
age
Per
form
ance
rel
at
Worse than average Better than average
Wor
se th
Performance relative to health spending
Worse than average Better than average
Wor
se th
Performance relative to health spending
6
Performance relative to health spending Performance relative to health spending
Source: WBI & WHONote: Plots are residuals of regressions of outcome on income and health spending separately

Not “Big Spenders” g pExpenditures Modest Relative to Income
Governments: Health Not High Priority (in part due to low revenue base)
Health expenditure vs income, 2009
1520
Total
1015
Public
Japan
Vietnam
10
on h
ealth
GD
P (%
) KoreaThailand
China
Japan
Mongolia
VietnamMalaysia
5
on h
ealth
GD
P (%
)
Philippines SingaporeThailand
China
CambodiaKorea
Lao PDR
MongoliaMalaysia5
Exp
endi
ture
sh
are
of G
Indonesia
SingaporeCambodia
Lao PDR
Philippines
Exp
endi
ture
sh
are
of G
Indonesia
100 250 1000 5000 50000 100 250 1000 5000 50000
7
100 250 1000 5000 50000GDP per capita, US$
100 250 1000 5000 50000GDP per capita, US$
Source: WDI & WHO
Revenue Effort Limited
Revenue share of GDP versus GDP per capita
40
50
60
%)
Revenue share of GDP versus GDP per capita
MalaysiaThailand
Indonesia20
30
e sh
are
of G
DP (%
Sri Lanka
Indonesia
Lao PDR
Philippines
ChinaCambodia10
Reve
nue
100 250 1000 10000 25000GDP per capita (current US$)
Sources: WDI; WHONote: x-axis log scaleData are for latest available year 2000-2007

Expenditures Modest by Global ComparatorsExpenditures Modest by Global ComparatorsGDP per Capita and Health Expenditure per Capita, 2005
8,000
9,000
10,000P
P
250
300
350 Health
Ex
5,000
6,000
7,000
er C
apit
a, P
150
200
250
xpen
ditu
re pcu
rrent U
S
1 000
2,000
3,000
4,000
GD
P p
e
50
100
150 per C
apita,
S$
-
1,000
ECA LAC MNA EAP SAR AFR
-
9
GDP per Capita, PPP
Health Expenditure per Capita, Current US$
Better News: Nominal Elasticity of Health SpendingBetter News: Nominal Elasticity of Health Spending (1989-2004)
10Source: World Bank (2008c), using WHO data 1989-2004.

ChallengesChallengesChallengesChallenges
Aging Population and Changing Disease Profile
Equity
Financial Protection
11
Changing Demographic and Disease ProfileChanging Demographic and Disease Profile ST Demographic Dividend; LT Aging and NCDs
AgesAgesAgesAgesAgesAges
2020
75+
70-74
65-69
60-64
FEMALESMALES
Ages
75+
70-74
65-69
60-64
FEMALESMALES
Ages
20202020
75+
70-74
65-69
60-64
FEMALESMALES
Ages
75+
70-74
65-69
60-64
FEMALESMALES
Ages
200075+
70-74
65-69
60-64
FEMALESMALES
Ages
75+
70-74
65-69
60-64
FEMALESMALES
Ages
55-59
50-54
45-49
40-44
55-59
50-54
45-49
40-44
55-59
50-54
45-49
40-44
55-59
50-54
45-49
40-44
55-59
50-54
45-49
40-44
55-59
50-54
45-49
40-44
200035-39
30-34
25-29
20-24
35-39
30-34
25-29
20-24
35-39
30-34
25-29
20-24
35-39
30-34
25-29
20-24
35-39
30-34
25-29
20-24
35-39
30-34
25-29
20-24
15-19
10-14
5-9
0-4
15-19
10-14
5-9
0-4
15-19
10-14
5-9
0-4
15-19
10-14
5-9
0-4
15-19
10-14
5-9
0-4
15-19
10-14
5-9
0-4
12Source: World Bank
100000 80000 60000 40000 20000 0 20000 40000 60000 80000 100000
Source: World Bank
100000 80000 60000 40000 20000 0 20000 40000 60000 80000 100000
Source: World Bank
100000 80000 60000 40000 20000 0 20000 40000 60000 80000 100000

New Epidemic of Chronic DiseasesNew Epidemic of Chronic DiseasesChina
13
s
High…and Rising…Inequality
UnderUnder FiveFiveRatio Between Ratio Between
LowestLowestCountryCountry YearYear
UnderUnder--Five Five MortalityMortality
RateRate
LowestLowestand Highest and Highest Economic Economic QuintilesQuintiles
RuralRural--Urban Urban RatioRatio
CambodiaCambodia2005 106 3.0 1.5
Indonesia2007 51 2.4 1.6
Philippines2008 37 3 4 1 72008 37 3.4 1.7
Vietnam2007 33 3.3 2.2
14
Source: Demographic and Health Surveys

Philippines: Regional Inequities Are PersistentPhilippines: Regional Inequities Are Persistent Despite Economic Growth
Region VIII
ARMM
60
Infant mortality rate by region
Philippines
Region I
Region IIRegion V
Region VI
Region IX
Region XI
Region XII
Region IIRegion VI
Region VIII
40
50
ality
rate
Philippines
NCR
CAR
Region IVRegion VII
Region X Philippines
Philippines
Philippines
CAR
Region I
Region II
Region III
Region IVBg
Region VII
Region XI
R i XII
30
Infa
nt m
ort a
CARRegion III NCRRegion IRegion III
Region IVARegion V
Region IX
Region X
Region XIICARAGA
10
20
1
1993 1998 2003 2008 Year
Source: NDHS
Thailand:Thailand:Variations in Per Capita Expenditure by Province
C t l t h lth b i
00
200
0 Central govt. health exp. p.c. by province
100
0150
Baht
500
0
0 200 400 600 800 1000GDP per capita ('000)
16
Personnel OperationalSubsidies Other
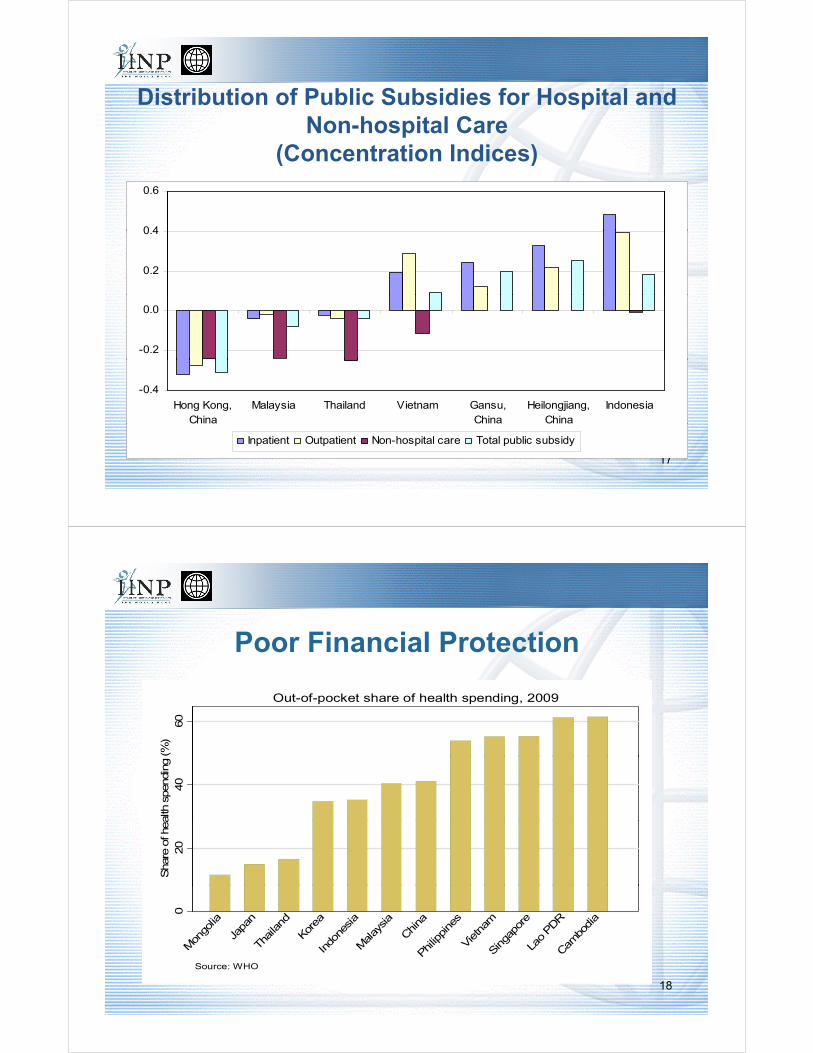
Distribution of Public Subsidies for Hospital andDistribution of Public Subsidies for Hospital and Non-hospital Care
(Concentration Indices)
0 4
0.6
0.2
0.4
-0.2
0.0
-0.4
Hong Kong,China
Malaysia Thailand Vietnam Gansu,China
Heilongjiang,China
Indonesia
17
Inpatient Outpatient Non-hospital care Total public subsidy
Poor Financial Protection
60
(%)
Out-of-pocket share of health spending, 2009
40
alth
spen
ding
20
Shar
e o
f hea
0
Mon
golia
Japa
n
Thailand
Korea
Indo
nesia
Malay
sia
China
Philip
pine
s
Vietnam
Singa
pore
Lao PDR
Cambo
dia
18
In Ph S CSource: WHO

Government Health Spending and OOPs in Asia
Figu
re 4
Government Health Spending and OOPs in Asia (2007)
19
Investing in Health and Thinking about HF
Flow of Funds and Functions for Health Financing
Health services
Provision of services
ance
,
atio
n)
Cost sharing/user fees
Th
e po
Purchasing of servicesCoverage
ing
(g
ove
rna
on
of
info
rma
op
ulatio
n
Purchasing of services
Pooling and M anagem entof funds
Coverage
Choice?
Choice?
ip o
f fi
nan
ci
and
pro
visi
o
C ollection of fundsContributions
Entitlement?
Ste
war
dsh
reg
ula
tio
n a
20
Contributions
Source: WHO, 2006.

Share of Tax and Donor Financing vs Social InsuranceShare of Tax and Donor Financing vs. Social Insurance in Public Spending on Health
080
hea
lth (%
) Social security share of public spending on health, 2009
Mixed
40
60
c sp
end
ing
on
Tax and donor financedPredominantly
20
har
e o
f publ
ic0Sh
Cambo
dia
Kiriba
ti
ua N
ew G
uine
a
Timor
-Les
te
Tong
a
Tuva
lu
Vanua
tu
Samoa
Malay
sia
Mya
nmar
Thailand
Lao PDR
Mar
shall Isla
nds
Indo
nesia
Philip
pine
s
Mon
golia
Vietnam
China
21
Papua M
a
Source: WHO
Use of HI: Less than Other Regions of World
Social Security and General Government Expenditure on Health- LMIC Regional Averages (2005)
ECA35%
40%
He
alt
h
20%
25%
30%
pe
nd
itu
res
on
o
f T
HE
MNA
LCR
10%
15%
20%
Se
cu
rity
Ex
pa
s %
o
EAP
AFR
MNASAR
0%
5%
0% 10% 20% 30% 40% 50% 60% 70%
So
cia
l
22General Government Expenditure on Health (less Social Security) as % THE

But…Formal Employment = Insurance Coveragep y gWill New premiums Hurt Economic Growth and Discourage
Formalization?100
80
100
40
60
20
40
0
bodi
a
nesi
a
Chi
na
pine
s
aila
nd
aysi
a
Rep
.
ew alan
d
tral
ia
apor
e
Kon
g,na ap
an
23
Cam
Indo
C
Phi
lip Th a
Mal
Kor
ea, N
Zea
Aus
Sin
g a
Hon
g K
Chi J
Formal Share of Employment in IndonesiaFormal Share of Employment in Indonesia,1990-2007
100
Formal sector share of employment in Indonesia, 1990-2007
60
80
tage
040
Perc
ent
020
1990 1992 1994 1996 1998 2000 2002 2004 2006 2008
24
YearSource: WB Staff Estimates

WagstaffWagstaffSocial Insurance Transition Evidence in the OECD 1980-2006
25
Comparison of Smokers (%) and Tobacco Tax Rates in theComparison of Smokers (%) and Tobacco Tax Rates in the EAP Region and EU-15
Country/Region Year % of Smokers % of Tobacco Taxesin the Price of Cigarettes
Cambodia 2004 21.7 9
China 2002 31.4 21
Fiji 2002 15.0 —j
Indonesia 2001 28.7 22
Japan 2006 27.0 5
Korea, Republic of 2005 29.1 10
L PDR 2003 35 7 32Lao PDR 2003 35.7 32
Malaysia 2006 21.2 39
Mongolia 2005 24.2 31
PhilippinesPhilippines 20032003 23.623.6 4141ppppSingapore 2004 12.6 69
Sri Lanka 2003 13.6 54
Thailand 2004 21.1 79
Vi 2003 1 32
26
Vietnam 2003 17.5 32
EU 15 average * 24.2 58

Pooling
Big challenge in the region
Multiple pools• China, Indonesia, Lao, Cambodia,
Thailand, Vietnam, Mongolia required , , g
Lowers Spreading of Risks (Equity)
Lowers Leverage of Purchasers (Effi i )
qhousehold
contribution
lowerrisk
higherrisk
before risk pooling (only OOPS)
(Efficiency)
Increases Administrative Costs (Efficiency) required
household after risk contribution
lowerrisk
higherrisk
pooling (one possibility)
27
Decentralization is a Special ChallengeDecentralization is a Special Challengefor Pooling of Funds
Philippines Viet Nam Indonesia China China …..Thailand …..
In most East Asian and Pacific region countries, decentralization done for other reasons outside of health sector
• Results to date not positive for Health sector• Ambiguity about responsibilities• Inequities and variation in efficiencies• Lack of innovation, not more…
• Way forward:• Decentralization at the service delivery level not financing level

Pooling: Model from South Korea:Pooling: Model from South Korea: 380 to 1: Admin Costs as % of Payments
108 8 8 710
12
8 .8 8 .7
7.1 7
6
8
10
4 .4 5 44
6
0 .9 6 0 .7 0 .4
0
2
19 9 4 19 9 7 19 9 8 19 9 9 2 0 0 0 2 0 0 1 2 0 0 2 2 0 0 4 2 0 0 5 2 0 0 6
29
19 9 4 19 9 7 19 9 8 19 9 9 2 0 0 0 2 0 0 1 2 0 0 2 2 0 0 4 2 0 0 5 2 0 0 6
China: Severe Fragmentation of Risk PoolsProvince County
BeijingShang Hai
Guang Zhou
T i W
NCMS(MOH)
34
Province
3229···
Tai Wan
BeijingShang Hai
Province Cities
Citi
Shang HaiGuang Zhou
Tai Wan
···
UEBMI(MHSs)
34
BeijingShang Hai
Guang ZhouURBMI
Province Cities
34··
Tai Wan
Beijing
Province Country
·
BeijingShang Hai
Guang Zhou
Tai Wan
MOCA 343229 + cities
···
30

Strategic Purchasing “Who” Coverage and targeting – how to cover poor households, and the informal sector
• Korea, Japan, Singapore, China Taiwan, Thailand, > 90%• Mongolia < 80%• China > 75%• Indonesia <70%• Viet Nam < 50%Viet Nam 50%
“What” Benefits Package• Great variation across region and within countries• Explicit with SHI programs
Q ti d it id fi i l t ti d it dd th h i b d f di• Question: does it provide financial protection, does it address the changing burden of disease in the country, is it a dynamic instrument used to manage SHI?
“With Whom” Contracting• Every country does it, but “relational” not selectivey y ,• Challenge: bringing in the private sector and creating a level playing field for public and
private sector
“How” Payment rates and incentives for providers• Mostly FFS but reform initiatives in Indonesia Philippines China Vietnam Taiwan• Mostly FFS, but reform initiatives in Indonesia, Philippines, China, Vietnam, Taiwan…• Do payment systems encourage quality, cost-effectiveness, efficiency, consumer
satisfaction?
Looking AheadLooking AheadLooking AheadLooking Ahead
32

The Path to Universal Coverage:The Path to Universal Coverage:…Indonesia, Philippines, Vietnam, China, Cambodia
33
I d D d & E t d I i H lthIncreased Demand & Expected Increases in Health Expenditures from Years 2000-2020
Due to Population and Epidemiologic Dynamicsg y
34

Envelope for Health?Envelope for Health?Fiscal Consolidation and Reductions in Deficits:
General Government Balance and Expenditure, 2010 and 2015
Country General Government Balance(Percent of GDP)
General Government Expenditure
(Percent of GDP)(Percent of GDP)
2010 2015 2010 2015
Chi 2 9% 0 1% 22 3% 21 9%China -2.9% 0.1% 22.3% 21.9%
Indonesia -1.5% -1.4% 17.3% 18.1%
Malaysia -4.6% -4.6% 30.5% 30.4%
Philippines -3.9% -1.9% 18.9% 19.4%
35
ConclusionsConclusions Gains to Date in EAP Impressive – Outcomes are good relative to expenditures
B t E id i l i P fil N Ch i NCD d Ch i Di i i But, Epidemiologic Profile Now Changing…NCDs and more Chronic Diseases requiring more sophisticated medical care and health systems, which will be more costly
System public financing may need to increase and must be sustainable -- Future economic growth generates sufficient levels of revenues for decent living standards andeconomic growth generates sufficient levels of revenues for decent living standards and external debt solvency. Still, choices will need to be made to balance financing essential services and providing financial risk protection.
Most countries in the region are challenged to provide universal coverage, reduce f t ti i k l d i h i ffi i th h b fitfragmentation among risk pools, and improve purchasing efficiency through benefit packages, contracting and new payment systems.
How Fast? The critical condition regarding the speed of evolution to universal coverage is the level of income and its rate of growth (Korea, China, Thailand). ST Fiscal consolidationthe level of income and its rate of growth (Korea, China, Thailand). ST Fiscal consolidation and debt reduction in some countries. Evidence also suggests that administrative capacity is a key enabling factor for success, especially for institutions as Health Insurance Funds.
Context Important: Models need to be tailored to individual country circumstances.
Other Trends to Watch in the Region – Hospital Management Autonomy and Reform, rebalancing of decentralization, growth of medical tourism (Philippines, Thailand, Singapore, Malaysia and Thailand