health-enhanced land use planning tool
TRANSCRIPT
Health-Enhanced Land Use Planning Tool
Monica Campbell, Toronto Public Health
Healthy Canada by Design CLASP Winnipeg, Manitoba
November 21 & 22, 2013
A Health and Environment-Enhanced Land Use Planning Tool
Uses relationships between built environment features and health to estimate the impacts of varying land-use and transportation planning options on:
• levels of physical activity • use of active modes of transportation • use of vehicles • emissions of transportation-related greenhouse gases • body mass index (BMI) for residents
2

Relationships between built environment and health-related factors
Health – related parameter Built environment feature Body mass index (BMI) ……
Walkability
Energy expenditure ……….. Density Walking for exercise/leisure Access to parks and trails Walking/cycling to work/school ………………...
Walkability and cycling facilities
Biking trips to work/school or for exercise/leisure ………..
Residential density and walkability
High blood pressure ……… Monthly frequency of walking and cycling trips
3

How was the tool developed?
• Toronto data used to derive statistical relationships between built environment variables, travel choices and physical activity
• These relationships corrected for demographic factors such as gender and income which also affect physical activity and travel choices
• Results of this analysis were programmed into CommunityViz
4

Testing the tool
5
CommunityViz analysis template was pilot tested on:
• redevelopment proposal for
West Don Lands area in Toronto, ON
• development plan for Surrey Central Station in the City of Surrey, B.C.

Built environment data inputs for model
• Road network Length of roads; bicycle facilities; trails; sidewalk
coverage; intersection density • Schools • Transit • Distance to parks; park area • Food Environment
Farmers markets; restaurants; supermarkets; take-out restaurants; convenience stores
• Residential density • Retail/office floor to land area ratio
6
Results of pilot tests
7
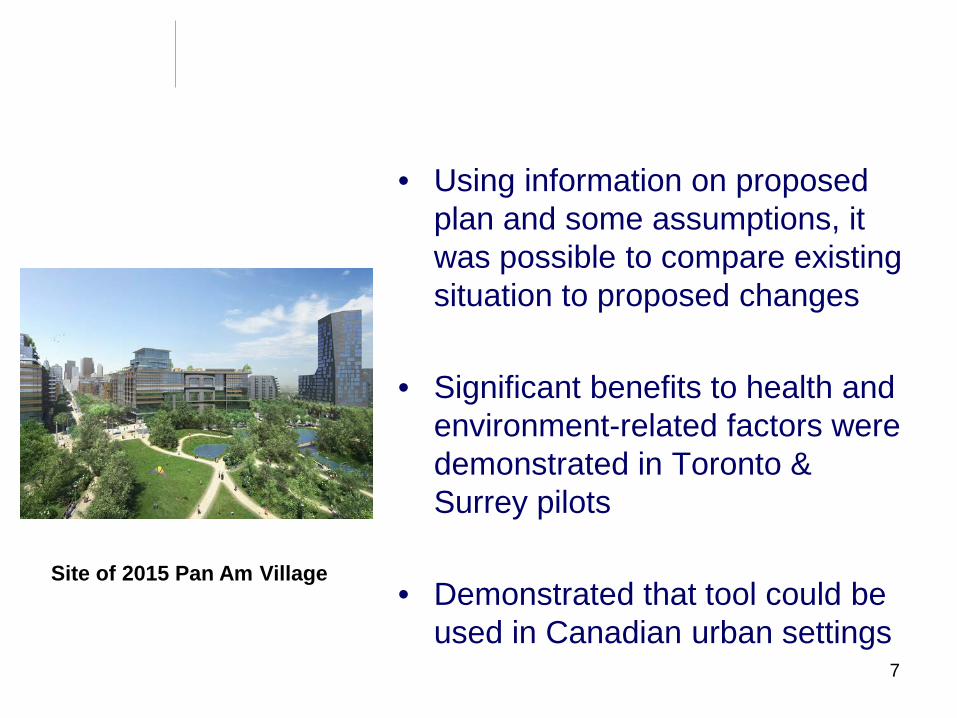
• Using information on proposed plan and some assumptions, it was possible to compare existing situation to proposed changes
• Significant benefits to health and environment-related factors were demonstrated in Toronto & Surrey pilots
• Demonstrated that tool could be used in Canadian urban settings
Site of 2015 Pan Am Village

How the tool was used
8
• Mapping layers were created
• Geo-spatial analyses

Map Layers
Sample Maps • Bike trips to work or school • Household CO2 emissions • Daily energy expenditures • Likelihood of high blood pressure Also serve as useful communication and analytical tools Exploring use in Ward Profiles
9
CO2 Emissions(Kg/Household/Day)
Daily Energy Expenditure (Kcal/Kg/Day/Person)
Walkability Index
10
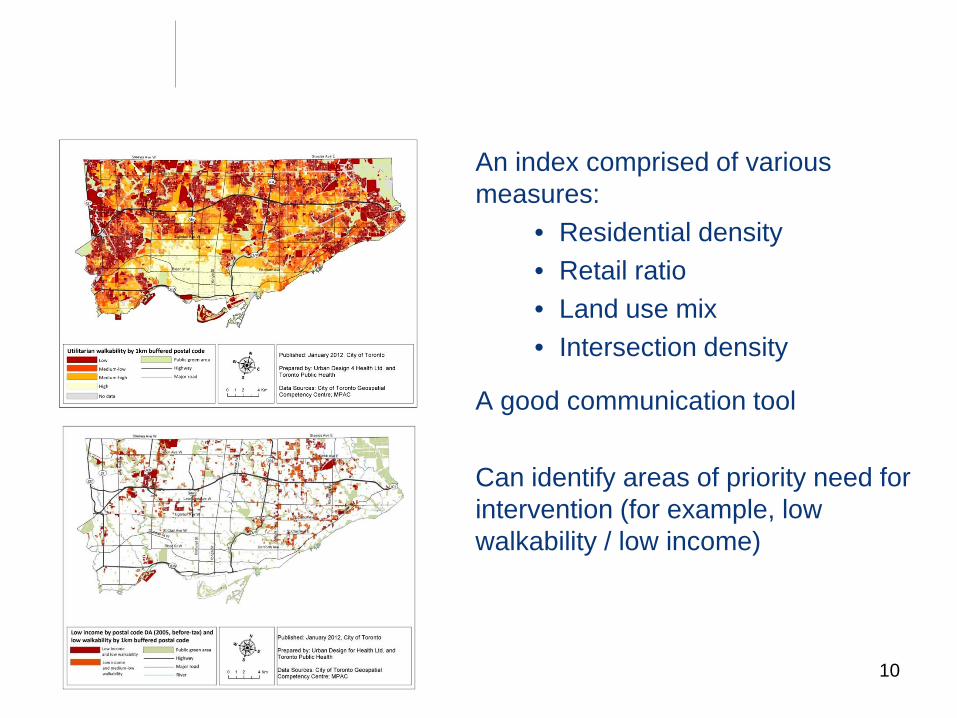
An index comprised of various measures:
• Residential density • Retail ratio • Land use mix • Intersection density
A good communication tool Can identify areas of priority need for
intervention (for example, low walkability / low income)

Residential Preferences Survey
The Walkability Index was used to analyse the responses in the Residential Preferences Survey.
Showed that people living in walkable neighbourhoods: • do more walking • take transit more often • drive less often and less far, and • weigh less on average
than those who live in auto-oriented neighbourhoods.
11
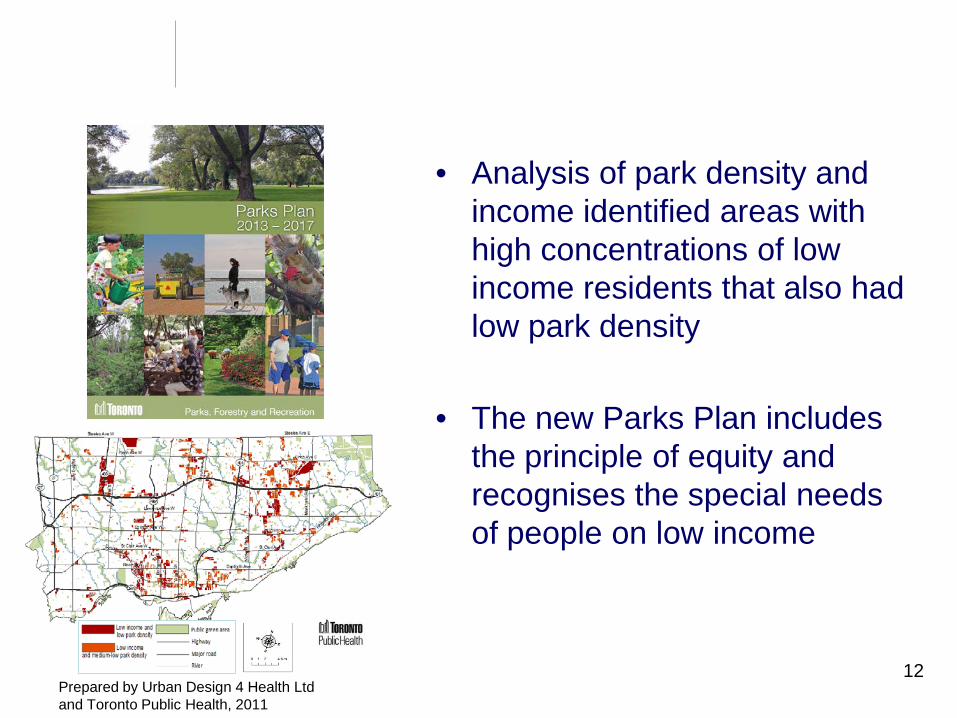
Low Income Areas with Low Park Density
12 Prepared by Urban Design 4 Health Ltd and Toronto Public Health, 2011
• Analysis of park density and income identified areas with high concentrations of low income residents that also had low park density
• The new Parks Plan includes the principle of equity and recognises the special needs of people on low income

Other initiatives
• The Walkability Index is being used as one of the criteria to identify areas for the new zoning category Residential Apartment Commercial (RAC)
• Evaluating the health benefits of the new transit line along Eglinton Avenue
• Exploring if it can be used to support planning proposals where an increase in density is envisaged
13

Observations About HIA Software Tool
14
• Use requires a GIS specialist • Use was delayed due to the need
to acquire a dedicated high-capacity computer
• Tool applicable to large areas (e.g. secondary plans) – Requires making assumptions
on many land-use characteristics since these are not available at that stage
• Buy-in is required from city planning staff

Acknowledgements
Larry Frank Jim Chapman
Kim Perrotta Ronald Macfarlane Cheryl Dow Ned Sabev Carol Mee Marco Belmont Shawn Chirrey Alice Miro Helena Swinkels Sudha Sabanadesan
15
www.toronto.ca/health @TOPublicHealth