health effects from occupational exposure to chemicals
TRANSCRIPT

Health Effects from Occupational Exposure to Chemicals
and/or Using Toxics Use Reduction Planning to Protect Workers
Wednesday April 14, 2010 Elise Pechter MPH, CIH
Massachusetts Department of Public Health, Occupational Health Surveillance Program

IPA in offset printing Prohibited as VOC (400 ppm TWA) Replaced with 2-BE, a glycol ether (NIOSH REL 5ppm)

Energy saving using foam

Massachusetts Department of Public Health, EOHHS
John Auerbach Helping People Lead Healthy Lives In Healthy
Communities We believe in the power of prevention.
We work to help all people reach their full potential for health. We ensure that the people of the Commonwealth receive quality health care and live in a safe and healthy environment. We build partnerships to maximize access to affordable, high quality health care. We are especially dedicated to the health concerns of those most in need. We empower our communities to help themselves. We protect, preserve, and improve the health of all the Commonwealth's residents.

Why surveillance?
It doesn’t count, if you don’t count. – Who? – Where? – Doing what? – What happened?
Prevention Government role

Public Health Surveillance On-going, systematic surveillance
collection, analysis, and interpretation of health data essential to public health
practice dissemination of these data to those who need to know for the purposes of prevention
“follow up to see that action has been taken”
Teutsch and Churchill: Principles and Practice of Public Health Surveillance

Collects, analyzes and disseminates information about work-related injuries and illnesses in Massachusetts Uses information to conduct and promote intervention and prevention activities
Occupational Health Surveillance Program Bureau of Health Information, Statistics, Research & Evaluation

Occupational Health Surveillance
Sentinel Sentinel health events indicate need for action – Failure of prevention – “Why did this
happen?” – Referral – Stories
Identify industries, occupations and exposures
Population-based Scope Magnitude Representative of whole population Distribution – Who – Where
Trends

What does the population-based data tell us ?

3,647,596 resident hospitalizations
20,457 work-related hospitalizations (paid for by workers’ compensation) – 0.56% of all hospitalizations – 1.2% of hospitalizations of persons 16-64
years of age
Average 4,113 work-related hospitalizations per year
Work-related hospitalizations in Massachusetts: 1996 - 2000

Rates of Work-Related Hospitalizations by County of Residence
Massachusetts, 1996-2000*
178.7
230
141
106.393.4
103.7
165.9143.9
121.9
155.4
121.5
160.3
125.9
86.9
37.7
0
50
100
150
200
250
Barnsta
ble
Berksh
ire
Bristol
Dukes
Essex
Frankli
n
Hampd
en
Hamps
hire
Middlesex
Nantuck
et
Norfolk
Plymouth
Suffolk
Worceste
rTotalH
ospi
taliz
atio
ns p
er 1
00,0
00 w
orke
rs
*Workforce estimates from Current Population Survey
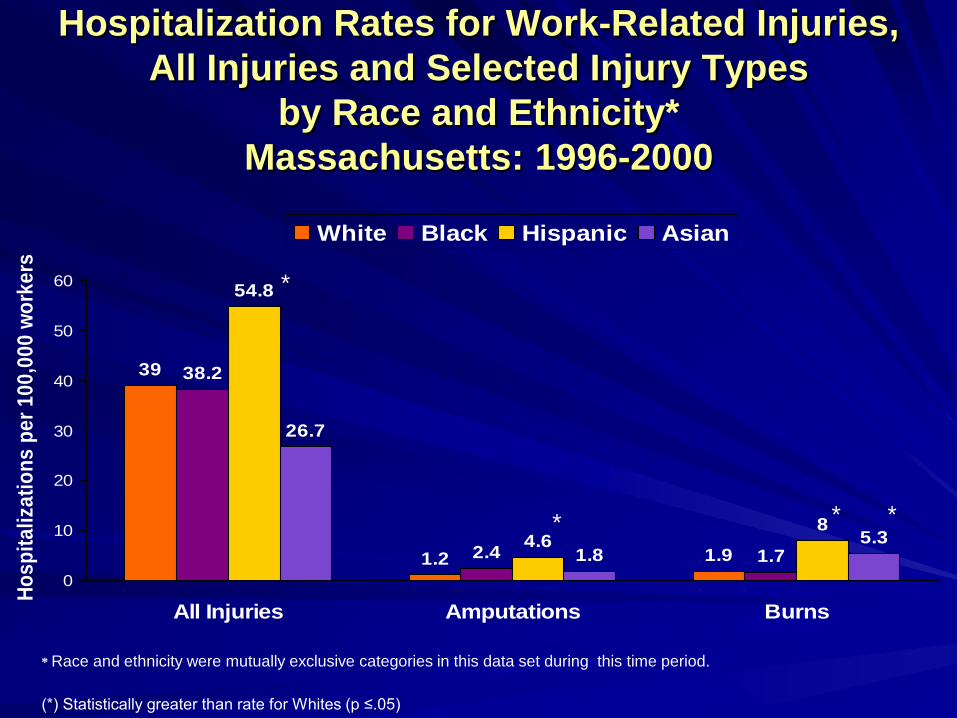
Hospitalization Rates for Work-Related Injuries, All Injuries and Selected Injury Types
by Race and Ethnicity* Massachusetts: 1996-2000
39
1.2 1.9
38.2
2.4 1.7
54.8
4.68
26.7
1.85.3
0
10
20
30
40
50
60
All Injuries Amputations Burns
Hosp
italiz
atio
ns p
er 1
00,0
00 w
orke
rs
White Black Hispanic Asian
* Race and ethnicity were mutually exclusive categories in this data set during this time period.
(*) Statistically greater than rate for Whites (p ≤.05)
*
* * *

Sharps Injuries among Employees of Acute Care Hospitals, Massachusetts, 2002-2007, N=16,158
0
5
10
15
20
25
30
2002 2003 2004 2005 2006 2007Year
Sha
rps
inju
ries
per 1
,000
FTE
s
2,400
2,450
2,500
2,550
2,600
2,650
2,700
2,750
2,800
2,850
2,900
Num
ber of Sharps Injuries
Injury number Injury rate
-4.7% (p<0.001)

Number and Rate of Fatal Occupational Injuries by Industry Division ,
Massachusetts, 2003 - 2007
34
103
43
16 2340 36
23 2215
60.9
9.7 9.32.3 1.8 1.8 1.8 1.4 1.2 0.50
10
20
30
40
50
60
70
80
90
100
110
Agriculture,Forestry,
Fishing, andHunting
ConstructionTransportation,Warehousingand Utilities
Other Services Leisure &Hospitality
Wholesale &Retail Trade
Professional &Business
Srvcs
ManufacturingGovernment Educational,Health & Social
Srvcs
Num
ber
of F
atal
ities
0
10
20
30
40
50
60
Dea
ths
(per
100
,000
wor
kers
)Number Rate

Fatal Occupational Injuries ( ~75/Year in MA )
Rate of Fatal Occupational Injury, Massachusetts, 2000 - 2007
4.0
3.1
2.02.3 1.7 1.5
0
1
2
3
4
5
U.S. MA Hispanic White Black Asian
Dea
ths
per 1
00,0
00 w
orke
rs

1982-1989 avg.: ~63 cases/yr Avg. % pleural (men): 94%* 1982-1999 avg.: ~79 cases/yr Avg. % pleural (women): 79%* 1990-1999 avg.: ~93 cases/yr * thru 1999
2000-2004 avg.: 91 cases/yr Source: Massachusetts Cancer Registry
Incident Mesothelioma Cases, MA 1984-2004
4550556065707580859095
100105110115
1984
1985
1986
1987
1988
1989
1990
1991
1992
1993
1994
1995
1996
1997
1998
1999
2000
2001
2002
2003
2004

Sentinel Surveillance SENSOR: Sentinel Event Notification System for Occupational Risks – Work-related asthma
Burn injuries Lead poisoning in adults Work injuries in teens <18 years Traumatic work fatalities Work-related poison center cases
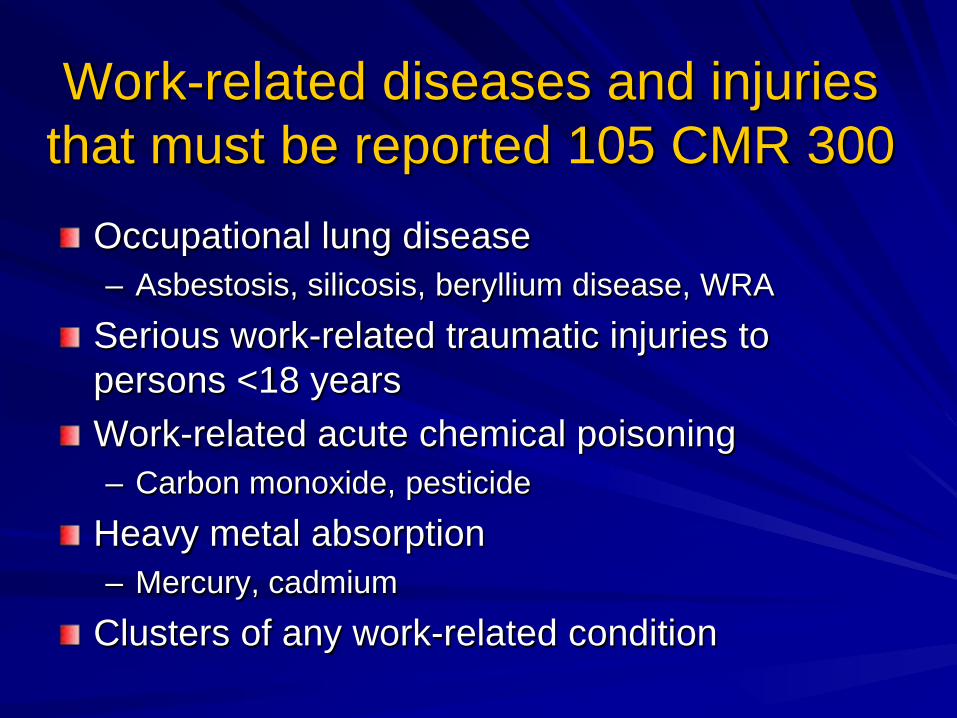
Work-related diseases and injuries that must be reported 105 CMR 300
Occupational lung disease – Asbestosis, silicosis, beryllium disease, WRA
Serious work-related traumatic injuries to persons <18 years Work-related acute chemical poisoning – Carbon monoxide, pesticide
Heavy metal absorption – Mercury, cadmium
Clusters of any work-related condition

Medical reports—sentinel surveillance Mandatory reporting Personal identifiers – Compliant with HIPAA
Indications of a hazard that has already caused illness Responsibility for: – disease prevention, – job protection, – trust with patient – trust with health care provider

Reportable Occupational Health Conditions Under Surveillance in Massachusetts
Health Condition Fatal occupational injuries* Sharps Injuries Work-related injuries to teens < 18 years of age
Major Data Sources Death certificates Town clerk, ME reports OSHA/Coast Guard report Police/Fire reports Workers’ comp claims Newspaper clippings, etc Hospital Sharps Logs Workers’ compensation Select EDs *Not reportable but personal data can be collected.

Reportable Occupational Health Conditions Under Surveillance in Massachusetts
Health Condition
Work-related asthma Elevated blood lead levels
Acute chemical poisonings Serious burns
Major Data Sources Physician case reports In-patient and ED data Workers’ comp claims Clinical lab reports
Physician and ED reports Hyperbaric chamber reports Poison Control Center
Massachusetts Burn Registry/ED reports

DRAFT DATA 4/8/10—NOT FOR RELEASE
Total Number of Tests Reported to MA Blood Lead Registry (1991-2009) by Blood Lead Level (BLL)
0
100
200
300
400
500
600
700
800
900
1000
1100
1200
1300
1400
1991
1992
1993
1994
1995
1996
1997
1998
1999
2000
2001
2002
2003
2004
2005
2006
2007
2008
2009
Year of Report, (Note: Cases with BLLs 15-24 µg/dL only available 2001-2009)
Num
ber o
f Rep
orte
d Te
sts
Cases with BLL ≥ 15 µg/dLCases with BLL ≥ 25 µg/dLCases with BLL ≥ 40 µg/dLCases with BLL ≥ 50 µg/dLCases with BLL ≥ 60 µg/dLCases with BLL ≥ 80 µg/dL

Airflow obstruction that is reversible Airway inflammation Mucous Airway narrowing Airway responsiveness
Symptoms: cough, wheezing, chest tightness, shortness of breath, tight throat, scared-agitated
ASTHMA

Asthma in Massachusetts Adults Figure: Trend in Prevalence of Lifetime and Current Asthma among MA and US Adults, 2000-2007
0.0
2.0
4.0
6.0
8.0
10.0
12.0
14.0
16.0
18.0
2000 2001 2002 2003 2004 2005 2006 2007Year
Per
cent
(%)
MA Lifetime AsthmaUS Lifetime AsthmaMA Current AsthmaUS Current Asthma
*Burden of Asthma in Massachusetts, 2009 (MA BRFSS data)

Work-related asthma
Courtesy of Regent Medical®

Work-Related Asthma • Asthma caused by- or made worse by- work • 2 categories:
– New Onset Occupational Asthma (OA) sensitizer induced asthma, irritant induced asthma reactive airways dysfunction syndrome (RADS)
– Workplace Exacerbation of Asthma
Tarlo SM et al. Diagnosis and management of work-related asthma: : American College of Chest Physicians Consensus statement. Chest 2008;134: 1-41.

What proportion of adult asthma is related to work?
• Toren and Blanc (2009) 17.6% (range 7%-51%) • American Thoracic Society (2003) 15% • American College of Chest Physicians (2008)
“As much as 25% of adults with asthma . . . estimated to have WRA.”

40.2
33.1 31.325.4
13.910.9 10.09.00.0
10.0
20.0
30.0
40.0
50.0
60.0
Lifetime Current
Perc
ent (%
)
Asthma Caused/Aggrevated by Any JobAsthma Caused/Aggrevated by Previous JobAsthma Caused/Aggrevated by Current JobTold To or By HCP that Asthma w as Related to Work
Figure 3.1: Proportion of Massachusetts Adults with Lifetime or Current Asthma Reporting That Their Asthma Was Associated with Work, 2006-2007
Massachusetts Adults with Lifetime or Current Asthma

Is WRA different from asthma?
Research based on BRFSS telephone survey in MA Compare WRA to asthma-not related to work
– 4.8 times more likely to have an asthma attack – 4.7 times more likely to go to the ED – 2.5 times more likely to visit the doctor for
worsening asthma – Other indices of asthma control and health care
use elevated, but not significant Breton et al, OEM, 2006

Sentinel Event Notification System for Occupational Risks?
(SENSOR) • Active state-based surveillance for ‘sentinel’
work-related conditions • Focus on prevention-oriented workplace
intervention • Funded by CDC National Institute for
Occupational Safety and Health (NIOSH)
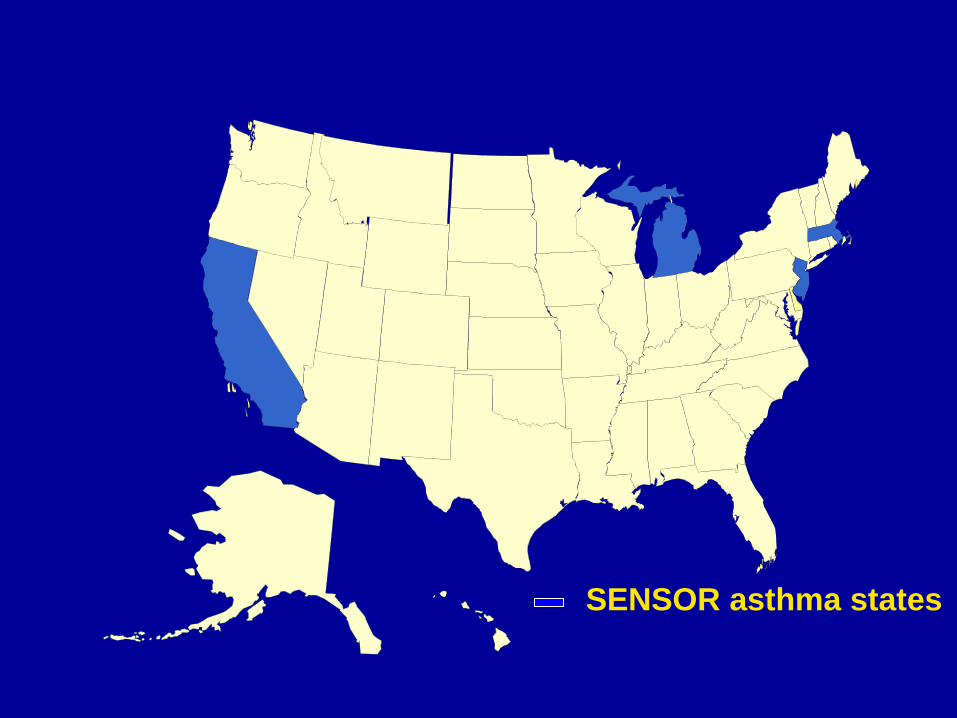
SENSOR asthma states

Primary Industries by State 1993-1999
CA MA MI NJ Health
Services (17%)
Health Services (29%)
Transportation Equipment
(43%)
Health Services (16%)
Educational
Services (14%)
Educational
Services (13%)
Health Services
(11%)
Chemical
Manufacturing (11%)
Justice,
Public Order, Safety (8%)
Justice, Public Order, Safety
(4%)
Fabricated
Metal Products (5%)
Educational
Services (8%)/ Food & Kindred
Products (8%)
SOURCE: 2002 WoRLD Report, SENSOR asthma data: CA, MA, MI, NJ

How to Report to MDPH
Confidential Fax: (617) 624-5696
Mail: OHSP, MDPH
250 Washington St, 6th Floor
Boston, MA 02108
Phone: (617) 624-5632
(617) 624-5624
www.mass.gov/dph/ohsp/

Health Care Provider Reporting System Ill Worker
Health Care Provider
Worker develops WRA Worker perceives that he/she is sick Worker has access to medical care Worker obtains medical care
HCP accurately diagnoses asthma HCP takes occupational history HCP recognizes asthma is work-related
WRA is reportable in state where occurs HCP is aware of reporting system HCP reports case as required
*Derived from model developed by Azaroff et al., 2002
MDPH
Follo
w-u
p
•Medical Record Request •Information dissemination
•Interview •Information dissemination
Case Report Form •Fax , Mail, Phone

MA Surveillance System for Work-Related Asthma
Emergency Dept Data
OHSP
Worker Interview
Employer Follow-up
(work-site investigations) Worker Follow-up
(education materials)
Summary Data Analysis
Industry Wide Interventions
Heath Care Provider Reports
Workers’ comp
Hospital Discharges
CDC-NIOSH

Industries among MA people with WRA, 1993-2006, n=633
Industry # of WRA reports
% of WRA reports
% of MA workforce
Services 334 53% 42% Health care 181 29% 10% Education 83 13% 9% Manufact. 150 24% 14% Public Admin 56 9% 4% Trade 42 7% 19% Construction 22 4% 6% Other 29 4% 14%
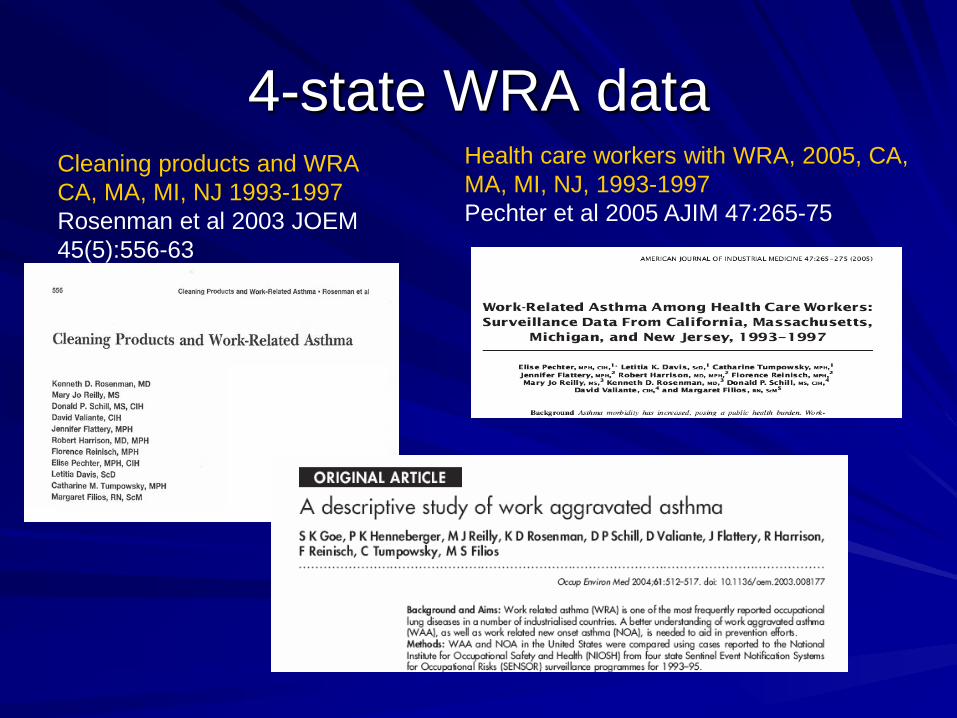
4-state WRA data Cleaning products and WRA CA, MA, MI, NJ 1993-1997 Rosenman et al 2003 JOEM 45(5):556-63
Health care workers with WRA, 2005, CA, MA, MI, NJ, 1993-1997 Pechter et al 2005 AJIM 47:265-75

Fifteen Most Frequently Reported Exposures for WRA Cases, 1993-2006, N=1899 agents (more than one can be reported for each case)
AGENT # of reports Percentage Indoor Air Pollutants 156 8.2% Cleaning Products 145 7.6%
Minerals and Inorganic Dusts 142 7.5% Chemicals, NOS 108 5.7%
Mold 78 4.1% Solvents 73 3.8%
Products of Combustion 51 2.7% Latex 46 2.4%
Isocyanates 39 2.1% Paints and Lacquers 27 1.4%
Acids and Bases 25 1.3% Metals 23 1.2%
Formaldehyde 21 1.1% Polymers 20 1.1%
Welding Fumes 19 1.0%


Hierarchy of Controls & Toxics Use Reduction
1 Source 2 Path 3 Person Substitution Local exhaust
ventilation PPE
Engineering and Maintenance
Housekeeping Administrative controls
Enclosure

Elise Pechter MPH, CIH Industrial Hygienist/Intervention Coordinator Occupational Health Surveillance Program 250 Washington Street Boston, MA 02108 617 624-5681 [email protected] www.mass.gov/dph/ohsp/