health consultation - agency for toxic substances …€¦ · health consultation environmental...
TRANSCRIPT

Health Consultation
ENVIRONMENTAL DATA REVIEW for
AM/PM GAS STATION
BELMONT, SAN MATEO COUNTY, CALIFORNIA
DECEMBER 21, 2005
U.S. DEPARTMENT OF HEALTH AND HUMAN SERVICES Public Health Service
Agency for Toxic Substances and Disease Registry Division of Health Assessment and Consultation
Atlanta, Georgia 30333

Health Consultation: A Note of Explanation
An ATSDR health consultation is a verbal or written response from ATSDR to a specific request for information about health risks related to a specific site, a chemical release, or the presence of hazardous material. In order to prevent or mitigate exposures, a consultation may lead to specific actions, such as restricting use of or replacing water supplies; intensifying environmental sampling; restricting site access; or removing the contaminated material.
In addition, consultations may recommend additional public health actions, such as conducting health surveillance activities to evaluate exposure or trends in adverse health outcomes; conducting biological indicators of exposure studies to assess exposure; and providing health education for health care providers and community members. This concludes the health consultation process for this site, unless additional information is obtained by ATSDR which, in the Agency’s opinion, indicates a need to revise or append the conclusions previously issued.
You May Contact ATSDR TOLL FREE at 1-888-42ATSDR
or Visit our Home Page at: http://www.atsdr.cdc.gov

HEALTH CONSULTATION
ENVIRONMENTAL DATA REVIEWfor
AM/PM GAS STATION
BELMONT, SAN MATEO COUNTY, CALIFORNIA
Prepared by:
The U.S. Department of Health and Human Services Agency for Toxic Substances and Disease Registry

AM/PM Gas Station, Belmont, San Mateo County, CA
Table of Contents Summary and Statement of Issues ...................................................................................................1 Background......................................................................................................................................1 Community Health Concerns...........................................................................................................2 ATSDR’s Evaluation Process ..........................................................................................................3 Discussion........................................................................................................................................4
Available environmental data for the site and data quality evaluation........................................4 Environmental data evaluation and public health implications ...................................................4
Child Health Considerations ............................................................................................................7 Conclusions......................................................................................................................................7 Recommendations............................................................................................................................7 Public Health Action Plan................................................................................................................7 Authors, Technical Advisors ...........................................................................................................9 References......................................................................................................................................10
Figure 1 — Intro Map................................................................................................................12 Figure 2 — Historical monitoring well location map................................................................13 Table 1 — Summary of on-site ground water analytical data (maximum concentration/ most recent concentration in μg /L)....................................................................................................14 Table 2 — Summary of groundwater analytical data — MW located off-site (maximum concentrations and most recent sample concentration in μg /L) ...............................................16 Table 3 — Summary of Soil Samples (mg/kg)..........................................................................19
Table 4 — Summary of soil vapor samples (μg/L)…………………………………………....21 Appendix A — ATSDR’s comparison values and definitions…………………………………A-1 Appendix B — ATSDR’s levels of public health hazard………………………………………B-1
i

Summary and Statement of Issues The Agency for Toxic Substances and Disease Registry (ATSDR) was petitioned by a resident ofBelmont, California to evaluate whether exposure to possible contaminants in a groundwater plume could adversely affect the health of residents in the nearby community.
The site is currently an active Atlantic Richfield Company (ARCO) service station located within a mixed commercial and residential area of Belmont. The investigation and remediation activities for the site started in 1984 following a gasoline release at a Union Oil Company (Unocal) service station located up-gradient and south of the site.
In this health consultation, ATSDR evaluated available environmental sampling information for potential exposure to contaminants found in groundwater, soil, and soil vapor. ATSDR identified the primary route of potential human exposure as being potentially contaminated indoor air through vapor intrusion. Analysis of exposure pathways and review of site documents indicated that
1. Ground water and soil were impacted by petroleum hydrocarbons and associated compounds at the site and in the nearby residential area.
2. Concentrations of all contaminants appear to decrease rapidly with depth, distance, and time.
3. Residents at the AM/PM site could have been exposed to the groundwater and soil contaminants in the past and present. However, no adverse health effects would be expected to result from these exposures.
4. ATSDR has categorized this site as constituting “No Apparent Public Health Hazard.”
ATSDR recommends continuing the quarterly groundwater monitoring and system remediation program. If groundwater conditions change and pose a potential impact to soil gas concentration and migration, ARCO should collect additional soil vapor samples at locations directly under residential buildings.
Background On October 2001, the Agency for Toxic Substance and Disease Registry (ATSDR) was petitioned by a resident of Belmont, California to evaluate whether exposure to possible contaminants in a groundwater plume could adversely affect the health of residents in the nearby community [1]. The purpose of this document is to review the available environmental data for the AM/PM Gas Station (the site) and to address the health concerns expressed by the petitioner.
The site is currently an active Atlantic Richfield Company (ARCO) service station located within a mixed commercial and residential area of Belmont (see Figure 1). It is bordered by Hiller Street to the northwest, Masonic Way to the northeast, Granada Street to the southwest, and Ralston Avenue to the southeast. One service station building, three dispenser islands with canopy, and two double-walled underground storage tanks (USTs) with associated underground piping are currently located on the site [2].
In 1984, a Union Oil Company (Unocal) service station located south of the site reported a gasoline release. The investigation activities for the site started in November 1984. Unocal’s contractor, EMCON Associates (EMCON), installed groundwater monitoring wells and a groundwater recovery system and collected subsurface soil and groundwater samples.
1

Since August 1992, ARCO took over the operation of the recovery and monitoring system and initiated quarterly monitoring. The San Mateo County Environmental Health Services Division oversaw and directed investigations and remediation activities at the site. Remediation activities included free-product removal, low-flow biosparging, dual-phase extraction, and removal of hydrocarbon mass during reconstruction. Numerous monitoring and recovery wells have been installed and subsequently abandoned during the past years [3–6]. Currently, there are 14 groundwater monitoring wells and 6 groundwater extraction wells at and in the immediate vicinity of the site [2]. The following is a summary of investigation and remediation activities:
• In1984, Unocal service station #4519 reported a release of 15,000 gallons of gasoline. • In 1984, Unocal’s contractor started investigation activities on the site. Activities
included installation of groundwater monitoring and recovery wells, a UST, and quarterly sampling of monitoring wells.
• In 1992, ARCO took over the operation of the recovery and monitoring system. • In 1996, ARCO installed and operated a low-flow biosparging system. • In 2000, ARCO performed a 5-day event of interim remedial action using a mobile dual-
phase extraction (DPE) system. • In 2001, ARCO performed an accelerated site characterization and a human health risk
assessment. • In December 2001 and December 2004, ATSDR regional representatives conducted site
visits, met with the petitioner and local government officials, and requested and reviewed preliminary environmental data [7].
• In December 2001, ATSDR’s Division of Toxicology provided a limited review of indoor air sampling data from the petitioner’s residence [8].
• In April 2002, ATSDR responded to the petitioner with the preliminary decision and started the public health consultation process.
• In 2003, demolition and rebuilding activities began and the station reopened; all the old USTs were removed, all piping removed, the building was demolished, and all structures were relocated in new areas of the property.
• In 2004, quarterly groundwater monitoring and system remediation resumed.
Community Health Concerns The major environmental heath concerns expressed by the petitioner include
• Possible exposure to petroleum chemicals via contaminated water, soil, groundwater, and vapors;
• Possible exposure to petroleum chemicals via consumption of homegrown fruits and vegetables;
• Perceived unusual number of cancer cases in the community and other health concerns including sensory deficit (loss of vision, hearing, and memory), skin problems, and organ damage.
2

ATSDR will address some of the community concerns with this health consultation, and will make recommendations for ATSDR and other agencies activities to address the other issues in the future.
ATSDR’s Evaluation Process ATSDR provides site-specific public health recommendations on the basis of toxicologic literature, levels of environmental contaminants detected at a site compared to accepted comparison values, an evaluation of potential exposure pathways and duration of exposure, and the characteristics of the exposed population. Whether a person will be harmed by exposure to hazardous substances depends upon several factors, including the type and amount of the contaminant, the manner in which the person was exposed, the duration of the exposure, the amount of the contaminant absorbed by the body, site conditions, genetic factors, and individual lifestyle factors.
At this site, the primary route of potential human exposure is inhalation of potentially contaminated indoor air through vapor intrusion. Ingestion and dermal contact exposures are not given further consideration because (1) groundwater is not used as a drinking water source, (2) plant uptake and bioaccumulation of contaminants are minimal, and (3) dermal absorption of contaminants is not expected since the contamination is at depths not likely to be encountered during routine activities.
Vapor intrusion is the migration of volatile organic chemicals (VOCs) from the subsurface- contaminated groundwater and soil through pore spaces in the soil into overlying buildings, thereby affecting the indoor air quality. The air within the soil pore spaces is called soil gas or soil vapor [9,10]. Soil vapors can enter residences and other buildings through foundation cracks and gaps, pressure differences between the inside and outside of the buildings and homes, mechanical ventilation systems, and leakage areas (for example, utility entry points, construction joints, and floor drainage systems). In recent years, soil vapor sampling data have been used to qualify and/or quantify indoor air risk through modeling. Soil vapor levels are affected by many factors, such as water and air movements, temperature variations in the soil and atmosphere, molecular diffusion, biodegradation, barometric pressure, precipitation, building structures, and pressure differences between the inside and outside of buildings [11–14]. Subsurface vapor concentrations migrating into indoor air spaces are greatly diluted by outdoor air that enters the home and by diffusive, advective, and/or other attenuating mechanisms as the vapor migrates through the soil. Therefore, direct measurement of the indoor air quality in potentially impacted buildings is the best approach to evaluate air contamination at points of exposure.
ATSDR’s approach to evaluating a potential health concern has two components. The first involves a screening process that could indicate the need for further analysis. The second involves a weight-of-evidence approach that integrates estimates of likely exposure with information about the toxicology and epidemiology of the substances of interest. Screening is a process of comparing appropriate environmental concentrations and exposure doses to ATSDR or EPA comparison values (CVs). These CVs include but are not limited to
ATSDR Environmental Media Evaluation Guides (EMEGs) • Reference Media Evaluation Guides (RMEGs) • Minimum Risk Levels (MRLs) • Cancer Risk Evaluation Guidelines (CREGs)
3

• EPA Reference Doses (RfDs) • EPA Risk-Based Concentrations (RBCs) or Preliminary Remediation Goals (PRGs) or
other guidelines.
When determining what environmental guideline value to use, this health consultation followed ATSDR’s general hierarchy and used professional judgment to select CVs that best apply to the site conditions. For example, Hierarchy 1 environmental guidelines (such as CREGs and chronic EMEGs), were used first. In the absence of these values, Hierarchy 2 intermediate EMEGs or RMEGs, were selected. When environmental guidelines listed in the ATSDR hierarchy are unavailable, those from other sources (e.g., EPA draft vapor intrusion guidance, state regulations) were considered. These health-based CVs are media -specific concentrations considered safe using default conditions of exposure. Default conditions are typically based on estimates of exposure in most (i.e., the 90th percentile or more) of the general population. Comparison values are not thresholds of toxicity. A level above a comparison value does not mean that health effects could be expected. It does, however, represent a point where further evaluation is warranted. After identifying potential chemicals of concern through the screening process, ATSDR evaluates a number of parameters depending on the contaminant and site-specific exposure conditions. Such parameters can include biological plausibility, mechanisms of action, cumulative interactions, health outcome data, strength of epidemiological and animal studies, and toxicological and pharmacological characteristics.
Discussion Available environmental data for the site and data quality evaluation
ATSDR evaluated available environmental sampling information for potential exposure to contaminants found in groundwater, soil, and soil vapor. The information includes data collected from 1996 to 2004. Groundwater, soil, and soil vapor samples were collected by ARCO’s contractors and analyzed for total petroleum hydrocarbons (TPH), benzene, toluene, ethyl-benzene, xylenes, methyl-tertiary-butyl ether (MTBE), and other related chemicals. The laboratory analysis methods selected were adequate EPA methods for the selected chemicals.
ATSDR also reviewed information on quality assurance/quality control (QA/QC) specifications for field and laboratory data quality to verify the acceptability and adequacy of data. For example, ATSDR reviewed available chain-of-custody sheets, project narratives, and laboratory certifications. The laboratory analysis methods and the QA/AC procedures were appropriate.
Environmental data evaluation and public health implications Environmental data are grouped into 3 categories and discussed in the following sections.
Ground water samples Quarterly groundwater monitoring started at the site since 1986. ATSDR reviewed groundwater analytical data for monitoring wells both on-site and off-site from 1996 to 2004. The shallow water-bearing zone is present within 30 feet of the ground surface. Data exist for 8 on-site monitoring wells (X-1, X-2, X-3, X-4, X-12, X-12R, X-13, and X-14). Four on-site monitoring wells (X-1, X-3, X-12, and X-14) were destroyed during the 2003 reconstruction of the service station. The maximum concentrations of selected VOCs for on-site monitoring wells were benzene, 14,000 μg/L (parts per billion); ethylbenzene, 4,600 μg/L; MTBE, 190,000 μg/L; THP, 200,000 μg/L, toluene, 35,000 μg/L; and xylenes, 54,000 μg/L. Table 1 is a summary of on-site
4

groundwater analytical data for selected VOCs with their maximum concentration, and the most recent test results.
There were 13 off-site monitoring wells with data back to 1996. The maximum concentrations ofselected VOCs for off-site monitoring wells were benzene, 7,600 μg/L; ethylbenzene, 410 μg/L; MTBE, 54,000 μg/L; THP, 22,000 μg/L; toluene, 910 μg/L; and xylenes, 1,100 μg/L. The maximum concentrations of VOCs were found at monitoring well X-6, which is the closest one to the source. Table 2 is a summary of off-site groundwater analytical data for selected VOCs with their maximum concentration and the most recent test results. Figure 2 is a map for all monitoring well locations.
Further examination of the sampling results and site-specific exposure scenarios indicated that
• Although ground water was impacted by petroleum hydrocarbons and associated compounds, concentrations of contaminants appear to decrease rapidly with depth, distance, and time.
• Groundwater is not used as a drinking water source; therefore, an ingestion exposure pathway does not exist.
• The dermal absorption of contaminants is not expected since the contamination is at depths not likely to be encountered during routine activities.
• The most likely exposure to VOCs in ground water is inhalation of potentially contaminated indoor air through vapor intrusion.
• All of the maximum concentrations of the detected VOCs were at levels below their respective screening values for the vapor intrusion pathway except for benzene.
Benzene found in the environment comes from natural processes as well as human activities. Natural sources of benzene include volcanoes and forest fires and benzene is also a component of crude oil, gasoline, and cigarette smoke. Widely used, benzene ranks in the top 20 chemicals in production volume in the United States. It is a colorless and highly flammable gas that evaporates very quickly [15]. The major sources of benzene exposure for the public are tobacco smoke (45%), automobile exhaust and industry (20%), and other home sources (16%). Home sources include tobacco smoke, and paints and gasoline stored in the home (i.e., in basements or attached garages). On average, smokers have about 6–10 times as much benzene in their blood as non-smokers [16–17].
Benzene has been identified in indoor and outdoor samples of both rural and urban environments. Outdoor concentrations of benzene from 300 cities in 42 states have an average of 9.1 μg/m3 (parts per trillion). Indoor concentrations of benzene from 30 cities in 16 states have an average of 16.7 μg/m3 [18].
Benzene is a known human carcinogen. It has been associated with leukemia in workers exposed to very high concentrations (3,190 μg/m3 for 40 years) [19]. The current ATSDR guidance states that exposures where the maximum concentration is at or below 32 μg/m3 pose no apparent public health hazard [20]. The EPA draft vapor intrusion guidance suggests that a benzene groundwater concentration of 140 μg/L represents an estimated target indoor air concentration of 31 μg/m3, using a conservative soil vapor to indoor air attenuation factor of 1/100 [9]. The California Regional Water Quality Control Board has established an environmental screening level (ESL) for benzene of 46 μg/L [21]. All the comparison values above are based on the long-
5

term exposure for cancer risks. For example, the estimated indoor air benzene concentration of 31 μg/ m3 represents a low theoretical increased risk of cancer, assuming that persons have a continuous lifetime exposure (70 years) to that level of benzene. The AM/PM site-specific exposure scenarios indicated that (1) duration of exposure to the contaminant was relatively short, and (2) the concentration of benzene appears to decrease rapidly with depth, distance, and time. For example, the latest available groundwater samples revealed that benzene was not detected in any off-site monitoring well except in one well (X-6), which is the closest to the source [22]. In addition, no home is located near or directly over the monitoring well. Therefore, exposure is unlikely to be associated with any appreciable risk of adverse health effects fromsubsurface vapor intrusion to indoor air pathway.
Soil samples In May 2001, during the site characterization activity, ARCO contractor personnel collected 104 on-site and off-site soil samples. Soil samples were analyzed for total TPH, benzene, toluene, ethyl-benzene, xylenes, MTBE, and other related chemicals. Table 3 is a summary of analytical results for detected VOCs of all soil samples.
There were 43 on-site soil samples taken between 5 and 34 feet below the ground surface to evaluate the impact in the suspected source area and the vicinity of the site, and to identify potential preferential pathways for groundwater migration. The respective maximum and average concentrations of selected VOCs for on-site soil samples were benzene, 1.68 mg/kg and 0.11 mg/kg (parts per million); ethylbenzene, 38 mg/kg and 1.54 mg/kg; MTBE, 2.62 mg/kg and 0.33mg/kg; THPs, 1,640 mg/kg and 74.38 mg/kg; toluene, 60 mg/kg and 2.5 mg/kg; and xylenes, 220 mg/kg and 8.2 mg/kg. The maximum concentrations of all detected VOCs were found at a location immediately downgradient from the on-site USTs. The on-site soil analyses also indicated that the concentration of detected VOCs decreased significantly with depth and distance from the USTs.
Sixty-eight off-site soil samples were taken between 0.5 and 28 feet below the ground surface. Benzene, toluene, and ethylbenzene were not detected in any of the samples. TPHs were detected in 8 samples, with maximum and average concentrations of 1,230 mg/kg and 22.9 mg/kg, respectively. MTBE was detected in 3 samples, with maximum and average concentrations of 0.232 mg/kg and 0.104 mg/kg, respectively. Xylenes were detected in 2 samples, with maximum and average concentrations of 0.458 mg/kg and 0.104 mg/kg, respectively.
As discussed earlier, the most likely exposure to contaminants at the site is via inhalation of potentially contaminated indoor air through vapor intrusion. The average concentrations of all detected chemicals in both on-site and off-site soil samples were at levels below their respective screening values for the vapor intrusion and soil ingestion pathways. Therefore, exposure to VOCs at levels detected at the site is unlikely to cause adverse health effects.
Soil vapor Samples In May 2001, ARCO contractor personnel collected 27 active soil vapor samples in Tedlar sample bags at locations on and off the site. In addition, two static vapor samples were collected from the ambient air within a crawl space beneath the floor of a nearby residence. Soil vapor samples were analyzed for total TPH, benzene, toluene, ethyl-benzene, xylenes, MTBE, and other related chemicals. The maximum on-site concentrations of all detected chemicals were
6

found at a location immediately downgradient of the on-site USTs. Maximum concentrations of TPH and MTBE were 11,600 and 81μg/L, respectively.
Benzene was not present at or above the detection limits (0.2–0.5 μg/L) in any of the vapor samples. All off–site VOC concentrations were below the levels of both the EPA draft guidance on indoor vapor intrusion and the California ESL (see Table 4). There were no VOCs at concentrations at or above the detection limits in the vapor samples from the crawl space beneath the residence. Although the limited data indicated the soil vapor levels of VOCs were below health concerns, it is prudent public health practice to continue monitoring the groundwater conditions and to take additional soil vapor samples at locations directly under residential buildings if groundwater conditions change and pose a potential impact on soil gas concentration and movement.
Child Health Considerations ATSDR considers children in its evaluations of all exposures, and we use health guidelines that are protective of children. In general, ATSDR assumes that children are more susceptible to chemical exposures than are adults.
ATSDR has considered these factors in the development of its conclusions and recommendations for this site. CVs used for this health consultation are intended to represent exposures that could be continued for a lifetime for the general population—including potentially susceptible subgroups such as children—without appreciable health risks. Conclusions
After reviewing the available environmental data, ATSDR determined that the primary route of potential human exposure is inhalation of potentially contaminated indoor air through vapor intrusion. Environmental data evaluation and analysis indicated that
• Ground water and soil were impacted by petroleum hydrocarbons and associated compounds at the site and in the nearby residential area.
• Concentrations of all contaminants appear to decrease rapidly with depth, distance, and time.
• Residents at the AM/PM site could have exposed to the groundwater and soil contaminants in the past and present. However, no adverse health effects would be expected to result from these exposures.
• ATSDR has categorized this site as constituting “No Apparent Public Health Hazard.”
Recommendations 1. Continue the quarterly groundwater monitoring and system remediation program. 2. Collect additional soil vapor samples at locations directly under residential buildings
if groundwater conditions change and pose a potential impact on soil gas concentration and migration.
Public Health Action Plan Actions Taken:
1. ARCO performed an accelerated site characterization and a human health risk assessment.
7

2. ATSDR conducted site visits, met with the petitioner and local government officials, and performed a limited review of indoor air sampling data from the petitioner’s residence.
3. ARCO removed all old USTs and associated piping, demolished the old building, and relocated structures in new areas of the property.
Actions Planned:
1. ARCO will continue the quarterly groundwater monitoring and system remediation program at the site.
2. ATSDR will assist, as needed, in further evaluations of additional environmental data to better characterize the exposure and the extent of vapor intrusion.
3. ATSDR will continue to work with the San Mateo County Environmental Health Services Division to respond to public health questions and concerns.
8

Authors, Technical Advisors Jane Zhu
Environmental Health Scientist Consultation Section Exposure Investigation and Consultation Branch Division of Health Assessment and Consultation Agency for Toxic Substances and Disease Registry (ATSDR)
Reviewers Susan Moore
Chief, Exposure Investigation and Consultation Branch Division of Health Assessment and Consultation Agency for Toxic Substances and Disease Registry (ATSDR)
Peter Kowalski
Exposure Investigation and Consultation Branch Division of Health Assessment and Consultation Agency for Toxic Substances and Disease Registry (ATSDR)
Libby Vianu
Regional Representative Division of Regional Operations Agency for Toxic Substances and Disease Registry (ATSDR)
9

References 1. Resident of Belmont. Petition letter to ATSDR, Atlanta, GA. October 2001. 2. URS Corporation. Remediation System Startup Report. Oakland, California. September
2004. 3. SECOR International Incorporated. Revised accelerated Site Characterization Report. ARCO
Service Station # 613. Mountain View, California. October 2001. 4. SECOR International Incorporated. Revised Baseline Human Health Risk Assessment
Report. ARCO Service Station # 613. Mountain View, California. October 2001. 5. SECOR International Incorporated. Low Flow Biosparge System Installation and Start-up
Report, ARCO Service Station # 613. Mountain View, California. July 1998. 6. URS Corporation. Soil and Water Investigation Report, ARCO Service Station # 613.
Oakland, California. April 2003. 7. Agency for Toxic Substances and Disease Registry. Memorandum to the ATSDR Petition
Coordinator from Regional Representative Gwen Eng concerning AM/PM gas station. Atlanta: US Department of Health and Human Services; December 2001.
8. Agency for Toxic Substances and Disease Registry. E-mail to Regional Representative Gwen Eng from Rich Nickle concerning RV Paint Air Toxics. Atlanta: US Department of Health and Human Services; December 2001.
9. US Environmental Protection Agency, Office of Solid Waste and Emergency Response. Draft Guidance for evaluating the vapor intrusion to indoor air pathway from groundwater and soils (Subsurface vapor intrusion guidance). Washington, DC: Environmental Protection Agency Office of solid waste and emergency response; 2002.
10. Agency for Toxic Substances and Disease Registry. Health Consultation, Evaluation of indoor air, soil gas and groundwater data sampling phase 2, 3 and 4 (2001, 2002, 2003), Raymark Industries, Incorporated. Atlanta: US Department of Health and Human Services; 2003.
11. Agency for Toxic Substances and Disease Registry. Landfill gas primer—an overview for environmental health professionals. Atlanta: US Department of Health and Human Services; 2001.
12. Cohen, Y. Volatile organic compounds in the environment: a multimedia perspective, Volatile organic compounds in the environment, ASTM STP 1261, Wang W ,Schnoor WJ, Doi J, editors. Philadelphia: American Society for Testing and Materials; 1996:7–32.
13. Kildiff, JK and Cody RJ. Soil vapor concentration profile: approximate solutions to aid sampling design and indoor air risk assessment. Presented at: The Third International Conference on the Remediation of Chlorinated and Recalcitrant Compounds: 2002 May 20–30, Monterey, California.
14. Doa, MJ. The toxic release inventory. Journal of Hazard Water & Hazard Mater 1992; 29:61–72
15. Agency for Toxic Substances and Disease Registry. Toxicological profile for benzene (update). Atlanta: US Department of Health and Human Services; 1997.
16. Wallace LA. Human exposure to environmental pollutants: a decade of experience. Clin Experim Allergy 1995;25:4–9.
10

17. Ott WR and Roberts JW. Everyday exposure to toxic pollutants. Sci Amer February 1998; 278:86–91.
18. Shah JJ and Singh HB. Distribution of volatile organic chemicals on outdoor and indoor air. Environ Sci Toxicol 1988; 22(12):1381-1388
19. Rinsky RA, Alexander BS, Hornung R, et al. Benzene and leukemia, an epidemiologic risk assessment. N Engl J Med 1987;316:1044–50.
20. Susten A. Memorandum for interim guidance on benzene exposure. Atlanta: Agency for Toxic Substances and Disease Registry, Division of Health Assessment and Consultation, Agency for Toxic Substances and Disease Registry; 2000 Jan 12.
21. California Regional Water Quality Control Board. Screening for environmental concerns at sites with contaminated soil and groundwater. Volume 1: Summary tier 1 lookup tables. Oakland: California Regional Water Quality Control Board, San Francisco Bay Region; 2005.
22. California Regional Water Quality Control Board. Available at: http://geotracker.waterboards.ca.gov. Accessed September 6, 2005.
11

Figure 1. Intro Map
12

Figure 2. Historical monitoring well location map
Source: SECOR International Incorporated. Revised accelerated Site Characterization Report. ARCO Service Station # 613. Mountain View, California. October 2001.
13

Table 1. Summary of on-site ground water analytical data (maximum concentration and most recent concentration in μg/L)
SamplingDate
Maximum Concentration
Last Sample Date
Last Sample Concentration
MW Number
THP 04/10/97 170,000 03/04/03 33,000 X-1Benzene 03/03/98 13,000 03/04/03 1,500 X-1Toluene 03/03/98 200,000 03/04/03 440 X-1Ethyl-benzene 03/04/03 4,600 03/04/03 1,800 X-1Xylenes 04/10/98 54,000 03/04/03 6,700 X-1MTBE 12/01/98 190,000 03/04/03 5,200 X-1
THP 06/26/02 12,000 06/15/04 3,100 X-2 Benzene 06/26/02 120 06/15/04 ND(<10) X-2 Toluene 10/28/96 34 06/15/04 ND(<10) X-2 Ethyl-Benzene 10/28/96 31 06/15/04 ND(<10) X-2 Xylenes 02/03/96 17 06/15/04 ND(<10) X-2 MTBE 07/30/96 140 06/15/04 ND(<10) X-2
THP 03/03/98 200,000 03/04/03 82,000 X-3 Benzene 06/12/97 14,000 03/04/03 3,400 X-3 Toluene 06/12/97 14,000 03/04/03 2,600 X-3 Ethyl-Benzene 03/03/98 3,900 03/04/03 3,200 X-3 Xylenes 03/03/98 25,000 03/04/03 14,000 X-3 MTBE 08/29/97 81,000 03/04/03 24,000 X-3
THP 09/26/02 646 06/15/04 ND(<100) X-4 Benzene 05/18/01 2.5 06/15/04 ND(<1.0) X-4 Toluene 05/18/01 6.06 06/15/04 ND(<1.0) X-4 Ethyl-benzene 05/18/01 6.58 06/15/04 ND(<1.0) X-4 Xylenes 05/18/01 35 06/15/04 ND(<1.0) X-4 MTBE 03/25/02 81 06/15/04 43 X-4
THP 03/25/02 25,000 03/04/03 66,000 X-12 Benzene 03/25/02 1,400 03/04/03 1,000 X-12 Toluene 12/31/01 890 03/04/03 ND(<500) X-12 Ethyl-benzene 12/31/01 2,000 03/04/03 1,300 X-12 Xylenes 12/31/01 8,100 03/04/03 3,200 X-12 MTBE 03/25/02 60,000 03/04/03 37,000 X-12
THP 12/31/03 22,000 06/15/04 ND(<500) X-12R Benzene 12/31/03 170 06/15/04 ND(<5) X-12R
14

Toluene 12/31/03 ND (<120) 06/15/04 ND(<5) X-12R Ethyl-benzene 12/31/03 ND (<120) 06/15/04 ND(<5) X-12R Xylenes 12/31/03 ND (<120) 06/15/04 ND(<5) X-12R MTBE 12/31/03 16,000 06/15/04 330 X-12R
THP 11/11/02 10,000 06/15/04 ND(<500) X-13 Benzene 11/11/02 1,200 06/15/04 12 X-13 Toluene 11/11/02 78 06/15/04 ND(<5) X-13 Ethyl-benzene 11/11/02 610 06/15/04 8.6 X-13 Xylenes 11/11/02 850 06/15/04 ND(<5) X-13 MTBE 12/31/01 29,000 06/15/04 210 X-13
THP 11/11/02 23,000 03/04/03 ND(<25,000) X-14 Benzene 11/11/02 1,700 03/04/03 720 X-14 Toluene 11/11/02 700 03/04/03 ND(<25) X-14 Ethyl-benzene 11/11/02 1,700 03/04/03 900 X-14 Xylenes 11/11/02 3,900 03/04/03 1,200 X-14 MTBE 08/09/01 32,000 03/04/03 5,900 X-14
Note: μg/L = micrograms per liter MW # = monitoring well number THP = total petroleum hydrocarbons MTBE = methyl-tertiary-butyl ether ND = not detected at or above specified laboratory reporting limit. Values in parentheses are laboratory reporting limits.
Sampling Maximum Last Sample Last Sample MW Date Concentration Date Concentration Number
15

Table 2. Summary of ground water analytical data-mw located off-site (maximum concentrations and most recent sample concentration in μg/L)
SamplingDate
Maximum
Concentration
Last Sample Date
Last Sample
Concentration
MW
Number
THP 03/24/04 150 06/15/04 9.54 X-5 Benzene 06/04/98 ND (5) 06/15/04 ND(0.50) X-5 Toluene 02/23/99 5 06/15/04 ND(0.50) X-5 Ethyl-benzene 06/04/98 ND (5) 06/15/04 ND(0.50) X-5 Xylenes 02/23/99 4 06/15/04 ND(0.50) X-5 MTBE 06/04/98 310 06/15/04 43 X-5
THP 10/28/96 22,000 06/15/04 ND(5,000) X-6 Benzene 05/01/96 7,600 06/15/04 83 X-6 Toluene 12/09/97 910 06/15/04 ND (50) X-6 Ethyl-benzene 03/03/98 410 06/15/04 ND (50) X-6 Xylenes 03/03/98 1,100 06/15/04 ND (50) X-6 MTBE 05/18/99 54,000 06/15/04 1,000 X-6
THP 02/03/96 790 06/15/04 ND (50) X-7 Benzene 09/01/98 11 06/15/04 ND(0.50) X-7 Toluene 04/26/00 8.4 06/15/04 ND(0.50) X-7 Ethyl-benzene 02/03/96 5.3 06/15/04 ND(0.50) X-7 Xylenes 11/28/00 1.87 06/15/04 ND(0.50) X-7 MTBE 07/30/96 16 06/15/04 8.6 X-7
THP 12/31/03 370 06/15/04 ND (500) X-8 Benzene 11/11/02 1 06/15/04 ND (5.0) X-8 Toluene 04/26/00 1.5 06/15/04 ND (5.0) X-8 Ethyl-benzene 11/11/02 0.48 06/15/04 ND (5.0) X-8 Xylenes 11/11/02 1.7 06/15/04 ND (5.0) X-8 MTBE 08/09/01 870 06/15/04 280 X-8
THP 06/10/03 1,600 06/15/04 880 X-9A Benzene 03/25/02 28 06/15/04 ND (5.0) X-9A Toluene 11/11/02 7.3 06/15/04 ND (5.0) X-9A Ethyl-benzene 09/26/02 0.81 06/15/04 ND (5.0) X-9A Xylenes 11/11/02 2.9 06/15/04 ND (5.0) X-9A MTBE 05/18/01 86.1 06/15/04 38 X-9A
THP 08/09/01 2,100 06/15/04 1,000 X-9B
16

Benzene 03/25/02 61 06/15/04 ND (5.0) X-9B Toluene 11/11/02 5.6 06/15/04 ND (5.0) X-9B Ethyl-Benzene 03/25/02 3.7 06/15/04 ND (5.0) X-9B Xylenes 11/11/02 2 06/15/04 ND (5.0) X-9B MTBE 03/25/02 120 06/15/04 39 X-9B
THP 06/15/04 110 06/15/04 110 X-10A Benzene 05/18/01 ND(4) 06/15/04 ND(0.50) X-10A Toluene 06/15/04 36 06/15/04 36 X-10A Ethyl-benzene 05/18/01 ND(4) 06/15/04 ND(0.50) X-10A Xylenes 05/18/01 ND(4) 06/15/04 ND(0.50) X-10A MTBE 03/25/02 370 06/15/04 26 X-10A
THP 03/24/04 120 06/15/04 ND(500) X-10B Benzene 05/18/01 ND(4) 06/15/04 ND (5.0) X-10B Toluene 05/18/01 ND(4) 06/15/04 ND (5.0) X-10B Ethyl-benzene 05/18/01 ND(4) 06/15/04 ND (5.0) X-10B Xylenes 05/18/01 ND(4) 06/15/04 ND (5.0) X-10B MTBE 09/30/03 1 06/15/04 81 X-10B
THP 03/25/02 12,000 06/15/04 ND(50) X-11A Benzene 03/25/02 ND(50) 06/15/04 ND (5.0) X-11A Toluene 03/25/02 7,000 06/15/04 ND (5.0) X-11A Ethyl-benzene 03/25/02 ND(50) 06/15/04 ND (5.0) X-11A Xylenes 05/21/01 6.03 06/15/04 ND (5.0) X-11A MTBE 05/18/01 63.1 06/15/04 ND (5.0) X-11A
THP 12/31/03 2,000 06/15/04 ND(2,500) X-11B Benzene 06/15/04 ND (25) 06/15/04 ND (25) X-11B Toluene 06/15/04 ND (25) 06/15/04 ND (25) X-11B Ethyl-benzene 06/15/04 ND (25) 06/15/04 ND (25) X-11B Xylenes 06/15/04 ND (25) 06/15/04 ND (25) X-11B MTBE 08/09/01 1,300 06/15/04 1,100 X-11B
THP 06/15/04 ND (50) 06/15/04 ND (50) X-15 Benzene 06/15/04 ND (0.5) 06/15/04 ND (0.50) X-15 Toluene 11/11/02 0.56 06/15/04 ND (0.50) X-15 Ethyl-benzene 06/15/04 ND (0.5) 06/15/04 ND (0.50) X-15
MW Sampling Maximum Last Sample Last Sample Date Date Concentration Concentration Number
17

Xylenes 06/15/04 ND (0.5) 06/15/04 ND (0.50) X-15 MTBE 06/10/03 5 06/15/04 1.9 X-15
THP 06/10/03 2,500 06/15/04 ND(2,500) X-16Benzene 11/11/02 0.41 06/15/04 ND (25) X-16 Toluene 11/11/02 0.6 06/15/04 ND (25) X-16 Ethyl-benzene 11/11/02 0.3 06/15/04 ND (25) X-16 Xylenes 03/04/03 210 06/15/04 ND (25) X-16 MTBE 11/11/02 2,600 06/15/04 830 X-16
THP 06/15/04 ND (50) 06/15/04 ND (0.50) X-17 Benzene 06/15/04 ND (50) 06/15/04 ND (0.50) X-17 Toluene 06/15/04 ND (50) 06/15/04 ND (0.50) X-17 Ethyl-benzene 06/15/04 ND (50) 06/15/04 ND (0.50) X-17 Xylenes 06/15/04 ND (50) 06/15/04 ND (0.50) X-17
MTBE 11/11/02 2 06/15/04 1.6 X-17
μg/L = micrograms per liter
Last sample concentration = the most recent sample concentration MW number = monitoring well number THP = total petroleum hydrocarbons MTBE = methyl-tertiary-butyl ether ND = not detected at or above specified laboratory reporting limit. Values in parentheses are laboratory reporting limits.
MW Sampling Maximum Last Sample Last Sample Date Date Concentration Concentration Number
18

Table 3. Summary of soil samples (mg/kg)
Soil Sample
ID
THP Benzene Toluene Ethyl-benzene
Xylenes MTBE
B-02-11 145 ND(0.1) ND(0.1) ND(0.1) ND(0.1) ND(0.1)
B-03-04.5
6.73 ND(0.1) ND(0.1) ND(0.1) 0.179 ND(0.1)
B-03-05 10.8 ND(0.005) 0.36 0.48 3.0 0.48
B-03-10RR
830 0.68 23 15 82 ND(0.005)
B-03-10 240 1.34 19 7.6 36 ND(0.005)
B-03-10RR
1,640 1.68 60 38 220 1.94J
B-03-15 3.6 ND(0.005) 0.124 0.042 0.24 1.16
B-03-19.5
4.37 ND(0.1) ND(0.1) ND(0.1) 2.04
B-03-25 ND(0.1) ND(0.005) ND(0.005) ND(0.005) ND(0.01) 0.92
B-04-10 70.9 ND(0.1) ND(0.1) ND(0.1) ND(0.1) ND(0.1)
B-04-12 ND(1.0) ND(0.1) ND(0.1) ND(0.1) ND(0.1) 0.117
B-04-13 1.3 ND(0.1) ND(0.1) ND(0.1) ND(0.1) ND(0.1)
B-04-16 ND(0.1) ND(0.1) ND(0.1) ND(0.1) ND(0.1) 2.62
B-05-08.5
9.2 ND(0.1) ND(0.1) ND(0.1) ND(0.1) ND(0.1)
B-07-13 ND(0.1) ND(0.1) ND(0.1) ND(0.1) ND(0.1) 0.153
B-08-06 2.0 ND(0.005) ND(0.005) ND(0.005) ND(0.01) 0.026
B-10-03 3.0 ND(0.005) 0.098 0.032J 0.184 0.114
B-10-07 ND(1.0) ND(0.005) 0.038J ND(0.005) 0.05 0.178
B-10-10 9.0 ND(0.005) ND(0.005) 0.126 0.198 ND(0.005)
B-10-10 7.6 ND(0.005) 0.020J 0.028J 0.046 0.102
B-10-13 45.8 ND(0.1) ND(0.1) ND(0.1) ND(0.1) ND(0.1)
B-10-16 ND(1.0) ND(0.1) ND(0.1) ND(0.1) ND(0.1) 0.347
B-10-19 ND(1.0) ND(0.005) ND(0.005) ND(0.005) 0.032 0.38
B-10-25 ND(1.0) ND(0.1) ND(0.1) ND(0.1) ND(0.1) 0.961
B-10-31 ND(1.0) ND(0.005) ND(0.005) ND(0.005) 0.022 ND(0.005)
Total # of samples
43 43 43 43 43 43
On-site
Average 74.38 0.106 2.5 1.54 8.2 0.33
B-D-0.5 ND(1.0) ND(0.1) ND(0.1) ND(0.1) 0.245 ND(0.1)
B-E-0.5 1,230 ND(0.1) ND(0.1) ND(0.1) ND(0.1) ND(0.1)
Off-site
B-G-0.5 1.56 ND(0.1) ND(0.1) ND(0.1) ND(0.1) ND(0.1)
19

B-G-07.8 2.94 ND(0.1) ND(0.1) ND(0.1) ND(0.1) ND(0.1)
B-I-07 ND(1.0) ND(0.1) ND(0.1) ND(0.1) ND(0.1) 0.178
B-J-07.8 49.2 ND(0.1) ND(0.1) ND(0.1) ND(0.1) ND(0.1)
B-K-07.6 ND(1.0) ND(0.1) ND(0.1) ND(0.1) ND(0.1) 0.232
B-N-0.5 1.48 ND(0.1) ND(0.1) ND(0.1) ND(0.1) ND(0.1)
B-O-07 102 ND(0.005) ND(0.005) ND(0.005) ND(0.005) ND(0.005)
B-O-07 49 ND(0.005) ND(0.005) ND(0.005) ND(0.005) ND(0.005)
B-P-0.5 ND(1.0) ND(0.1) ND(0.1) ND(0.1) 0.458 ND(0.1)
B-P-09.3 39.2 ND(0.1) ND(0.1) ND(0.1) ND(0.1) ND(0.1)
X-11-20 ND(1.0) ND(0.1) ND(0.1) ND(0.1) ND(0.1) 0.134
Total # of samples
67 68 68 68 68 68
Average 22.9 ND(<0.1) ND(<0.1) ND(<0.1) 0.104 0.104
CV-ingestion
100 (ESL) 10 (CREG) 10,000 (CEMEG)
5000 (CRMEG)
10,000 (CEMEG)
20,000 (CEMEG)
CV-vapor intrusion
100(ESL) 0.18(ESL) 9.3(ESL) 32(ESL) 11(ESL) 2(ESL)
CV = ATSDR comparison value THP = total petroleum hydrocarbons MTBE = methyl-tertiary-butyl ether ND = not detected at or above specified laboratory reporting limit. Values in parentheses are laboratory reportinglimits. Average = average concentrationCEMEG = chronic environmental media evaluation guideCRMEG = chronic reference dose media evaluation guideCREG = cancer risk evaluation guide for 1×10⎯6 excess cancer riskESL = environmental screening level
MTBETHP Benzene Toluene XylenesSoil Ethyl-Sample benzene
ID
20
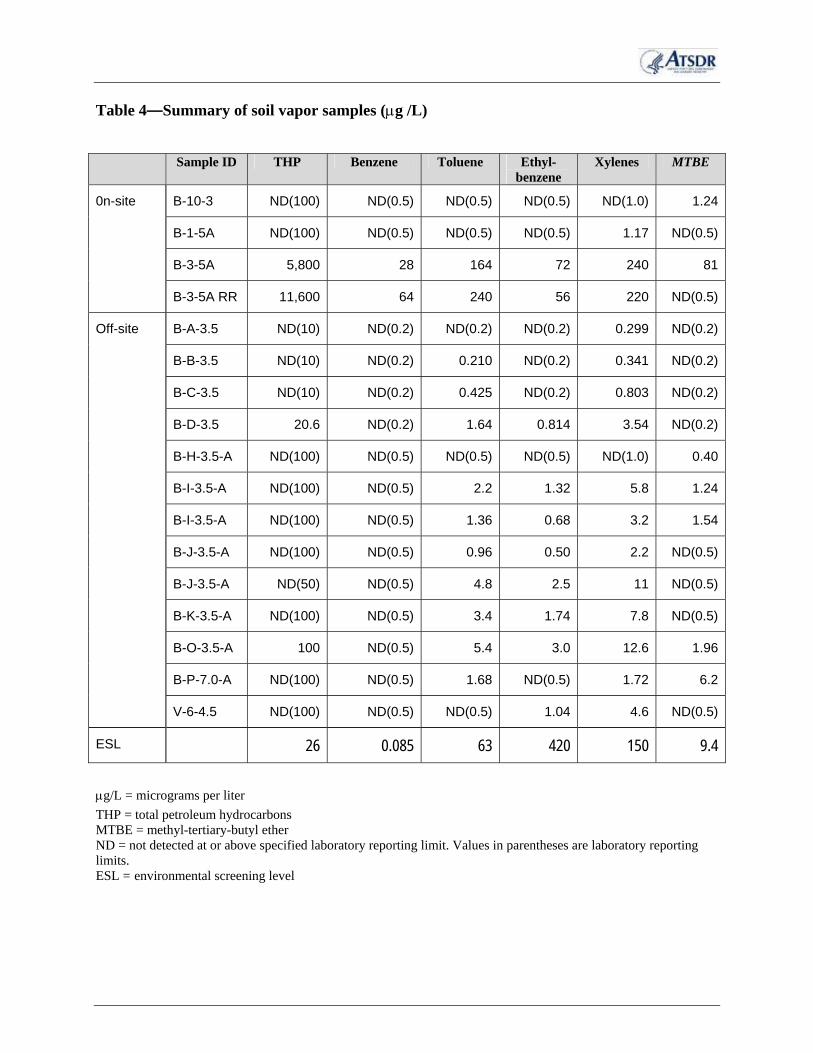
Table 4—Summary of soil vapor samples (μg /L)
Sample ID THP Benzene Toluene Ethyl-benzene
Xylenes MTBE
B-10-3 ND(100) ND(0.5) ND(0.5) ND(0.5) ND(1.0) 1.24
B-1-5A ND(100) ND(0.5) ND(0.5) ND(0.5) 1.17 ND(0.5)
B-3-5A 5,800 28 164 72 240 81
0n-site
B-3-5A RR 11,600 64 240 56 220 ND(0.5)
B-A-3.5 ND(10) ND(0.2) ND(0.2) ND(0.2) 0.299 ND(0.2)
B-B-3.5 ND(10) ND(0.2) 0.210 ND(0.2) 0.341 ND(0.2)
B-C-3.5 ND(10) ND(0.2) 0.425 ND(0.2) 0.803 ND(0.2)
B-D-3.5 20.6 ND(0.2) 1.64 0.814 3.54 ND(0.2)
B-H-3.5-A ND(100) ND(0.5) ND(0.5) ND(0.5) ND(1.0) 0.40
B-I-3.5-A ND(100) ND(0.5) 2.2 1.32 5.8 1.24
B-I-3.5-A ND(100) ND(0.5) 1.36 0.68 3.2 1.54
B-J-3.5-A ND(100) ND(0.5) 0.96 0.50 2.2 ND(0.5)
B-J-3.5-A ND(50) ND(0.5) 4.8 2.5 11 ND(0.5)
B-K-3.5-A ND(100) ND(0.5) 3.4 1.74 7.8 ND(0.5)
B-O-3.5-A 100 ND(0.5) 5.4 3.0 12.6 1.96
B-P-7.0-A ND(100) ND(0.5) 1.68 ND(0.5) 1.72 6.2
Off-site
V-6-4.5 ND(100) ND(0.5) ND(0.5) 1.04 4.6 ND(0.5)
ESL 26 0.085 63 420 150 9.4
μg/L = micrograms per liter THP = total petroleum hydrocarbons MTBE = methyl-tertiary-butyl ether ND = not detected at or above specified laboratory reporting limit. Values in parentheses are laboratory reporting limits. ESL = environmental screening level
21

Appendix A. ATSDR’s comparison values and definitions
ATSDR comparison values (CVs) are media-specific concentrations considered safe under default exposure scenario. ATSDR uses them as screening values to identify contaminants (site-specific substances) that require further evaluation to determine the potential for adverse health effects.
Generally, a chemical at a site requires further evaluation when its maximum concentration in air, water, or soil exceeds one of ATSDR’s comparison values. Comparison values are not, however, thresholds of toxicity. While concentrations at or below the relevant comparison value may reasonably be considered safe, it does not automatically follow that any environmental concentration that exceeds a comparison value would be expected to produce adverse health effects. Indeed, the purpose behind these highly conservative, health-based standards and guidelines is to enable health professionals to recognize and resolve potential public health problems before they become actual health hazards. The probability that adverse health outcomes will actually occur as a result of exposure to environmental contaminants depends on individual lifestyles and genetic factors and site-specific conditions that affect the route, magnitude, and duration of actual exposure, and not on environmental concentrations alone.
ATSDR derives screening values on the basis of noncancerous effects by dividing a NOAEL (no observed adverse effect level) by LOAELs (lowest observed adverse effect level). These levels stem from animal or human studies and include cumulative safety margins (variously called safety factors, uncertainty factors, or modifying factors) that typically range from 10 to 1,000 or more.
By contrast, cancer-based screening values come from linear extrapolations from animal data obtained at high doses because human cancer incidence data for very low levels of exposure simply do not exist, and probably never will.
Listed below are the comparison values that ATSDR uses to select chemicals for further evaluation, along with the abbreviations for the most common units of measure.
EMEG = environmental media evaluation guides
RMEG = reference dose media evaluation guide
MRLs = minimal risk levels
ppm = parts per million, e.g., mg/L or mg/kg
ppb = parts per billion, e.g., μg/L or μg/kg
parts per trillion, e.g., μg/m3
kg = kilogram (1,000 gram)
mg = milligram (0.001 gram)
μg = microgram (0.000001 gram)
L = liter
m3 = cubic meter (= 1,000 liters)
acute exposure: exposure to a chemical for a duration of 14 days or less.
A-1 1

cancer risk evaluation guide (CREG): estimated contaminant concentration in water, soil, or air that would be expected to cause no more than one excess case of cancer in a million persons exposed over a lifetime. CREGs are calculated from EPA’s cancer slope factors.
chronic exposure: exposure to a chemical for 365 days or more.
environmental media evaluation guide (EMEG): concentration of a contaminant in water, soil, or air unlikely to produce any appreciable risk of adverse, non-cancer effects over a specified duration of exposure. EMEGs are derived from ATSDR minimal risk levels by factoring in default body weights and ingestion rates. ATSDR computes separate EMEGs for acute (≤14 days), intermediate (15–364 days), and chronic (>365 days) exposures.
intermediate exposure: exposure to a chemical for a duration of 15–364 days.
lowest observed adverse effect level (LOAEL): The lowest exposure level of a chemical in a study or group of studies that produces statistically or biologically significant increase(s) in frequency or severity of adverse health effects between the exposed and control populations.
minimal risk level (MRL): estimate of daily human exposure to a hazardous substance that is not likely to pose an appreciable risk of adverse noncancer health effects over a specified route and duration of exposure.
no observed adverse effect level (NOAEL): The dose of a chemical at which no statistically orbiologically significant increases in frequency or severity of adverse health effects were seen between the exposed population and its appropriate control. Effects may be produced at this dose, but they are not considered to be adverse.
uncertainty factor (UF): a factor used in deriving the MRL or reference dose or reference concentration from exposure data.
The following comparison values were used for this health consultation:
Environmental media evaluation guide (EMEGs)
Reference dose media evaluation guide (RMEGs)
Cancer risk evaluation guides (CREGs)
EPA draft vapor intrusion guidance
California Regional Water Quality Control Board has established an environmental screening level (ESL)
A-2 2

Appendix B. ATSDR’s levels of public health hazard
Category A: Urgent Public Health Hazard
This category is used for sites where short-term exposures (<1 year) to hazardous substances or conditions could result in adverse health effects that require rapid intervention.
This determination represents a professional judgment based on critical data that ATSDR has judged sufficient to support a decision. Such a designation does not necessarily mean that the available data are complete; in some cases, additional data may be required to confirm or further support the decision made.
Criteria:
Evaluation of available relevant information* indicates that site-specific conditions orlikely exposures have had, are having, or are likely to have an adverse impact on human health that requires immediate action or intervention. Such site-specific conditions orexposures may include the presence of serious physical or safety hazards, such as open mine shafts, poorly stored or maintained flammable or explosive substances, or medical devices, which, if ruptured, could release radioactive materials.
Category B: Public Health Hazard
This category is used for sites that pose a public health hazard because of the existence of long-term exposures (>1 yr) to hazardous substances or conditions that could result in adverse health effects. This determination represents a professional judgment based on critical data that ATSDR has judged sufficient to support a decision. Such a designation does not necessarily mean that the available data are complete; in some cases, additional data may be required to confirm or further support the decision made.
Criteria: Evaluation of available relevant information* suggests that, under site-specific conditions of exposure, long-term exposures to site-specific contaminants (including radionuclides) have had, are having, or are likely to have an adverse impact on human health that requires one or more public health interventions. Such site-specific exposures may include the presence of serious physical hazards, such as open mine shafts, poorly stored or maintained flammable or explosive substances, or medical devices, which, if ruptured, could release radioactive materials.
Category C: Indeterminate Public Health Hazard
This category indicates that a professional judgment on the level of health hazard cannot be made because information critical to such a decision is lacking.
Criteria: This category is used for sites for which available critical data are insufficient with regard to the extent of exposure and/or toxicological properties at estimated exposure levels. Using professional judgment, the health assessor must determine the importance
B-1 3

of such data and the likelihood that the data can and will be obtained in a timely manner. Where some data—even limited data—are available, health assessors should, to the extent possible, select other hazard categories and support their decision with a clear narrative that explains the limits of the data and the rationale for the decision.
Category D: No Apparent Public Health Hazard
This category designates sites where human exposure to contaminated media may be occurring, may have occurred in the past, and/or may occur in the future, but the exposure is not expected to cause any adverse health effects. This determination represents a professional judgment based on critical data that ATSDR has judged sufficient to support a decision. Such a designation does not necessarily mean that the available data are complete; in some cases, additional data may be required to confirm or further support the decision made.
Criteria: Available relevant information* indicates that, under site-specific conditions of exposure, exposures to site-specific contaminants in the past, present, or future are not likely to result in adverse impact on human health.
Category E: No Public Health Hazard
This category is used for sites that, because of the absence of exposure, do not pose a public health hazard.
Criteria:
Sufficient evidence indicates that no human exposures to contaminated media have occurred, none are occurring, and none are likely to occur in the future.
* Examples include environmental, demographic, health outcome, exposure, toxicological, medical, or epidemiologic data, as well as community health concerns information.
B-2 4