health care worldwide€¦ · largest network with 111 hospitals maximum care hospitals acute care...
TRANSCRIPT

Citi - European Credit ConferenceSeptember 24, 2015 - London
Health Care Worldwide

Citi - European Credit Conference September 24, 2015 © Copyright Page 2
Safe Harbor Statement
This presentation contains forward-looking statements that are subject to various risks and uncertainties. Future results could differ materially from those described in these forward-looking statements due to certain factors, e.g. changes in business, economic and competitive conditions, regulatory reforms, results of clinical trials, foreign exchange rate fluctuations, uncertainties in litigation or investigative proceedings, and the availability of financing. Fresenius does not undertake any responsibility to update the forward-looking statements contained in this presentation.

Citi - European Credit Conference September 24, 2015 © Copyright Page 3
Agenda
Company Overview
Business Segments- Fresenius Medical Care- Fresenius Kabi- Fresenius Helios- Fresenius Vamed
Financial Overview
Financing Facilities and Debt Structure
Summary and Outlook

Company Overview

Citi - European Credit Conference September 24, 2015 © Copyright Page 5
Fresenius Group: A Global Leader in Health Care Products and Services
- Sales €25.9 bn, net income1 €2.1 bnLTM June 2015
- Strong and well-diversified portfolio
- Global presence in approx. 100 countries
- Long-term opportunities in growing, non-cyclical markets
- Leading market positions
1 – Net income incl. attributable to non-controlling interest, before one-time items
€25.9 bnEurope
40%
Asia-Pacific10%
North America43%
Latin America5%
Africa2%

Citi - European Credit Conference September 24, 2015 © Copyright Page 6
Sales LTM June-2015
EBITDA LTM June-2015
~ 31% 100% 77%4100%4
Fresenius Group: Strong and Balanced Health Care Portfolio
$16,592 m
$3,024 m
€5,612 m
€1,262 m1
€5,497 m
€787 m1
€1,107 m
€72 m
Market Cap.5 €22.3 bn
S&P:Moody‘s:Fitch:
BBB- stableBa1 stableBB+ stable
Sales LTM June-2015 €25.9 bn EBITDA LTM June-20151 €4.6 bnMarket Cap.2 €50.3 bnGroup EV3 €65.0 bn
1 – Before special items2 – Based on consolidated market capitalization of FSE and FME as of September 15, 2015 3 – Based on consolidated market capitalization of FSE and FME as September 15, 2015 and consolidated net debt as of June 30, 2015 4 – Held by Fresenius ProServe GmbH, a wholly owned subsidiary of FSE5 – Based on market cap of FME as September 15, 2015

Citi - European Credit Conference September 24, 2015 © Copyright Page 7
2010 2011 2012 2013 2014 LTMJune2015
€mSales 5-year CAGR: 10%
EBIT1
5-year CAGR: 8%
Net Income1,2
5-year CAGR: 11%
Fresenius Group: Financial Results
2010 20122011 20142013
1 – Before special items2 – Incl. attributable to non-controlling interest3 – 2011 sales were adjusted by -€161m according to a U.S. GAAP accounting change. This solely relates to Fresenius Medical Care North America.
+5% cc
+6% cc
+7% cc
15,972
20,331
2,418
3,045
1,243
1,778
16,361
2,563
1,408
19,290
3,075
1,707
25,927
3,577
2,094
23,231
3,158
1,831
LTM June 2015
3

Citi - European Credit Conference September 24, 2015 © Copyright Page 8
9%
7%
8%
6%
3%
6%
7%
9%
6%
8% 8%
7%
4%
6%
4% 4%
6%
1999 2000 2001 2002 2003 2004 2005 2006 2007 2008 2009 2010 2011 2012 2013 2014 LTMJune2015
Fresenius Group: Organic Growth 1999 – 2015
Target:> 2x World GDP
Growth

Citi - European Credit Conference September 24, 2015 © Copyright Page 9
5%
7%
5%4%
5%
3%4% 4%
2008 2009 2010 2011 2012 2013 2014 LTMJune2015
9%8%
12%
9% 9%
5% 4%
7%
2008 2009 2010 2011 2012 2013 2014 LTM2015June
Fresenius Helios
Fresenius Group:Sustainable Organic Sales Growth in all Business Segments
Fresenius Kabi
Fresenius Vamed
Fresenius Medical Care
7%8%
6%
2%
5% 5% 5%7%
2008 2009 2010 2011 2012 2013 2014 LTMJune2015
25%
15% 15%
4% 5%
13%
0%
9%
2008 2009 2010 2011 2012 2013 2014 LTMJune20151 – Due to project delays in Russia and Ukraine
1

Citi - European Credit Conference September 24, 2015 © Copyright Page 10
Fresenius Group: Financial Results
H1/15 H1/14
SalesGrowth ccGrowth actual rates
€13,429 m13%25%
€10,733 m
EBIT1
Growth ccGrowth actual rates
€1,822 m15%30%
€1,403 m
Net income1,2
Growth ccGrowth actual rates
€1,051 m18%33%
€788 m
1 – Before special items2 – Incl. attributable to non-controlling interest

Citi - European Credit Conference September 24, 2015 © Copyright Page 11
Fresenius Group:Financial Results by Business Segment
1 – Before special items
H1/2015 FreseniusMedical Care
FreseniusKabi
FreseniusHelios
FreseniusVamed
SalesGrowth
$8,159 m 10%
€2,932 m19%
€2,774 m10%
€463 m16%
EBIT1
Growth$1,051 m
5%€571 m39%
€307 m23%
€16 m 7%

Business Segments

Citi - European Credit Conference September 24, 2015 © Copyright Page 13
1970 1980 1990 2000 2010 2020E
Fresenius Medical Care: Global Market Leader in Dialysis
~3.8
2.0
0.9
0.5
0.10.01
Patients in million
Industry Dynamics
~6% global patient growth p.a.~3.8 million patients by 2020 expected
- World leader in dialysis products and services
treating 289,610 patients in 3,421 clinics worldwide1
- Provide highest standard of patient care
- Vertical integration- High quality products & services- Complete therapy offerings
- Leader in growing market
- Dialysis market growing 4% cc and estimated to reach around $100 bn by 2020
- Patient growth driven by age, life style and mortality reduction
1 – As of June 30, 2015

Citi - European Credit Conference September 24, 2015 © Copyright Page 14
Europe, Middle East, AfricaProvider Patients Countries
53,550 25
21,300 15
18,800 1
13,900 18
6,900 1
3,590 4
2,660 3
Asia PacificProvider Patients Countries
26,020 12
5,100 1
4,000 1
3,880 5
1,830 5
340 1
North AmericaProvider Patients Countries
177,720 2
176,200 1
16,050 1
14,800 1
12,250 1
7,430 1Other
7%
Latin AmericaProvider Patients Countries
32,320 8
8,990 2
4,400 3
2,370 1
930 1
Fresenius Medical Care:Market Leader in All Regions1
1 – Company data and estimates, as of June 30, 2015

Citi - European Credit Conference September 24, 2015 © Copyright Page 15
€ million Q1/2013 Q1/2012 Growth
Total Sales 8,159 7,398 +10%1
EBITDA 1,408 1,337 +5%
EBITDA margin 17.3% 18.1%
EBIT 1,051 1,001 +5%
EBIT margin 12.9% 13.5%
Net income2 450 439 +3%
Fresenius Medical Care: Key Figures H1/2015
1 – 8% organic growth, 9% acquisitions, -1% divestitures, -6% currency effects2 – Net Income attributable to shareholders of Fresenius Medical Care AG & Co. KGaA
$ million H1/2015 H1/2014 Growth

Citi - European Credit Conference September 24, 2015 © Copyright Page 16
$ million H1/2015 H1/2014
Operating Cash Flow
Operating Cash Flow Margin
Capex (net)
Free Cash Flow(before acquisitions and dividends)
Free Cash Flow Margin
Free Cash Flow(after acquisitions and investments)
832
10.2%
-411
421
5.2%
355
562
7.6%
-415
147
2.0%
-285
Fresenius Medical Care: Cash Flow H1/2015

Citi - European Credit Conference September 24, 2015 © Copyright Page 17
2013
Debt/EBITDATotal debt $ million
2.8
9,532
H1/2015
2013
2014
2014
9,270 3.1
H1 2015
3.08,417
Fresenius Medical Care:Leverage Ratio and Ratings
Current Ratings S&P Moody‘s Fitch
Company BBB- Ba1 BB+
Outlook stable stable stable

Citi - European Credit Conference September 24, 2015 © Copyright Page 18
- Comprehensive product portfolio for critically and chronically ill patients
- IV Drugs- Clinical Nutrition- Infusion Therapy- Medical Devices / Transfusion Technology
- Global addressable market: >€29 bn
- Leading market positions
- Focus on organic growth driven by geographic product rollout and robust product pipeline
- Aim to expand the business through selective acquisitions
Fresenius Kabi: A Worldwide Leading Hospital Supplier
Emerging markets€1,672 m
Europe€2,130 m
North America€1,810 m
30%
38%
32%
LTM June 2015 Sales by Region
€5.6 bn

Citi - European Credit Conference September 24, 2015 © Copyright Page 19
2,495
3,086
3,6723,964
4,539
4,996 5,146
5,612
2008 2009 2010 2011 2012 2013 2014 LTMJune2015
EBITDA1 in € m
Fresenius Kabi: Strong Growth Track Record & High Profitability
CAGR12%
CAGR13%
1 – Before special items
Sales in € m EBITDA Margin (in %)
544
742
893955
1.1011.143
1.084
1.262
2008 2009 2010 2011 2012 2013 2014 LTMJune2015
22%
24% 24% 24% 24%23%
21%22%
2008 2009 2010 2011 2012 2013 2014 LTMJune2015

Citi - European Credit Conference September 24, 2015 © Copyright Page 20
€ million H1/2015 H1/2014 Growth
Sales 2,932 2,466 +19%
- I.V. Drugs 1,191 868 +37%- Clinical Nutrition 772 662 +17%- Infusion Therapy 468 476 -2% - Medical Devices/ Transfusion Technology 501 460 +9%
EBITDA 691 513 +35%EBITDA margin 23.6% 20.8%
EBIT 571 411 +39% EBIT margin 19.5% 16.7%
Net income 309 217 +42%
Fresenius Kabi: Key Figures H1/2015
2
3
2
1
1 – 8% organic growth, 1% acquisitions, -1% divestitures, 11% currency effects2 – Before special items3 – Net income attributable to shareholders of Fresenius Kabi AG; before special items

Citi - European Credit Conference September 24, 2015 © Copyright Page 21
Fresenius Helios: Leading Hospital Operator in Germany
- German Acute Care Hospital Market: ~€87 bn1, thereof 18% privatized
- 6% share in German Acute Care Hospital Market
- High-quality medical care, e.g., mortality rate for heart failure and pneumonia lower than German average (-30%), quality management system, transparency of medical outcomes
- Strong track record in hospital operations and acquisitions: targeting 12 − 15% EBIT margin within 6 years per individual clinic location
- Negligible bad debt ratio due to comprehensivepopulation insurance coverage
Largest Network with 111 Hospitals
Maximum care hospitalsAcute care hospitalsAcute care hospitals/post-acute care clinicsPost-acute care clinicsCompany headquarters
1 – German Federal Statistical Office 2014; total costs, gross ofthe German hospitals less academic research and teaching

Citi - European Credit Conference September 24, 2015 © Copyright Page 22
251286
318369
432
508
732787
2008 2009 2010 2011 2012 2013 2014 LTMJune2015
2,123 2,416 2,520 2,665
3,200 3,393
5,244 5,497
2008 2009 2010 2011 2012 2013 2014 LTMJune2015
Fresenius Helios: Strong Growth Track Record & Increased Profitability
CAGR18%
CAGR15%
Sales in € m EBITDA1 in € m
1 – Before special items

Citi - European Credit Conference September 24, 2015 © Copyright Page 23
€ million H1/2015 H1/2014 Growth
Sales 2,774 2,521 +10%
EBITDA2 399 344 +16%
EBITDA margin 14.4% 13.6%
EBIT2 307 250 +23%
EBIT margin 11.1% 9.9%
Net income 226 179 +26%
Fresenius Helios: Key Figures H1/2015
1 – 3% organic growth, 8% acquisitions, -1% divestitures 2 – Before special items3 – Net income attributable to shareholders of HELIOS Kliniken GmbH; before special items
1
3

Citi - European Credit Conference September 24, 2015 © Copyright Page 24
Fresenius Vamed: A Leading Global Specialist in Hospital Projects and Services
- Specialized in project development building hospital infrastructure and providing hospital services (technical services and operational management)
- Track record: - >710 health care projects in 77 countries
successfully completed - Services provided to 510 hospitals and
130,000 beds globally
- Continuous demand for hospital infrastructure and operating efficiency; key markets Europe, Asia-Pacific, Africa
Services€520 m
47%
Projects€587 m
53%
LTM June 2015 Sales by Business
€1,107 m

Financial Overview
Citi - European Credit Conference September 24, 2015 © Copyright Page 26
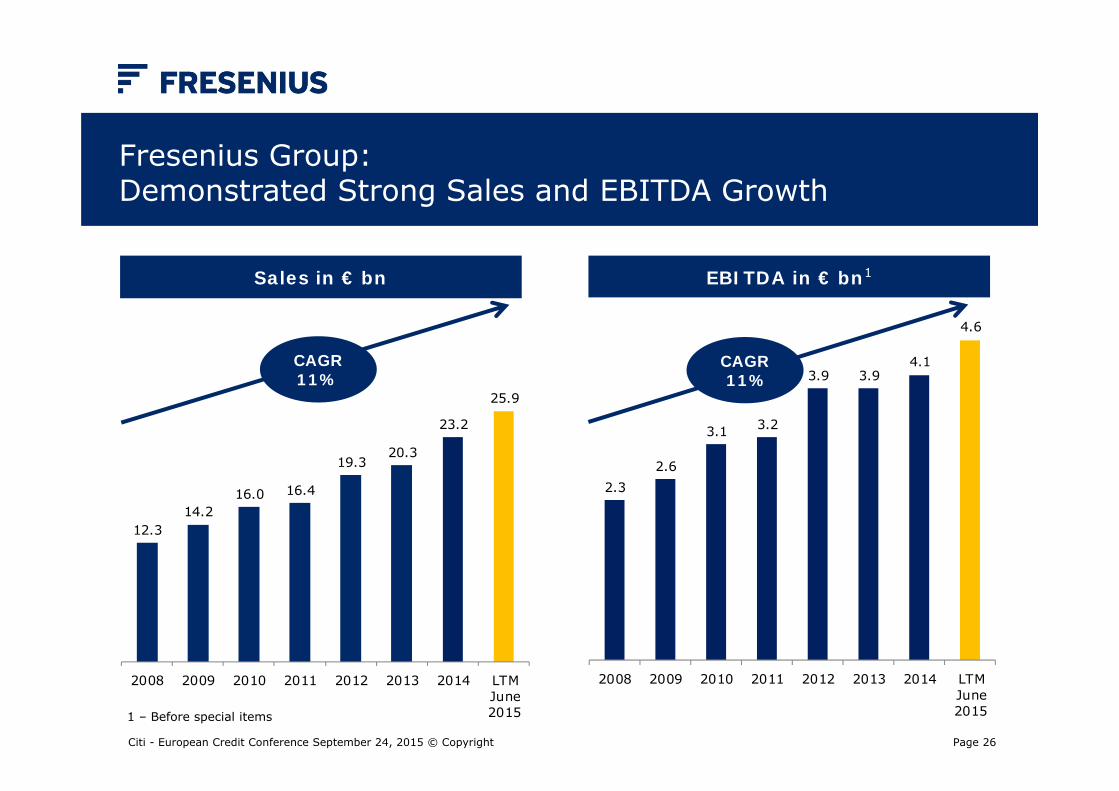
12.314.2
16.0 16.4
19.320.3
23.2
25.9
2008 2009 2010 2011 2012 2013 2014 LTMJune2015
Fresenius Group: Demonstrated Strong Sales and EBITDA Growth
CAGR11%
CAGR10%
Sales in € bn EBITDA in € bn1
1 – Before special items
2.32.6
3.1 3.2
3.9 3.94.1
4.6
2008 2009 2010 2011 2012 2013 2014 LTMJune2015
CAGR11%

Citi - European Credit Conference September 24, 2015 © Copyright Page 27
H1/2015 H1/2014 Change Change€ million actual constant
rates rates
Sales 13,429 10,733 +25% +13%1
EBITDA2 2,364 1,854 +28% +13%
EBIT2 1,822 1,403 +30% +15%
Interest, net -330 - 283 -17% -4%
EBT2 1,492 1,120 +33% +18%
Taxes -441 -332 -33% -16%
Net income3,4 1,051 788 +33% +18%
Employees 220,339 209,933
Fresenius Group: Key Figures H1/2015
1 – 7% organic growth, 7% acquisitions, -1% divestitures2 – Before special items3 – Net income attributable to shareholders of Fresenius SE & Co. KGaA; before special items4 – Incl. attributable to non-controlling interest
2

Citi - European Credit Conference September 24, 2015 © Copyright Page 28
Fresenius Group:Cash Flow Development LTM
€ million Operating CF Capex (net) Free Cash Flow1
LTM H1/15 LTM Margin LTM H1/15 LTM H1/15 LTM H1/15 LTM Margin
780
584
9
-24
1,349
1,737
13.9%
10.6%
0.8%
n.a.
11.7%
12.9%
-354
-261
-12
-11
-638
-758
-6.3%
-4.7%
-1.1%
n.a.
-5.2%
-5.6%
426
323
-3
-35
711
979
7.6%
5.9%
-0.3%
n.a.
6.5%
7.3%
3,086 11.9% -1,396 -5.4% 1,690 6.5%
Corporate/Other
excl. FMC
2 2
3
Group
1 – Before acquisitions and dividends 3 – Understated: 6.8% excluding €53 million of capex commitments from acquisitions2 – Margin incl. FMC dividend
Margin = in % of sales

Citi - European Credit Conference September 24, 2015 © Copyright Page 29
3.2x
3.0x
2.7x
2.2x 2.3x
3.5x
3.0x
2.6x
3.6x
3.0x
2.6x
2.8x
2.6x 2.5x
3.4x 3.4x
3.2x
2001 2002 2003 2004 2005 Q1/06(1)
2006(1)
2007 2008(1)
2009 2010 2011 2012(1)
2013(1)
2014(1)
Q1/15(1)
Q2/15(1)
Fresenius Group: Proven Track Record of Deleveraging
1 – Pro forma acquisitions; before special items2 – At annual average exchange rates for both net debt and EBITDA; without major acquisitions; before special items
Acquisitionof Renal
Care Group
Acquisitionof APP
Pharmaceuticals
Acquisitionof hospitals
from Rhön-Klinikum
Target 2015YE:
~3.02

Citi - European Credit Conference September 24, 2015 © Copyright Page 30
Fresenius Group: Debt and Interest Ratios
1 - Pro forma including Fresenius Medical Care acquisitions; excluding two HELIOS hospitals 2 - Before integration costs, disposal gains (two HELIOS hospitals) and costs for Fresenius Kabi efficiency program3 - Before integration costs and disposal gains (two HELIOS hospitals; Rhön stake) 4 - Pro forma including acquired Rhön hospitals and Fresenius Medical Care acquisitions; excluding two HELIOS hospitals 5 - At annual average exchange rates for both net debt and EBITDA; without major acquisitions; before special items
Jun 30,2015
Dec 31,2014
Debt (€m)thereof 51% $ denominated
15,661 15,454
Net debt (€m) 14,744 14,279
Net debt/EBITDA 3.191,2 3.413,4
EBITDA/Interest 7.22 6.83at actualat annual average FX rates
2.60
3.07
2.72
2.57
3.26
3.12
2.63
3.07
YE/09 YE/10 YE/11 YE/12 YE/13 YE/14 Q1/15 Q2/15
Target 2015 YE:~3.05
Net debt/EBITDA

Financing Facilities and Debt Structure

Citi - European Credit Conference September 24, 2015 © Copyright Page 32
1 – External debt as of June 30, 20152 – Incl. Fresenius Finance B.V. and other financing subsidiaries3 – Controlling stake
Fresenius Group:Current Debt and Cash Flow Structure - June 30, 2015
Profit transferAgreements,UpstreamGuarantee
Profit transferAgreements,UpstreamGuarantee
100% 100%4
Market Value~ €6.7 bn
€6,940 m Net Debt2
€7,765 m Net Debt5
Fresenius Medical Care Financing Fresenius SE Financing
€140 m Net Debt5- €67 m Net Debt5
€14,744 m Total Net Debt1
Profit transferAgreements,UpstreamGuarantee
77%4
- €34 m Net Debt5
~31%3
Total Net Debt€7.0 bn
4 – As held by Fresenius ProServe GmbH, a wholly owned subsidiary of Fresenius SE & Co. KGaA, which provides the guarantees
5 – Incl. subsidiaries

Citi - European Credit Conference September 24, 2015 © Copyright Page 33
1 - Pro Forma Senior Notes Issuance, US$ 300 million, as of September 25, 20152 - Net of Cash and intercompany adjustments3 - Based on market capitalization for FSE and FMC as of September 15, 20154 - Before special items 5 - Exchange rate as of June 30, 2015, except for market capitalization which uses exchange rate as of September 15, 2015
Fresenius Group: Capitalization - June 30, 2015 & Pro Forma1
Q2-2015adjusted for
September Issuance
€ million $ million 5 € million $ million 5 % of total cap
EBITDA LTM x
FSE 2013 Credit Agreement: Term Loan A 1,858 2,079 1,858 2,079 2.9%FSE 2013 Credit Agreement: Term Loan B 439 491 439 491 0.7%Senior Notes 3,187 3,566 2,465 2,758 3.8%New Senior Notes 268 300 0.4%Convertible Bonds 464 519 464 519 0.7%Euro Notes 917 1,026 917 1,026 1.4%Commercial Paper 130 145 584 653 0.9%Other debt, gross 381 426 381 426 0.6%
Total Debt (FSE excl. FMC), gross 7,376 8,253 7,376 8,253 11.5%Cash (excl. FMC) 397 444 397 444 0.6%
Total debt (FSE excl. FMC), net 6,979 7,809 6,979 7,809 10.9%
Total FMC debt, net2 7,765 8,688 7,765 8,688 12.1%
Total consolidated debt, net 14,744 16,497 14,744 16,497 23.0% 3.2x 3
Market capitalization3 50,286 56,924 50,286 56,924 77.0% 10.9x
Total capitalization 65,030 73,421 65,030 73,421 100.0% 14.1x FSE Group EBITDA4 4,605

Citi - European Credit Conference September 24, 2015 © Copyright Page 34
392 500848
1,069
500
986700
400113
227227
227
1,967
356448
0
400
800
1,200
1,600
2,000
2,400
2,800
3,200
2015 2016 2017 2018 2019 2020 2021 2022 2023 2024
$ m
illio
n
Senior Notes Euro Notes (Schuldscheindarlehen) Credit Agreement AR/Facility Equity-neutral convertible bonds
Fresenius Medical Care:Debt Maturity Profile - June 30, 2015
1 – Based on utilization of major financing instruments
Maturity 4.0 years on
average
1

Citi - European Credit Conference September 24, 2015 © Copyright Page 35
800
500718
268450
108 125
401
263
21105
211 211
211
630930
500
405
0
200
400
600
800
1.000
1.200
1.400
1.600
1.800
2.000
2015 2016 2017 2018 2019 2020 2021 2022 2023 2024
€m
illio
n
Senior Notes Euro Notes (Schuldscheindarlehen) Credit Agreement Equity-neutral convertible bonds Commercial Papers
Maturity 3.9 years on
average
Fresenius Group excl. FMC: Debt Maturity Profile1 - June 30, 2015 Pro Forma2
1 – Based on utilization of major financing instruments2 – Pro Forma Senior Notes Issuance, US$ 300 million, as of September 25, 20153 – Further long-term refinancing planned
New Notes: $300m
179 3

Citi - European Credit Conference September 24, 2015 © Copyright Page 36
0
200
400
600
800
1.000
1.200
1.400
1.600
1.800
2.000
2.200
2.400
2.600
2.800
3.000
2015 2016 2017 2018 2019 2020 2021 2022 2023 2024
€m
illio
n
Fresenius Medical Care Fresenius excl. Fresenius Medical Care
Fresenius Group: Debt Maturity Profile1 - June 30, 2015 Pro Forma2
New Notes: $300m
Maturity 4.0 years on
average
1 – Based on utilization of major financing instruments2 – Pro Forma Senior Notes Issuance, US$ 300 million, as of September 25, 2015

Summary and Outlook

Citi - European Credit Conference September 24, 2015 © Copyright Page 38
Fresenius Medical Care: Financial Outlook
2015E2016
Projection
Sales 5-7%10-12%cc
7-10% cc
Net Income 0-5% 15 -20%
- The 2015 outlook and the projections for 2016 are based on current exchange rates and include savings from the Global Efficiency Program
- Potential acquisitions are not included
- The outlook is based on the execution and the operating cost investments within Care Coordination - in line with our 2020 strategy
- Topline revenue alignment for 2016 since we expect some of the initiatives in Care Coordination operations to be delayed into the following years
Citi - European Credit Conference September 24, 2015 © Copyright Page 39
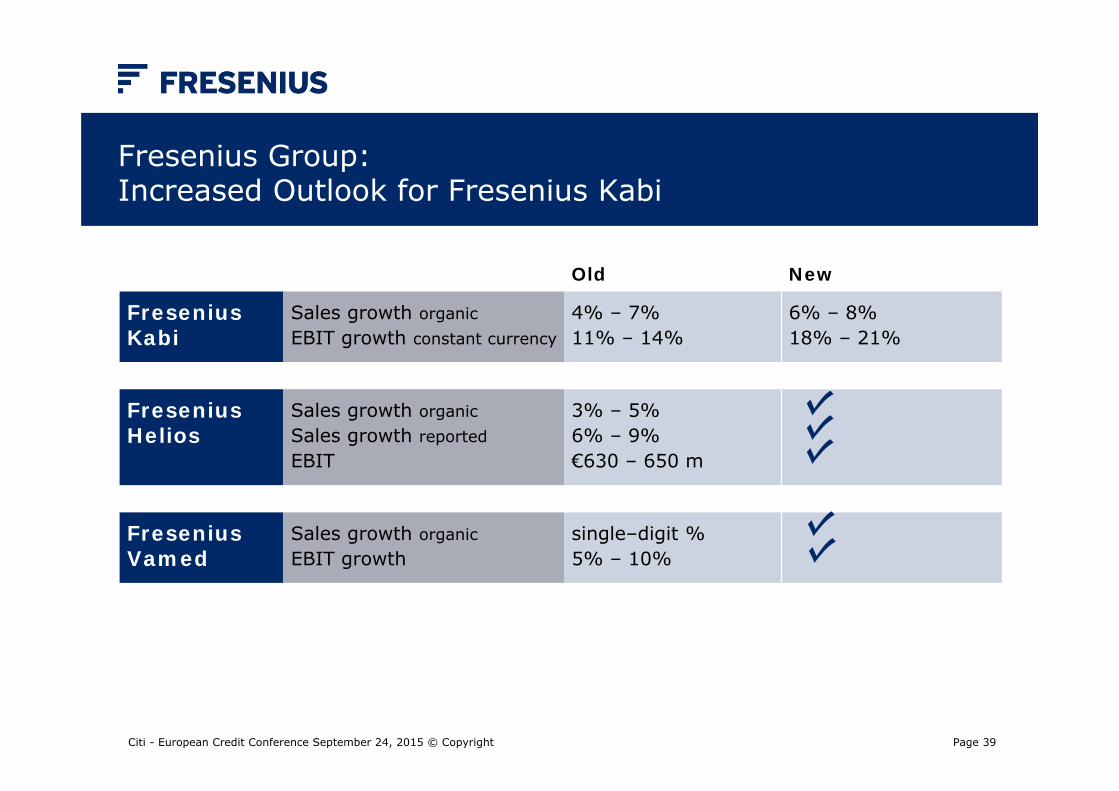
Fresenius Group: Increased Outlook for Fresenius Kabi
Old New
FreseniusKabi
Sales growth organicEBIT growth constant currency
4% – 7%11% – 14%
6% – 8%18% – 21%
FreseniusHelios
Sales growth organicSales growth reportedEBIT
3% – 5%6% – 9%€630 – 650 m
FreseniusVamed
Sales growth organicEBIT growth
single–digit %5% – 10%

Citi - European Credit Conference September 24, 2015 © Copyright Page 40
Fresenius Group: Increased Earnings Guidance
Old New
Revenue growthat constant currency
7% ‒ 10% 8% ‒ 10%
Net income growth1
at constant currency13% – 16% 18% – 21%
1 - Net income attributable to shareholders of Fresenius SE & Co. KGaA; 2015 before integration costs for hospitals of Rhön-Klinikum AG (~€10 m before tax), before costs for efficiency program at Fresenius Kabi (~€100 m before tax) and disposal gains from the divestment of two HELIOS hospitals (€34 m before tax); 2014 before special items

Citi - European Credit Conference September 24, 2015 © Copyright Page 41
Aging population and higher incidence of chronic diseasesWorld population aged 60+ will more than double by 2050 to >2 bn (OECD)
Continuing growth of genericsApprox. $19 bn branded IV drug sales (base: 2013) go off-patentin the U.S. by 2023
Increasing health care spending in emerging marketsIncreasing health care coverage and per capita spending (e.g. India: $157, China: $480, vs. USA: $8,895; WHO)
Rise of private providers in health care servicesFurther privatization of German hospital marketGlobal opportunity to provide dialysis services (e.g. China, India)
Fresenius Group: Ideal Strategic Posture to Benefit from Major Healthcare Trends
Citi - European Credit Conference September 24, 2015 © Copyright Page 42
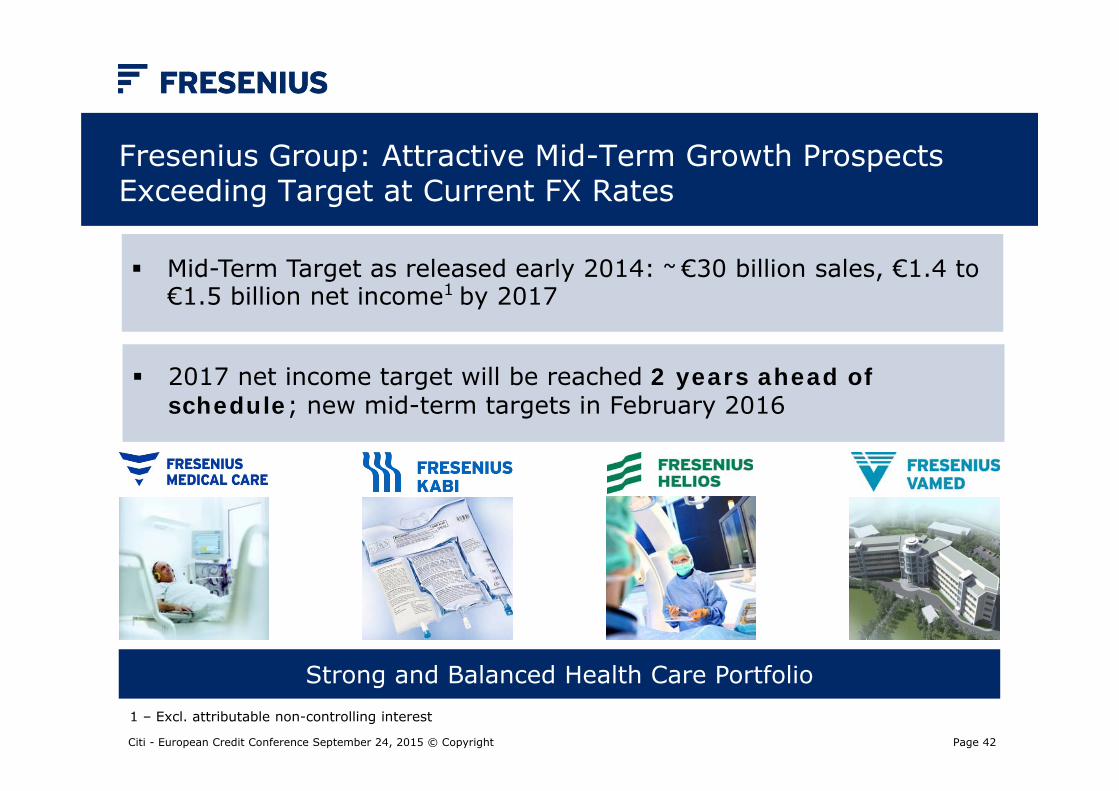
Mid-Term Target as released early 2014: ~ €30 billion sales, €1.4 to €1.5 billion net income1 by 2017
Fresenius Group: Attractive Mid-Term Growth Prospects Exceeding Target at Current FX Rates
Strong and Balanced Health Care Portfolio1 – Excl. attributable non-controlling interest
2017 net income target will be reached 2 years ahead ofschedule; new mid-term targets in February 2016

Citi - European Credit Conference September 24, 2015 © Copyright Page 43
Fresenius Group:Investment Highlights
Clear track record of and commitment to de-leveraging
Strong financial performance and cash flow generation
Leading market positions
Diversified revenue base with four strong business segments
Proven ability to integrate acquisitions
Global presence in growing, non-cyclical markets

Health Care Worldwide