health care quality indicators project initial indicators ... · health care quality indicators...
TRANSCRIPT
DELSA/HEA/WD/HWP(2006)2
OECD HEALTH WORKING PAPERS
HEALTH CARE QUALITY INDICATORS PROJECT
INITIAL INDICATORS REPORT
Soeren Mattke, Edward Kelley, Peter Scherer, Jeremy Hurst, Maria Luisa Gil Lapetra and the HCQI Expert Group Members
22
Unclassified DELSA/HEA/WD/HWP(2006)2 Organisation de Coopération et de Développement Economiques Organisation for Economic Co-operation and Development 09-Mar-2006 ___________________________________________________________________________________________
English text only DIRECTORATE FOR EMPLOYMENT, LABOUR AND SOCIAL AFFAIRS GROUP ON HEALTH
Health Working Papers
OECD HEALTH WORKING PAPERS NO. 22 HEALTH CARE QUALITY INDICATORS PROJECT INITIAL INDICATORS REPORT
Soeren Mattke, Edward Kelley, Peter Scherer, Jeremy Hurst, Maria Luisa Gil Lapetra and the HCQI Expert Group Members
JT03205353
Document complet disponible sur OLIS dans son format d'origine Complete document available on OLIS in its original format
DE
LSA
/HE
A/W
D/H
WP(2006)2
Unclassified
English text only
DELSA/HEA/WD/HWP(2006)2
2
ACKNOWLEDGEMENTS
1. The Health Care Quality Indicators Project was guided by an expert group made up of representatives from OECD countries participating in the project. Presently, this group includes representatives from 23 countries. This group was chaired by Arnie Epstein (Harvard University). The countries listed below who make up the HCQI Expert Group.
• Australia
• Austria
• Canada
• Czech Republic
• Denmark
• Finland
• France
• Germany
• Iceland
• Ireland
• Italy
• Japan
• Mexico
• Netherlands
• New Zealand
• Norway
• Portugal
• Slovak Republic
• Spain
• Sweden
• Switzerland
• United Kingdom
• United States
2. The authors would like to acknowledge the input provided by Peter Hussey, Elizabeth Coté, Leighna Kim, Emily Rosenoff and Sandra Garcia Armesto in the many reviews and improvements made to this paper during its production. We would also like to recognise the technical support provided by Gaëlle Balestat and Lihan Wei as well as the leadership of Victoria Braithwaite in the production of this working paper.
3. The OECD Secretariat would also like to acknowledge that the HCQI Project was in part supported by The Commonwealth Fund, a national, private foundation based in New York City that supports independent research on health and social issues. The views presented here are those of the authors and not necessarily those of The Commonwealth Fund, its director, officers, or staff.
DELSA/HEA/WD/HWP(2006)2
3
SUMMARY
4. The OECD Health Care Quality Indicator (HCQI) Project was started in 2001. The long-term objective of the HCQI Project is to develop a set of indicators that can be used to raise questions for further investigation concerning quality of health care across countries. It was envisioned that the indicators that were finally recommended for inclusion in the HCQI measure set would be scientifically sound, important at a clinical and policy level and feasible to collect in that data would be available and could be made comparable across countries. It was also envisioned that the indicators would not enable any judgement to be made on the overall performance of whole health systems. In essence, they should be used as the basis for investigation to understand why differences exist and what can be done to reduce those differences and improve care in all countries.
5. The HCQI project has built on two pre-existing international collaborations organised by the Commonwealth Fund of New York (five countries) and The Nordic Minister Council Working Group on Quality Measurement (six countries).1 It now involves 23 countries and has spanned nearly four years of work. All of the original 23 participating countries, with one exception, have remained active participants through the course of the project.
6. The project has been divided into two phases. The initial phase, for which this report serves as the summary report, concentrated on 17 important and readily available indicators of effectiveness of care. Currently, all of the participating countries with one exception have submitted data on at least five of these indicators and twelve of the seventeen indicators have data from 15 countries or more. Future indicators to be considered in the second phase of work will consider a broader set of clinical conditions and other dimensions of health care quality.
7. Part I of this report summarises the purpose and history of the project, the methods employed and the results attained.
8. Part II of this report summarises findings from detailed analysis carried out by the OECD in the Spring and Summer 2005 on a set of five questions posed by country experts during the December 2004 HCQI Expert Group meeting in Paris. These data-based questions focus on data comparability issues across countries on particular indicators. These questions are listed below and are summarised in a research format in Part II.
• What is the appropriate reference population for age adjustment? • What is the impact of different policies for handling missing data? • What is the impact of notification policies on cases of vaccine-preventable disease? • What is the impact of variation in coding practices (for asthma)? • What is the effect of unique identifiers when dealing with mortality rates?
9. Part III of this report reviews the detailed information on scientific soundness, importance, availability of data and the international comparability of the data for indicators recommended for inclusion in an initial OECD Health Care Quality Indicators set. The paper also reviews in detail those indicators that are not currently recommended for inclusion in an initial indicator set. This paper, therefore, presents two
1. The Commonwealth Fund’s International Working Group on Quality Indicators included the United States,
the United Kingdom, Canada, Australia and New Zealand. The Nordic Minister Council Working Group on Quality Measurement includes Greenland, Sweden, Norway, Finland, Iceland and Denmark
DELSA/HEA/WD/HWP(2006)2
4
groups of indicators, those recommended for retention and those not recommended for retention. Indicators that are not currently being recommended for retention are not necessarily being recommended for exclusion from future OECD HCQI consideration. A number of these indicators are generally viewed as scientifically sound, however data availability and comparability may not be up to standard currently. Therefore these indictors are not currently appropriate for international comparisons. The indicators recommended for retention in an initial HCQI indicator set are listed below.
• Breast Cancer Survival • Mammography Screening • Cervical Cancer Survival • Cervical Cancer Screening • Colorectal Cancer Survival • Incidence of Vaccine Preventable Diseases • Coverage for basic vaccination • Asthma mortality rate • AMI 30-day case fatality rate • Stroke 30-day case fatality rate • Waiting time for femur fracture surgery • Influenza vaccination for adults over 65 • Smoking rates
DELSA/HEA/WD/HWP(2006)2
5
RESUME
10. Le projet de l’OCDE sur les indicateurs de la qualité des soins de santé (HCQI) a été lancé en 2001. Son objectif à long terme est d’élaborer un ensemble d’indicateurs qui puissent être utilisés pour déterminer de nouvelles pistes de recherche sur la qualité des soins dans les pays de l’OCDE. Les indicateurs devant finalement être recommandés pour faire partie de cet ensemble d’indicateurs doivent en principe être pertinents du point de vue scientifique et importants sur le plan clinique et stratégique, et leur collecte réalisable dans la pratique au sens où les données y afférentes doivent être disponibles et comparables à l’échelon international. Ces indicateurs ne sont pas non plus censés permettre de porter un jugement sur la performance globale des systèmes de santé dans leur intégralité. Ils devraient essentiellement être utilisés comme point de départ pour comprendre pourquoi des différences existent et par quels moyens les réduire et améliorer les soins de santé dans tous les pays.
11. Le projet HCQI s’est appuyé sur deux initiatives internationales préexistantes de coopération lancées respectivement par le Commonwealth Fund of New-York (cinq pays) et le Groupe de travail du Conseil nordique des ministres sur l’évaluation de la qualité (six pays2). Il porte aujourd’hui sur 23 pays et dure depuis près de quatre ans. A une exception près, ces 23 pays participants contribuent tous activement aux travaux depuis le début du projet.
12. Le projet est divisé en deux phases. La première, dont le présent rapport présente une synthèse, a été axée sur 17 indicateurs importants et facilement accessibles de l’efficacité des soins. A ce jour, tous les pays participants, à une exception près, ont communiqué des données sur au moins cinq de ces indicateurs, et 15 pays ou plus ont fourni des données pour douze d’entre eux. Les indicateurs qui seront pris en compte dans la deuxième phase des travaux porteront sur un éventail plus large d’affections cliniques et d’aspects de la qualité des soins de santé.
13. La partie I du rapport présente l’objet et l’historique du projet, les méthodes utilisées et les résultats obtenus.
14. La partie II fait une synthèse des conclusions des analyses approfondies réalisées par l’OCDE au cours du printemps et de l’été 2005 sur un ensemble de cinq questions posées par les experts nationaux lors de la réunion qu’ils ont tenue en décembre 2004 à Paris. Ces questions concernant les données portent sur des problèmes de comparabilité entre les pays pour des indicateurs particuliers. Elles sont présentées ci-après et les réponses sont résumées dans la partie II.
• Quelle est la population de référence appropriée pour l’ajustement selon l’âge ?
• Quelle est l’incidence des différentes politiques en matière de données manquantes ?
2. Le Groupe de travail international du Commonwealth Fund sur les indicateurs de la qualité comprenait les
Etats-Unis, le Royaume-Uni, le Canada, l’Australie et la Nouvelle-Zélande. Le Groupe de travail du Conseil nordique des ministres sur l’évaluation de la qualité comprend le Groenland, la Suède, la Norvège, la Finlande, l’Islande et le Danemark.
DELSA/HEA/WD/HWP(2006)2
6
• Quelle est l’incidence des politiques de notification sur les cas de maladies pouvant être prévenues par la vaccination ?
• Quelles est l’incidence des différences de pratiques en matière de codage (dans le cas de l’asthme) ?
• Quelle est l’incidence des identificateurs uniques lorsque l’on traite des taux de mortalité ?
15. La partie III du rapport présente des informations détaillées sur la pertinence scientifique et l’importance des indicateurs dont l’inclusion dans l’ensemble initial d’indicateurs de la qualité des soins de santé de l’OCDE a été recommandée, la disponibilité des données y afférentes et leur comparabilité au niveau international. Le document examine aussi en détail les indicateurs dont l’intégration dans cet ensemble initial n’est actuellement pas recommandée. On y présente donc deux groupes d’indicateurs, ceux qu’il a été recommandé de retenir et ceux dont la prise en compte n’est pas recommandée. Ces derniers ne sont pas pour autant définitivement écartés. Plusieurs d’entre eux sont généralement considérés comme pertinents sur le plan scientifique, mais pour le moment, la disponibilité et la comparabilité des données qui s’y rapportent ne sont pas nécessairement tout-à-fait satisfaisantes. Par conséquent, ces indicateurs ne se prêtent pas actuellement à la comparaison internationale. Il a été recommandé de faire figurer dans la liste initiale du projet HCQI les indicateurs suivants :
• Taux de survie au cancer du sein
• Dépistage par mammographie
• Taux de survie au cancer du col de l’utérus
• Dépistage du cancer du col de l’utérus
• Taux de survie au cancer colorectal
• Incidence des maladies pouvant être prévenues par la vaccination
• Couverture des programmes de vaccination de base
• Taux de mortalité pour cause d’asthme
• Taux de mortalité à 30 jours après un infarctus aigu du myocarde
• Taux de mortalité à 30 jours après un accident vasculaire cérébral
• Délai d’attente pour une opération en cas de fracture du fémur
• Vaccination contre la grippe chez les adultes de plus de 65 ans
• Taux de tabagisme
DELSA/HEA/WD/HWP(2006)2
7
TABLE OF CONTENTS
ACKNOWLEDGEMENTS ............................................................................................................................2 SUMMARY ....................................................................................................................................................3 RESUME.........................................................................................................................................................5 TABLE OF CONTENTS ................................................................................................................................7 PART I - PROJECT OVERVIEW AND RESULTS ....................................................................................10
HCQI Project Purpose................................................................................................................................11 Progress so Far: Project History, Framework and Methods ......................................................................12
Project History........................................................................................................................................12 Project Framework .................................................................................................................................12 Methods..................................................................................................................................................12
Results........................................................................................................................................................14 Applications of this Working Paper: How Should the Data Be Used?......................................................18 Future Work...............................................................................................................................................19
Investigating Differences across Countries in Initial Indicators ............................................................19 Updating the Initial Indicators................................................................................................................20 New Indicators .......................................................................................................................................20
PART II – DATA COMPARABILITY AND ANALYSIS ..........................................................................22 Summary of Measurement and Data Comparability Analysis...................................................................23
Reference Population for Age Adjustment ............................................................................................23 Handling Missing Data...........................................................................................................................29 Notification on Cases of Vaccine-Preventable Disease .........................................................................35 Variation in Coding Practices.................................................................................................................38 Effect of Unique Identifiers....................................................................................................................39
PART III – INDICATORS SPECIFICATIONS AND DATA RESULTS ...................................................42 Summary of the Results of the Survey on Data Availability and Comparability ......................................43
1. Breast Cancer Five-year Survival Rate ..............................................................................................46 2. Mammography Screening Rate ..........................................................................................................54 3. Cervical Cancer Five-year Survival Rate ...........................................................................................61 4. Cervical Cancer Screening Rate.........................................................................................................68 5. Colorectal Cancer Five-year Survival Rate........................................................................................73 6. Incidence of Vaccine Preventable Diseases (Pertussis, Measles, and Hepatitis B)............................80 7. Coverage for Basic Vaccination Programme, Age 2..........................................................................86 8. Asthma Mortality Rate, Age 5-39 ......................................................................................................93 9. Acute Myocardial Infarction 30-Day Case-Fatality Rate/In-Hospital Mortality Rate .......................98 10. Stroke 30-Day Case-Fatality Rate/In-Hospital Mortality Rate ......................................................104 11. Waiting Times for Surgery after Hip Fracture, Age 65+ ...............................................................110 12. Annual HbA1c Test for Patients with Diabetes .............................................................................114 13. Patients with Diabetes with Poor Glucose Control ........................................................................119
DELSA/HEA/WD/HWP(2006)2
8
14. Retinal Exams in Diabetics ............................................................................................................124 15. Major Amputation in Diabetics ......................................................................................................131 16. Influenza Vaccination for Adults over 65 ......................................................................................139 17. Smoking Rate .................................................................................................................................145
Charts
Chart 1. Impact of Missing Data – Cancer Survival Rates and AMI/Stroke Mortality Rates ...................34 Chart 2. Impact of Notification on Incidence of Vaccine-Preventable Diseases .......................................37
Tables
Table 1. Indicators Suitable for Inclusion in the HCQI Initial Indicator Set .............................................15 Table 2. Indicators Not Suitable for Inclusion in the HCQI Initial Indicator Set ......................................17 Table 3. Impact of Choice of Standard Population on Breast Cancer Five-Year Survival Rates ..............26 Table 4. Impact of Choice of Standard Population on Cervical Cancer Five-Year Survival Rates...........27 Table 5. Impact of Choice of Standard Population on Colorectal Cancer Five-Year Survival Rates........28 Table 6. Effect of Policies on Handling Missing Data on Survival and Mortality Rates ..........................32 Table 7. Summary of Notification Status by Country for Vaccine-Preventable Diseases.........................36 Table 8. Effect of Coding on Asthma Mortality Estimates........................................................................39 Table 9. Effect of Unique Identifiers on AMI and Stroke In-Hospital Mortality Estimates......................41 Table 10. Availability of Data for Initial Indicators ..................................................................................45 Table 11. Breast Cancer Five-year Survival Rate......................................................................................49 Table 12. Breast Cancer Mortality per 100,000 Women ...........................................................................50 Table 13. Breast Cancer Five-year Survival and Mortality, Sources and Methods ...................................51 Table 14. Breast Cancer Survival Rate, Comparability Issues ..................................................................53 Table 15. Mammography Screening Rate..................................................................................................56 Table 16. Mammography Screening Rate, Sources and Methods .............................................................57 Table 17. Mammography Screening Rate, Comparability Issues..............................................................60 Table 18. Cervical Cancer Survival Rate...................................................................................................63 Table 19. Cervical Cancer Mortality per 100,000 Women........................................................................64 Table 20. Cervical Cancer Survival Rate, Sources and Methods ..............................................................65 Table 21. Cervical Cancer Survival Rate, Comparability Issues ...............................................................67 Table 22. Cervical Cancer Screening Rate ................................................................................................69 Table 23. Cervical Cancer Screening Rate, Sources and Methods ............................................................70 Table 24. Cervical Cancer Screening Rate, Comparability Issues.............................................................72 Table 25. Colorectal Cancer Survival Rate................................................................................................75 Table 26. Colon Cancer Mortality Rate .....................................................................................................76 Table 27. Colorectal Cancer Five-year Survival and Mortality, Sources and Methods.............................77 Table 28. Colorectal Cancer Survival Rate, Comparability Issues............................................................79 Table 29. Incidence of Vaccine Preventable Diseases (Pertussis, Measles and Hepatitis B) ....................82 Table 30. Incidence of Vaccine Preventable Diseases (Pertussis, Measles and Hepatitis B), Comparability Issues..........................................................................................................................................................85 Table 31. Coverage for Basic Vaccination Programme, Age 2 .................................................................87 Table 32. Description of Basic Vaccination Programme...........................................................................89 Table 33. Incidence of Vaccine Preventable Disease, Comparability Issues.............................................92 Table 34. Asthma Mortality Rate, Ages 5-39 ............................................................................................95 Table 35. Asthma Mortality Rate, Ages 5-39, Comparability Issues ........................................................97
DELSA/HEA/WD/HWP(2006)2
9
Table 36. In-Hospital Mortality Rate within 30 Days of Hospital Admission for AMI ..........................100 Table 37. In-Hospital Mortality Rate for AMI, Sources and Methods ....................................................101 Table 38. In-Hospital Mortality Rate for AMI, Comparability Issues.....................................................103 Table 39. In-Hospital Mortality Rate for Stroke......................................................................................106 Table 40. In-Hospital Mortality Rate for Stroke, Sources and Methods .................................................107 Table 41. In-Hospital Mortality Rate for Stoke, Comparability Issues ...................................................109 Table 42. In-Hospital Waiting Times for Surgery after Hip Fracture, Age 65+......................................112 Table 43. In-Hospital Waiting Times for Surgery after Hip Fracture, Comparability Issues..................113 Table 44. Annual HbA1c Test for Patients with Diabetes .......................................................................117 Table 45. Annual HbA1c Test for Patients with Diabetes, Comparability Issues ...................................118 Table 46. HbA1c Levels Indicating Poor Glucose Control .....................................................................121 Table 47. HbA1c Levels Indicating Poor Glucose Control, Comparability Issues..................................123 Table 48. Retinal Exams in Diabetics......................................................................................................127 Table 49. Retinal Exams in Diabetics, Comparability Issues ..................................................................130 Table 50. Major Amputations in Diabetics, per 10,000 Diabetics...........................................................134 Table 51. Major Amputations in Diabetics, Comparability Issues ..........................................................138 Table 52. Influenza Vaccination for Adults over 65................................................................................142 Table 53. Influenza Vaccination for Adults over 65, Comparability Issues ............................................144 Table 54. Smoking Rate...........................................................................................................................147 Table 55. Smoking Rate, Comparability Issues.......................................................................................149

DELSA/HEA/WD/HWP(2006)2
10
PART I - PROJECT OVERVIEW AND RESULTS
DELSA/HEA/WD/HWP(2006)2
11
HCQI Project Purpose
16. Quality of health care delivery is a topic of concern throughout the member states of the OECD. Articles examining findings on shortcomings in care or on comparative differences across countries have become more frequent in the popular press. Efforts to improve the measurement of quality of care through the development of quality indicators have become more present in the current literature and in policy forums worldwide.3,4,5,6 Many of these efforts target specific disease areas in one particular country. Others compare across countries, but target particular conditions.7 Only a few efforts have attempted to examine quality of care across clinical conditions for more than one country.8
17. The OECD Health Care Quality Indicator (HCQI) Project was started in 2001. The long-term purpose of the HCQI Project is to develop a set of indicators to raise questions about health care quality across countries for key conditions and treatments. In essence, they should be used as the basis for investigation to understand why differences exist and what can be done to reduce those differences and improve care in all countries.
18. These differences may exist for a number of reasons, only some of which are in the control of the health system. One common reason why there are differences between countries in the estimates on indicators of health system performance is the difference in data, either in collection, analysis or reporting. The OECD Secretariat has explicitly undertaken the work to analyse and adjust for such differences in data such that there are no or only very minor data differences in the indicators that are recommended as suitable for inclusion in the HCQI Initial Indicator Set. Specific guidance on how the HCQI data should be used is presented in a later section.
19. A secondary goal of the HCQI Project – at the request of participating countries - is to support efforts aimed at coordination between major international organisations seeking to track health care quality indicators. The goal of such coordination is to lessen data collection burden on participating countries as well as to improve data comparability across international organisations. Organisations with whom the HCQI Project is coordinating include the European Commission including in particular Eurostat, the World Health Organization as well as ongoing international data collection efforts such as Eurocare (which collects data on cancer statistics.)
3. Institute of Medicine. Crossing the quality chasm: a new health system for the 21st century. Washington, DC:
National Academies Press; 2001;
4. Sawicki PT. Quality of health care in Germany. A six-country comparison. Med Klin (Munich). 2005 Nov 15;100(11):755-68.
5. Roland M. Linking physicians' pay to the quality of care--a major experiment in the United Kingdom. N Engl J Med. 2004 Sep 30;351(14):1448-54.
6. US Department of Health and Human Services. US National Healthcare Quality Report, 2004. (Rockville, MD: Agency for Healthcare Research and Quality). 2005.
7. Ramirez JA. Worldwide Perspective of the Quality of Care Provided to Hospitalized Patients with Community-Acquired Pneumonia: Results from the CAPO International Cohort Study. Semin Respir Crit Care Med. 2005 Dec;26(6):543-52.
8. First Report and Recommendations of the Commonwealth Fund’s International Working Group On Quality Indicators A Report to Health Ministers of Australia, Canada, New Zealand, the United Kingdom, and the United States. June 2004. The Commonwealth Fund. (no. 752).
DELSA/HEA/WD/HWP(2006)2
12
Progress so Far: Project History, Framework and Methods
Project History
20. The project has been divided into two phases. In Phase I, pilot work was carried out on an initial set of 17 indicators to explore the technical issues associated with reporting health care quality internationally. An ‘Initial List’ of 17 indicators was identified which appeared to meet certain standards in terms of their importance for informing policy and their scientific soundness, and for which it was believed that data was widely available across the 23 countries taking part in the study. They were approved on conceptual grounds at a meeting of an Expert Group gathered to provide guidance on the OECD Health Care Quality Indicators (HCQI) Project in September 2003. Data for this list of 17 indicators was then analysed extensively to examine the comparability of country data for each indicator. A series of data comparability questions was raised by country experts for the list of 17 indicators and was subsequently examined empirically by the Secretariat.
21. In Phase II of the Project, the project will review a broader set of indicators across a range of clinical conditions. The broader set of five indicator areas was derived from a review and voting process within the HCQI Expert Group and five panel reports on potential indicators in these five areas were produced in 2004.9 The conditions and care areas for the two phases are presented below.
OECD HCQI Conditions and Care Areas Phase 1 Phase 2 (currently proposed)
• Cancer screening rates and survival • Vaccination rates for children and elderly • Mortality rates for asthma, heart attack and
stroke • Waiting times for surgery (hip fracture) • Diabetes control and adverse outcome rates • Smoking rates
Phase 1 indicators, plus additional indicators on: • Promotion, prevention and primary care • Mental health care • Patient safety • Cardiac care (additional indicators) • Diabetes care (additional indicators)
Project Framework
22. A proposed framework has been devised for the HCQI Project which focuses on the most commonly used dimensions of health care performance based on a review of available country and international organisation frameworks. The framework acknowledges a broad set of these dimensions of performance while at the same time focusing the HCQI Project on three key dimensions of health care quality, namely: effectiveness, safety and responsiveness or patient centeredness. Details on the conceptual framework for the HCQI Project are reported in OECD Health Working Paper 23.
Methods
23. This section documents the methods used to select the indicators, including a summary of the indicator criteria. It also details the methods used to analyse data comparability across countries and the steps taken to verify data values with member countries and other international sources.
24. Summary of Indicator Criteria For an indicator to be a useful tool for evidence-based policy decisions, two conditions have to be met. First, it has to capture an important performance aspect. Second, is has to be scientifically sound.
9. For further information and copies of these reports, see
http://www.oecd.org/document/31/0,2340,en_2649_37407_2484127_1_1_1_37407,00.html.
DELSA/HEA/WD/HWP(2006)2
13
25. The importance of an indicator can be further broken down into three dimensions:
• Impact on health. What is the impact on health associated with this problem? Does the measure address areas in which there is a clear gap between the actual and potential levels of health? The impact on health is quantified in Part III of this report for each indicator by using mortality and morbidity estimates from the World Health Organization for the ‘EURO A’ group of countries, which includes most of the countries participating in the OECD HCQI.10
• Policy importance. Are policymakers and consumers concerned about this area? Although this dimension is difficult to quantify objectively, the cost associated with the condition covered by each indicator is used to indicate the economic importance related to each indicator. In Part III of this report, relevant costs are quantified for each of the indicators. These costs are based on a thorough cost-of-illness study performed in Canada11 as well as several other costing studies conducted in other countries.
• Susceptibility to being influenced by the health care system. Can the health care system meaningfully address this aspect or problem? Does the health care system have an impact on the indicator independent of confounders like patient risk? Will changes in the indicator give information about success or failure of policy changes? This dimension is discussed based on a review of the relevant literature demonstrating that the health system can influence each indicator.
26. The scientific soundness of each indicator can also be broken down into three dimensions:
• Face validity. Does the measure make sense logically and clinically? The face validity of each indicator in this report is based on the basic clinical rationale for the indicator and on past usage of the indicator in national or other quality reporting activities.
• Content validity. Does the measure capture meaningful aspects of the quality of care? Content validity is assessed through a literature review of studies relevant to each indicator.
• Reliability. Does the measure provide stable results across various populations and circumstances? Reliability of each indicator is assessed through a literature review of studies assessing the stability of results across populations or circumstances.
27. Data availability and thus feasibility were additional criteria for deciding the 17 indicators. This report summarises the results of a survey on data availability and comparability, based on the responses from the participating countries of the OECD HCQI.
28. The application of these criteria to the HCQI Initial Indicator Set was carried out as part of the two predecessor projects to the HCQI Project, the Commonwealth Fund and The Nordic Minister Council Working Group on Quality Measurement. For the Commonwealth Fund work, a rating system was used to rank each indicator based on the above criteria. Indicators which ranked highly on these criteria were retained in the measure set. This rating process was reviewed by the OECD Secretariat and then by the HCQI Expert Group as it began its work on selecting indicators. This resulted in a set of 17 indicators. 10. Murray CJL, Lopez AD, Mathers CD, and Stein C. The Global Burden of Disease 2000 Project: Aims,
Methods, and Data Sources. Global Programme on Evidence for Health Policy Discussion Paper No. 36. (Geneva: World Health Organization, November 2001). WHO EURO A countries include Andorra, Austria, Belgium, Croatia, Czech Republic, Denmark, Finland, France, Germany, Greece, Iceland, Ireland, Israel, Italy, Luxembourg, Malta, Monaco, Netherlands, Norway, Portugal, San Marino, Slovenia, Spain, Sweden, Switzerland, and the United Kingdom.
11. Health Canada, Economic Burden of Illness in Canada, 1998 (Ottawa: Health Canada, 2002).
DELSA/HEA/WD/HWP(2006)2
14
29. Once a set of indicators was generated that were deemed scientifically sound and important (clinically and policy-wise), the Secretariat undertook to gather data from participating countries on the 17 indicators.
30. The Secretariat undertook a series of data analyses regarding the availability and comparability of the data on the 17 indicators. After two years of data analysis on the indicators and updating of original data gathered from countries, the Secretariat presented a draft of the Initial Indicators Report during the December 2004 HCQI Expert Group meeting in Paris. From this meeting, five final data comparability questions arose which the Secretariat agreed to investigate. These data-based questions focus on data comparability issues across countries on particular indicators and are reported in detail in Part II of this report. These questions are:
• What is the appropriate reference population for age adjustment? • What is the impact of different policies for handling missing data? • What is the impact of notification policies on cases of vaccine-preventable disease? • What is the impact of variation in coding practices (for asthma)? • What is the effect of unique identifiers when dealing with mortality rates?
Results
31. This section presents the list of indicators that the OECD recommends retaining for the HCQI Initial Measure Set and a list of indicators that are not recommended for retention currently. Indicators that are not currently being recommended for retention are not necessarily being recommended for exclusion from future OECD HCQI consideration. A number of these indicators are generally viewed as scientifically sound, however data availability and comparability may not be up to standard currently. These two lists were derived from the data comparability sensitivity analyses conducted in Spring-Summer 2005 and on the extensive literature review and Expert Group consultations conducted from 2001 to the present. This list of measures is presented along with the key data issues for each measure. A detailed presentation of each measure is made in Part III of this paper.
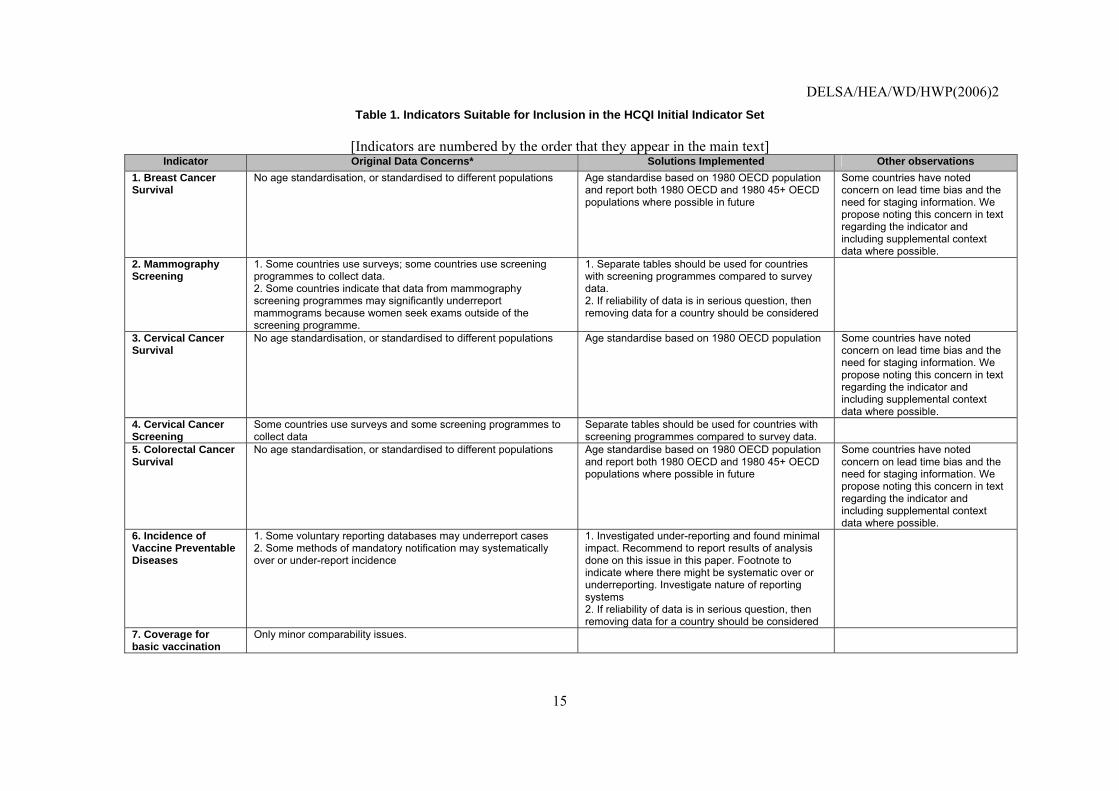
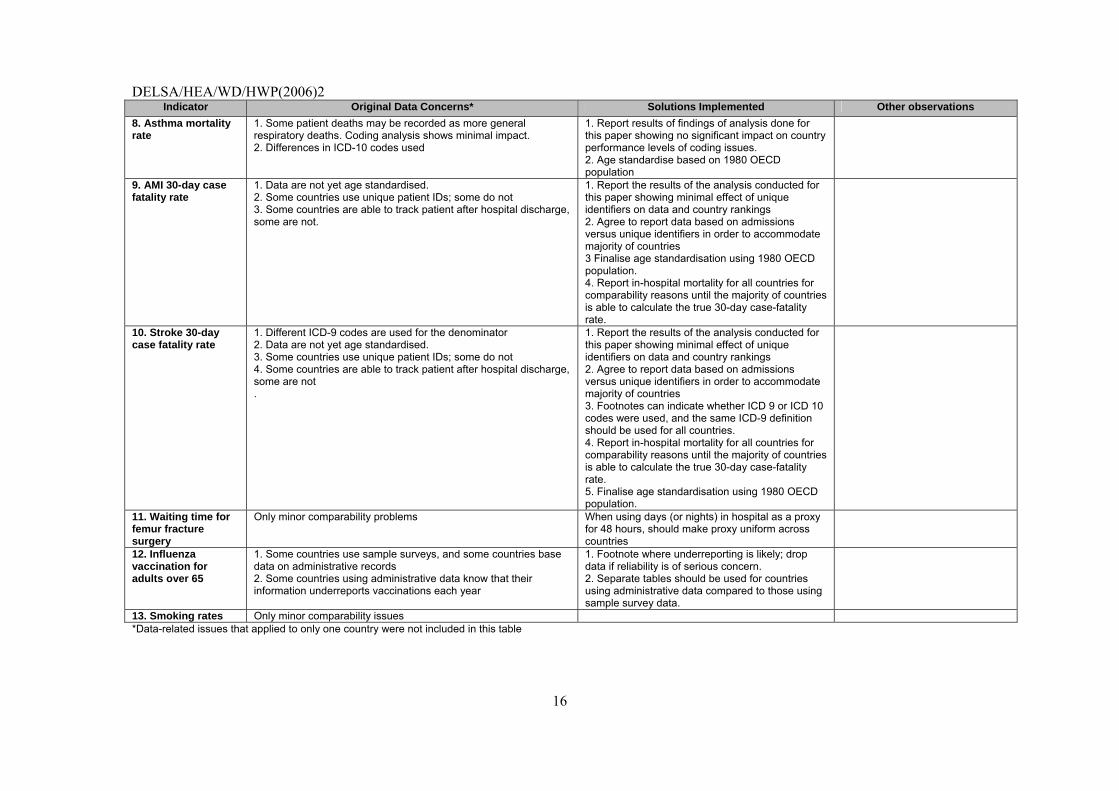
32. Table 1 below lists the set of 13 indicators that, based on the above analyses and consultations, the OECD recommends for inclusion in the Initial HCQI Indicator Set. It also summarises the current data concerns regarding each indicator and a potential solution for this report.
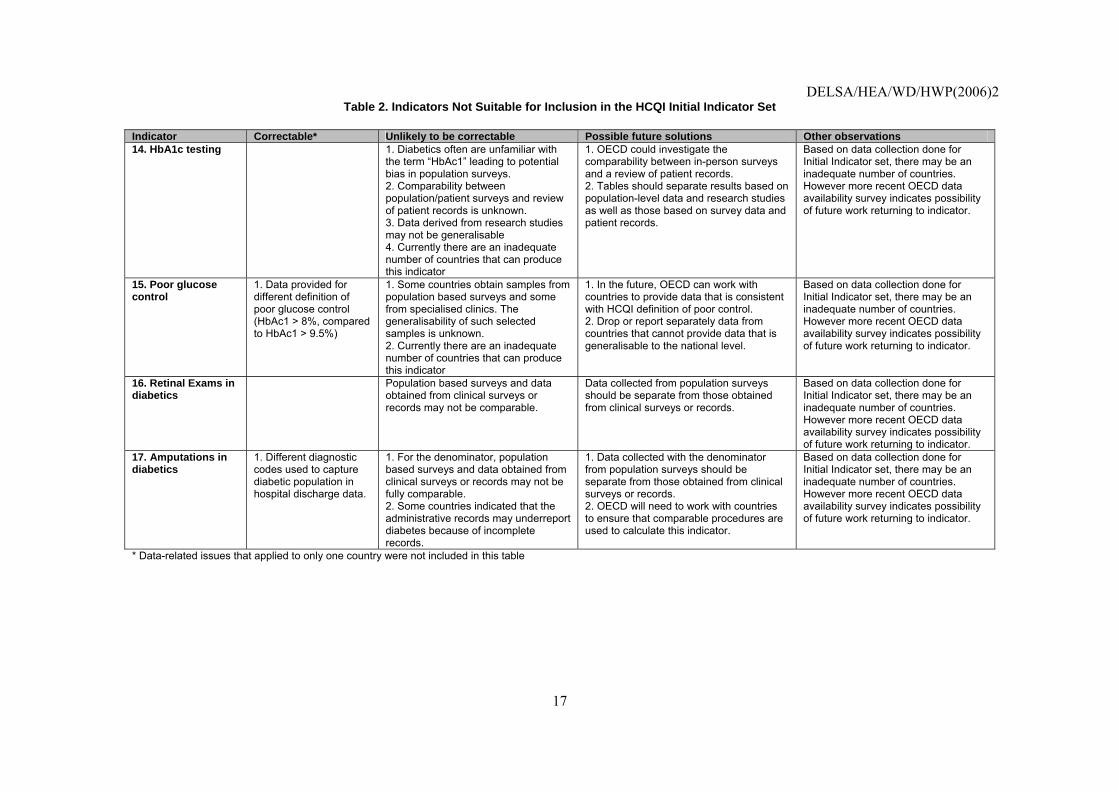
33. Table 2 lists the set of 4 indicators out of 17 that are not currently recommended as suitable for the HCQI Initial Indicator Set. It also lists the principal data concerns regarding the indicator and possible future solutions for these data concerns.
DELSA/HEA/WD/HWP(2006)2
15
Table 1. Indicators Suitable for Inclusion in the HCQI Initial Indicator Set
[Indicators are numbered by the order that they appear in the main text] Indicator Original Data Concerns* Solutions Implemented Other observations
1. Breast Cancer Survival
No age standardisation, or standardised to different populations Age standardise based on 1980 OECD population and report both 1980 OECD and 1980 45+ OECD populations where possible in future
Some countries have noted concern on lead time bias and the need for staging information. We propose noting this concern in text regarding the indicator and including supplemental context data where possible.
2. Mammography Screening
1. Some countries use surveys; some countries use screening programmes to collect data. 2. Some countries indicate that data from mammography screening programmes may significantly underreport mammograms because women seek exams outside of the screening programme.
1. Separate tables should be used for countries with screening programmes compared to survey data. 2. If reliability of data is in serious question, then removing data for a country should be considered
3. Cervical Cancer Survival
No age standardisation, or standardised to different populations Age standardise based on 1980 OECD population Some countries have noted concern on lead time bias and the need for staging information. We propose noting this concern in text regarding the indicator and including supplemental context data where possible.
4. Cervical Cancer Screening
Some countries use surveys and some screening programmes to collect data
Separate tables should be used for countries with screening programmes compared to survey data.
5. Colorectal Cancer Survival
No age standardisation, or standardised to different populations Age standardise based on 1980 OECD population and report both 1980 OECD and 1980 45+ OECD populations where possible in future
Some countries have noted concern on lead time bias and the need for staging information. We propose noting this concern in text regarding the indicator and including supplemental context data where possible.
6. Incidence of Vaccine Preventable Diseases
1. Some voluntary reporting databases may underreport cases 2. Some methods of mandatory notification may systematically over or under-report incidence
1. Investigated under-reporting and found minimal impact. Recommend to report results of analysis done on this issue in this paper. Footnote to indicate where there might be systematic over or underreporting. Investigate nature of reporting systems 2. If reliability of data is in serious question, then removing data for a country should be considered
7. Coverage for basic vaccination
Only minor comparability issues.
DELSA/HEA/WD/HWP(2006)2
16
Indicator Original Data Concerns* Solutions Implemented Other observations 8. Asthma mortality rate
1. Some patient deaths may be recorded as more general respiratory deaths. Coding analysis shows minimal impact. 2. Differences in ICD-10 codes used
1. Report results of findings of analysis done for this paper showing no significant impact on country performance levels of coding issues. 2. Age standardise based on 1980 OECD population
9. AMI 30-day case fatality rate
1. Data are not yet age standardised. 2. Some countries use unique patient IDs; some do not 3. Some countries are able to track patient after hospital discharge, some are not.
1. Report the results of the analysis conducted for this paper showing minimal effect of unique identifiers on data and country rankings 2. Agree to report data based on admissions versus unique identifiers in order to accommodate majority of countries 3 Finalise age standardisation using 1980 OECD population. 4. Report in-hospital mortality for all countries for comparability reasons until the majority of countries is able to calculate the true 30-day case-fatality rate.
10. Stroke 30-day case fatality rate
1. Different ICD-9 codes are used for the denominator 2. Data are not yet age standardised. 3. Some countries use unique patient IDs; some do not 4. Some countries are able to track patient after hospital discharge, some are not .
1. Report the results of the analysis conducted for this paper showing minimal effect of unique identifiers on data and country rankings 2. Agree to report data based on admissions versus unique identifiers in order to accommodate majority of countries 3. Footnotes can indicate whether ICD 9 or ICD 10 codes were used, and the same ICD-9 definition should be used for all countries. 4. Report in-hospital mortality for all countries for comparability reasons until the majority of countries is able to calculate the true 30-day case-fatality rate. 5. Finalise age standardisation using 1980 OECD population.
11. Waiting time for femur fracture surgery
Only minor comparability problems When using days (or nights) in hospital as a proxy for 48 hours, should make proxy uniform across countries
12. Influenza vaccination for adults over 65
1. Some countries use sample surveys, and some countries base data on administrative records 2. Some countries using administrative data know that their information underreports vaccinations each year
1. Footnote where underreporting is likely; drop data if reliability is of serious concern. 2. Separate tables should be used for countries using administrative data compared to those using sample survey data.
13. Smoking rates Only minor comparability issues *Data-related issues that applied to only one country were not included in this table
DELSA/HEA/WD/HWP(2006)2
17
Table 2. Indicators Not Suitable for Inclusion in the HCQI Initial Indicator Set
Indicator Correctable* Unlikely to be correctable Possible future solutions Other observations 14. HbA1c testing 1. Diabetics often are unfamiliar with
the term “HbAc1” leading to potential bias in population surveys. 2. Comparability between population/patient surveys and review of patient records is unknown. 3. Data derived from research studies may not be generalisable 4. Currently there are an inadequate number of countries that can produce this indicator
1. OECD could investigate the comparability between in-person surveys and a review of patient records. 2. Tables should separate results based on population-level data and research studies as well as those based on survey data and patient records.
Based on data collection done for Initial Indicator set, there may be an inadequate number of countries. However more recent OECD data availability survey indicates possibility of future work returning to indicator.
15. Poor glucose control
1. Data provided for different definition of poor glucose control (HbAc1 > 8%, compared to HbAc1 > 9.5%)
1. Some countries obtain samples from population based surveys and some from specialised clinics. The generalisability of such selected samples is unknown. 2. Currently there are an inadequate number of countries that can produce this indicator
1. In the future, OECD can work with countries to provide data that is consistent with HCQI definition of poor control. 2. Drop or report separately data from countries that cannot provide data that is generalisable to the national level.
Based on data collection done for Initial Indicator set, there may be an inadequate number of countries. However more recent OECD data availability survey indicates possibility of future work returning to indicator.
16. Retinal Exams in diabetics
Population based surveys and data obtained from clinical surveys or records may not be comparable.
Data collected from population surveys should be separate from those obtained from clinical surveys or records.
Based on data collection done for Initial Indicator set, there may be an inadequate number of countries. However more recent OECD data availability survey indicates possibility of future work returning to indicator.
17. Amputations in diabetics
1. Different diagnostic codes used to capture diabetic population in hospital discharge data.
1. For the denominator, population based surveys and data obtained from clinical surveys or records may not be fully comparable. 2. Some countries indicated that the administrative records may underreport diabetes because of incomplete records.
1. Data collected with the denominator from population surveys should be separate from those obtained from clinical surveys or records. 2. OECD will need to work with countries to ensure that comparable procedures are used to calculate this indicator.
Based on data collection done for Initial Indicator set, there may be an inadequate number of countries. However more recent OECD data availability survey indicates possibility of future work returning to indicator.
* Data-related issues that applied to only one country were not included in this table
DELSA/HEA/WD/HWP(2006)2
18
Applications of this Working Paper: How Should the Data Be Used?
34. The indicators recommended for retention in this document for the HCQI measure set have been recommended because of their scientific soundness, importance, data availability and comparability across countries. They are not derived as a set of measures that should be used to judge the performance of whole health systems. Because it is believed that these indicators have met certain minimum data comparability issues (along with the other criteria mentioned), the OECD Secretariat believes that these indicators can be used to raise questions for further investigation regarding quality of care across countries for the conditions and treatments concerned. In essence, they should be used by countries and researchers as indicators of where more investigation is needed to understand differences in quality across countries.
35. In this fashion, the HCQI indicators are similar to many of the other indicators in OECD’s Health Data and their eventual addition to Health Data will provide a regular mechanism for updating the data and for continuing to examine data comparability issues as they arise. The OECD envisions the eventual addition of indicators that are recommended for retention in the HCQI measure set to Health Data on a gradual basis. Specific plans for such migration will be presented in other OECD documentation.
36. These indicators of quality of care are labelled as such deliberately. They have been reviewed intensively to reach a judgement that the data are reliable in the sense that observations from different countries are measured in ways which are close enough to be acceptable for making comparisons. But they remain indicators of quality of care: they do not purport to be unequivocal measures of relative effectiveness of delivery of health care.
37. This is because the level of the indicator will inevitably be affected by factors outside the influence of administrations or providers. This is true even for all of the indicators in the Initial Indicator Set. In this set of indicators, there are process indicators of care (i.e. was a screening done when recommended?); outcome indicators (i.e. mortality for a given condition) and one indicator of “avoidable risk” (i.e. smoking rates.) When examining differences across countries, each of these types of indicators may raise different questions and may offer different types of challenges for further investigation.
38. For example, process indicators are generally regarded as preferable in terms of their clinical specificity and their reliance on clinical guidelines for evidence of effectiveness. In addition, because they assess whether recommended interventions occurred, they are more reliable for assessing differences across provider organisations or across countries.12 However, there still may be differences across countries in terms of local guidelines for good clinical practice. For example, vaccinations are influenced by national policies with respect to requiring vaccinations as a condition of (often compulsory) school attendance.
39. Outcome indicators have the distinct advantage of measuring the ultimate impact of health care interventions by assessing survival or mortality rates. In some cases, serologic measures such as actual levels of hypertension or HbA1C levels in diabetics as measured through health examination surveys are also considered “outcome” measures. However, outcome measures have inherent issues in terms of assessing quality of care across institutions or countries, precisely because there are many more factors that influence outcomes outside of the control of the health system.13 These include patient compliance, background risk factors in the population (such as age, gender, comorbidities). An example of outcome measures with such concerns in the HCQI Initial Indicator Set includes cancer survival rates and AMI and stroke fatality rates. With these outcome indicators, the underlying health status of the population will have 12. Mant J, Hicks N. Detecting differences in quality of care: the sensitivity of measures of process and
outcome in treating acute myocardial infarction. BMJ 1995;311(7008):793-6.
13. Orchard C. Comparing healthcare outcomes. BMJ 1994;308(6942):1493-6.
DELSA/HEA/WD/HWP(2006)2
19
an impact, even if case severity is precisely defined and even if some prominent risk factors, such as age, are adjusted in the analysis.
40. Indicators of avoidable risk have been left out of the quality of care indicator literature, largely because these indicators have been tracked as part of public health programme performance. However, many countries regard them as key health system measures. Occasionally, these indicators are considered distal outcome measures in that they assess the impact of health system and public health programmes to reduce risk factors in the population as a whole. Smoking is one of the most common of these avoidable risk factors and the one indicator of this type tracked in the HCQI Initial Indicator Set. The links between smoking rates and health system performance are discussed in detail in Part III of this report. In analysing differences across countries with indicators of avoidable risk, even more investigation could be made to background risk factors than with strict “outcome” indicators. Moreover, as in the case of smoking, investigation could be made as to the legal and regulatory context governing smoking practices in a country.14
41. It is clear, therefore, that for any given country, the exact meaning of differences between their country and others in the indicators presented in this report can only be found in further investigation. For example, asthma mortality has been retained as an indicator in the Initial Indicator Set, on the grounds that all asthma deaths are in principle avoidable. But clearly, the effectiveness of delivery of care for asthma could be greater in a country with high incidence but a relatively high mortality rate as compared to a country with few to no deaths, but relatively low incidence.
42. This distinction between statistically reliable measures and their use to make judgments about performance extends to almost all health statistics, including most of the series in OECD Health Data. The indicators in this data set are distinguished by the judgement that they represent measures of policy significance, and that the original ranking of the indicator is clear (for example, the higher the vaccination rate, the better.) Other data series do not have this quality. Take for example, the number of medical practitioners per capita: too low a figure is undesirable (insufficient care resources) but too high a ratio could lead to wasteful use of resources.
Future Work
43. This Initial Indicator Report represents a significant step forward for the HCQI Project. However, it is only a first step. Future work should consider the above questions of additional investigation into the initial indicators. Secondly, these data, particularly data for process of care measures, should be updated periodically. Thirdly, the Initial Indicator Set is limited in its coverage of key disease areas and key aspects of health care. Future work needs to also consider the most efficient ways to update the Initial Indicator Set with new indicators in areas of priority to participating countries.
Investigating Differences across Countries in Initial Indicators
44. The issues discussed in the previous section are only some of the issues that could be investigated as countries put these indicators into practice. There is some previous work in examining reasons for differences across countries and best practices in improving quality in work by the Commonwealth Fund and other organisations.15 However, this area of investigating the reasons why such differences exist is an under explored area, precisely for the reasons that make quality indicator work internationally so difficult. In order to truly investigate the reasons for differences across countries, more contextual data is needed on 14. Tominaga S. Major avoidable risk factors of cancer. Cancer Lett. 1999 Sep;143 Suppl 1:S19-23.
15. First Report and Recommendations of the Commonwealth Fund's International Working Group on Quality Indicators, The Commonwealth Fund, June 2004
DELSA/HEA/WD/HWP(2006)2
20
patient level factors, such as age, gender, etc., as well as population level characteristics, such as prevalence rates. In addition, in some cases, health system characteristics might be useful in investigating differences.
45. That said, this supplemental data exist. Investigations in many national efforts include comparisons across regions or states where population and patient level factors are included in the analysis.16 Possibilities exist within the context of the HCQI Expert Group to map priority areas for further investigation and to request country involvement in pooling data for more in-depth analyses.
Updating the Initial Indicators
46. Although this report represents the latest data available from countries, it is envisioned that future work will involve setting a periodicity and a mechanism for updating the data in the Initial Indicators Report. This will also involve agreeing which indicators are suitable candidates for inclusion in the OECD Health Data data set, which would therefore have the responsibility for their updates. Whatever the mechanism, a clear area for future work will involve periodic review of the indicators and their specifications to ensure current relevance (e.g. verifying cutpoints and age recommendations for certain tests) as well as obtaining updated data from countries.
New Indicators
47. Although considerable work had gone into the initial indicators, there is concern in the HCQI Expert Group that the relative lack of breadth of the original 17 indicators (with numerous indicators in some disease areas and none in others) means that the initial indicator set would be incomplete. To remedy this, the OECD Secretariat has undertaken an exercise with member countries to identify priority areas for additional indicator development and to design a work plan to identify and take specific quality indicators within those priority areas. Members of the HCQI Expert Group were asked to rate a broad set of priority areas, using again indicator development techniques developed by RAND Corporation for their work on quality indicators. Five areas were eventually chosen based on consensus about clinical importance and policy relevance: cardiac care; diabetes mellitus; mental health; patient safety; and prevention/primary care. The OECD Secretariat was tasked to convene international Expert Panels to identify, review and evaluate indicators for these five areas. The proceedings of those Expert Panels were released as OECD Technical Papers in 2004.
48. Following this, and in parallel with the activity on the initial indicator report and indicator set, the OECD Secretariat undertook to ascertain the data availability for the total set of 85 indicators that were recommended in the five Expert Panel reports. Using a cut point for data availability of 10 countries being able to supply the data,17 the Secretariat identified 23 indicators with potentially available data. The HCQI Expert Group then reviewed these data availability results as well as scientific soundness and importance of information on each indicator group (e.g. cardiac, diabetes, etc.) Based on this review, the Expert group
16. US Department of Health and Human Services. The US National Healthcare Quality Report: STATE
RESOURCES for Selected Measures from the 2004 National Healthcare Quality Report. (Rockville, MD: The Agency for Healthcare Research and Quality). 2004. http://www.qualitytools.ahrq.gov/qualityreport/state/. Last accessed December 20, 2005.
17. This cutpoint of 10 countries with available data was used as part of the initial phase of the HCQI Project and was selected to be internally consistent across phases of the project. Some HCQI collaborating organisations have suggested that a lower threshold should be used for this phase of data exploration. The Secretariat will review this possibility following initial data collection for the phase II indicators.
DELSA/HEA/WD/HWP(2006)2
21
signed off on five18 new measures for data collection in early 2006. Data collection will start in late January. These new indicators are:
Diabetes • Lower extremity amputation rates • Annual eye exam
Patient safety19 • Postoperative hip fracture • Complications of anaesthesia
Primary care and prevention • Hospitalisation for ambulatory care sensitive conditions
18. In effect, the last measure actually encompasses a number of ambulatory care sensitive conditions, so the
possible number of new unique indicators could be from 5 to 12.
19. The OECD has been approached by a number of international organisations, including the WHO-Euro and the World Alliance on Patient Safety with a request that we also consider hospital-acquired infection indicators in the initial round of data collection (of which there are several in the HCQI Patient Safety Expert Panel recommended indicators). This will have to be reviewed and considered with the consultation of the HCQI Expert Group.

DELSA/HEA/WD/HWP(2006)2
22
PART II – DATA COMPARABILITY AND ANALYSIS
DELSA/HEA/WD/HWP(2006)2
23
Summary of Measurement and Data Comparability Analysis
49. This section summarises findings from detailed analysis carried out by the OECD in the Spring and Summer of 2005 on a set of five questions posed by country experts during the December 2004 HCQI Expert Group meeting in Paris. These data-based questions focus on data comparability issues across countries on particular indicators. These questions are:
• What is the appropriate reference population for age adjustment? • What is the impact of different policies for handling missing data? • What is the impact of notification policies on cases of vaccine-preventable disease? • What is the impact of variation in coding practices (for asthma)? • What is the effect of unique identifiers when dealing with mortality rates?
Reference Population for Age Adjustment
50. A country’s age structure can influence international comparisons of health system performance, depending on the nature of the disease and the structure of the population. For example, if Country A’s population is notably older as a whole than Country B’s population, we would expect there to be higher rates of chronic diseases and for the population, as a whole, to be “sicker.” We would then expect difference in performance for diseases whose incidence and prognosis depends on age at diagnosis. This difference, which is based on population characteristics and not within the control of the health system, should be taken into account when comparing performance levels on quality indicators across Country A and Country B. The same holds true for longitudinal comparisons within one country, if that country’s age structure changes meaningfully over time.
51. To account for such differences in age structure, age adjustment is performed based on standardised populations. The resulting age-adjusted rates reflect a country’s hypothetical performance on a standard population and should thus be viewed as relative indexes rather than actual measures. Age-adjusted rates can be computed by the direct method or indirect method. These adjustments become extremely important when examining data over time and when comparing performance. Many national reports on quality of care use some form of age adjustment to account for changes over time.20
52. Recent research has examined the impact of different standard populations and different age adjustment techniques. Several authors find that choice of age adjustment methods and standard populations are important when attempting to isolate independent effects of other covariates such as income, race or other socioeconomic factors.21 Other recent literature, however, finds that there is relatively little impact on overall estimates of measures such as cancer survival when tracking statistics at a national level.22 An important question in selecting a reference population is whether the general population or a disease-specific population, i.e. a population that has the distribution of patients with the respective disease, should be used. Depending on the age patterns of a disease, those types of populations may be markedly different and thus lead to different results and conclusions. As the incidence and prevalence of most diseases increases with age, the disease-specific populations tend to weigh older
20. Canadian Institute for Health Information. Comparable Health and Health System Performance Indicators
for Canada, the Provinces and Territories, November 2004. http://secure.cihi.ca/cihiweb/dispPage.jsp?cw_page=prtwg_2004_e (accessed 26 March 2004).
21. Milyo J, Mellor JM. On the importance of age-adjustment methods in ecological studies of social determinants of mortality. Health Serv Res. 2003 Dec;38(6 Pt 2):1781-90.
22. Brenner H, Hakulinen T. Age adjustment of cancer survival rates: methods, point estimates and standard errors. Br J Cancer. 2005 Aug 8;93(3):372-5.
DELSA/HEA/WD/HWP(2006)2
24
population segments more heavily, whereas general population weights reflect the higher share of younger cohorts. Thus, when using general population weights, the result in the younger age cohorts get typically overemphasised, because those cohorts make up for a small part of the diseased population but a large part of the general population.
53. Consequently, a disease-specific reference population would be theoretically superior, but is frequently not feasible because populations would have to be constructed for each respective disease and group of countries. To avoid this effort, many research projects thus resort to using general population weights. For the HCQI Project, the question is whether resources should be devoted to developing such reference populations or whether using a general population will yield similar enough results. Another technique to improve upon general population weights without the need to develop disease-specific weights is to truncate the sample to only include the population above a certain age (i.e. 40 or 45), i.e. to remove the segment of the population that is less affected by disease and that causes most of the distortion when using general population weights.23 Another issue that may arise with general population weights is that they will substantially change the raw rates. For example in empirical work by the Eurocare team, it was found that rates standardised to the world standard population produced estimates that were in some cases only half the raw rates, a situation that seems not desirable.24,25 Their work found that a standard population that was “age-specific” performed slightly better in terms of providing estimates that approximated the raw estimates and also provided the best comparison across countries.26
54. We requested data in order to conduct an analysis of the influence of standard populations on both cancer five-year survival rates (for breast, colorectal and cervical cancer) and on in-hospital mortality rate 30 days following acute myocardial infarction; in-hospital mortality rate 30 days following hemorrhagic and ischemic stroke. Countries providing already standardised data tend to implement the direct method. Thus, this is the method assumed for this analysis. Four countries were able to provide this data to the OECD. In general, three rates were compared: a) rates adjusted to the 1980 OECD standard population, b) rates adjusted to the 2005 OECD standard population and c) rates adjusted to the Eurocare cancer specific population. We compared the rates and the relative rank of the countries using these three adjusted set of rates.27
55. The results of the analysis, given the small sample size, were inconclusive. There was little if any difference in the relative rank across the four countries based on whether the 1980 or 2005 OECD standard
23. Lousbergh, D; Buntinx, F; Geys, H; Du Bois, M; Dhollander, D; Molenberghs, G. Prostate-specific antigen
screening coverage and prostate cancer incidence rates in the Belgian province of Limburg in 1996-1998. European Journal of Cancer Prevention. 11(6):547-549, December 2002.
24. Carazziari, I, Quinn, M, Capocaccia, R. Standard cancer patient population for age standardising survival ratios. European Journal of Cancer 40 (2004). 2307-2316.
25. Smith, PG. Comparison between registries: age-standardised rates. In Parkin DM, Muir CS, Whelan SL, Gao Y-T, Ferlay J, Powell J, eds. Cancer incidence in five continents, IARC Scientific Publications No. 120. Lyon, International Agency for Research on Cancer, 1992. pp. 865-870.
26. Of note is that in the same article, a test of three different disease-specific standard populations showed that, for breast and colorectal cancer, the adjustment with one or with all three cancer-specific populations was virtually identical with differences between the estimates of 0 to 1 percentage point. The adjustment for cervical cancer showed slightly more sensitivity to the choice of population, but still quite low with differences of 2 to 7 percentage points.
27 The ‘null’ hypothesis of no standardised data was discarded as the fourth alternative for comparison because the current technical debate as reflected in the literature seems to have overcome the issue of whether or not standardising to concentrate in the impact of the choice of the population of reference.
DELSA/HEA/WD/HWP(2006)2
25
population was used. There seemed to be some influence in countries’ relative positions based on whether the 1980 OECD or the Eurocare standard populations were used.
56. In order to check these findings, the OECD Secretariat worked with Eurocare staff to conduct the same analysis as detailed above using more complete data from the Eurocare-3 sample. The Eurocare database contains data on 6.5 million cancer patients diagnosed from 1978 to 1994 in populations that are covered by 67 cancer registries in 22 European countries. The Eurocare database represents the largest and most comprehensive international cancer survival data available for comparisons to OECD countries.28 This sample included 16 countries that are currently part of the OECD HCQI Project using data cancer survival data from 1990-1994. However once country estimated that Eurocare data for their country referred just to a specific region of the country not considered representative of the national situation. Thus, this country was not taken into account for this analysis. We repeated the analysis conducted for the four countries who submitted data and adjusted the observed and relative survival rates for breast, cervical and colorectal cancer to the 1980 OECD standard population, the 2005 OECD standard population, the Eurocare cancer specific standard population and a new 1980 OECD standard population which only included the ages 45+. The reason for this choice of age break is that this is the standard age cutpoint for Eurocare data survival rates.
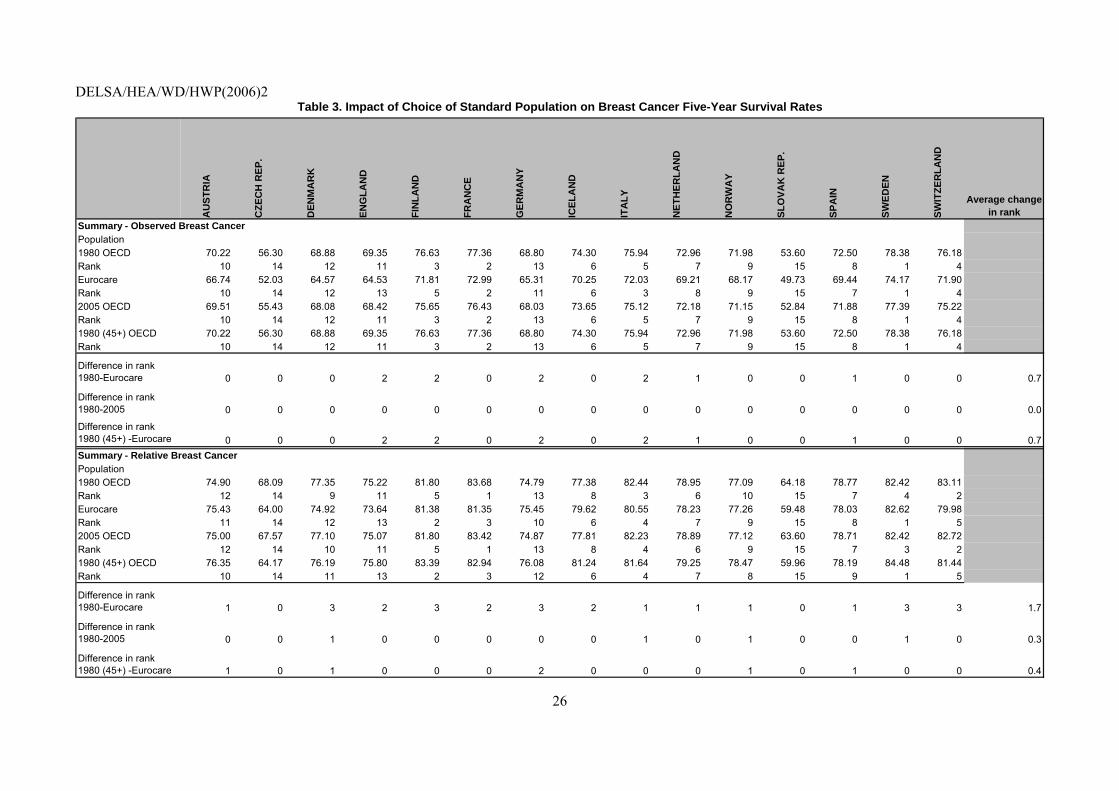
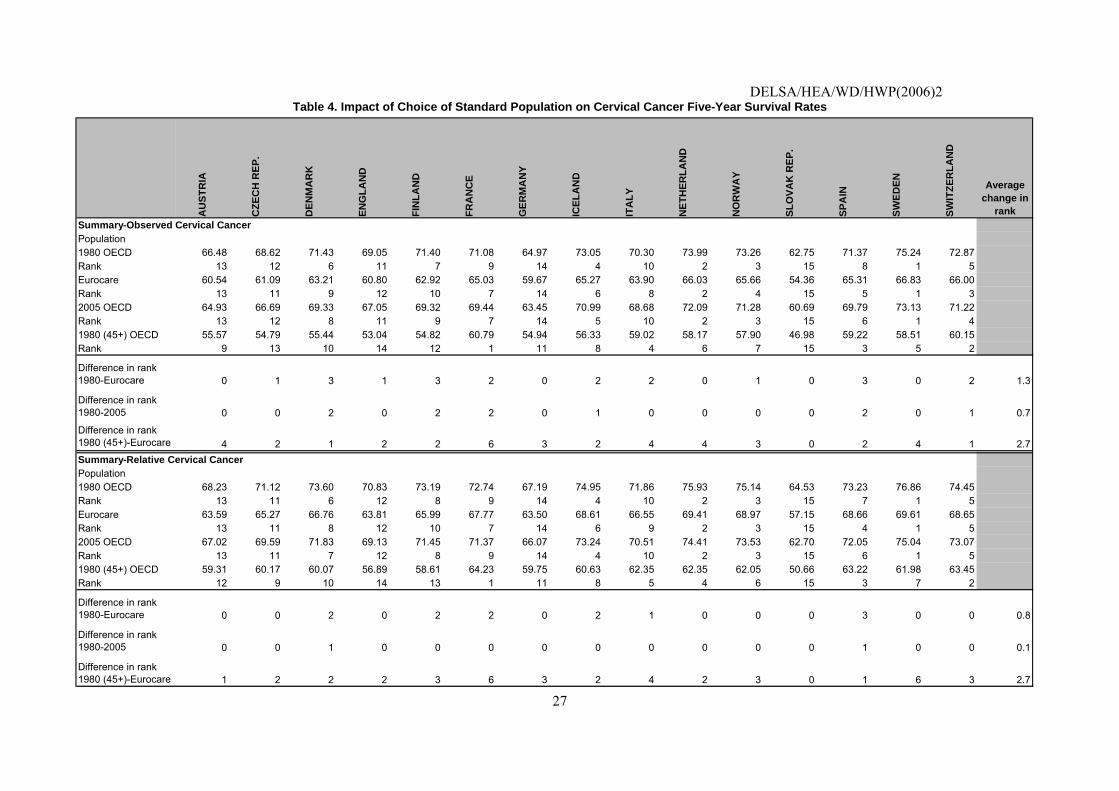
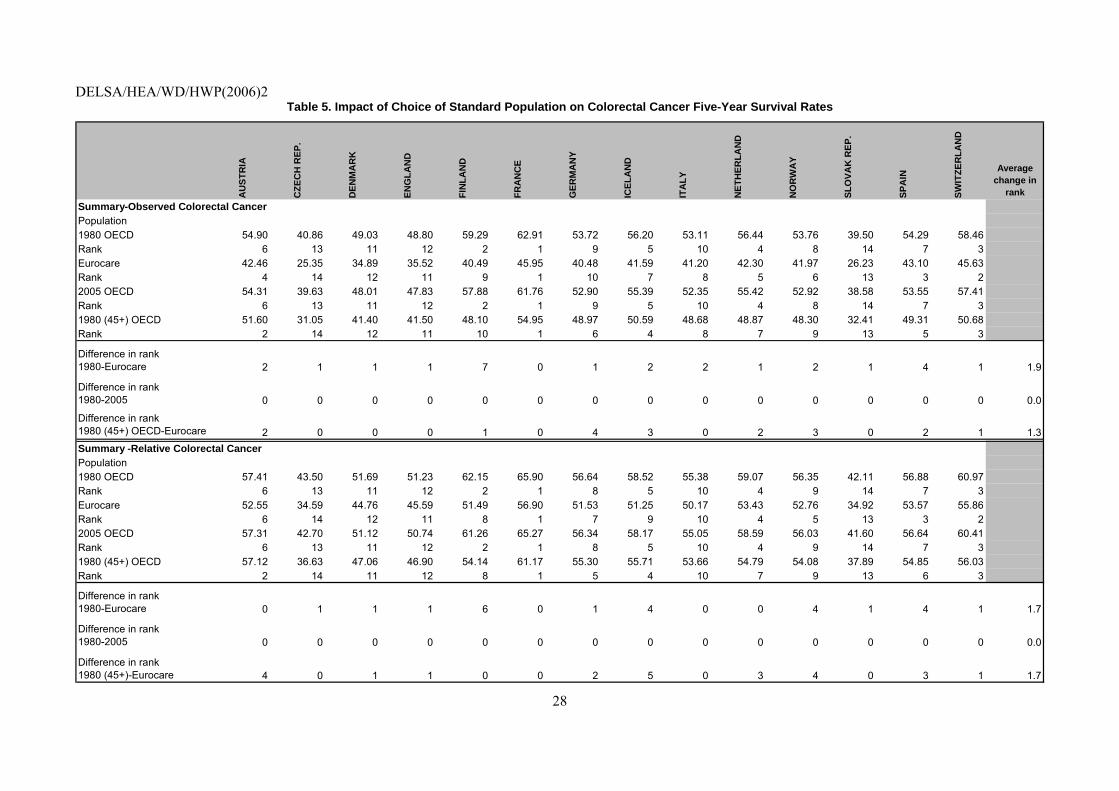
57. An analysis of the 15 countries is summarised in the set of tables that follows. The tables (Tables 3-5) presents a summary of the rates, ranks and change in ranks when looking at the 1980 OECD standard population, the 2005 OECD standard population and the Eurocare standard population. The tables also presents a summary of the rates, ranks and change in ranks when looking just at the 1980 45+ standard population and the corresponding Eurocare standard population. The tables are split by disease (Table 3- breast cancer; Table 4- cervical cancer and Table 5- colorectal cancer).
58. The results of this analysis generally support the more limited analysis conducted on the four countries that submitted standardised data to the OECD. First, there appears to be virtually no difference in countries’ relative rankings between using the 1980 and 2005 OECD standard populations. Secondly, there appears to be a small difference on the ranks of countries between using the 1980 OECD standard population and the Eurocare cancer population for relative survival rates. There is, however, some modest influence on the ranks of countries between using the 1980 OECD standard population and the Eurocare cancer population in terms of observed survival. Relative survival rates are the ratio of the disease-specific mortality to overall mortality in a given population. The above finding, therefore, is not surprising as these relative survival rates may account to some degree for the age structure of the general population. Finally, it appears that the use of a truncated sample and the 1980 OECD standard population (at age 45+) provides estimates moderately different from the ones based on the Eurocare cancer population.
28. Capocaccia R, Gatta G, Roazzi P, Carrani E, Santaquilani M, De Angelis R, Tavilla A and the
EUROCARE Working Group. The EUROCARE-3 database: methodology of data collection, standardisation, quality control and statistical analysis. Annals of Oncology 14 (Supplement 5): v14–v27, 2003.
DELSA/HEA/WD/HWP(2006)2
26
Table 3. Impact of Choice of Standard Population on Breast Cancer Five-Year Survival Rates
AU
STR
IA
CZE
CH
REP
.
DEN
MA
RK
ENG
LAN
D
FIN
LAN
D
FRA
NC
E
GER
MA
NY
ICEL
AN
D
ITA
LY
NET
HER
LAN
D
NO
RW
AY
SLO
VAK
REP
.
SPA
IN
SWED
EN
SWIT
ZER
LAN
D
Average change in rank
Summary - Observed Breast CancerPopulation1980 OECD 70.22 56.30 68.88 69.35 76.63 77.36 68.80 74.30 75.94 72.96 71.98 53.60 72.50 78.38 76.18Rank 10 14 12 11 3 2 13 6 5 7 9 15 8 1 4Eurocare 66.74 52.03 64.57 64.53 71.81 72.99 65.31 70.25 72.03 69.21 68.17 49.73 69.44 74.17 71.90Rank 10 14 12 13 5 2 11 6 3 8 9 15 7 1 42005 OECD 69.51 55.43 68.08 68.42 75.65 76.43 68.03 73.65 75.12 72.18 71.15 52.84 71.88 77.39 75.22Rank 10 14 12 11 3 2 13 6 5 7 9 15 8 1 41980 (45+) OECD 70.22 56.30 68.88 69.35 76.63 77.36 68.80 74.30 75.94 72.96 71.98 53.60 72.50 78.38 76.18Rank 10 14 12 11 3 2 13 6 5 7 9 15 8 1 4
Difference in rank1980-Eurocare 0 0 0 2 2 0 2 0 2 1 0 0 1 0 0 0.7
Difference in rank1980-2005 0 0 0 0 0 0 0 0 0 0 0 0 0 0 0 0.0
Difference in rank1980 (45+) -Eurocare 0 0 0 2 2 0 2 0 2 1 0 0 1 0 0 0.7Summary - Relative Breast CancerPopulation1980 OECD 74.90 68.09 77.35 75.22 81.80 83.68 74.79 77.38 82.44 78.95 77.09 64.18 78.77 82.42 83.11Rank 12 14 9 11 5 1 13 8 3 6 10 15 7 4 2Eurocare 75.43 64.00 74.92 73.64 81.38 81.35 75.45 79.62 80.55 78.23 77.26 59.48 78.03 82.62 79.98Rank 11 14 12 13 2 3 10 6 4 7 9 15 8 1 52005 OECD 75.00 67.57 77.10 75.07 81.80 83.42 74.87 77.81 82.23 78.89 77.12 63.60 78.71 82.42 82.72Rank 12 14 10 11 5 1 13 8 4 6 9 15 7 3 21980 (45+) OECD 76.35 64.17 76.19 75.80 83.39 82.94 76.08 81.24 81.64 79.25 78.47 59.96 78.19 84.48 81.44Rank 10 14 11 13 2 3 12 6 4 7 8 15 9 1 5
Difference in rank1980-Eurocare 1 0 3 2 3 2 3 2 1 1 1 0 1 3 3 1.7
Difference in rank1980-2005 0 0 1 0 0 0 0 0 1 0 1 0 0 1 0 0.3
Difference in rank1980 (45+) -Eurocare 1 0 1 0 0 0 2 0 0 0 1 0 1 0 0 0.4
DELSA/HEA/WD/HWP(2006)2
27
Table 4. Impact of Choice of Standard Population on Cervical Cancer Five-Year Survival Rates
AU
STR
IA
CZE
CH
REP
.
DEN
MA
RK
ENG
LAN
D
FIN
LAN
D
FRA
NC
E
GER
MA
NY
ICEL
AN
D
ITA
LY
NET
HER
LAN
D
NO
RW
AY
SLO
VAK
REP
.
SPA
IN
SWED
EN
SWIT
ZER
LAN
D
Average change in
rankSummary-Observed Cervical CancerPopulation1980 OECD 66.48 68.62 71.43 69.05 71.40 71.08 64.97 73.05 70.30 73.99 73.26 62.75 71.37 75.24 72.87Rank 13 12 6 11 7 9 14 4 10 2 3 15 8 1 5Eurocare 60.54 61.09 63.21 60.80 62.92 65.03 59.67 65.27 63.90 66.03 65.66 54.36 65.31 66.83 66.00Rank 13 11 9 12 10 7 14 6 8 2 4 15 5 1 32005 OECD 64.93 66.69 69.33 67.05 69.32 69.44 63.45 70.99 68.68 72.09 71.28 60.69 69.79 73.13 71.22Rank 13 12 8 11 9 7 14 5 10 2 3 15 6 1 41980 (45+) OECD 55.57 54.79 55.44 53.04 54.82 60.79 54.94 56.33 59.02 58.17 57.90 46.98 59.22 58.51 60.15Rank 9 13 10 14 12 1 11 8 4 6 7 15 3 5 2
Difference in rank1980-Eurocare 0 1 3 1 3 2 0 2 2 0 1 0 3 0 2 1.3
Difference in rank1980-2005 0 0 2 0 2 2 0 1 0 0 0 0 2 0 1 0.7
Difference in rank1980 (45+)-Eurocare 4 2 1 2 2 6 3 2 4 4 3 0 2 4 1 2.7Summary-Relative Cervical CancerPopulation1980 OECD 68.23 71.12 73.60 70.83 73.19 72.74 67.19 74.95 71.86 75.93 75.14 64.53 73.23 76.86 74.45Rank 13 11 6 12 8 9 14 4 10 2 3 15 7 1 5Eurocare 63.59 65.27 66.76 63.81 65.99 67.77 63.50 68.61 66.55 69.41 68.97 57.15 68.66 69.61 68.65Rank 13 11 8 12 10 7 14 6 9 2 3 15 4 1 52005 OECD 67.02 69.59 71.83 69.13 71.45 71.37 66.07 73.24 70.51 74.41 73.53 62.70 72.05 75.04 73.07Rank 13 11 7 12 8 9 14 4 10 2 3 15 6 1 51980 (45+) OECD 59.31 60.17 60.07 56.89 58.61 64.23 59.75 60.63 62.35 62.35 62.05 50.66 63.22 61.98 63.45Rank 12 9 10 14 13 1 11 8 5 4 6 15 3 7 2
Difference in rank1980-Eurocare 0 0 2 0 2 2 0 2 1 0 0 0 3 0 0 0.8
Difference in rank1980-2005 0 0 1 0 0 0 0 0 0 0 0 0 1 0 0 0.1
Difference in rank1980 (45+)-Eurocare 1 2 2 2 3 6 3 2 4 2 3 0 1 6 3 2.7
DELSA/HEA/WD/HWP(2006)2
28
Table 5. Impact of Choice of Standard Population on Colorectal Cancer Five-Year Survival Rates
AU
STR
IA
CZE
CH
REP
.
DEN
MA
RK
ENG
LAN
D
FIN
LAN
D
FRA
NC
E
GER
MA
NY
ICEL
AN
D
ITA
LY
NET
HER
LAN
D
NO
RW
AY
SLO
VAK
REP
.
SPA
IN
SWIT
ZER
LAN
D
Average change in
rankSummary-Observed Colorectal CancerPopulation1980 OECD 54.90 40.86 49.03 48.80 59.29 62.91 53.72 56.20 53.11 56.44 53.76 39.50 54.29 58.46Rank 6 13 11 12 2 1 9 5 10 4 8 14 7 3Eurocare 42.46 25.35 34.89 35.52 40.49 45.95 40.48 41.59 41.20 42.30 41.97 26.23 43.10 45.63Rank 4 14 12 11 9 1 10 7 8 5 6 13 3 22005 OECD 54.31 39.63 48.01 47.83 57.88 61.76 52.90 55.39 52.35 55.42 52.92 38.58 53.55 57.41Rank 6 13 11 12 2 1 9 5 10 4 8 14 7 31980 (45+) OECD 51.60 31.05 41.40 41.50 48.10 54.95 48.97 50.59 48.68 48.87 48.30 32.41 49.31 50.68Rank 2 14 12 11 10 1 6 4 8 7 9 13 5 3
Difference in rank1980-Eurocare 2 1 1 1 7 0 1 2 2 1 2 1 4 1 1.9
Difference in rank1980-2005 0 0 0 0 0 0 0 0 0 0 0 0 0 0 0.0
Difference in rank1980 (45+) OECD-Eurocare 2 0 0 0 1 0 4 3 0 2 3 0 2 1 1.3Summary -Relative Colorectal CancerPopulation1980 OECD 57.41 43.50 51.69 51.23 62.15 65.90 56.64 58.52 55.38 59.07 56.35 42.11 56.88 60.97Rank 6 13 11 12 2 1 8 5 10 4 9 14 7 3Eurocare 52.55 34.59 44.76 45.59 51.49 56.90 51.53 51.25 50.17 53.43 52.76 34.92 53.57 55.86Rank 6 14 12 11 8 1 7 9 10 4 5 13 3 22005 OECD 57.31 42.70 51.12 50.74 61.26 65.27 56.34 58.17 55.05 58.59 56.03 41.60 56.64 60.41Rank 6 13 11 12 2 1 8 5 10 4 9 14 7 31980 (45+) OECD 57.12 36.63 47.06 46.90 54.14 61.17 55.30 55.71 53.66 54.79 54.08 37.89 54.85 56.03Rank 2 14 11 12 8 1 5 4 10 7 9 13 6 3
Difference in rank1980-Eurocare 0 1 1 1 6 0 1 4 0 0 4 1 4 1 1.7
Difference in rank1980-2005 0 0 0 0 0 0 0 0 0 0 0 0 0 0 0.0
Difference in rank1980 (45+)-Eurocare 4 0 1 1 0 0 2 5 0 3 4 0 3 1 1.7
DELSA/HEA/WD/HWP(2006)2
29
59. Recommendation: Based on the analyses and review of the literature conducted and summarised above, there appears to be little difference between the use of the 1980 and 2005 OECD standard populations. When comparing estimates based on the 1980 OECD standard populations to the Eurocare cancer population, there were just slight differences in results for relative survival rates and moderate differences for absolute survival rates. In some cases, (i.e. breast cancer) the differences in absolute survival rates can be further reduced by the use of a truncated sample at age 45. In other cases (i.e. cervical cancer) these differences are not reduced. Given these findings, substantial effort of developing an OECD cancer population does not seem warranted. In addition, it is unclear that uniformly applying an age adjustment using a truncated sample at 45+ may not be warranted either. We recommend the use of the 1980 OECD standard population for age adjusting cancer survival rates for the current set of HCQI indicators. Future work on the HCQI indicators may consider more specialised adjustment approaches.
Handling Missing Data
60. The handling of missing data may influence both national and international assessments of health status and health care. There may be many reasons why data would be missing from a data set, and different types of data (surveys, administrative data, etc) may have missing data for different reasons. In surveys, a person may refuse to answer a question or they may not understand the question, or they may terminate the interview. In administrative data, a code may not have been entered at all or as an invalid code. The literature is mixed in its findings of the impact of nonresponse on national level statistics.29 In addition, policies for national and international reporting efforts vary, with most clinical trials including missing or “lost to follow up” data in the analysis and other national or international surveys excluding or imputing missing, in some cases depending on the indicator itself.30,31,32
61. Data may be missing at random, in which case, across large enough samples at the national level, we would not expect this missing data to have a systematic influence on results. However, many countries have standards for how missing data should be handled. Standards have been shown to vary widely across states or regions within a country on how missing data is handled and naturally, would be expected to vary significantly across countries. Since the assumption is that these standards would be systematically enforced, there is some concern that the handling of missing data on certain variables might have an influence on results and conclusions
62. There are two types of missing data: total (or unit) missing, when no information is collected on a sampled unit, and partial (or item) missing, when the absence of information is only limited to some variables.33 When constructing quality indicators, the most salient issue is how to deal with partially
29. Oropesa RS, Landale NS. Nonresponse in follow-back surveys of ethnic minority groups: an analysis of the
Puerto Rican Maternal and Infant Health Study. Matern Child Health J. 2002 Mar;6(1):49-58.
30. C Sanmartin, E Ng, D Blackwell, J Gentleman, M Martinez, C Simile. Joint US/Canada Survey of Health 2002-03. Statistics Canada and the US Centers for Disease Control and Prevention. Catalogue No. 82M0022XIE. 2003.
31. US Department of Health and Human Services, Agency for Healthcare Research and Quality: National Healthcare Quality Report. Rockville, MD: Agency for Healthcare Research and Quality; 2003.
32. Patient Care In The Community - Specialist Care Nursing Summary Information For 2001-02. UK Department of Health, Government Statistical Service. November 2002. http://www.dh.gov.uk/assetRoot/04/02/32/75/04023275.pdf. Accessed 9/12/05.
33. Statistical Society of Canada. Handling Missing Data Case Study. 2002 Case Studies. http://www.ssc.ca/documents/case_studies/2002/missing_e.html. Last accessed 9/12/05.
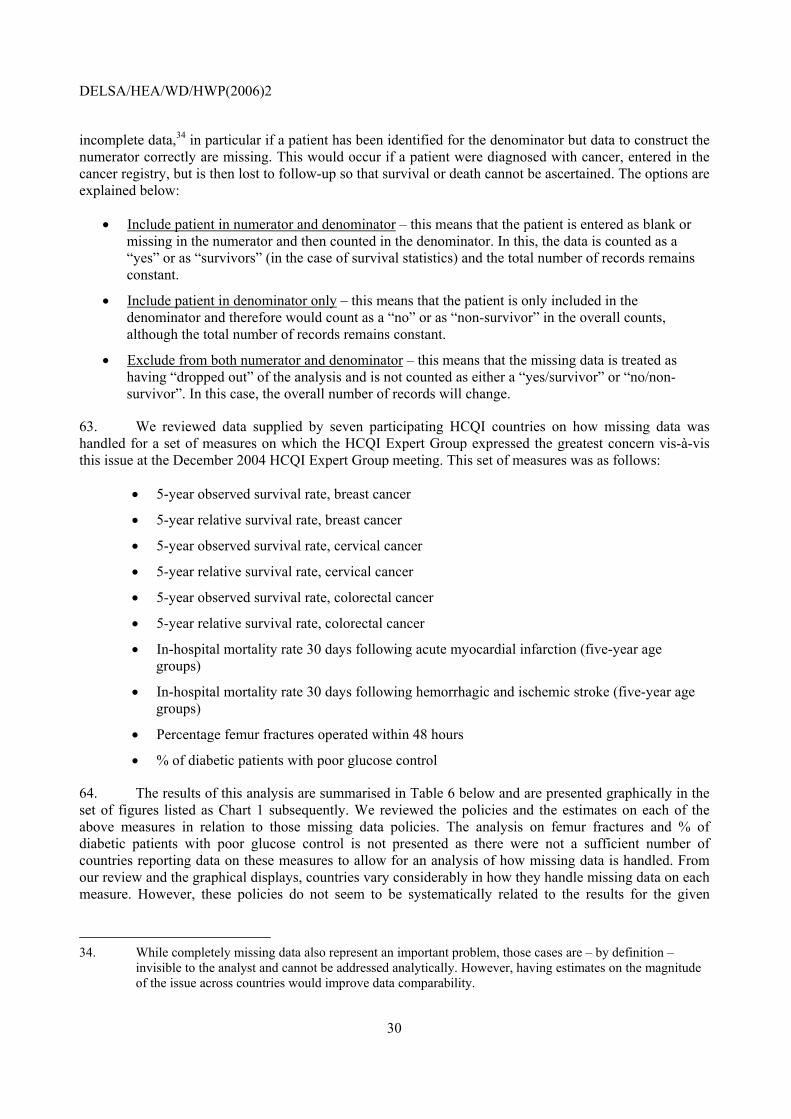
DELSA/HEA/WD/HWP(2006)2
30
incomplete data,34 in particular if a patient has been identified for the denominator but data to construct the numerator correctly are missing. This would occur if a patient were diagnosed with cancer, entered in the cancer registry, but is then lost to follow-up so that survival or death cannot be ascertained. The options are explained below:
• Include patient in numerator and denominator – this means that the patient is entered as blank or missing in the numerator and then counted in the denominator. In this, the data is counted as a “yes” or as “survivors” (in the case of survival statistics) and the total number of records remains constant.
• Include patient in denominator only – this means that the patient is only included in the denominator and therefore would count as a “no” or as “non-survivor” in the overall counts, although the total number of records remains constant.
• Exclude from both numerator and denominator – this means that the missing data is treated as having “dropped out” of the analysis and is not counted as either a “yes/survivor” or “no/non-survivor”. In this case, the overall number of records will change.
63. We reviewed data supplied by seven participating HCQI countries on how missing data was handled for a set of measures on which the HCQI Expert Group expressed the greatest concern vis-à-vis this issue at the December 2004 HCQI Expert Group meeting. This set of measures was as follows:
• 5-year observed survival rate, breast cancer
• 5-year relative survival rate, breast cancer
• 5-year observed survival rate, cervical cancer
• 5-year relative survival rate, cervical cancer
• 5-year observed survival rate, colorectal cancer
• 5-year relative survival rate, colorectal cancer
• In-hospital mortality rate 30 days following acute myocardial infarction (five-year age groups)
• In-hospital mortality rate 30 days following hemorrhagic and ischemic stroke (five-year age groups)
• Percentage femur fractures operated within 48 hours
• % of diabetic patients with poor glucose control
64. The results of this analysis are summarised in Table 6 below and are presented graphically in the set of figures listed as Chart 1 subsequently. We reviewed the policies and the estimates on each of the above measures in relation to those missing data policies. The analysis on femur fractures and % of diabetic patients with poor glucose control is not presented as there were not a sufficient number of countries reporting data on these measures to allow for an analysis of how missing data is handled. From our review and the graphical displays, countries vary considerably in how they handle missing data on each measure. However, these policies do not seem to be systematically related to the results for the given
34. While completely missing data also represent an important problem, those cases are – by definition –
invisible to the analyst and cannot be addressed analytically. However, having estimates on the magnitude of the issue across countries would improve data comparability.

DELSA/HEA/WD/HWP(2006)2
31
countries. These results should, of course, be viewed with caution, as the sample of countries supplying data on this question is small.
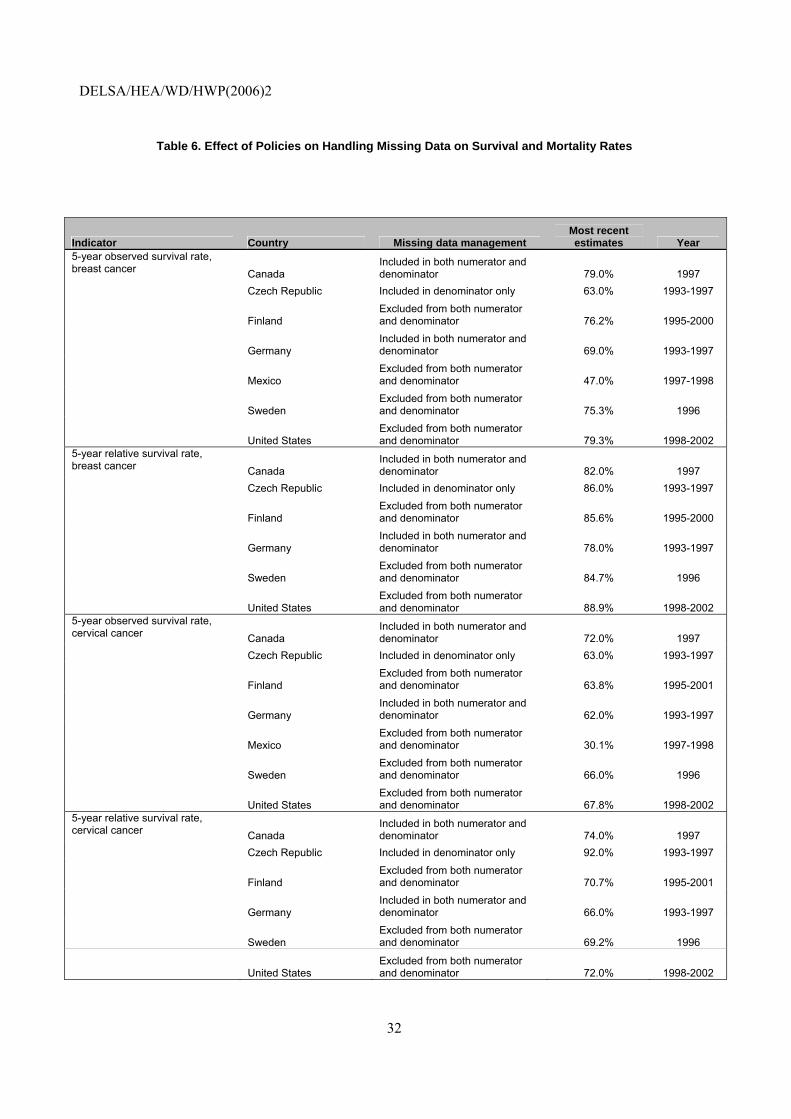
DELSA/HEA/WD/HWP(2006)2
32
Table 6. Effect of Policies on Handling Missing Data on Survival and Mortality Rates
Indicator Country Missing data management Most recent estimates Year
5-year observed survival rate, breast cancer Canada
Included in both numerator and denominator 79.0% 1997
Czech Republic Included in denominator only 63.0% 1993-1997
Finland Excluded from both numerator and denominator 76.2% 1995-2000
Germany Included in both numerator and denominator 69.0% 1993-1997
Mexico Excluded from both numerator and denominator 47.0% 1997-1998
Sweden Excluded from both numerator and denominator 75.3% 1996
United States Excluded from both numerator and denominator 79.3% 1998-2002
5-year relative survival rate, breast cancer Canada
Included in both numerator and denominator 82.0% 1997
Czech Republic Included in denominator only 86.0% 1993-1997
Finland Excluded from both numerator and denominator 85.6% 1995-2000
Germany Included in both numerator and denominator 78.0% 1993-1997
Sweden Excluded from both numerator and denominator 84.7% 1996
United States Excluded from both numerator and denominator 88.9% 1998-2002
5-year observed survival rate, cervical cancer Canada
Included in both numerator and denominator 72.0% 1997
Czech Republic Included in denominator only 63.0% 1993-1997
Finland Excluded from both numerator and denominator 63.8% 1995-2001
Germany Included in both numerator and denominator 62.0% 1993-1997
Mexico Excluded from both numerator and denominator 30.1% 1997-1998
Sweden Excluded from both numerator and denominator 66.0% 1996
United States Excluded from both numerator and denominator 67.8% 1998-2002
5-year relative survival rate, cervical cancer Canada
Included in both numerator and denominator 74.0% 1997
Czech Republic Included in denominator only 92.0% 1993-1997
Finland Excluded from both numerator and denominator 70.7% 1995-2001
Germany Included in both numerator and denominator 66.0% 1993-1997
Sweden Excluded from both numerator and denominator 69.2% 1996
United States Excluded from both numerator and denominator 72.0% 1998-2002

DELSA/HEA/WD/HWP(2006)2
33
Indicator Country Missing data management Most recent estimates Year
5-year observed survival rate, colorectal cancer Canada
Included in both numerator and denominator 59.0% 1997
Czech Republic● Included in denominator only 32.0% 1993-1997
Finland Excluded from both numerator and denominator 43.1% 1995-2000
Germany● Included in both numerator and denominator 41.5% 1993-1997
Mexico Excluded from both numerator and denominator 47.5% 1997-1998
Sweden Excluded from both numerator and denominator 45.9% 1996
United States Excluded from both numerator and denominator 51.0% 1998-2002
5-year relative survival rate, colorectal cancer Canada
Included in both numerator and denominator 62.0% 1997
Czech Republic● Included in denominator only 76.0% 1993-1997
Finland Excluded from both numerator and denominator 56.3% 1995-2000
Germany● Included in both numerator and denominator 55.5% 1993-1997
Sweden Excluded from both numerator and denominator 58.3% 1996
United States Excluded from both numerator and denominator 64.4% 1998-2002
In-hospital mortality rate 30 days following acute myocardial infarction Finland
Included in both numerator and denominator 18.0% 2003
Germany Excluded from both numerator and denominator 11.9% 1999
Mexico Excluded from both numerator and denominator 23.1% 2004
Sweden Included in both numerator and denominator 11.5% 2001
In-hospital mortality rate 30 days following hemorrhagic stroke (five-year age groups) Finland
Included in both numerator and denominator 24.0% 2003
Germany Excluded from both numerator and denominator 21.0% 1999
Mexico Excluded from both numerator and denominator 19.4% 2004
Sweden Included in both numerator and denominator 6.4% 2004
In-hospital mortality rate 30 days following ischemic stroke (five-year age groups) Finland
Included in both numerator and denominator 11.0% 2003
Germany Excluded from both numerator and denominator 10.9% 1999
Mexico Excluded from both numerator and denominator 7.1% 2004
Sweden Included in both numerator and denominator 4.6% 2004
●This is an overall value, for data desegregation between men and women see part III, table 25
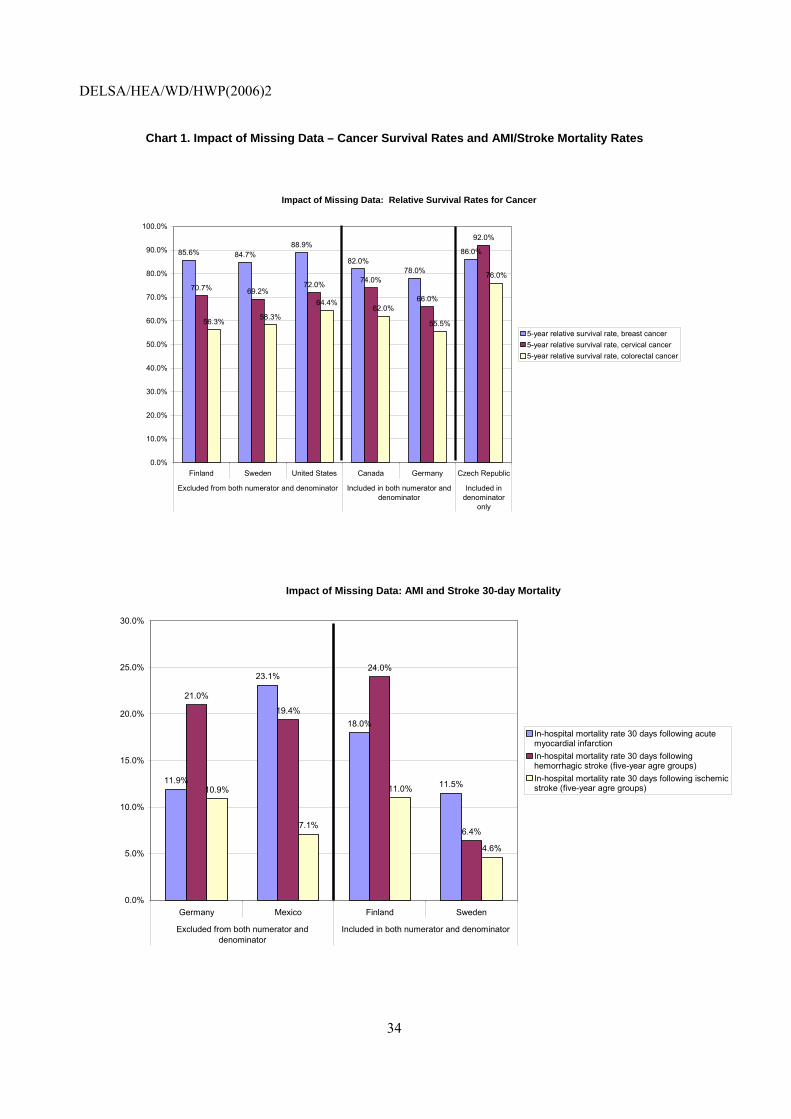
DELSA/HEA/WD/HWP(2006)2
34
Chart 1. Impact of Missing Data – Cancer Survival Rates and AMI/Stroke Mortality Rates
Impact of Missing Data: Relative Survival Rates for Cancer
85.6% 84.7%88.9%
82.0%78.0%
86.0%
70.7% 69.2%72.0% 74.0%
66.0%
92.0%
56.3% 58.3%
64.4%62.0%
55.5%
76.0%
0.0%
10.0%
20.0%
30.0%
40.0%
50.0%
60.0%
70.0%
80.0%
90.0%
100.0%
Finland Sweden United States Canada Germany Czech Republic
Excluded from both numerator and denominator Included in both numerator anddenominator
Included indenominator
only
5-year relative survival rate, breast cancer5-year relative survival rate, cervical cancer5-year relative survival rate, colorectal cancer
Impact of Missing Data: AMI and Stroke 30-day Mortality
11.9%
23.1%
18.0%
11.5%
21.0%
19.4%
24.0%
6.4%
10.9%
7.1%
11.0%
4.6%
0.0%
5.0%
10.0%
15.0%
20.0%
25.0%
30.0%
Germany Mexico Finland Sweden
Excluded from both numerator anddenominator
Included in both numerator and denominator
In-hospital mortality rate 30 days following acutemyocardial infarction In-hospital mortality rate 30 days followinghemorrhagic stroke (five-year agre groups)In-hospital mortality rate 30 days following ischemicstroke (five-year agre groups)
DELSA/HEA/WD/HWP(2006)2
35
65. Recommendation: We recommend that the HCQI Project not exclude the measures reviewed in the above analysis solely on the basis of differing policies regarding the handling of missing data. However, any discussion of the above measures should note the variability in countries policies regarding the handling of missing data and its possible influence on overall results. We recommend that countries agree on consensus policies for handling of missing data to improve comparability for future HCQI work.
Notification on Cases of Vaccine-Preventable Disease
66. Reporting of vaccine-preventable diseases is common practice in most OECD countries. The effect of mandatory notification on reporting rates of vaccine-preventable diseases has been examined by individual country registry programmes and in the literature. Some authors cite that such mandatory reporting systems are prone to underreporting, that few systematic studies have examined the timeliness and completeness of national and local reporting systems and that there still exist difficulties in consistent application of case definitions across settings for reporting purposes, it is generally accepted that these systems are suited to ongoing monitoring.35,36,37
67. A concern was raised by several countries in December 2004 in the use of the indicators on the incidence of vaccine-preventable diseases (pertussis, measles and Hepatitis B.) Namely, countries were concerned that results might be influenced by differences across countries in whether these three diseases have mandatory requirements at the national level for reporting either confirmed or suspected cases of any of these diseases.38
68. We used data from eight countries who submitted information as to the reporting requirements for measles, pertussis and Hepatitis B. We examined the average incidence levels across countries with different reporting policies and differences between individual countries based on these reporting policies examined graphically and with analysis of variance statistical tests.
69. Countries vary in terms of whether confirmed or suspected cases of certain vaccine-preventable diseases are required to be reported or not, with countries being roughly evenly split as to whether reporting for confirmed or both confirmed and suspected cases is required (Table 7). As can be seen from the attached graphs (Chart 2), there appears to be no systematic differences in the incidence of vaccine –preventable diseases based on country reporting requirements for confirmed or suspected cases. Statistical analyses on these differences were conducted and showed no statistical differences across countries in incidence levels of vaccine-preventable diseases based on reporting requirements. However, given the
35. Ramsay ME, Rushdy AA, Harris HE. Surveillance of hepatitis B: an example of a vaccine preventable
disease. Vaccine. 1998 Nov;16 Suppl:S76-80.
36. Australian Government. Department of Health and Aging. National Notifiable Diseases Surveillance System web site. http://www.health.gov.au/internet/wcms/publishing.nsf/Content/cda-surveil-surv_sys.htm#nndss. Last accessed 8/12/05
37. Jajosky RA, Groseclose SL. Evaluation of reporting timeliness of public health surveillance systems for infectious. diseases. BMC Public Health. 2004 Jul 26;4(1):29.
38. Note that an additional concern was raised by the Secretariat, which is that in the case of some countries, data gathered by the HCQI Project differed significantly from data reported in other data sources, such as the WHO Health for All database. The Secretariat undertook a detailed comparison on this and other indicators of the HCQI data and other data sources. In this case, differences were generally resolved by consulting other country data sources. However, in some cases, country data sources (i.e. national statistics institute web sites, etc.) introduced a third estimate that was different from the HCQI data and from the third party (i.e. WHO) data. The Secretariat is working to resolve these differences in consultation with country and WHO staff and future versions of this paper will report on that work.
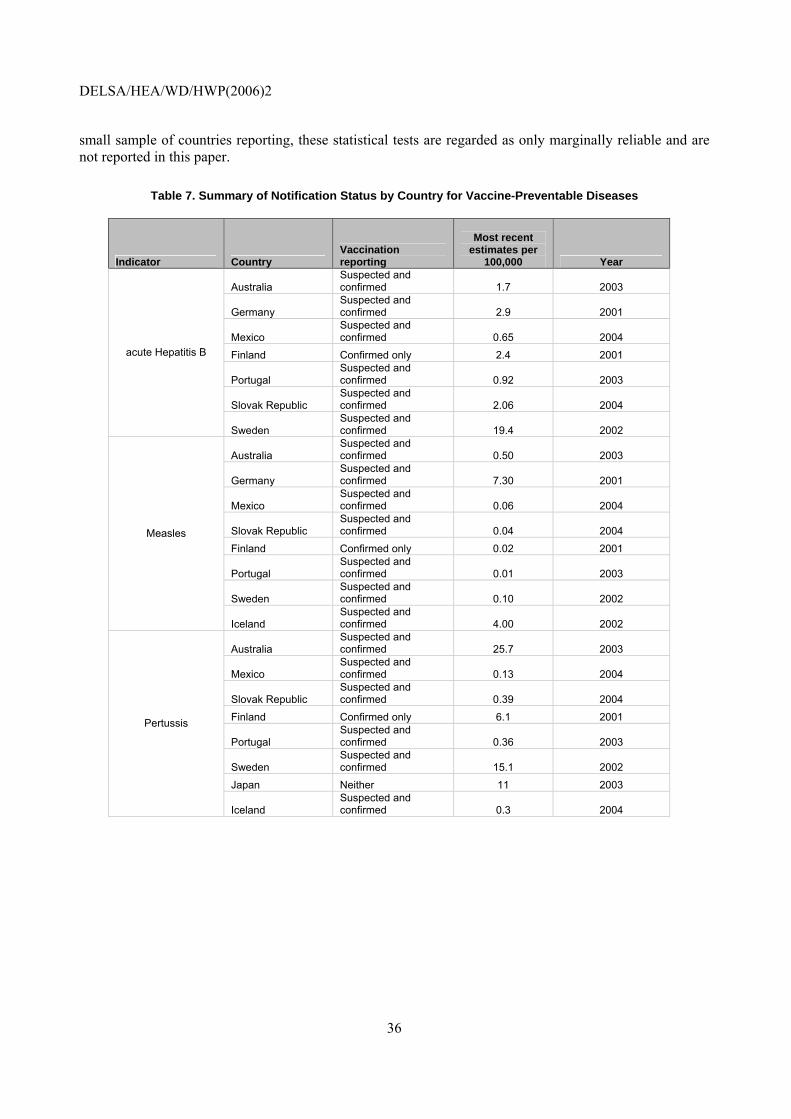
DELSA/HEA/WD/HWP(2006)2
36
small sample of countries reporting, these statistical tests are regarded as only marginally reliable and are not reported in this paper.
Table 7. Summary of Notification Status by Country for Vaccine-Preventable Diseases
Indicator Country Vaccination reporting
Most recent estimates per
100,000 Year
Australia Suspected and confirmed 1.7 2003
Germany Suspected and confirmed 2.9 2001
Mexico Suspected and confirmed 0.65 2004
Finland Confirmed only 2.4 2001
Portugal Suspected and confirmed 0.92 2003
Slovak Republic Suspected and confirmed 2.06 2004
acute Hepatitis B
Sweden Suspected and confirmed 19.4 2002
Australia Suspected and confirmed 0.50 2003
Germany Suspected and confirmed 7.30 2001
Mexico Suspected and confirmed 0.06 2004
Slovak Republic Suspected and confirmed 0.04 2004
Finland Confirmed only 0.02 2001
Portugal Suspected and confirmed 0.01 2003
Sweden Suspected and confirmed 0.10 2002
Measles
Iceland Suspected and confirmed 4.00 2002
Australia Suspected and confirmed 25.7 2003
Mexico Suspected and confirmed 0.13 2004
Slovak Republic Suspected and confirmed 0.39 2004
Finland Confirmed only 6.1 2001
Portugal Suspected and confirmed 0.36 2003
Sweden Suspected and confirmed 15.1 2002
Japan Neither 11 2003
Pertussis
Iceland Suspected and confirmed 0.3 2004
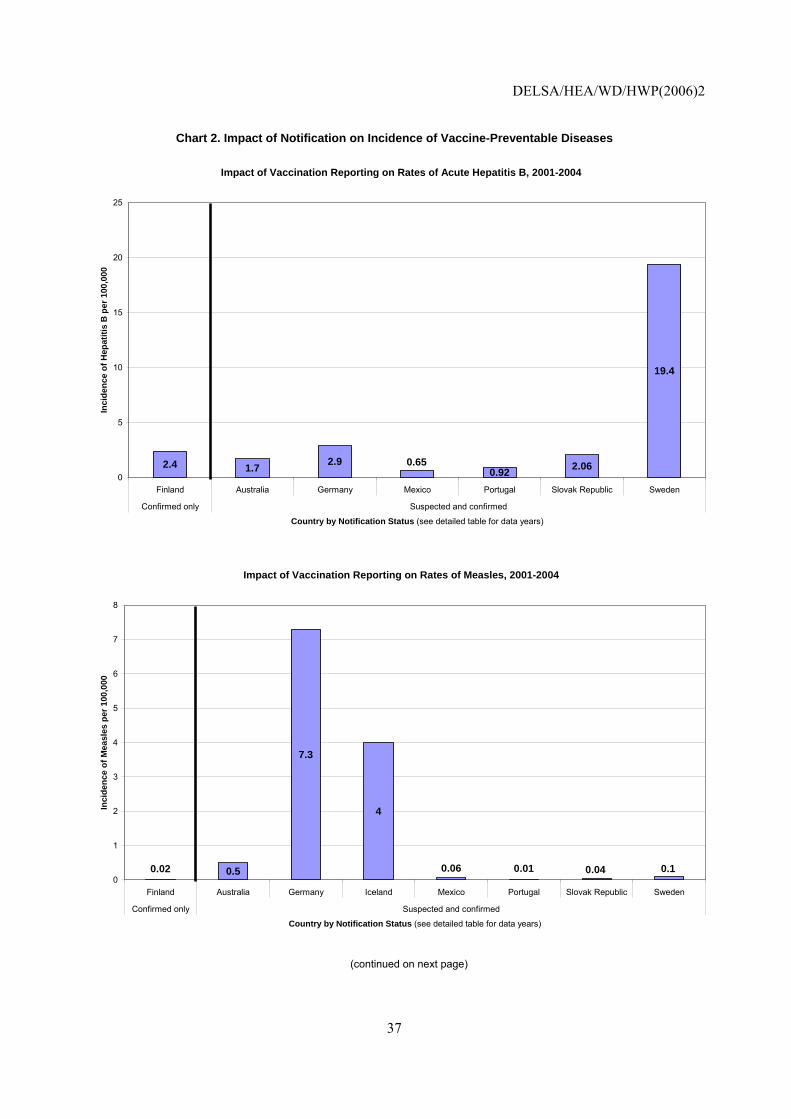
DELSA/HEA/WD/HWP(2006)2
37
Chart 2. Impact of Notification on Incidence of Vaccine-Preventable Diseases
Impact of Vaccination Reporting on Rates of Acute Hepatitis B, 2001-2004
2.4 1.7 2.90.92 2.06
19.4
0.650
5
10
15
20
25
Finland Australia Germany Mexico Portugal Slovak Republic Sweden
Confirmed only Suspected and confirmed
Country by Notification Status (see detailed table for data years)
Inci
denc
e of
Hep
atiti
s B
per
100
,000
Impact of Vaccination Reporting on Rates of Measles, 2001-2004
0.5
7.3
4
0.10.040.010.060.020
1
2
3
4
5
6
7
8
Finland Australia Germany Iceland Mexico Portugal Slovak Republic Sweden
Confirmed only Suspected and confirmed
Country by Notification Status (see detailed table for data years)
Inci
denc
e of
Mea
sles
per
100
,000
(continued on next page)
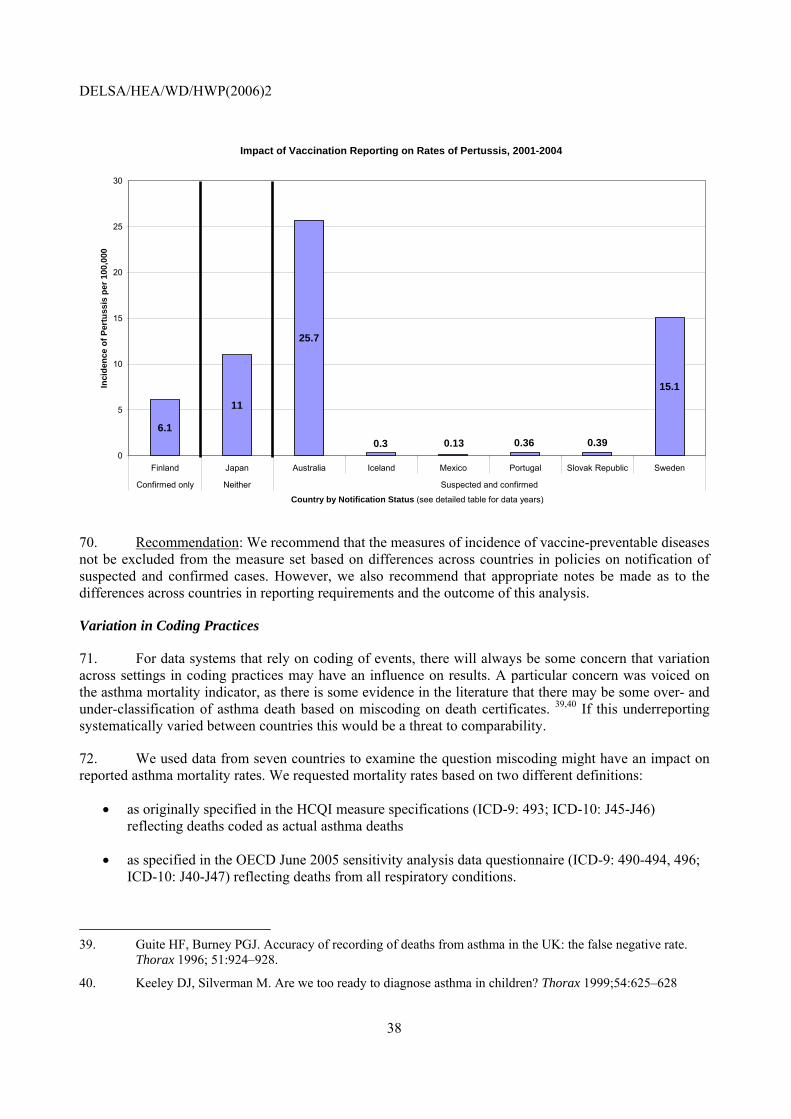
DELSA/HEA/WD/HWP(2006)2
38
Impact of Vaccination Reporting on Rates of Pertussis, 2001-2004
6.1
11
25.7
15.1
0.390.360.130.30
5
10
15
20
25
30
Finland Japan Australia Iceland Mexico Portugal Slovak Republic Sweden
Confirmed only Neither Suspected and confirmed
Country by Notification Status (see detailed table for data years)
Inci
denc
e of
Per
tuss
is p
er 1
00,0
00
70. Recommendation: We recommend that the measures of incidence of vaccine-preventable diseases not be excluded from the measure set based on differences across countries in policies on notification of suspected and confirmed cases. However, we also recommend that appropriate notes be made as to the differences across countries in reporting requirements and the outcome of this analysis.
Variation in Coding Practices
71. For data systems that rely on coding of events, there will always be some concern that variation across settings in coding practices may have an influence on results. A particular concern was voiced on the asthma mortality indicator, as there is some evidence in the literature that there may be some over- and under-classification of asthma death based on miscoding on death certificates. 39,40 If this underreporting systematically varied between countries this would be a threat to comparability.
72. We used data from seven countries to examine the question miscoding might have an impact on reported asthma mortality rates. We requested mortality rates based on two different definitions:
• as originally specified in the HCQI measure specifications (ICD-9: 493; ICD-10: J45-J46) reflecting deaths coded as actual asthma deaths
• as specified in the OECD June 2005 sensitivity analysis data questionnaire (ICD-9: 490-494, 496; ICD-10: J40-J47) reflecting deaths from all respiratory conditions.
39. Guite HF, Burney PGJ. Accuracy of recording of deaths from asthma in the UK: the false negative rate.
Thorax 1996; 51:924–928.
40. Keeley DJ, Silverman M. Are we too ready to diagnose asthma in children? Thorax 1999;54:625–628
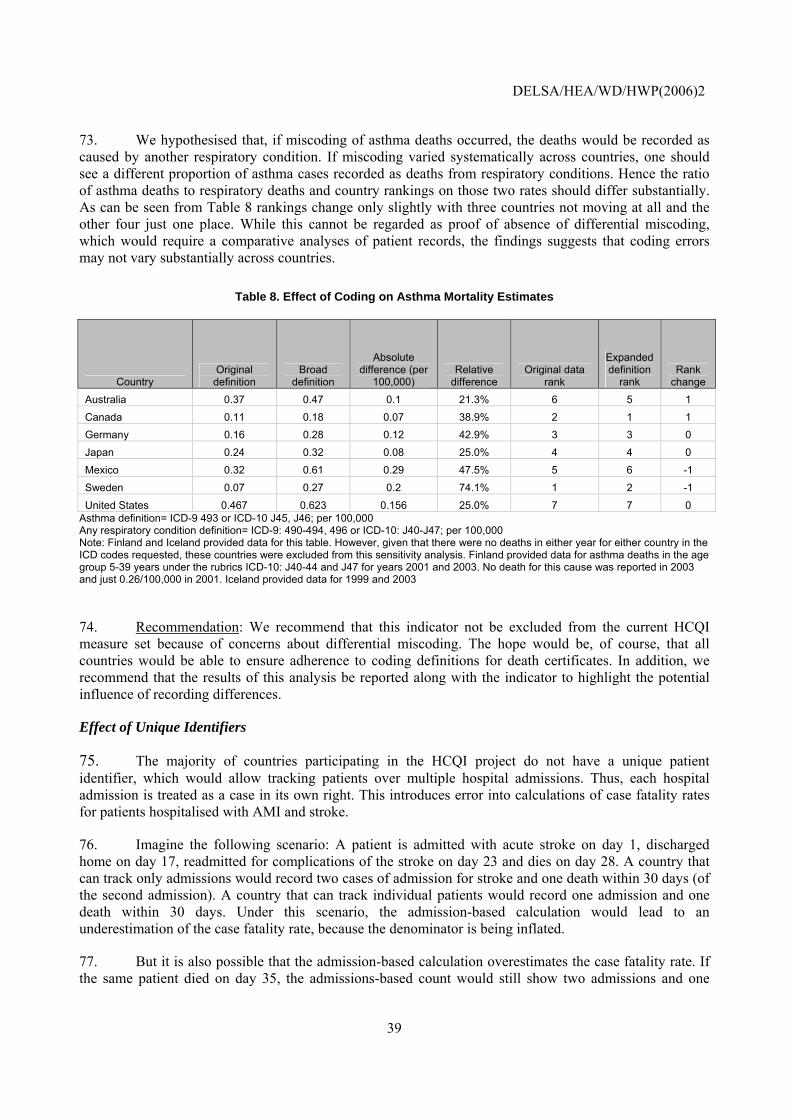
DELSA/HEA/WD/HWP(2006)2
39
73. We hypothesised that, if miscoding of asthma deaths occurred, the deaths would be recorded as caused by another respiratory condition. If miscoding varied systematically across countries, one should see a different proportion of asthma cases recorded as deaths from respiratory conditions. Hence the ratio of asthma deaths to respiratory deaths and country rankings on those two rates should differ substantially. As can be seen from Table 8 rankings change only slightly with three countries not moving at all and the other four just one place. While this cannot be regarded as proof of absence of differential miscoding, which would require a comparative analyses of patient records, the findings suggests that coding errors may not vary substantially across countries.
Table 8. Effect of Coding on Asthma Mortality Estimates
Country Original
definition Broad
definition
Absolute difference (per
100,000) Relative
difference Original data
rank
Expanded definition
rank Rank
change Australia 0.37 0.47 0.1 21.3% 6 5 1 Canada 0.11 0.18 0.07 38.9% 2 1 1 Germany 0.16 0.28 0.12 42.9% 3 3 0 Japan 0.24 0.32 0.08 25.0% 4 4 0 Mexico 0.32 0.61 0.29 47.5% 5 6 -1 Sweden 0.07 0.27 0.2 74.1% 1 2 -1 United States 0.467 0.623 0.156 25.0% 7 7 0
Asthma definition= ICD-9 493 or ICD-10 J45, J46; per 100,000 Any respiratory condition definition= ICD-9: 490-494, 496 or ICD-10: J40-J47; per 100,000 Note: Finland and Iceland provided data for this table. However, given that there were no deaths in either year for either country in the ICD codes requested, these countries were excluded from this sensitivity analysis. Finland provided data for asthma deaths in the age group 5-39 years under the rubrics ICD-10: J40-44 and J47 for years 2001 and 2003. No death for this cause was reported in 2003 and just 0.26/100,000 in 2001. Iceland provided data for 1999 and 2003
74. Recommendation: We recommend that this indicator not be excluded from the current HCQI measure set because of concerns about differential miscoding. The hope would be, of course, that all countries would be able to ensure adherence to coding definitions for death certificates. In addition, we recommend that the results of this analysis be reported along with the indicator to highlight the potential influence of recording differences.
Effect of Unique Identifiers
75. The majority of countries participating in the HCQI project do not have a unique patient identifier, which would allow tracking patients over multiple hospital admissions. Thus, each hospital admission is treated as a case in its own right. This introduces error into calculations of case fatality rates for patients hospitalised with AMI and stroke.
76. Imagine the following scenario: A patient is admitted with acute stroke on day 1, discharged home on day 17, readmitted for complications of the stroke on day 23 and dies on day 28. A country that can track only admissions would record two cases of admission for stroke and one death within 30 days (of the second admission). A country that can track individual patients would record one admission and one death within 30 days. Under this scenario, the admission-based calculation would lead to an underestimation of the case fatality rate, because the denominator is being inflated.
77. But it is also possible that the admission-based calculation overestimates the case fatality rate. If the same patient died on day 35, the admissions-based count would still show two admissions and one
DELSA/HEA/WD/HWP(2006)2
40
death, whereas the patient-based count would correctly show one admission and no death. Or, if the diagnosis for the second admission was, say, pneumonia (a common complication of stroke) and the patient died on day 28 of the episode, the admission-based calculation would suggest one admission and no death, but the patient-based method one admission and one death.
78. We can therefore not predict a priori what the effect of using the admission-based calculation will be, but it becomes an empirical question to test which of the three possible scenarios is more common. One should keep in mind, however, that the most likely sequence of events will still be one admission that leads to either permanent discharge or death, i.e. to equivalence of the two methods.
79. We used data from countries that can calculate the case fatality rates both ways to investigate the error introduced by the admission-based method. We calculated the absolute and relative error as well as the change in relative ranking of the country that the error would produce. The results are shown separately for AMI, haemorrhagic and ischemic stroke in Table 9.
80. It can be seen that the admissions-based calculation typically underestimates the true case fatality rates, indicating that the first scenario depicted above dominates. The absolute error is usually quite small, between 1 and 6 percent, but the relative error can become relatively large, given the small base from which it is calculated. The error does not change the rank order of countries.
81. Recommendation: To the degree that definite conclusions can be drawn from this small sample, the admission-based calculation of case fatality rate appears to slightly underestimate the true rate, but has limited impact on the interpretation of the results. We recommend that these measures not be excluded from the initial measure set based on these findings. The data should be reported in conjunction with average length of hospital stay and caution should be used when comparing countries with substantial differences in length of stay.
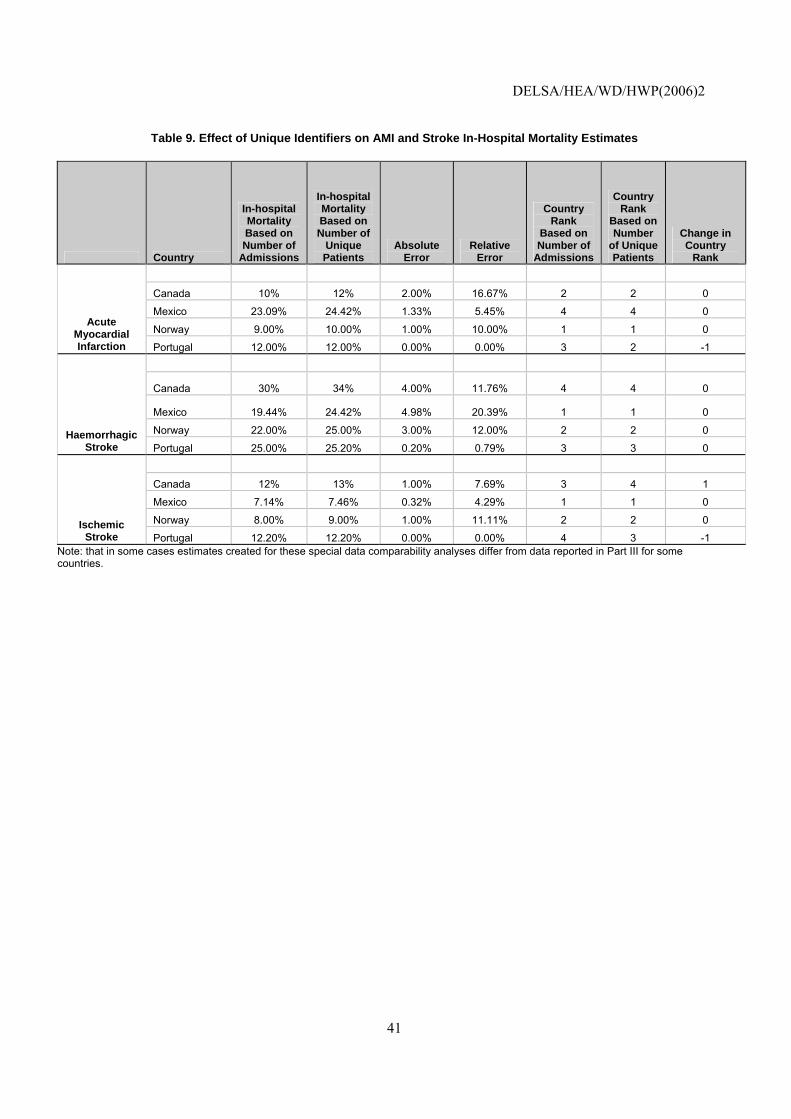
DELSA/HEA/WD/HWP(2006)2
41
Table 9. Effect of Unique Identifiers on AMI and Stroke In-Hospital Mortality Estimates
Country
In-hospital Mortality Based on Number of
Admissions
In-hospital Mortality Based on Number of
Unique Patients
Absolute Error
Relative Error
Country Rank
Based on Number of
Admissions
Country Rank
Based on Number
of Unique Patients
Change in Country
Rank Canada 10% 12% 2.00% 16.67% 2 2 0
Mexico 23.09% 24.42% 1.33% 5.45% 4 4 0
Norway 9.00% 10.00% 1.00% 10.00% 1 1 0 Acute
Myocardial Infarction Portugal 12.00% 12.00% 0.00% 0.00% 3 2 -1
Canada 30% 34% 4.00% 11.76% 4 4 0
Mexico 19.44% 24.42% 4.98% 20.39% 1 1 0
Norway 22.00% 25.00% 3.00% 12.00% 2 2 0 Haemorrhagic Stroke Portugal 25.00% 25.20% 0.20% 0.79% 3 3 0
Canada 12% 13% 1.00% 7.69% 3 4 1
Mexico 7.14% 7.46% 0.32% 4.29% 1 1 0
Norway 8.00% 9.00% 1.00% 11.11% 2 2 0 Ischemic Stroke Portugal 12.20% 12.20% 0.00% 0.00% 4 3 -1
Note: that in some cases estimates created for these special data comparability analyses differ from data reported in Part III for some countries.

DELSA/HEA/WD/HWP(2006)2
42
PART III – INDICATORS SPECIFICATIONS AND DATA RESULTS
DELSA/HEA/WD/HWP(2006)2
43
Summary of the Results of the Survey on Data Availability and Comparability
82. Following the recommendation of the Health Care Quality Indicators (HCQI) Expert Group at its November 2005 meeting, the Secretariat requested updated data and supporting documentation from the participating countries on the HCQI Initial Indicators. In addition, a follow-up questionnaire on potential comparability issues was sent to each of the 23 participating countries. All countries have replied to the request. The overall results of the survey on data were encouraging. For each indicator, at least some of the 23 participating countries could provide data and no indicator had fewer than eight submissions. Even for demanding measures, like “Diabetic Patients with Elevated HbA1c levels”, which requires conducting blood test in a population based sample, data sources could be identified in 11 countries. And almost all counties could construct cancer survival rates and immunisation rates. This suggests the existence of a sufficiently large data pool on the international level to construct an initial set of quality indicators.
83. A key issue in the HCQI indicator work was that, while countries can construct many indicators, inherent differences in the methodologies and data sources used could render them incomparable. In other words, differences in indicators would reflect data differences rather than differences in quality of care. For this survey, the Secretariat has obtained the indicators as they were supplied be each country according to national definitions. While the requests suggested a standard definition, no attempt was made to work with countries bilaterally to change national definitions to an international standard. This section of the Initial Indicators Report presents detailed information for each indicator on country sources and methods.
84. For this report, potential threats to the comparability of each indicator were documented and appraised along two dimensions, one being the severity of the threat, the other the likelihood to be able to address the issue. Solutions have been suggested where comparability differences seem to be remediable. Obviously, severe threat with low likelihood of addressing it would create the greatest challenge to international comparability. These solutions were then tested and the results of those tests have been reported in Part II of this report.
85. There were a large number of minor comparability issues, mostly with respect to the age range that was included in an indicator and the years for which data were available. It is quite likely that those inconsistencies could be addressed if an indicator were collected on a regular basis for international comparisons. Moreover, attention can be drawn to minor comparability issues in footnotes. These issues have been addressed in detail in Part II of this report.
86. A variety of threats to comparability were identified that could be overcome in the short run. However, numerous challenges remain that are unlikely to be addressed in the short run. A common problem is the definition of the sample from which the indicator is derived. While randomised sampling would yield data that are representative for a country as a whole, many indicators that were submitted in response to the current request are based on non-representative samples. In several cases, in particular with regionally based samples, countries stated that the results were generalisable to the nation as a whole. For example, Germany had traditionally relied on the cancer registry of one state for national policies and considers those results as typical for the country. But other countries reported data from selected providers or care settings that may not reflect the prevailing patterns of care in a given country. To illustrate, Spain originally reported two diabetes indicators (HbA1c test rate and HbA1c control) for a group of primary care centres that participate in voluntary quality improvement projects. Those practitioners are more likely to provide care according to evidence-based standards, raising the question of generalisability of the findings. Another severe problem is the differential ability of countries to track patients after hospital admissions. Some countries assign unique patient identifiers, some do not. And some countries are able to track patients after hospital discharge, others do not. As discussed under the 30-day mortality rates for acute myocardial infarction and stroke, those differences create severe comparability problems, which may
DELSA/HEA/WD/HWP(2006)2
44
be difficult to overcome for logistical and political reasons. This specific problem was again investigated and is discussed in Part II of this report.
87. An important observation is that international collaboration is well able to deal with such problems in the long run. One example is cancer survival rates for which the EU-sponsored Eurocare projects and other international efforts have resulted in common and comparable definitions and data collection protocols. So it can be expected that other comparability issues will be resolved in the future.41
88. In the short run, the Secretariat has adopted the policy of relying on each countries assessment as to whether submitted data are sufficiently generalisable to their respective nation and whether sources and methods are similar enough to the proposed standard definitions to be considered comparable. Each country was given the option of withholding data that it did not consider generalisable or comparable. However, given other countries’ concerns that these non-nationally representative data should not be compared to nationally representative or national full samples, the Secretariat has highlighted these differences in the Sources and Methods tables and, wherever appropriate, in the data tables themselves.
89. This part of the report summarises the detailed scientific review for each measure and presents updated data for each measure. The measures are listed in their original order. The summary of the Secretariats recommendations on indicators to be and not to be retained are presented in Part 1.
41. One comparability issue was raised by the Secretariat during the production of this report. In the case of
some countries, data gathered by the HCQI Project differed significantly from data reported in other data sources, such as the WHO Health for All database. The Secretariat undertook a detailed comparison on this and other indicators of the HCQI data and other data sources. In this case, differences were generally resolved by consulting other country data sources. However, in some cases, country data sources (i.e. national statistics institute web sites, etc.) introduced a third estimate that was different from the HCQI data and from the third party (i.e. WHO) data. The Secretariat is working to resolve these differences in consultation with country and WHO staff and future versions of this paper will report on that work.
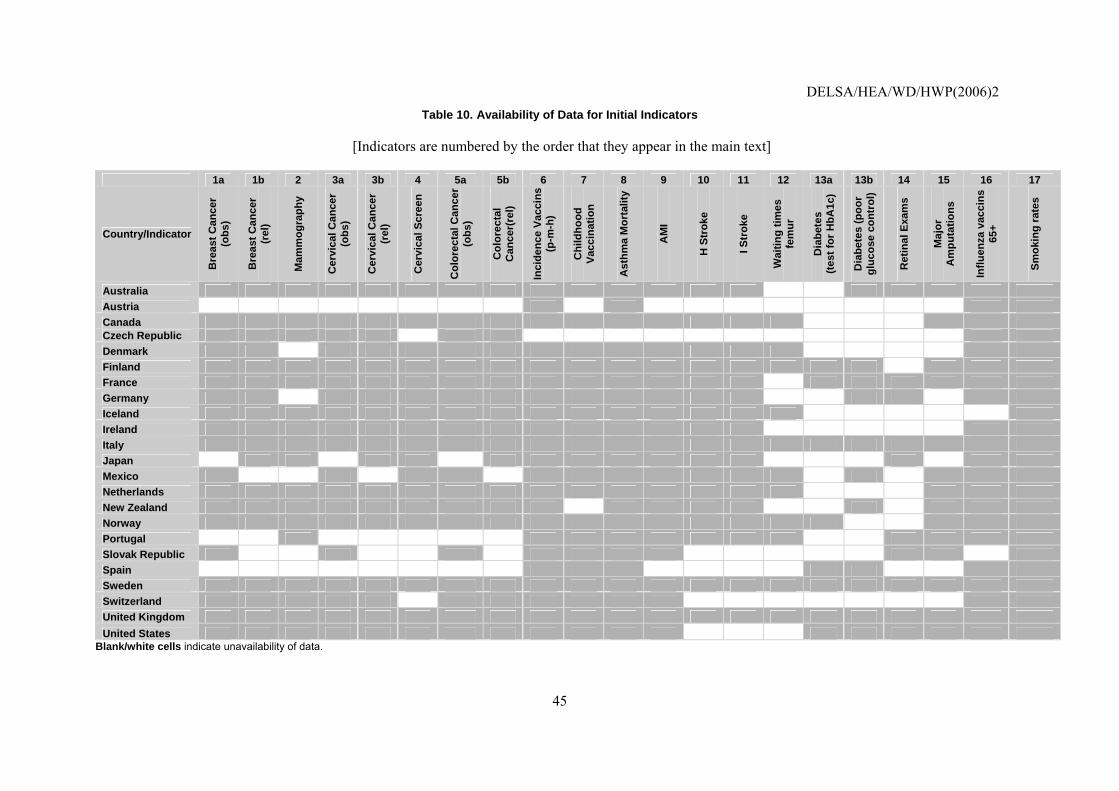
DELSA/HEA/WD/HWP(2006)2
45
Table 10. Availability of Data for Initial Indicators
[Indicators are numbered by the order that they appear in the main text]
1a 1b 2 3a 3b 4 5a 5b 6 7 8 9 10 11 12 13a 13b 14 15 16 17
Country/Indicator
Bre
ast C
ance
r (o
bs)
Bre
ast C
ance
r (r
el)
Mam
mog
raph
y
Cer
vica
l Can
cer
(obs
)
Cer
vica
l Can
cer
(rel
)
Cer
vica
l Scr
een
Col
orec
tal C
ance
r (o
bs)
Col
orec
tal
Can
cer(
rel)
Inci
denc
e Va
ccin
s
(p-m
-h)
Chi
ldho
od
Vacc
inat
ion
Ast
hma
Mor
talit
y
AM
I
H S
trok
e
I Str
oke
Wai
ting
times
fe
mur
Dia
bete
s
(test
for H
bA1c
)
Dia
bete
s (p
oor
gluc
ose
cont
rol)
Ret
inal
Exa
ms
Maj
or
Am
puta
tions
Influ
enza
vac
cins
65
+
Smok
ing
rate
s
Australia Austria Canada Czech Republic Denmark Finland France Germany Iceland Ireland Italy Japan Mexico Netherlands New Zealand Norway Portugal Slovak Republic Spain Sweden Switzerland United Kingdom United States
Blank/white cells indicate unavailability of data.
DELSA/HEA/WD/HWP(2006)2
46
1. Breast Cancer Five-year Survival Rate
Operational Definition
A. 5-year observed survival rate, breast cancer (Diagnostic code: ICD-9 C:174.xx, ICD 10: C50.x) Numerator: Number of women diagnosed with breast cancer surviving five years after diagnosis Denominator: Number of women diagnosed with breast cancer B. 5-year relative survival rate, breast cancer (Diagnostic code: ICD-9 C:174.xx, ICD 10: C50.x)
Numerator: Observed rate of women diagnosed with breast cancer surviving five years after diagnosis
Denominator: Expected survival rate of a comparable group from the general population
Importance
90. Mortality: Breast cancer is the most common form of cancer in women, with a life-time incidence of about 11% and a life-time mortality rate of about 3%.42 In other words, one in nine women acquires breast cancer at some point in her life and one in thirty will die from it. Breast cancer was responsible for an estimated 43 deaths per 100 000 women in WHO Euro A countries in 2000. This represents 2.2% of all deaths (both sexes), or 8.6% of all cancer deaths.
91. Cost: Cancer is the third leading attributable contributor to health care costs in Canada; it was not estimated how many of these costs were specifically due to breast cancer. In the United States, the total expenditures for all cancers were projected at 189.5 billion USD.43 In the United Kingdom, breast cancer was estimated to cost 243 million pounds according to a 1999 study.44
92. Influenced by health system: The health care system can improve the prognosis of breast cancer through early detection and appropriate treatment. The average breast cancer 5-year relative survival rate was over 70% in European countries in 1985-1989. Breast cancer survival has improved over time in European countries.45 Breast cancer survival is much better than survival for the other major sites of cancer in women – lung, ovarian, and colorectal cancers. A study of 1 000 women age 40-60 undergoing annual mammography for ten years showed that 80 developed breast cancer, with 40 cured by treatment (survival > 20 years).46
Scientific Soundness
93. Face validity: Numerous clinical studies have conclusively demonstrated the effectiveness of breast cancer screening and treatment in improving survival. But it is also known that resources for and
42. http://srab.cancer.gov/devcan/report1.pdf accessed 19 August 2003.
43. US Department of Health and Human Services. US National Healthcare Quality Report 2004. Rockville, MD: Agency for Healthcare Research and Quality.
44. Dolan P, Torgerson DJ, Wolstenholme J. Costs of breast cancer treatment in the United Kingdom. Breast. 1999 Aug;8(4):205-7.
45. Health Canada, Economic Burden of Illness in Canada, 1998 (Ottawa: Health Canada, 2002).
46. Fletcher SW and Elmore JG, “Mammographic screening for breast cancer.” New England Journal of Medicine 2003. 348(17): 1672-80.
DELSA/HEA/WD/HWP(2006)2
47
patterns of care vary substantially across OECD countries.47 Thus, measuring and comparing survival rates may provide insight into the performance of different health care systems. Breast cancer survival rates have been used to compare European countries in the EUROCARE study,48 in comparisons between European countries and the United States,49 and in national reporting activities in many countries.
94. Content validity: If some countries diagnose cancer earlier than others in relation to stage of disease, there may be lead time bias both in average survival rates and in 5 year survival rates (if any patients survive over 5 years). However, if early detection improves treatability and prognosis there will be longer average survival and, if more patients survive beyond 5 years, higher 5 year survival because of a genuine quality effect. That is apart from any other differences in effectiveness between countries. Hence, any international comparisons of 5 year survival rates for cancers where prognosis is improved by early detection (such as breast cancer) and where speed of diagnosis may differ, may include an unknown combination of three possible effects: i) lead time bias; ii) improved prognosis due to early detection; and iii) other differences in effectiveness of treatments between countries. Therefore, such comparisons are likely to be interesting for raising questions about effectiveness, on two counts, despite being possibly affected by lead time bias. An alternative measure, used by some countries which can stage cancers, is date of detection in relation to stage of disease. If staging data becomes more widely available across countries, it should allow for the adoption of international comparisons of survival rates which reduce or eliminate lead time bias.
95. Lead-time bias has been found in longitudinal studies of cancer survival rates. Welch et al. concluded that for many cancers apparent increases in survival rates over time were attributable to lead-time bias and not to improved treatment.50 This finding was based on the observation that increasing survival rates for certain cancers were correlated with increased incidence, but not decreased mortality, suggesting that more early cases were being detected by better diagnostic measures without improving prognosis. In the case of breast cancer, however, mortality has decreased along with increased survival and incidence, indicating improved treatment. Research on this point for cancers where early diagnosis improves survival (i.e. breast cancer) has emphasised that lead time bias cannot explain improved outcomes from early diagnosis.51
96. One solution to sorting out differences between countries in survival rates is to display mortality data by country for specific cancers. Another, future, solution is to examine stage at diagnosis for these cancers. However, as noted above, this is less relevant for cancers examined in the HCQI Initial Indicator set where early diagnosis is highly related to improved prognosis. In addition, the examination of stage of diagnosis is not feasible at present for enough OECD countries, but could be incorporated in future presentations of the data. This paper presents survival rates with mortality rates for specific cancers.
97. Reliability: Cancer survival rates are based on data from national cancer registries, which are widely regarded as very reliable. However, certain methods used in constructing those indicators may differ across countries and thus reduce the comparability of the data. These include methods for recording and verifying diagnoses, the number of cases lost to follow-up, and the number of cases that are registered only
47. Organisation for Economic Cooperation and Development. A Disease-Based Comparison of Health Systems: What is
Best at What Cost? (Paris: OECD, 2003).
48. Quinn MJ, Martinez-Garcia C, Berrino F and the EUROCARE Working Group. “Variations in survival from breast cancer in Europe by age and country, 1978-1989. European Journal of Cancer. 1998. 34(14): 2204-2211.
49. Gatta G, Capocaccia R, Coleman MP, Gloeckler Ries LA, Hakulinen T, Micheli A, Sant M, Verdecchia A, Berrino F. "Toward a comparison of survival in American and European cancer patients.” Cancer 2000, 89(4): 893-900.
50. Welch HG, Schwartz LM, Woloshin S. “Are increasing 5-year survival rates evidence of success against cancer?” JAMA2000. 283(22): 2975-78.
51. Jacques PF, Hartz SC, Tuthill RW, Hollingsworth C. Elimination of "lead time" bias in assessing the effect of early breast cancer diagnosis. Am J Epidemiol. 1981 Jan;113(1):93-7.
DELSA/HEA/WD/HWP(2006)2
48
at the time of death.52 The work of the EUROCARE collaborative, funded by the European Commission, has greatly contributed to the standardisation of methods used by cancer registries internationally.
Feasibility
98. Data availability: Breast cancer survival rates are available for 20 countries (Table 11) and mortality rates are available for 22 countries (Table 12). The survival rates data submitted were for a range of years. Most countries included all ages, although some countries excluded persons under 15. The differences in ages should not be a significant concern for breast cancer survival rates. Only some countries performed age standardisation, and not all were standardised to the same reference population. A detailed examination of this question is presented above in “Reference Population for Age Adjustment.” The main comparability challenges concern whether the data are from national registries, or alternate sources. Two countries provided data that were not generalisable to the national level. The mortality rates data are available for a range of years, and the data were rarely age standardised.
99. Comparability issues: Detailed documentation is provided in Table 13 and an assessment in Table 14. For future data collection, many of these issues can be remedied. Future data collection could employ age-standardisation to the same population to increase comparability. Ideally, with regular HCQI data collection, countries will be able to provide rates for more closely related time periods.
100. Overall Assessment: Most countries were able to provide data on this indicator. The fact that fewer countries supplied mortality data is attributed to the questionnaire indicating that the mortality data was optional. Most countries already have national cancer registries or otherwise generalisable data, and most countries routinely assess survival and mortality rates. The main burden associated with data collection for this indicator would be that countries would have to agree on a common reference population and use it consistently for age standardisation of an indicator.
52. Berrino F, Gatta G, Chessa E, Valente F, Capocaccia R, and the EUROCARE Working Group. “Introduction: the
EUROCARE II study.” European Journal of Cancer 1998. 34(14):2139-53.
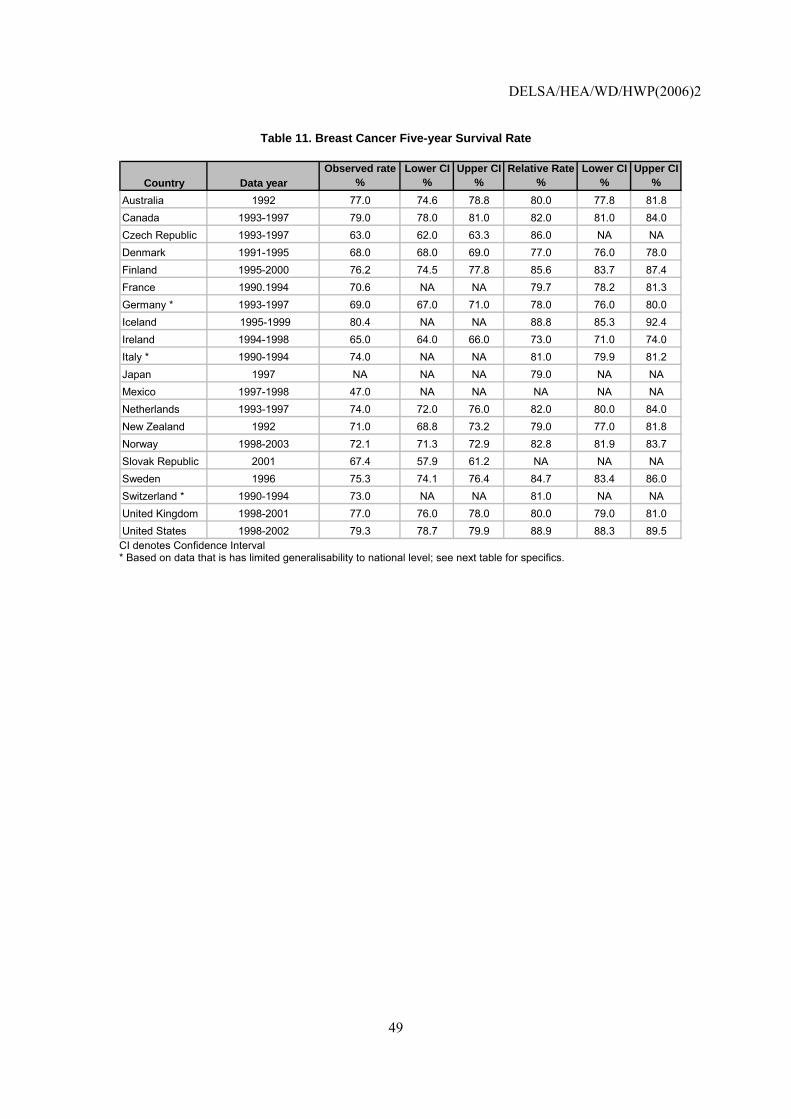
DELSA/HEA/WD/HWP(2006)2
49
Table 11. Breast Cancer Five-year Survival Rate
Country Data yearObserved rate
%Lower CI
%Upper CI
%Relative Rate
%Lower CI
%Upper CI
%Australia 1992 77.0 74.6 78.8 80.0 77.8 81.8Canada 1993-1997 79.0 78.0 81.0 82.0 81.0 84.0Czech Republic 1993-1997 63.0 62.0 63.3 86.0 NA NADenmark 1991-1995 68.0 68.0 69.0 77.0 76.0 78.0Finland 1995-2000 76.2 74.5 77.8 85.6 83.7 87.4France 1990.1994 70.6 NA NA 79.7 78.2 81.3Germany * 1993-1997 69.0 67.0 71.0 78.0 76.0 80.0Iceland 1995-1999 80.4 NA NA 88.8 85.3 92.4Ireland 1994-1998 65.0 64.0 66.0 73.0 71.0 74.0Italy * 1990-1994 74.0 NA NA 81.0 79.9 81.2Japan 1997 NA NA NA 79.0 NA NAMexico 1997-1998 47.0 NA NA NA NA NANetherlands 1993-1997 74.0 72.0 76.0 82.0 80.0 84.0New Zealand 1992 71.0 68.8 73.2 79.0 77.0 81.8Norway 1998-2003 72.1 71.3 72.9 82.8 81.9 83.7Slovak Republic 2001 67.4 57.9 61.2 NA NA NASweden 1996 75.3 74.1 76.4 84.7 83.4 86.0Switzerland * 1990-1994 73.0 NA NA 81.0 NA NAUnited Kingdom 1998-2001 77.0 76.0 78.0 80.0 79.0 81.0United States 1998-2002 79.3 78.7 79.9 88.9 88.3 89.5
CI denotes Confidence Interval * Based on data that is has limited generalisability to national level; see next table for specifics.
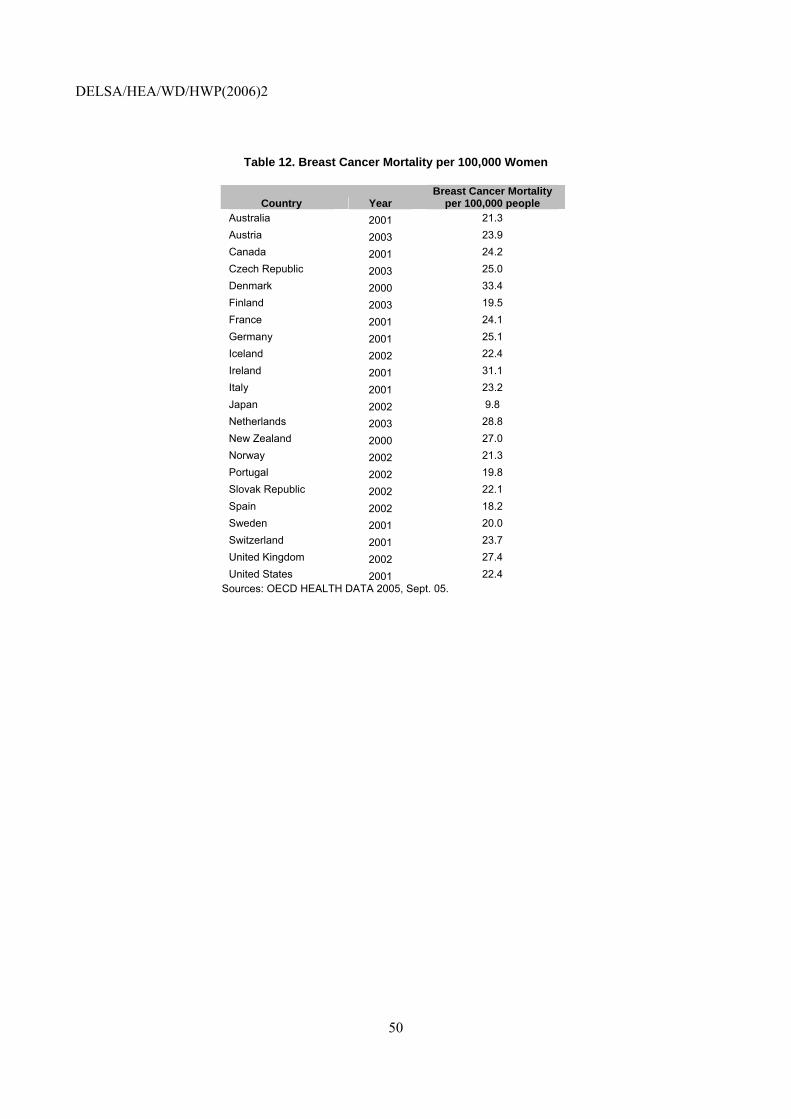
DELSA/HEA/WD/HWP(2006)2
50
Table 12. Breast Cancer Mortality per 100,000 Women
Country Year Breast Cancer Mortality
per 100,000 people Australia 2001 21.3 Austria 2003 23.9 Canada 2001 24.2 Czech Republic 2003 25.0 Denmark 2000 33.4 Finland 2003 19.5 France 2001 24.1 Germany 2001 25.1 Iceland 2002 22.4 Ireland 2001 31.1 Italy 2001 23.2 Japan 2002 9.8 Netherlands 2003 28.8 New Zealand 2000 27.0 Norway 2002 21.3 Portugal 2002 19.8 Slovak Republic 2002 22.1 Spain 2002 18.2 Sweden 2001 20.0 Switzerland 2001 23.7 United Kingdom 2002 27.4 United States 2001 22.4
Sources: OECD HEALTH DATA 2005, Sept. 05.
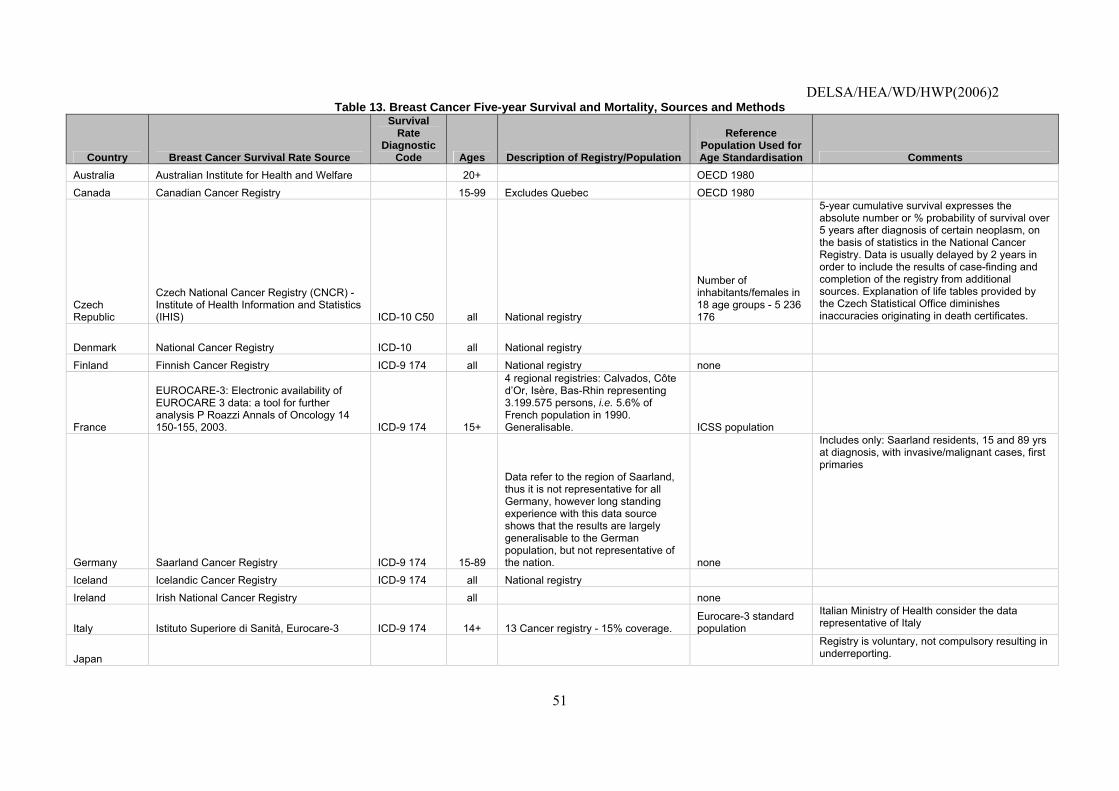
DELSA/HEA/WD/HWP(2006)2
51
Table 13. Breast Cancer Five-year Survival and Mortality, Sources and Methods
Country Breast Cancer Survival Rate Source
Survival Rate
Diagnostic Code Ages Description of Registry/Population
Reference Population Used for Age Standardisation Comments
Australia Australian Institute for Health and Welfare 20+ OECD 1980
Canada Canadian Cancer Registry 15-99 Excludes Quebec OECD 1980
Czech Republic
Czech National Cancer Registry (CNCR) - Institute of Health Information and Statistics (IHIS) ICD-10 C50 all National registry
Number of inhabitants/females in 18 age groups - 5 236 176
5-year cumulative survival expresses the absolute number or % probability of survival over 5 years after diagnosis of certain neoplasm, on the basis of statistics in the National Cancer Registry. Data is usually delayed by 2 years in order to include the results of case-finding and completion of the registry from additional sources. Explanation of life tables provided by the Czech Statistical Office diminishes inaccuracies originating in death certificates.
Denmark National Cancer Registry ICD-10 all National registry
Finland Finnish Cancer Registry ICD-9 174 all National registry none
France
EUROCARE-3: Electronic availability of EUROCARE 3 data: a tool for further analysis P Roazzi Annals of Oncology 14 150-155, 2003. ICD-9 174 15+
4 regional registries: Calvados, Côte d’Or, Isère, Bas-Rhin representing 3.199.575 persons, i.e. 5.6% of French population in 1990. Generalisable. ICSS population
Germany Saarland Cancer Registry ICD-9 174 15-89
Data refer to the region of Saarland, thus it is not representative for all Germany, however long standing experience with this data source shows that the results are largely generalisable to the German population, but not representative of the nation. none
Includes only: Saarland residents, 15 and 89 yrs at diagnosis, with invasive/malignant cases, first primaries
Iceland Icelandic Cancer Registry ICD-9 174 all National registry
Ireland Irish National Cancer Registry all none
Italy Istituto Superiore di Sanità, Eurocare-3 ICD-9 174 14+ 13 Cancer registry - 15% coverage. Eurocare-3 standard population
Italian Ministry of Health consider the data representative of Italy
Japan
Registry is voluntary, not compulsory resulting in underreporting.
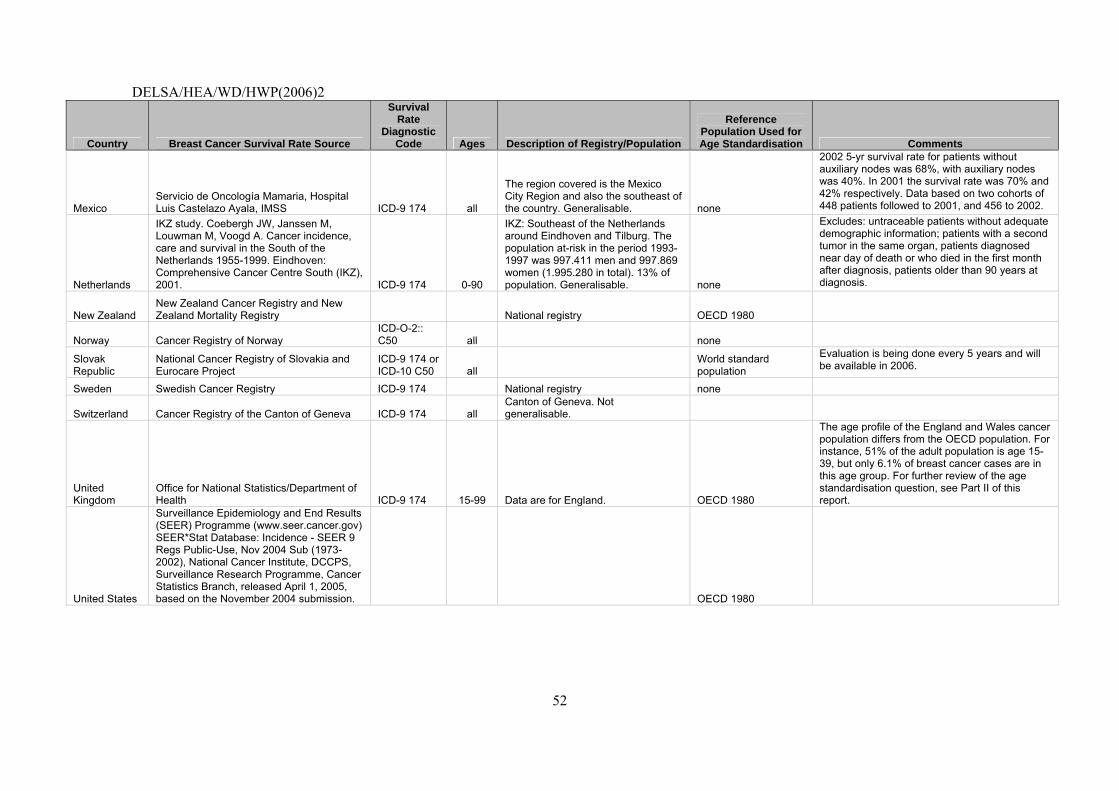
DELSA/HEA/WD/HWP(2006)2
52
Country Breast Cancer Survival Rate Source
Survival Rate
Diagnostic Code Ages Description of Registry/Population
Reference Population Used for Age Standardisation Comments
Mexico Servicio de Oncología Mamaria, Hospital Luis Castelazo Ayala, IMSS ICD-9 174 all
The region covered is the Mexico City Region and also the southeast of the country. Generalisable. none
2002 5-yr survival rate for patients without auxiliary nodes was 68%, with auxiliary nodes was 40%. In 2001 the survival rate was 70% and 42% respectively. Data based on two cohorts of 448 patients followed to 2001, and 456 to 2002.
Netherlands
IKZ study. Coebergh JW, Janssen M, Louwman M, Voogd A. Cancer incidence, care and survival in the South of the Netherlands 1955-1999. Eindhoven: Comprehensive Cancer Centre South (IKZ), 2001. ICD-9 174 0-90
IKZ: Southeast of the Netherlands around Eindhoven and Tilburg. The population at-risk in the period 1993-1997 was 997.411 men and 997.869 women (1.995.280 in total). 13% of population. Generalisable. none
Excludes: untraceable patients without adequate demographic information; patients with a second tumor in the same organ, patients diagnosed near day of death or who died in the first month after diagnosis, patients older than 90 years at diagnosis.
New Zealand New Zealand Cancer Registry and New Zealand Mortality Registry National registry OECD 1980
Norway Cancer Registry of Norway ICD-O-2:: C50 all none
Slovak Republic
National Cancer Registry of Slovakia and Eurocare Project
ICD-9 174 or ICD-10 C50 all
World standard population
Evaluation is being done every 5 years and will be available in 2006.
Sweden Swedish Cancer Registry ICD-9 174 National registry none
Switzerland Cancer Registry of the Canton of Geneva ICD-9 174 all Canton of Geneva. Not generalisable.
United Kingdom
Office for National Statistics/Department of Health ICD-9 174 15-99 Data are for England. OECD 1980
The age profile of the England and Wales cancer population differs from the OECD population. For instance, 51% of the adult population is age 15-39, but only 6.1% of breast cancer cases are in this age group. For further review of the age standardisation question, see Part II of this report.
United States
Surveillance Epidemiology and End Results (SEER) Programme (www.seer.cancer.gov) SEER*Stat Database: Incidence - SEER 9 Regs Public-Use, Nov 2004 Sub (1973-2002), National Cancer Institute, DCCPS, Surveillance Research Programme, Cancer Statistics Branch, released April 1, 2005, based on the November 2004 submission. OECD 1980

DELSA/HEA/WD/HWP(2006)2
53
Table 14. Breast Cancer Survival Rate, Comparability Issues
Comparability Implications Minor Severe
Possible 1. Data available for different time periods 2. Some countries excluded those under 15 years of age 3. Different approaches to age standardisation. However, age standardisation analysis shows minimal impact on overall numbers (see “Reference Population for Age Adjustment”)
Poss
ibili
ty to
cor
rect
the
devi
atio
n?
Unlikely
1. One country could only provide data that was not generalisable to the national level
Possible solutions:
• Agree on common reference population and standardise accordingly • Footnotes can indicate the year, or deviations in ages. • Drop or list separately countries that cannot provide data that are generalisable to the national level

DELSA/HEA/WD/HWP(2006)2
54
2. Mammography Screening Rate
Operational Definition
Numerator: Number of women ages 52-69 reporting having received a bilateral mammography within the past year.
Denominator: Number of women ages 52-69 answering survey questions on mammography or eligible for organised screening programme.
Importance
101. Mortality: Breast cancer is the most common form of cancer in women, with a life-time incidence of about 11% and a life-time mortality rate of about 3%.53 In other words, one in nine women acquires breast cancer at some point in her life and one in thirty will die from it. Breast cancer was responsible for an estimated 43 deaths per 100 000 women in WHO Euro A countries in 2000. This represents 2.2% of all deaths (both sexes), or 8.6% of all cancer deaths.
102. Cost: Cancer is the third leading attributable contributor to health care costs in Canada; it was not estimated how many of these costs were specifically due to breast cancer. In the United Kingdom, breast cancer was estimated to cost 243 million pounds according to a 1999 study.54 The average direct cost of breast cancer screening in France was estimated at 57.77-60.51 Euros per woman attending for screening.55
Scientific Soundness
103. Face validity: Mammography in breast cancer screening is one of the most thoroughly studied techniques worldwide. By detecting cancers early, screening is believed to lead to reduced mortality and less aggressive treatment.
104. Construct validity: A study of 1,000 women age 40-60 undergoing annual mammography for ten years showed that 80 developed breast cancer, with 40 cured by treatment (survival > 20 years).56 In randomised, controlled trials, there is evidence that mammography reduces breast cancer mortality rates among women 40-70 years of age.57 In four Swedish trials that compared two to six rounds of mammography reported 9-32% reduction in the risk for death from breast cancer.58 With respect to the effectiveness of cancer screening tests, the US Preventive Services Task Force has graded mammography for women between 40-49 years of age as having fair evidence. The Canadian Task Force on Preventive Health Care (CTFPHC) graded differently based on age cohort. According to the CTFPHC there is
53. http://srab.cancer.gov/devcan/report1.pdf accessed 19 August 2003.
54. Dolan P, Torgerson DJ, Wolstenholme J. Costs of breast cancer treatment in the United Kingdom. Breast. 1999 Aug;8(4):205-7.
55. Watt S. [The cost of screening for breast and cervical cancer in France] Bull Cancer. 2003 Nov;90(11):997-1004.
56. Fletcher SW and Elmore JG, “Mammographic screening for breast cancer.” New England Journal of Medicine 2003. 348(17): 1672-80.
57. Franco, E.L., Duarte-Franco, E., and Rohan, T.E. (2002), “Evidence-based policy recommendations on cancer screening and prevention” Cancer Detection and Prevention, Vol.26, pp. 350-61.
58. Humphrey, L., Helfand, M., Chan, B., and Woolf, S.H. (2002), “Breast Cancer Screening: A Summary of the Evidence for the US Preventive Services Task Force” Annals of Internal Medicine, Vol.137(5), pp.E347-67.

DELSA/HEA/WD/HWP(2006)2
55
insufficient evidence to recommend for or against the use of mammography for women between 40-49 years, while there is good evidence to support the recommendation for women between 60 to 69 years.
105. Reliability: Screening in many countries is derived from organised screening programmes and is dependent on aspects of the programme’s design such as eligible population, recall period, etc. Other countries use national surveys to determine screening rates. These rates will be affected by national aspects of survey design such as the question used, sampling, and method of administering the survey. Survey questions are also sensitive to cultural differences in survey responses in different countries, potentially leading to recall bias.
Feasibility
106. Data availability: Mammography screening rates are available for 16 countries (Table 15). The mammography screening rates data submitted are for years ranging from 2001 to 2003. Seven of the 11 countries used a slightly different age range. Fourteen of the countries deviated from the 1-year recall period.59 Some of these include countries whose screening programmes are designed, to screen at a different interval than one-year. Eleven countries use screening programmes, and 5 used surveys. One country noted that their screening programme rate is likely to underreport, because women can obtain mammograms elsewhere which would not be included. One country excluded women with double mastectomies from their data.
107. Comparability Issues: Detailed documentation is provided in Table 16 and an assessment in Table 17. A major comparability issues arises because of different data sources that are susceptible to different types of errors and biases: Some countries use patient surveys and others use administrative data. Surveys, for example, may suffer from incorrect recall, whereas administrative data can only capture vaccination delivered under the payment system covered by the data. The deviations in recall years also affect the comparability of this indicator.60
108. Overall assessment: Sixteen countries provided data on this indicator. Countries routinely collect this information, or participate in screening surveys.
59. Future data collections on this indicator may alter the specifications on recall period, given the prevalence
of other time periods in use in HCQI countries.
60. If the recall period reflects the official screening policy of a given country, however, one could argue that the indicator correctly reflects adherence to national standards.
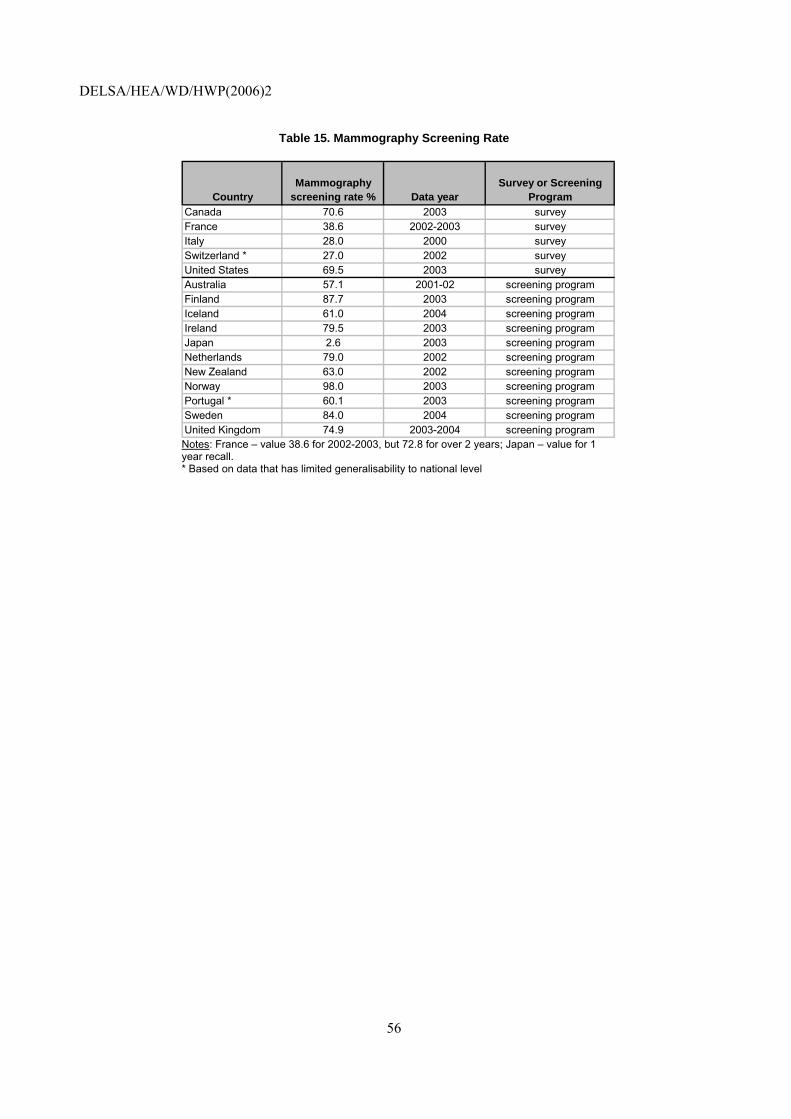
DELSA/HEA/WD/HWP(2006)2
56
Table 15. Mammography Screening Rate
CountryMammography
screening rate % Data yearSurvey or Screening
ProgramCanada 70.6 2003 surveyFrance 38.6 2002-2003 surveyItaly 28.0 2000 surveySwitzerland * 27.0 2002 surveyUnited States 69.5 2003 surveyAustralia 57.1 2001-02 screening programFinland 87.7 2003 screening programIceland 61.0 2004 screening programIreland 79.5 2003 screening programJapan 2.6 2003 screening programNetherlands 79.0 2002 screening programNew Zealand 63.0 2002 screening programNorway 98.0 2003 screening programPortugal * 60.1 2003 screening programSweden 84.0 2004 screening programUnited Kingdom 74.9 2003-2004 screening programNotes: France – value 38.6 for 2002-2003, but 72.8 for over 2 years; Japan – value for 1 year recall. * Based on data that has limited generalisability to national level
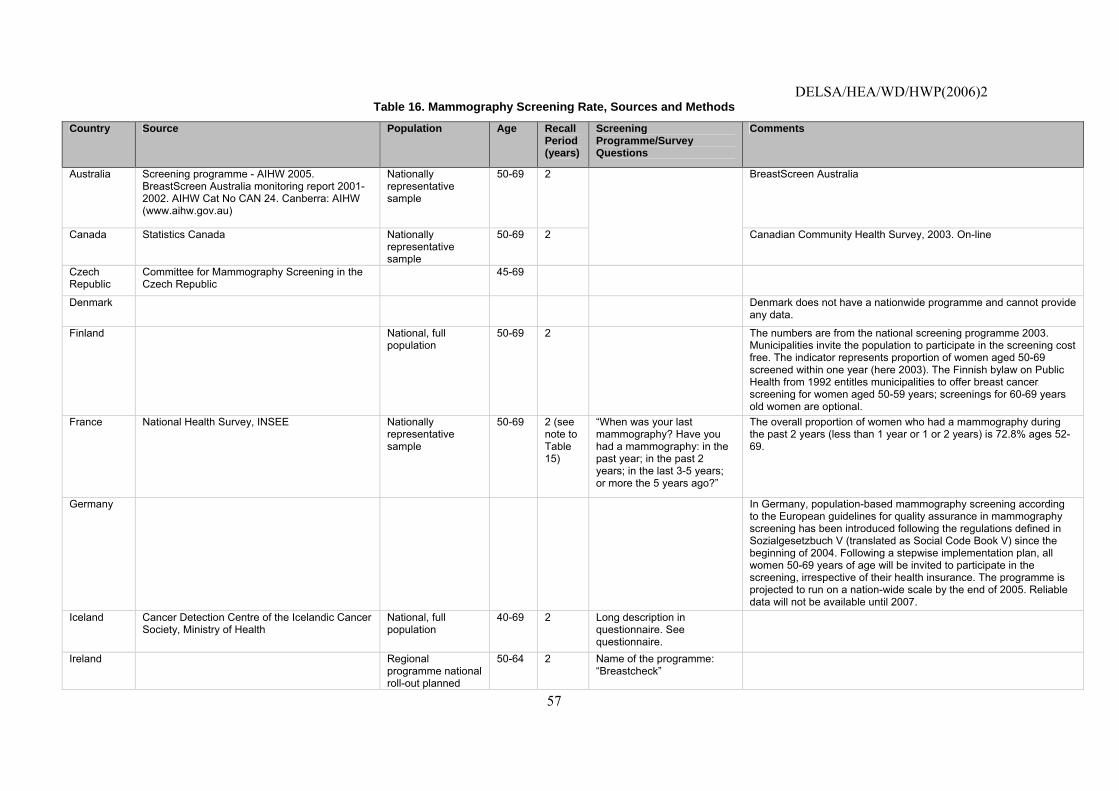
DELSA/HEA/WD/HWP(2006)2
57
Table 16. Mammography Screening Rate, Sources and Methods
Country Source Population Age Recall Period (years)
Screening Programme/Survey Questions
Comments
Australia Screening programme - AIHW 2005. BreastScreen Australia monitoring report 2001-2002. AIHW Cat No CAN 24. Canberra: AIHW (www.aihw.gov.au)
Nationally representative sample
50-69 2 BreastScreen Australia
Canada Statistics Canada Nationally representative sample
50-69 2 Canadian Community Health Survey, 2003. On-line
Czech Republic
Committee for Mammography Screening in the Czech Republic
45-69
Denmark Denmark does not have a nationwide programme and cannot provide any data.
Finland National, full population
50-69 2 The numbers are from the national screening programme 2003. Municipalities invite the population to participate in the screening cost free. The indicator represents proportion of women aged 50-69 screened within one year (here 2003). The Finnish bylaw on Public Health from 1992 entitles municipalities to offer breast cancer screening for women aged 50-59 years; screenings for 60-69 years old women are optional.
France National Health Survey, INSEE Nationally representative sample
50-69 2 (see note to Table 15)
“When was your last mammography? Have you had a mammography: in the past year; in the past 2 years; in the last 3-5 years; or more the 5 years ago?”
The overall proportion of women who had a mammography during the past 2 years (less than 1 year or 1 or 2 years) is 72.8% ages 52-69.
Germany In Germany, population-based mammography screening according to the European guidelines for quality assurance in mammography screening has been introduced following the regulations defined in Sozialgesetzbuch V (translated as Social Code Book V) since the beginning of 2004. Following a stepwise implementation plan, all women 50-69 years of age will be invited to participate in the screening, irrespective of their health insurance. The programme is projected to run on a nation-wide scale by the end of 2005. Reliable data will not be available until 2007.
Iceland Cancer Detection Centre of the Icelandic Cancer Society, Ministry of Health
National, full population
40-69 2 Long description in questionnaire. See questionnaire.
Ireland Regional programme national roll-out planned
50-64 2 Name of the programme: “Breastcheck”

DELSA/HEA/WD/HWP(2006)2
58
Country Source Population Age Recall Period (years)
Screening Programme/Survey Questions
Comments
Italy ISTAT. Indagine Multiscopo Sulle Famiglie. Condizioni di salute e ricorso ai servizi sanitari. Roma 2002
Nationally representative sample
55-69 2 *Did you ever undergo to mammography being asymptomatic? *How old you were when you did undergo to the first mammography in your life? * Did you do other mammographies after that time? *How frequently did you undergo to subsequent mammography controls after the first time?
Data are collected as a result of a Multipurpose National Survey on Health Condition by which a representative sample of Italian women was also interviewed about their preventive practices. It is ought to consider that organised screening programmes are developing in Italy following the European Guidelines (European guidelines for quality assurance in mammography screening, 3rd edition, 2001) and Italian Oncology Commission Indication (Official Gazette of the Italian Republic, Guidelines on prevention, diagnosis and oncology, March 2003). Women aged 50-69 are invited to a screening mammography every two years. Coverage from screening programmes is estimated to be near 47% in 2001 and the mean value of participation in Italian Breast Screening Programmes is 53.6%. Mammographies executed inside screening programmes in 2001 are 567,224 (Source: Osservatorio Nazionale per la Prevenzione dei Tumori Femminili. Secondo Rapporto, Lega Italiana per la Lotta contro i Tumori, 2003).A spontaneous screening activity is present and needs to be evaluated.
Japan National, full population
50-69 2 May underestimate total national mammography rates because the estimate does not include other mass screening programmes such as work-site health maintenance programmes or health checkups paid by recipients
Netherlands LETB, Landelijk Evaluatie Team voor bevolkingsonderzoek naar Borstkanker (National Evaluation Team for Breast Cancer Screening NETB) Landelijke evaluatie van bevolingsonderzoek naar bortskanker in Nederland. 2002 (X)Het tiende evaluatierapport en 2004 Tussenrapportage. (National evaluation of breast cancer screening in the Netherlands. 2002 (X) Tenth evaluation and report and 2004 Interim report. Rotterdam: LETB. Erasmus ML 2002, 2004.
National, full population
50-75 2 Name of the programme: Netherlands Bevolkingsonderzoek naar Borstkanker (Breast Cancer screening programme in the Netherlands. Every two years women of age 50-75 are invited to have a screening. In 2002 the target population was 1090000. The screening is organised and carried out by nine regional screening organisations. All invitations, screen examinations and screen results are recorded at the individual level in the regional information systems. The screening organisations are connected to the computerised municipal population registry that provide address details of the eligible women and information on whether these women have died or moved out of the region.
New Zealand
BreastScreen Aotearoa Nationally representative sample
50-64 3
Norway Norwegian Breast Cancer Screening Programme
National full population
50-69 2 Population based, Nationwide since Feb. 2004, 2 views, 2 years screening interval. Quality assurance manual based on EU guidelines.
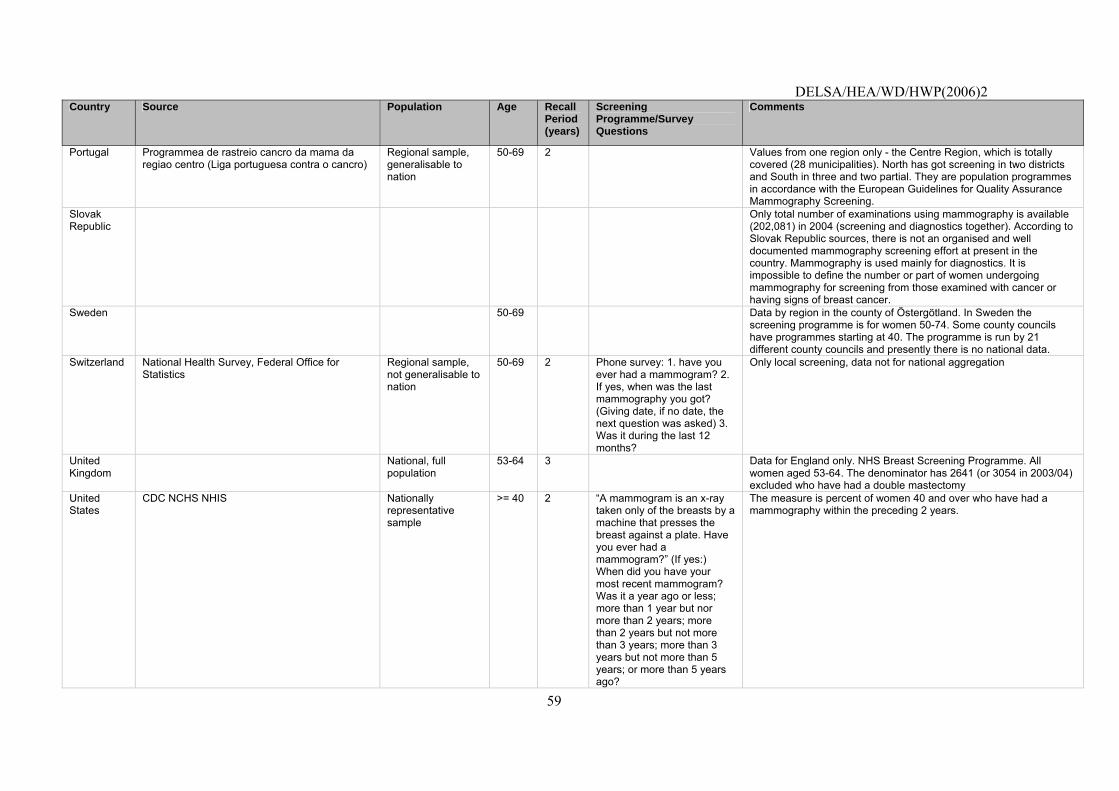
DELSA/HEA/WD/HWP(2006)2
59
Country Source Population Age Recall Period (years)
Screening Programme/Survey Questions
Comments
Portugal Programmea de rastreio cancro da mama da regiao centro (Liga portuguesa contra o cancro)
Regional sample, generalisable to nation
50-69 2 Values from one region only - the Centre Region, which is totally covered (28 municipalities). North has got screening in two districts and South in three and two partial. They are population programmes in accordance with the European Guidelines for Quality Assurance Mammography Screening.
Slovak Republic
Only total number of examinations using mammography is available (202,081) in 2004 (screening and diagnostics together). According to Slovak Republic sources, there is not an organised and well documented mammography screening effort at present in the country. Mammography is used mainly for diagnostics. It is impossible to define the number or part of women undergoing mammography for screening from those examined with cancer or having signs of breast cancer.
Sweden 50-69 Data by region in the county of Östergötland. In Sweden the screening programme is for women 50-74. Some county councils have programmes starting at 40. The programme is run by 21 different county councils and presently there is no national data.
Switzerland National Health Survey, Federal Office for Statistics
Regional sample, not generalisable to nation
50-69 2 Phone survey: 1. have you ever had a mammogram? 2. If yes, when was the last mammography you got? (Giving date, if no date, the next question was asked) 3. Was it during the last 12 months?
Only local screening, data not for national aggregation
United Kingdom
National, full population
53-64 3 Data for England only. NHS Breast Screening Programme. All women aged 53-64. The denominator has 2641 (or 3054 in 2003/04) excluded who have had a double mastectomy
United States
CDC NCHS NHIS Nationally representative sample
>= 40 2 “A mammogram is an x-ray taken only of the breasts by a machine that presses the breast against a plate. Have you ever had a mammogram?” (If yes:) When did you have your most recent mammogram? Was it a year ago or less; more than 1 year but nor more than 2 years; more than 2 years but not more than 3 years; more than 3 years but not more than 5 years; or more than 5 years ago?
The measure is percent of women 40 and over who have had a mammography within the preceding 2 years.
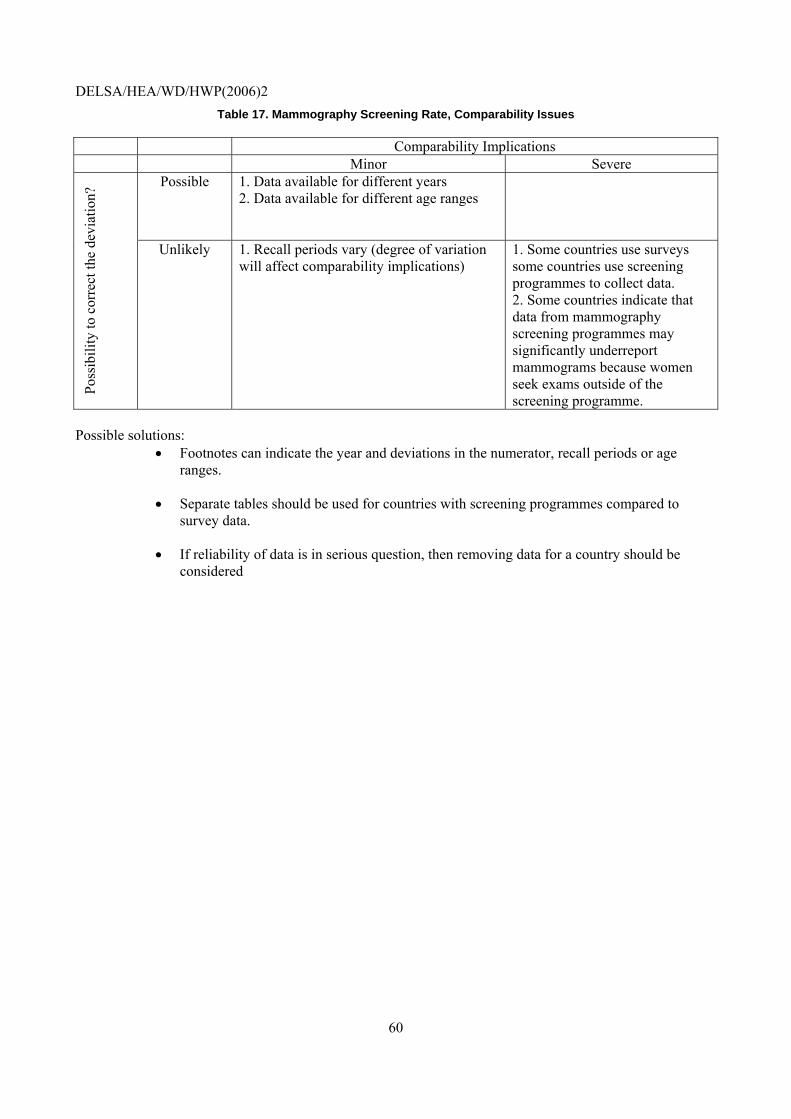
DELSA/HEA/WD/HWP(2006)2
60
Table 17. Mammography Screening Rate, Comparability Issues
Comparability Implications Minor Severe
Possible 1. Data available for different years 2. Data available for different age ranges
Poss
ibili
ty to
cor
rect
the
devi
atio
n?
Unlikely 1. Recall periods vary (degree of variation will affect comparability implications)
1. Some countries use surveys some countries use screening programmes to collect data. 2. Some countries indicate that data from mammography screening programmes may significantly underreport mammograms because women seek exams outside of the screening programme.
Possible solutions:
• Footnotes can indicate the year and deviations in the numerator, recall periods or age ranges.
• Separate tables should be used for countries with screening programmes compared to survey data.
• If reliability of data is in serious question, then removing data for a country should be considered
DELSA/HEA/WD/HWP(2006)2
61
3. Cervical Cancer Five-year Survival Rate
Operational Definition
A. 5-year observed survival rate, cervical cancer (Diagnostic code: ICD-9 C:180.xx; ICD-10: C53.x) Numerator: Number of women diagnosed with cervical cancer surviving five years after diagnosis Denominator: Number of women diagnosed with cervical cancer B. 5-year relative survival rate, cervical cancer (Diagnostic code: ICD-9 C:180.xx; ICD-10: C53.x) Numerator: Observed rate of women diagnosed with cervical cancer surviving five years after diagnosis Denominator: Expected survival rate of a comparable group from the general population
Importance
109. Mortality: Cervical cancer was responsible for an estimated 3.8 deaths per 100 000 women in WHO Euro A countries in 2000. This represents 0.2% of all deaths (both sexes), or 0.8% of all cancer deaths.
110. Cost: Cancer is the third leading attributable contributor to health care costs in Canada. In the United States, the total expenditures for all cancers were projected at 189.5 billion USD.
111. Influenced by health system: Average cervical cancer 5-year relative survival was over 60% in European countries in 1985-1989. Survival has increased over time, particularly in older age groups. Much of the advances can be attributed to the widespread use of cervical cancer screening. Screening by pelvic exam and pap smears can even identify pre-malignant lesions, which can be effectively treated. Regular screening also increases the probability of diagnosing early states of manifest malignant disease, which improves prognosis greatly and may allow curative treatment without full removal of the uterus.61
Scientific Soundness
112. Face validity: Screening and treatment of cervical cancer should lead to improved survival rates. Cervical cancer survival rates have been used to compare European countries in the EUROCARE study,62 in comparisons between European countries and the United States,63 and in national reporting activities in many countries.
113. Content validity: A potential threat to the validity of cancer survival rates is lead-time bias. For a comprehensive discussion of this potential threat, please see the discussion of the five-year survival rate of breast cancer patients. As in the case of breast cancer, mortality from cervical cancer as decreased along with increased survival and incidence, indicating improved treatment.
114. Reliability: For a comprehensive discussion of the reliability of cancer registry data, please see the discussion of the five-year survival rate of breast cancer patients.
61. Gatta, G., M.B. Lasota, A. Verdecchia and the EUROCARE Working Group. “Survival of European women with
gynaecological tumours, during the period 1978-1989.” European Journal of Cancer 34(14): 2218-2225.
62. Gatta G, Lasota MB, Verdecchia A, and the EUROCARE Working Group. European Journal of Cancer 1998. 34(14): 2218-2225.
63. Gatta G, Capocaccia R, Coleman MP, Gloeckler Ries LA, Hakulinen T, Micheli A, Sant M, Verdecchia A, Berrino F. "Toward a comparison of survival in American and European cancer patients.” Cancer 2000, 89(4): 893-900.
DELSA/HEA/WD/HWP(2006)2
62
Feasibility
115. Data Availability: Cervical cancer survival rates are available for 20 countries (Table 18) and mortality rates are available for 22 countries (Table 19). The survival rates data submitted were for a range of years. Most countries included all ages, although some countries excluded persons under 15. The differences in ages should not be a significant concern for cervical cancer survival rates. A few countries used the ICD 10 or ICD 0 coding system, but there is a one-to-one cross-walk between the ICD-0, ICD-9 and ICD-10 diagnostic codes so that comparability issues do not arise. However, one country included malignancies of the corpus uteri in the ICD-10 codes. Only some countries performed age standardisation, and not all were standardised to the same reference population. The main comparability challenges concerns whether the data is from national registries, or alternate sources. Three countries provided data that was not generalisable to the national level. The mortality rates data are available for a range of years, and the data were rarely age standardised.
116. Comparability Issues: Detailed documentation is provided in Table 20 and an assessment in Table 21. For future data collection, many of these issues can be remedied. Future data collection will age-standardised to the same population for more precise comparability. Ideally, with regular HCQI data collection, countries will be able to provide rates for more closely rated time periods.
117. Overall Assessment: Most countries were able to provide data on this indicator. The fact that fewer countries supplied mortality data is attributed to the questionnaire indicating that the mortality data was optional. Most countries already have national cancer registries or otherwise generalisable data, and most countries routinely assess survival and mortality rates. The main burden associated with data collection for this indicator would be that most countries would have to agree on a common reference population and use this consistently for age standardisation of an indicator.
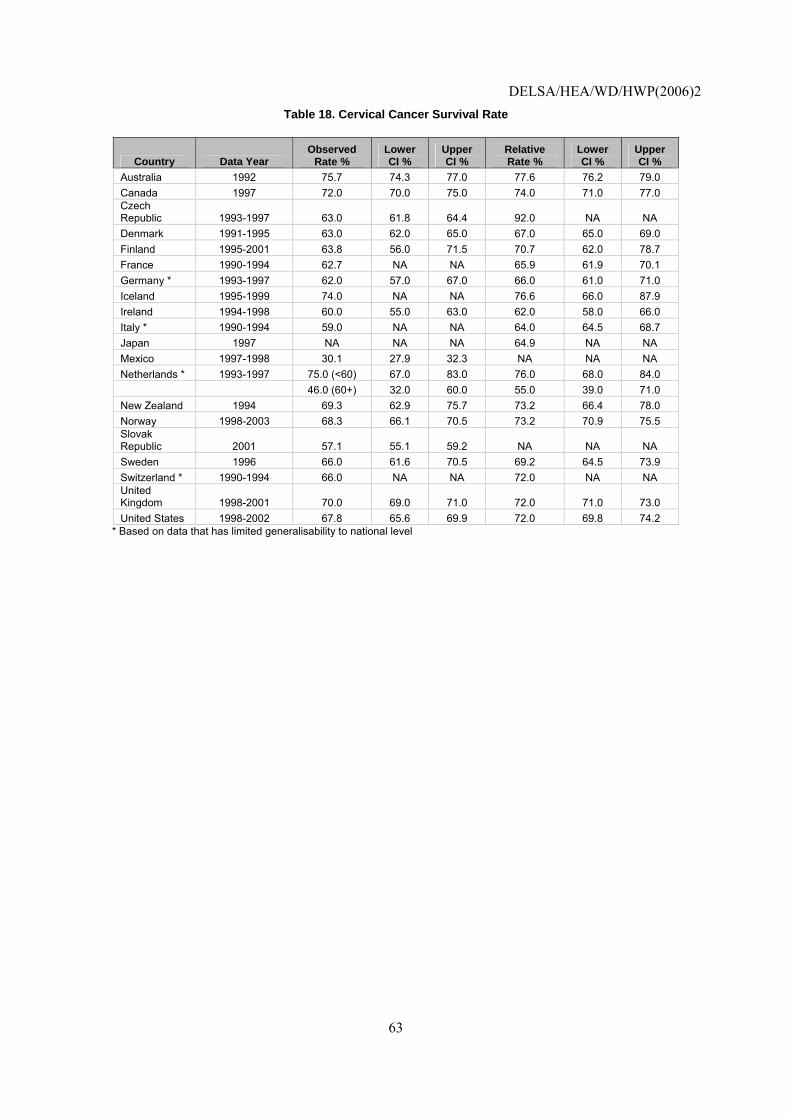
DELSA/HEA/WD/HWP(2006)2
63
Table 18. Cervical Cancer Survival Rate
Country Data Year Observed
Rate % Lower CI %
Upper CI %
Relative Rate %
Lower CI %
Upper CI %
Australia 1992 75.7 74.3 77.0 77.6 76.2 79.0 Canada 1997 72.0 70.0 75.0 74.0 71.0 77.0 Czech Republic 1993-1997 63.0 61.8 64.4 92.0 NA NA Denmark 1991-1995 63.0 62.0 65.0 67.0 65.0 69.0 Finland 1995-2001 63.8 56.0 71.5 70.7 62.0 78.7 France 1990-1994 62.7 NA NA 65.9 61.9 70.1 Germany * 1993-1997 62.0 57.0 67.0 66.0 61.0 71.0 Iceland 1995-1999 74.0 NA NA 76.6 66.0 87.9 Ireland 1994-1998 60.0 55.0 63.0 62.0 58.0 66.0 Italy * 1990-1994 59.0 NA NA 64.0 64.5 68.7 Japan 1997 NA NA NA 64.9 NA NA Mexico 1997-1998 30.1 27.9 32.3 NA NA NA Netherlands * 1993-1997 75.0 (<60) 67.0 83.0 76.0 68.0 84.0 46.0 (60+) 32.0 60.0 55.0 39.0 71.0 New Zealand 1994 69.3 62.9 75.7 73.2 66.4 78.0 Norway 1998-2003 68.3 66.1 70.5 73.2 70.9 75.5 Slovak Republic 2001 57.1 55.1 59.2 NA NA NA Sweden 1996 66.0 61.6 70.5 69.2 64.5 73.9 Switzerland * 1990-1994 66.0 NA NA 72.0 NA NA United Kingdom 1998-2001 70.0 69.0 71.0 72.0 71.0 73.0 United States 1998-2002 67.8 65.6 69.9 72.0 69.8 74.2
* Based on data that has limited generalisability to national level
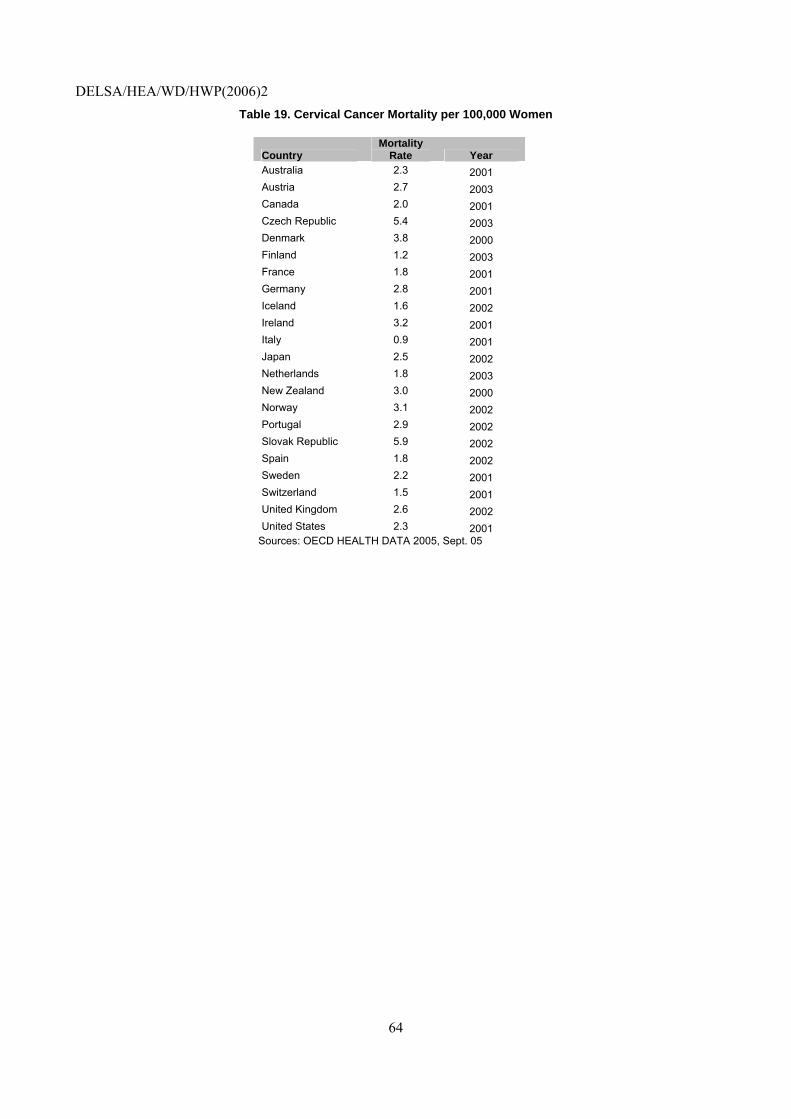
DELSA/HEA/WD/HWP(2006)2
64
Table 19. Cervical Cancer Mortality per 100,000 Women
Country Mortality
Rate Year Australia 2.3 2001 Austria 2.7 2003 Canada 2.0 2001 Czech Republic 5.4 2003 Denmark 3.8 2000 Finland 1.2 2003 France 1.8 2001 Germany 2.8 2001 Iceland 1.6 2002 Ireland 3.2 2001 Italy 0.9 2001 Japan 2.5 2002 Netherlands 1.8 2003 New Zealand 3.0 2000 Norway 3.1 2002 Portugal 2.9 2002 Slovak Republic 5.9 2002 Spain 1.8 2002 Sweden 2.2 2001 Switzerland 1.5 2001 United Kingdom 2.6 2002 United States 2.3 2001
Sources: OECD HEALTH DATA 2005, Sept. 05
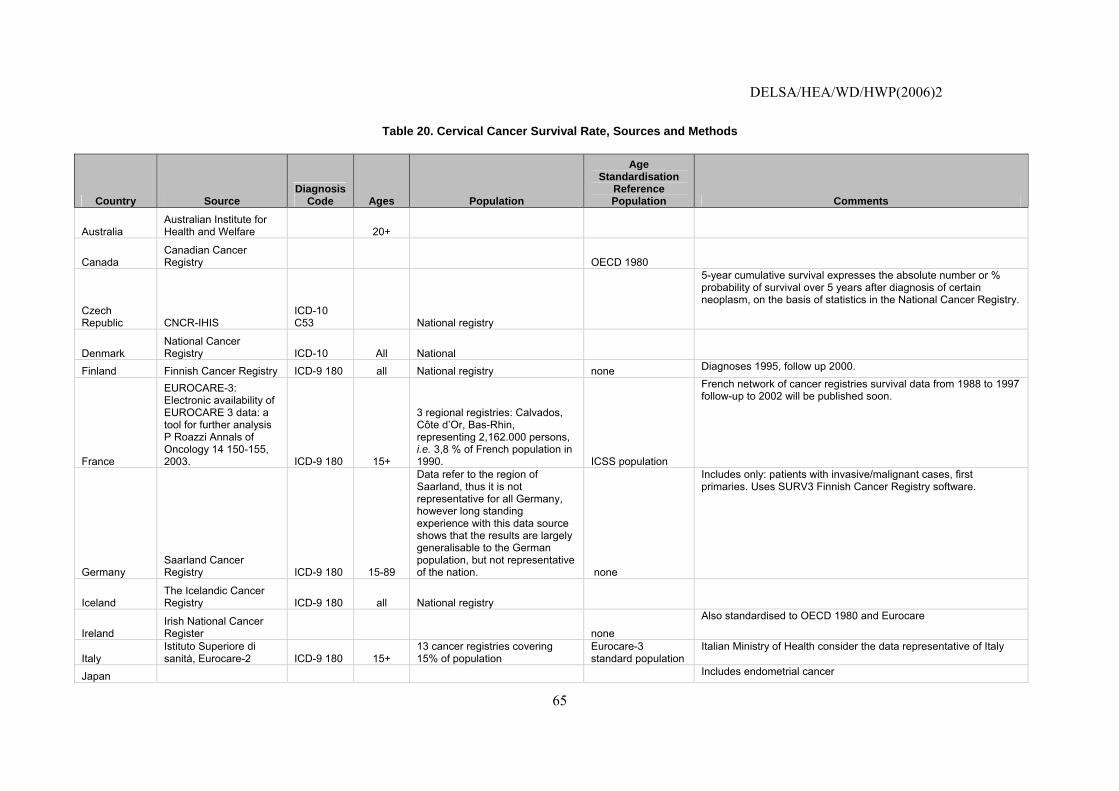
DELSA/HEA/WD/HWP(2006)2
65
Table 20. Cervical Cancer Survival Rate, Sources and Methods
Country Source Diagnosis
Code Ages Population
Age Standardisation
Reference Population Comments
Australia Australian Institute for Health and Welfare 20+
Canada Canadian Cancer Registry OECD 1980
Czech Republic CNCR-IHIS
ICD-10 C53 National registry
5-year cumulative survival expresses the absolute number or % probability of survival over 5 years after diagnosis of certain neoplasm, on the basis of statistics in the National Cancer Registry.
Denmark National Cancer Registry ICD-10 All National
Finland Finnish Cancer Registry ICD-9 180 all National registry none Diagnoses 1995, follow up 2000.
France
EUROCARE-3: Electronic availability of EUROCARE 3 data: a tool for further analysis P Roazzi Annals of Oncology 14 150-155, 2003. ICD-9 180 15+
3 regional registries: Calvados, Côte d’Or, Bas-Rhin, representing 2,162.000 persons, i.e. 3,8 % of French population in 1990. ICSS population
French network of cancer registries survival data from 1988 to 1997 follow-up to 2002 will be published soon.
Germany Saarland Cancer Registry ICD-9 180 15-89
Data refer to the region of Saarland, thus it is not representative for all Germany, however long standing experience with this data source shows that the results are largely generalisable to the German population, but not representative of the nation. none
Includes only: patients with invasive/malignant cases, first primaries. Uses SURV3 Finnish Cancer Registry software.
Iceland The Icelandic Cancer Registry ICD-9 180 all National registry
Ireland Irish National Cancer Register none
Also standardised to OECD 1980 and Eurocare
Italy Istituto Superiore di sanità, Eurocare-2 ICD-9 180 15+
13 cancer registries covering 15% of population
Eurocare-3 standard population
Italian Ministry of Health consider the data representative of Italy
Japan Includes endometrial cancer
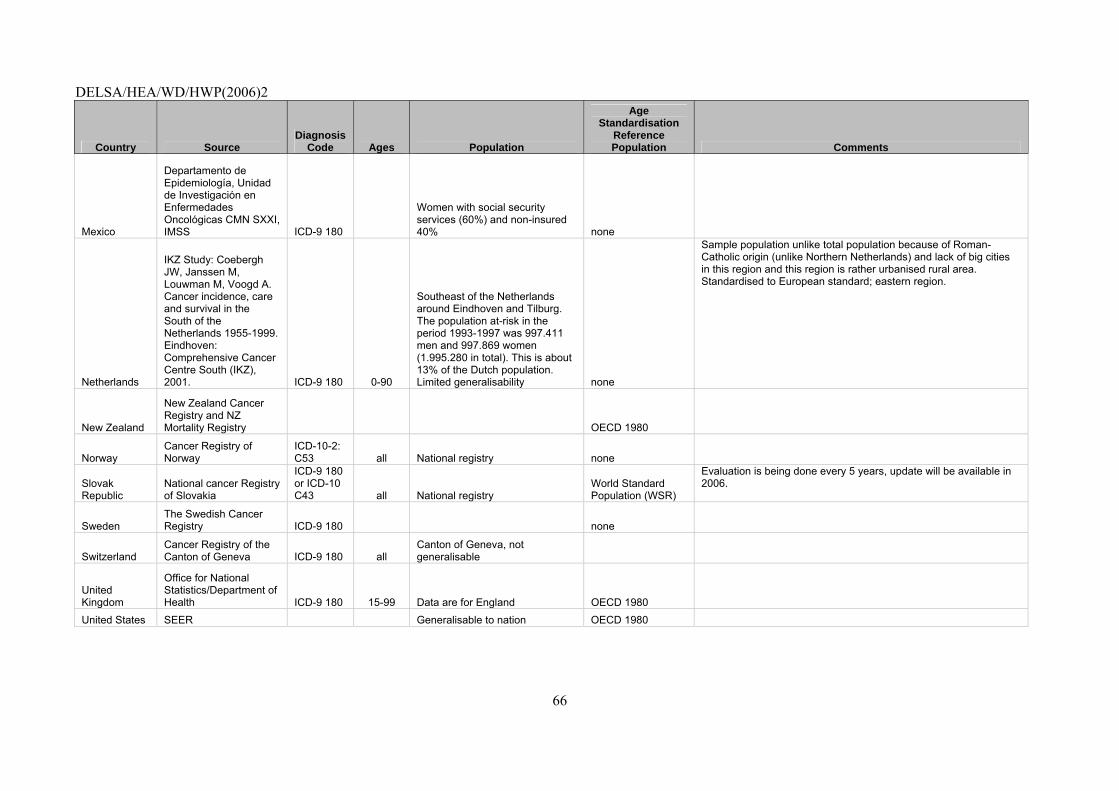
DELSA/HEA/WD/HWP(2006)2
66
Country Source Diagnosis
Code Ages Population
Age Standardisation
Reference Population Comments
Mexico
Departamento de Epidemiología, Unidad de Investigación en Enfermedades Oncológicas CMN SXXI, IMSS ICD-9 180
Women with social security services (60%) and non-insured 40% none
Netherlands
IKZ Study: Coebergh JW, Janssen M, Louwman M, Voogd A. Cancer incidence, care and survival in the South of the Netherlands 1955-1999. Eindhoven: Comprehensive Cancer Centre South (IKZ), 2001. ICD-9 180 0-90
Southeast of the Netherlands around Eindhoven and Tilburg. The population at-risk in the period 1993-1997 was 997.411 men and 997.869 women (1.995.280 in total). This is about 13% of the Dutch population. Limited generalisability none
Sample population unlike total population because of Roman-Catholic origin (unlike Northern Netherlands) and lack of big cities in this region and this region is rather urbanised rural area. Standardised to European standard; eastern region.
New Zealand
New Zealand Cancer Registry and NZ Mortality Registry OECD 1980
Norway Cancer Registry of Norway
ICD-10-2: C53 all National registry none
Slovak Republic
National cancer Registry of Slovakia
ICD-9 180 or ICD-10 C43 all National registry
World Standard Population (WSR)
Evaluation is being done every 5 years, update will be available in 2006.
Sweden The Swedish Cancer Registry ICD-9 180 none
Switzerland Cancer Registry of the Canton of Geneva ICD-9 180 all
Canton of Geneva, not generalisable
United Kingdom
Office for National Statistics/Department of Health ICD-9 180 15-99 Data are for England OECD 1980
United States SEER Generalisable to nation OECD 1980
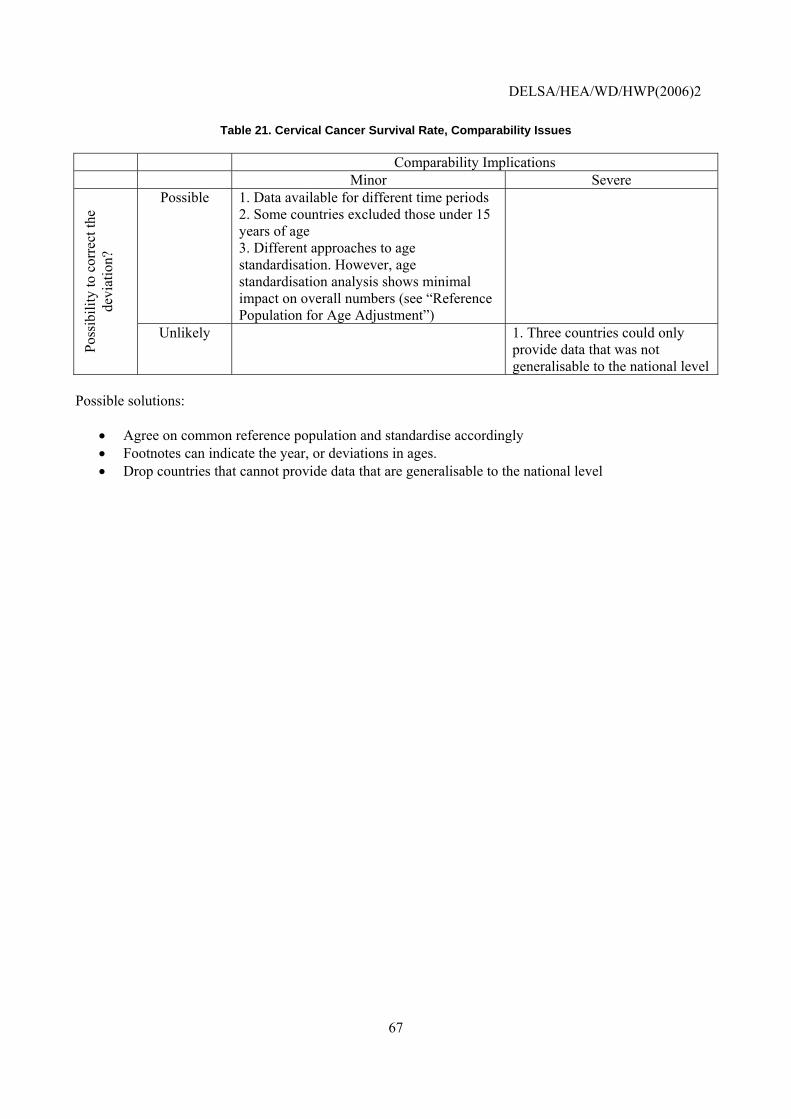
DELSA/HEA/WD/HWP(2006)2
67
Table 21. Cervical Cancer Survival Rate, Comparability Issues
Comparability Implications Minor Severe
Possible 1. Data available for different time periods 2. Some countries excluded those under 15 years of age 3. Different approaches to age standardisation. However, age standardisation analysis shows minimal impact on overall numbers (see “Reference Population for Age Adjustment”)
Poss
ibili
ty to
cor
rect
the
devi
atio
n?
Unlikely
1. Three countries could only provide data that was not generalisable to the national level
Possible solutions:
• Agree on common reference population and standardise accordingly • Footnotes can indicate the year, or deviations in ages. • Drop countries that cannot provide data that are generalisable to the national level
DELSA/HEA/WD/HWP(2006)2
68
4. Cervical Cancer Screening Rate
Operational Definition
Numerator: Number of women age 20-69 reporting cervical cancer screening within the past 3 years or number of women age 20-69 screened for cervical cancer through an organised programme.
Denominator: Number of women age 20-69 answering survey question or participating in organised screening programme.
Importance
118. For a discussion of the importance of cervical cancer, please refer to the discussion under the cervical cancer survival rate above.
119. Cost: Cancer is the third leading attributable contributor to health care costs in Canada. In the United States, the total expenditures for all cancers were projected at 189.5 billion USD. Cervical cancer screening is generally regarded as one of the lower cost screening programmes across types of cancer. One study in Italy estimated the cost at approximately $24 per woman screened, although a study of the cost effectiveness of cervical cancer screening in the European Union found great variation across countries in the number of times women are recommended to be screened in their lifetime (between as few as 7 times and as many as 50+)64,65
Scientific Soundness
120. Face validity: Cervical cancer screening is often considered the most successful cancer screening test.66 Screening can reduce mortality due to cervical cancer through earlier detection of tumours or even pre-malignant stages of the disease. Many countries have national targets for cervical cancer screening or organised screening programmes.
121. Content validity: Evidence linking cervical cancer screening with decreased mortality has come from observational epidemiological studies, pre-post studies showing that mortality decreased after the introduction of organised screening, geographical comparisons showing that mortality reduction is greater in areas with higher screening coverage, and numerous consensus statements from expert groups.67 This evidence has been judged sufficient to recommend cervical cancer screening after formal reviews by the US Preventive Services Task Force, the Canadian Task Force on Preventive Health Care, and the US National Cancer Institute Physician’s Data Query.
122. Reliability: The cervical screening rate in many countries will be derived from organised screening programmes and is therefore dependent on aspects of the programme’s design such as eligible population, recall period, etc. Other countries will use national surveys to determine screening rates. These rates will be affected by national aspects of survey design such as the question used, sampling, and method of
64. Zappa M, Cecchini S, Ciatto S, Iossa A, Falini P, Mancini M, Paci E. Measurement of the cost of screening for cervical
cancer in the district of Florence, Italy. Tumori. 1998 Nov-Dec;84(6):631-5.
65. van Ballegooijen M, van den Akker-van Marle E, Patnick J, Lynge E, Arbyn M, Anttila A, Ronco G, Dik J, Habbema F. Overview of important cervical cancer screening process values in European Union (EU) countries, and tentative predictions of the corresponding effectiveness and cost-effectiveness. Eur J Cancer. 2000 Nov;36(17):2177-88.
66. Franco EL, Duarte-Franco E, TE Rohan. "Evidence-based policy recommendations on cancer screening and prevention." Cancer Detection and Prevention. 2002. 26: 350-61.
67. Franco EL, Duarte-Franco E, TE Rohan. "Evidence-based policy recommendations on cancer screening and prevention." Cancer Detection and Prevention. 2002. 26: 350-61.
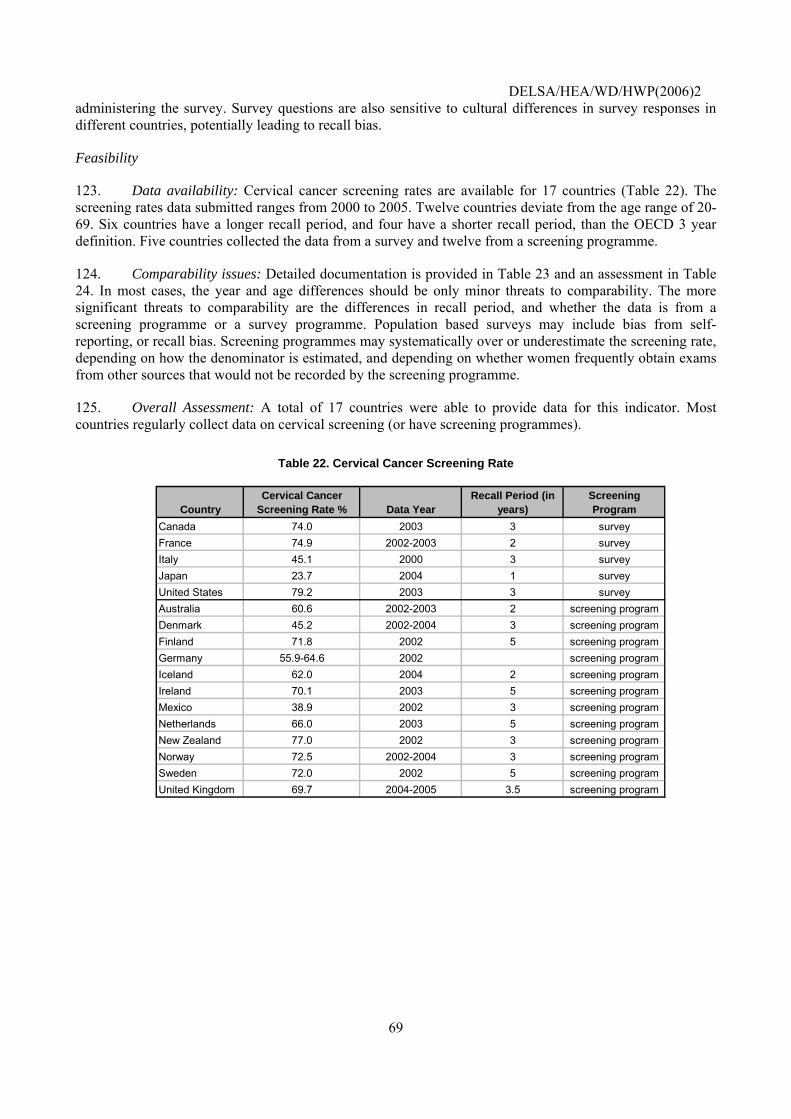
DELSA/HEA/WD/HWP(2006)2
69
administering the survey. Survey questions are also sensitive to cultural differences in survey responses in different countries, potentially leading to recall bias.
Feasibility
123. Data availability: Cervical cancer screening rates are available for 17 countries (Table 22). The screening rates data submitted ranges from 2000 to 2005. Twelve countries deviate from the age range of 20-69. Six countries have a longer recall period, and four have a shorter recall period, than the OECD 3 year definition. Five countries collected the data from a survey and twelve from a screening programme.
124. Comparability issues: Detailed documentation is provided in Table 23 and an assessment in Table 24. In most cases, the year and age differences should be only minor threats to comparability. The more significant threats to comparability are the differences in recall period, and whether the data is from a screening programme or a survey programme. Population based surveys may include bias from self-reporting, or recall bias. Screening programmes may systematically over or underestimate the screening rate, depending on how the denominator is estimated, and depending on whether women frequently obtain exams from other sources that would not be recorded by the screening programme.
125. Overall Assessment: A total of 17 countries were able to provide data for this indicator. Most countries regularly collect data on cervical screening (or have screening programmes).
Table 22. Cervical Cancer Screening Rate
CountryCervical Cancer
Screening Rate % Data YearRecall Period (in
years)
yScreening Program
Canada 74.0 2003 3 surveyFrance 74.9 2002-2003 2 surveyItaly 45.1 2000 3 surveyJapan 23.7 2004 1 surveyUnited States 79.2 2003 3 surveyAustralia 60.6 2002-2003 2 screening programDenmark 45.2 2002-2004 3 screening programFinland 71.8 2002 5 screening programGermany 55.9-64.6 2002 screening programIceland 62.0 2004 2 screening programIreland 70.1 2003 5 screening programMexico 38.9 2002 3 screening programNetherlands 66.0 2003 5 screening programNew Zealand 77.0 2002 3 screening programNorway 72.5 2002-2004 3 screening programSweden 72.0 2002 5 screening programUnited Kingdom 69.7 2004-2005 3.5 screening program
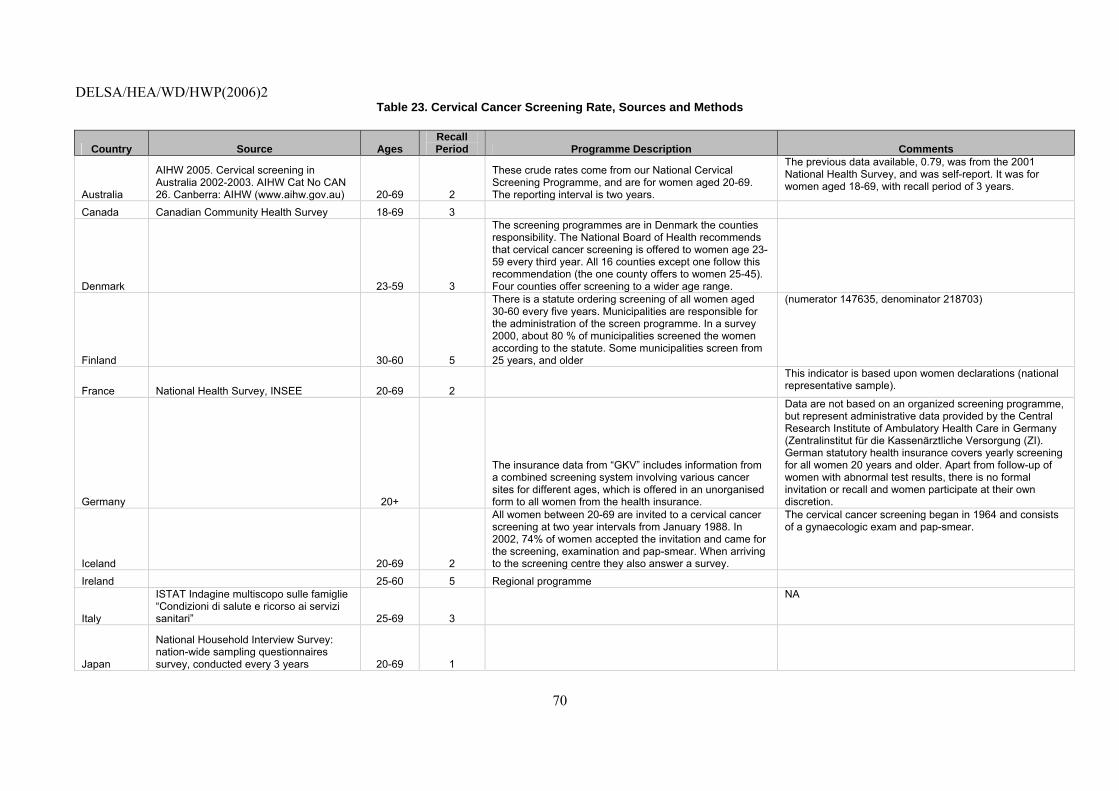
DELSA/HEA/WD/HWP(2006)2
70
Table 23. Cervical Cancer Screening Rate, Sources and Methods
Country Source Ages Recall Period Programme Description Comments
Australia
AIHW 2005. Cervical screening in Australia 2002-2003. AIHW Cat No CAN 26. Canberra: AIHW (www.aihw.gov.au) 20-69 2
These crude rates come from our National Cervical Screening Programme, and are for women aged 20-69. The reporting interval is two years.
The previous data available, 0.79, was from the 2001 National Health Survey, and was self-report. It was for women aged 18-69, with recall period of 3 years.
Canada Canadian Community Health Survey 18-69 3
Denmark 23-59 3
The screening programmes are in Denmark the counties responsibility. The National Board of Health recommends that cervical cancer screening is offered to women age 23-59 every third year. All 16 counties except one follow this recommendation (the one county offers to women 25-45). Four counties offer screening to a wider age range.
Finland 30-60 5
There is a statute ordering screening of all women aged 30-60 every five years. Municipalities are responsible for the administration of the screen programme. In a survey 2000, about 80 % of municipalities screened the women according to the statute. Some municipalities screen from 25 years, and older
(numerator 147635, denominator 218703)
France National Health Survey, INSEE 20-69 2
This indicator is based upon women declarations (national representative sample).
Germany 20+
The insurance data from “GKV” includes information from a combined screening system involving various cancer sites for different ages, which is offered in an unorganised form to all women from the health insurance.
Data are not based on an organized screening programme, but represent administrative data provided by the Central Research Institute of Ambulatory Health Care in Germany (Zentralinstitut für die Kassenärztliche Versorgung (ZI). German statutory health insurance covers yearly screening for all women 20 years and older. Apart from follow-up of women with abnormal test results, there is no formal invitation or recall and women participate at their own discretion.
Iceland 20-69 2
All women between 20-69 are invited to a cervical cancer screening at two year intervals from January 1988. In 2002, 74% of women accepted the invitation and came for the screening, examination and pap-smear. When arriving to the screening centre they also answer a survey.
The cervical cancer screening began in 1964 and consists of a gynaecologic exam and pap-smear.
Ireland 25-60 5 Regional programme
Italy
ISTAT Indagine multiscopo sulle famiglie “Condizioni di salute e ricorso ai servizi sanitari” 25-69 3
NA
Japan
National Household Interview Survey: nation-wide sampling questionnaires survey, conducted every 3 years 20-69 1
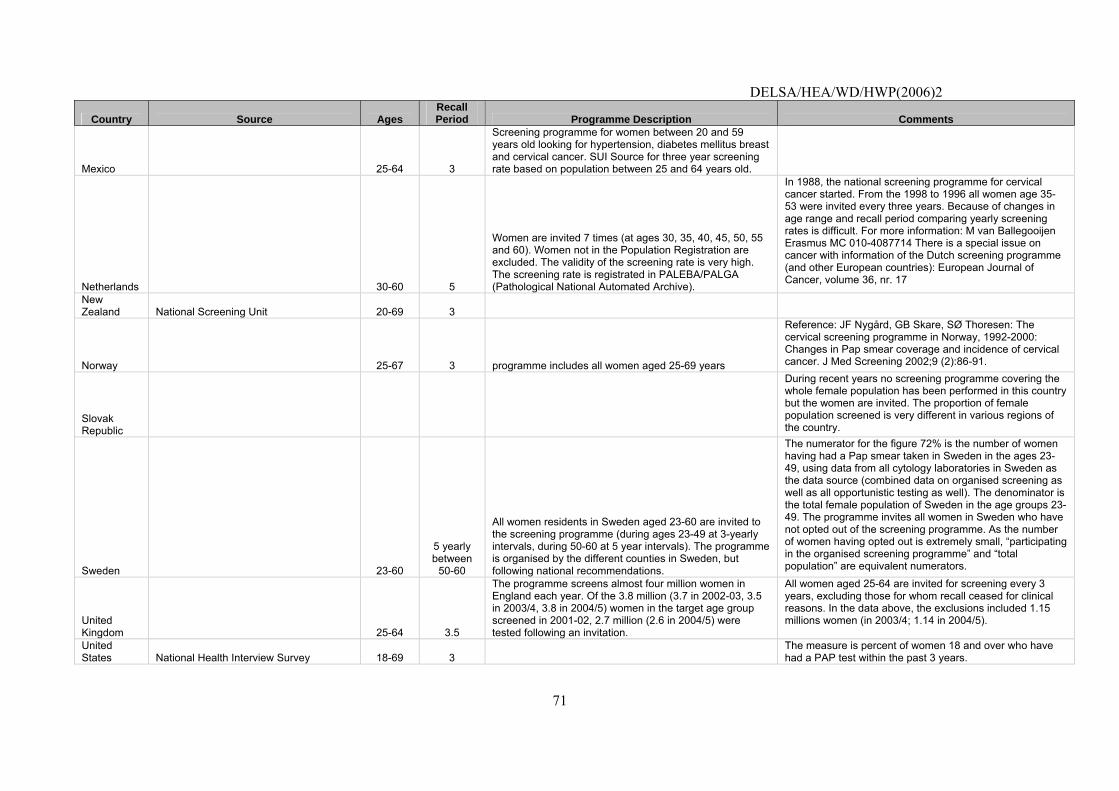
DELSA/HEA/WD/HWP(2006)2
71
Country Source Ages Recall Period Programme Description Comments
Mexico 25-64 3
Screening programme for women between 20 and 59 years old looking for hypertension, diabetes mellitus breast and cervical cancer. SUI Source for three year screening rate based on population between 25 and 64 years old.
Netherlands 30-60 5
Women are invited 7 times (at ages 30, 35, 40, 45, 50, 55 and 60). Women not in the Population Registration are excluded. The validity of the screening rate is very high. The screening rate is registrated in PALEBA/PALGA (Pathological National Automated Archive).
In 1988, the national screening programme for cervical cancer started. From the 1998 to 1996 all women age 35-53 were invited every three years. Because of changes in age range and recall period comparing yearly screening rates is difficult. For more information: M van Ballegooijen Erasmus MC 010-4087714 There is a special issue on cancer with information of the Dutch screening programme (and other European countries): European Journal of Cancer, volume 36, nr. 17
New Zealand National Screening Unit 20-69 3
Norway 25-67 3 programme includes all women aged 25-69 years
Reference: JF Nygård, GB Skare, SØ Thoresen: The cervical screening programme in Norway, 1992-2000: Changes in Pap smear coverage and incidence of cervical cancer. J Med Screening 2002;9 (2):86-91.
Slovak Republic
During recent years no screening programme covering the whole female population has been performed in this country but the women are invited. The proportion of female population screened is very different in various regions of the country.
Sweden 23-60
5 yearly between
50-60
All women residents in Sweden aged 23-60 are invited to the screening programme (during ages 23-49 at 3-yearly intervals, during 50-60 at 5 year intervals). The programme is organised by the different counties in Sweden, but following national recommendations.
The numerator for the figure 72% is the number of women having had a Pap smear taken in Sweden in the ages 23-49, using data from all cytology laboratories in Sweden as the data source (combined data on organised screening as well as all opportunistic testing as well). The denominator is the total female population of Sweden in the age groups 23-49. The programme invites all women in Sweden who have not opted out of the screening programme. As the number of women having opted out is extremely small, “participating in the organised screening programme” and “total population” are equivalent numerators.
United Kingdom 25-64 3.5
The programme screens almost four million women in England each year. Of the 3.8 million (3.7 in 2002-03, 3.5 in 2003/4, 3.8 in 2004/5) women in the target age group screened in 2001-02, 2.7 million (2.6 in 2004/5) were tested following an invitation.
All women aged 25-64 are invited for screening every 3 years, excluding those for whom recall ceased for clinical reasons. In the data above, the exclusions included 1.15 millions women (in 2003/4; 1.14 in 2004/5).
United States National Health Interview Survey 18-69 3
The measure is percent of women 18 and over who have had a PAP test within the past 3 years.
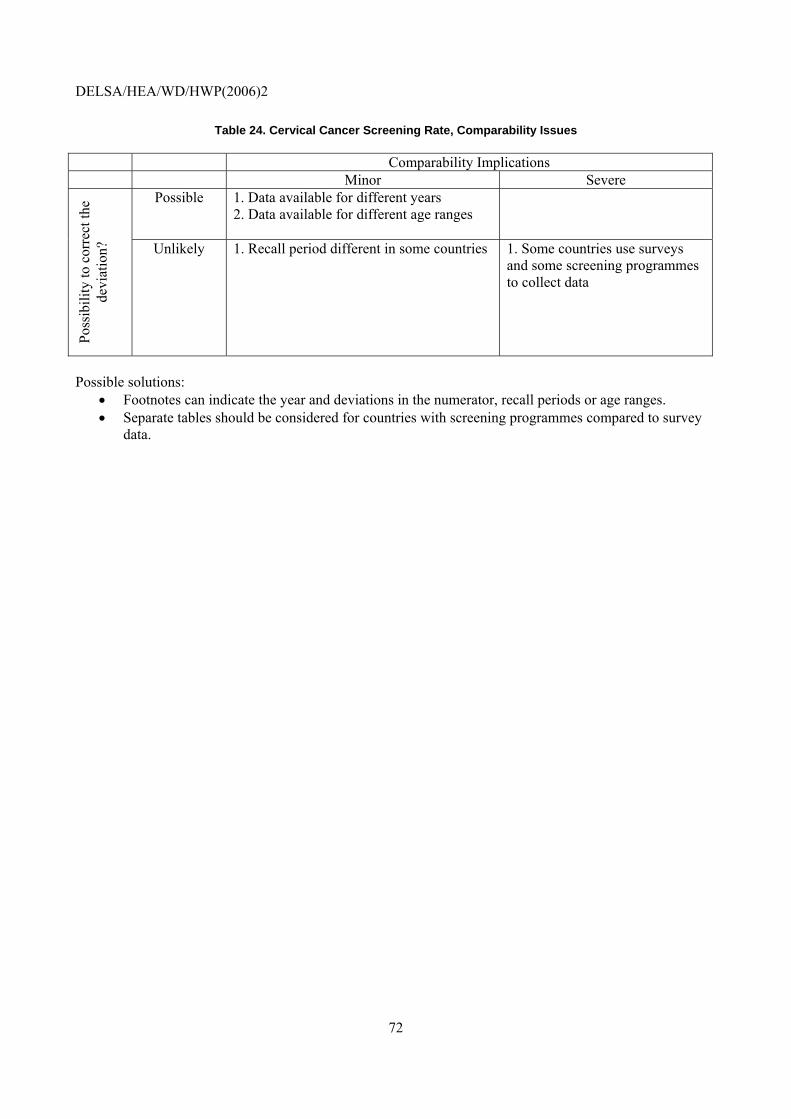
DELSA/HEA/WD/HWP(2006)2
72
Table 24. Cervical Cancer Screening Rate, Comparability Issues
Comparability Implications Minor Severe
Possible 1. Data available for different years 2. Data available for different age ranges
Poss
ibili
ty to
cor
rect
the
devi
atio
n?
Unlikely 1. Recall period different in some countries
1. Some countries use surveys and some screening programmes to collect data
Possible solutions:
• Footnotes can indicate the year and deviations in the numerator, recall periods or age ranges. • Separate tables should be considered for countries with screening programmes compared to survey
data.
DELSA/HEA/WD/HWP(2006)2
73
5. Colorectal Cancer Five-year Survival Rate
Operational Definition
A. 5-year observed survival rate, colorectal cancer (Diagnostic code: ICD-9 C:153.xx, 154.xx; ICD-10: C18.xx, C19.xx, C20.xx) Numerator: Number of people diagnosed with colorectal cancer surviving five years after diagnosis Denominator: Number of people diagnosed with colorectal cancer B. 5-year relative survival rate, colorectal cancer (Diagnostic code: ICD-9 C:153.xx, 154.xx; ICD-10: C18.xx, C19.xx, C20.xx) Numerator: Observed rate of people diagnosed with colorectal cancer surviving five years after diagnosis Denominator: Expected survival rate of a comparable group from the general population
Importance
126. Mortality: Colorectal cancer was responsible for an estimated 34 deaths per 100 000 people in WHO Euro A countries in 2000. This represents 3.5% of all deaths, or 13.4% of all cancer deaths.
127. Cost: Cancer is the third leading attributable contributor to health care costs in Canada.
128. Influenced by health system: Colorectal cancer five-year relative survival was on average over 40% in European countries in 1978-1989. Over this time period, survival improved by 20%. Better medical care is said to have contributed to this increase in survival rates in three ways. First, better techniques for surgery and anaesthesia reduced operative mortality and allowed to conduct surgery in higher risk patients. Second, screening and increased awareness have lead to improvements in the stage at diagnosis. And, third, the use of radio-chemotherapy has improved treatment and prognosis of more advanced stages of the disease, by slowing down growth of cancer cells in the lymphatic tissue and metastases.68
Scientific Soundness
129. Face validity: Screening and treatment of colorectal cancer should lead to improved survival rates. Colorectal cancer survival rates have been used to compare European countries in the EUROCARE study,69 in comparisons between European countries and the United States,70 and in national reporting activities in many countries.
130. Content validity: Several treatments have been linked with improved survival from colorectal cancer, including surgical resection71 and screening by sigmoidoscopy.72
68. Gatta G., J. Faivre, R. Capocaccia, M. Ponz de Leon and the EUROCARE Working Group. 1989. “Survival of colorectal
cancer patients in Europe during the period 1978-1989.” European Journal of Cancer 34(14): 2176-2183.
69. Quinn MJ, Martinez-Garcia C, Berrino F and the EUROCARE Working Group. “Variations in survival from breast cancer in Europe by age and country, 1978-1989. European Journal of Cancer. 1998. 34(14): 2204-2211.
70. Gatta G, Capocaccia R, Coleman MP, Gloeckler Ries LA, Hakulinen T, Micheli A, Sant M, Verdecchia A, Berrino F. "Toward a comparison of survival in American and European cancer patients.” Cancer 2000, 89(4): 893-900.
71. Gatta G, Faivre J, Capocaccia R, Ponz de Leon M, and the EUROCARE Working Group. European Journal of Cancer 1998. 34(14):2176-2183.
72. Franco EL, Duarte-Franco E, TE Rohan. "Evidence-based policy recommendations on cancer screening and prevention." Cancer Detection and Prevention. 2002. 26: 350-61.
DELSA/HEA/WD/HWP(2006)2
74
131. Content validity: A potential threat to the validity of cancer survival rates is lead-time bias. For a comprehensive discussion of this potential threat, please see the discussion of the five-year survival rate of breast cancer patients. As in the case of breast cancer, mortality from colon cancer has decreased along with increased survival and incidence, indicating improved treatment.
132. Reliability: For a comprehensive discussion of the reliability of cancer registry data, please see the discussion of the five-year survival rate of breast cancer patients.
Feasibility
133. Data availability: Colorectal cancer survival rates are available for 20 countries (Table 25) and mortality rates (for cancer of the colon only) are available for 22 countries (Table 26). The survival rates data submitted were for a range of years. Most countries included all ages, although some countries excluded persons under 15. The differences in ages should not be a significant concern for colorectal cancer survival rates. One country used ICD 10 codes, but they correspond to the ICD 9 code in the OECD definition.73 Only some countries performed age standardisation, and not all were standardised to the same reference population. The main comparability concerns are whether the data is from national registries, or alternate sources. Three countries provided data that was not generalisable to the national level. The mortality rates data are available for a rage of years, and the data were rarely age standardised.
134. Comparability issues: Detailed documentation is provided in Table 27. For future data collection, many of these issues can be remedied. Future data collection will age-standardised to the same population for more precise comparability. Ideally, with regular HCQI data collection, countries will be able to provide rates for more closely rated time periods.
135. Overall Assessment: Most countries were able to provide data on this indicator. The fact that fewer countries supplied mortality data is attributed to the questionnaire indicating that the mortality data was optional. Most countries already have national cancer registries or otherwise generalisable data, and most countries routinely assess survival and mortality rates. The main burden associated with data collection for this indicator would be that most countries would have to agree on a common reference population and use this consistently for age standardisation of an indicator.
73. It should be kept in mind, however, that the ICD-9 definition of colorectal cancer (153.xx and 154.xx) also
includes anal cancer, which is biologically and prognostically different. The ICD-10 coding system would allow for a cleaner separation of anal cancer (C21) and should be used for this indicator once it becomes more widely adopted.
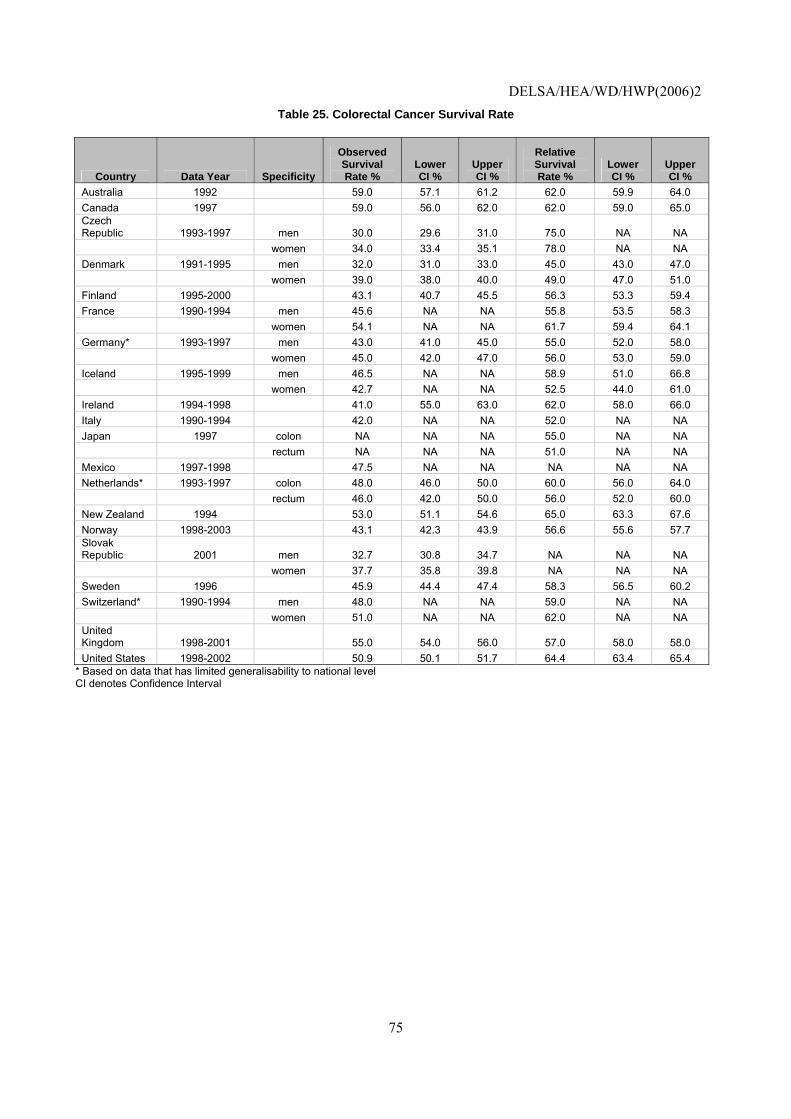
DELSA/HEA/WD/HWP(2006)2
75
Table 25. Colorectal Cancer Survival Rate
Country Data Year Specificity
Observed Survival Rate %
Lower CI %
Upper CI %
Relative Survival Rate %
Lower CI %
Upper CI %
Australia 1992 59.0 57.1 61.2 62.0 59.9 64.0 Canada 1997 59.0 56.0 62.0 62.0 59.0 65.0 Czech Republic 1993-1997 men 30.0 29.6 31.0 75.0 NA NA women 34.0 33.4 35.1 78.0 NA NA Denmark 1991-1995 men 32.0 31.0 33.0 45.0 43.0 47.0 women 39.0 38.0 40.0 49.0 47.0 51.0 Finland 1995-2000 43.1 40.7 45.5 56.3 53.3 59.4 France 1990-1994 men 45.6 NA NA 55.8 53.5 58.3 women 54.1 NA NA 61.7 59.4 64.1 Germany* 1993-1997 men 43.0 41.0 45.0 55.0 52.0 58.0 women 45.0 42.0 47.0 56.0 53.0 59.0 Iceland 1995-1999 men 46.5 NA NA 58.9 51.0 66.8 women 42.7 NA NA 52.5 44.0 61.0 Ireland 1994-1998 41.0 55.0 63.0 62.0 58.0 66.0 Italy 1990-1994 42.0 NA NA 52.0 NA NA Japan 1997 colon NA NA NA 55.0 NA NA rectum NA NA NA 51.0 NA NA Mexico 1997-1998 47.5 NA NA NA NA NA Netherlands* 1993-1997 colon 48.0 46.0 50.0 60.0 56.0 64.0 rectum 46.0 42.0 50.0 56.0 52.0 60.0 New Zealand 1994 53.0 51.1 54.6 65.0 63.3 67.6 Norway 1998-2003 43.1 42.3 43.9 56.6 55.6 57.7 Slovak Republic 2001 men 32.7 30.8 34.7 NA NA NA women 37.7 35.8 39.8 NA NA NA Sweden 1996 45.9 44.4 47.4 58.3 56.5 60.2 Switzerland* 1990-1994 men 48.0 NA NA 59.0 NA NA women 51.0 NA NA 62.0 NA NA United Kingdom 1998-2001 55.0 54.0 56.0 57.0 58.0 58.0 United States 1998-2002 50.9 50.1 51.7 64.4 63.4 65.4
* Based on data that has limited generalisability to national level CI denotes Confidence Interval
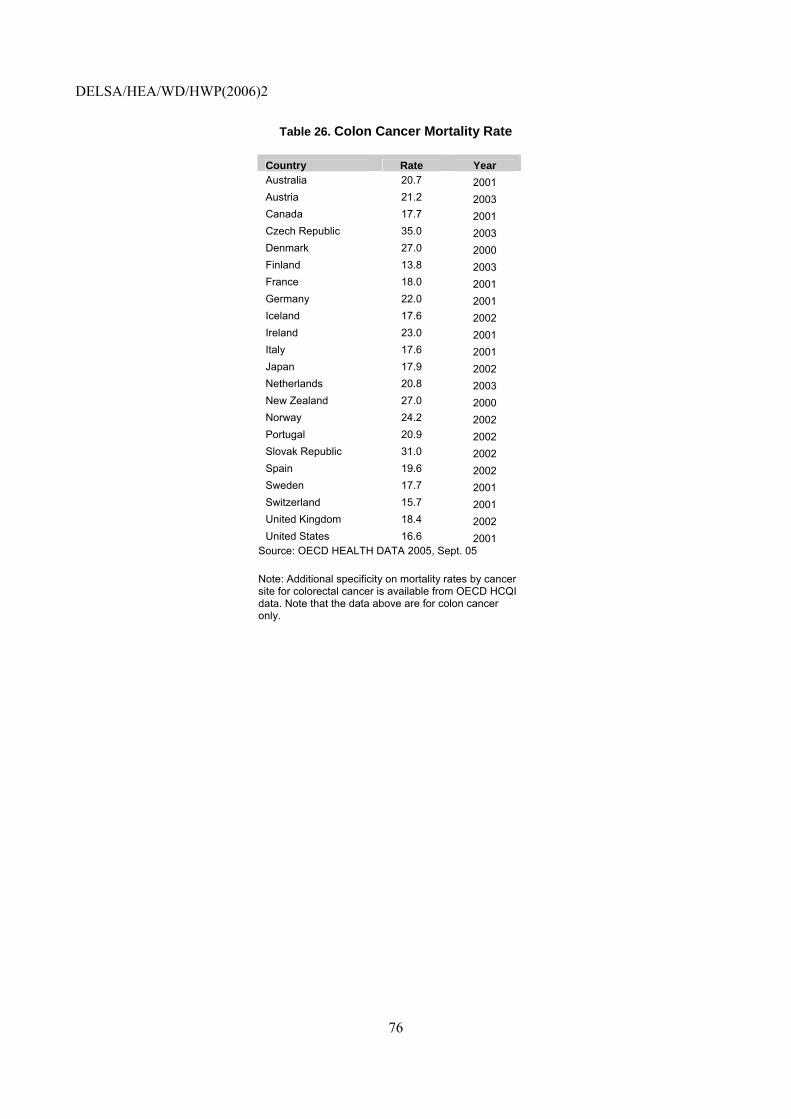
DELSA/HEA/WD/HWP(2006)2
76
Table 26. Colon Cancer Mortality Rate
Country Rate Year Australia 20.7 2001 Austria 21.2 2003 Canada 17.7 2001 Czech Republic 35.0 2003 Denmark 27.0 2000 Finland 13.8 2003 France 18.0 2001 Germany 22.0 2001 Iceland 17.6 2002 Ireland 23.0 2001 Italy 17.6 2001 Japan 17.9 2002 Netherlands 20.8 2003 New Zealand 27.0 2000 Norway 24.2 2002 Portugal 20.9 2002 Slovak Republic 31.0 2002 Spain 19.6 2002 Sweden 17.7 2001 Switzerland 15.7 2001 United Kingdom 18.4 2002 United States 16.6 2001
Source: OECD HEALTH DATA 2005, Sept. 05
Note: Additional specificity on mortality rates by cancer site for colorectal cancer is available from OECD HCQI data. Note that the data above are for colon cancer only.
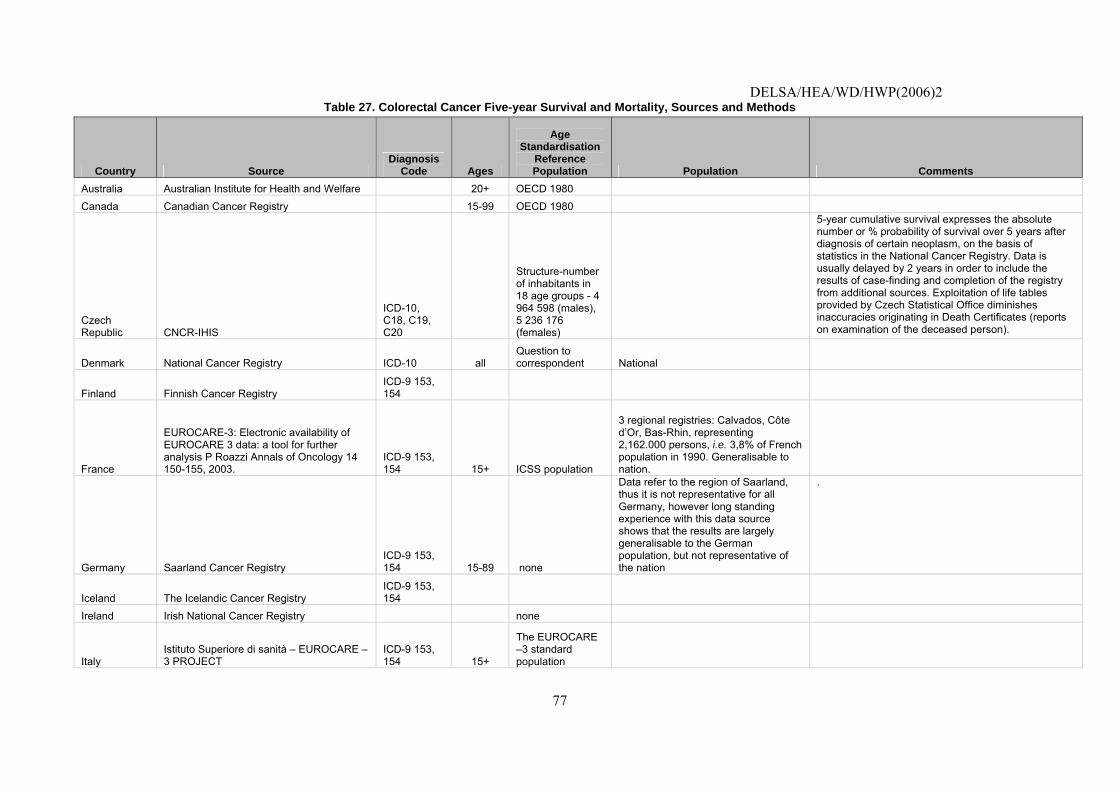
DELSA/HEA/WD/HWP(2006)2
77
Table 27. Colorectal Cancer Five-year Survival and Mortality, Sources and Methods
Country Source Diagnosis
Code Ages
Age Standardisation
Reference Population Population Comments
Australia Australian Institute for Health and Welfare 20+ OECD 1980
Canada Canadian Cancer Registry 15-99 OECD 1980
Czech Republic CNCR-IHIS
ICD-10, C18, C19, C20
Structure-number of inhabitants in 18 age groups - 4 964 598 (males), 5 236 176 (females)
5-year cumulative survival expresses the absolute number or % probability of survival over 5 years after diagnosis of certain neoplasm, on the basis of statistics in the National Cancer Registry. Data is usually delayed by 2 years in order to include the results of case-finding and completion of the registry from additional sources. Exploitation of life tables provided by Czech Statistical Office diminishes inaccuracies originating in Death Certificates (reports on examination of the deceased person).
Denmark National Cancer Registry ICD-10 all Question to correspondent National
Finland Finnish Cancer Registry ICD-9 153, 154
France
EUROCARE-3: Electronic availability of EUROCARE 3 data: a tool for further analysis P Roazzi Annals of Oncology 14 150-155, 2003.
ICD-9 153, 154 15+ ICSS population
3 regional registries: Calvados, Côte d’Or, Bas-Rhin, representing 2,162.000 persons, i.e. 3,8% of French population in 1990. Generalisable to nation.
Germany Saarland Cancer Registry ICD-9 153, 154 15-89 none
Data refer to the region of Saarland, thus it is not representative for all Germany, however long standing experience with this data source shows that the results are largely generalisable to the German population, but not representative of the nation
.
Iceland The Icelandic Cancer Registry ICD-9 153, 154
Ireland Irish National Cancer Registry none
Italy Istituto Superiore di sanità – EUROCARE – 3 PROJECT
ICD-9 153, 154 15+
The EUROCARE –3 standard population
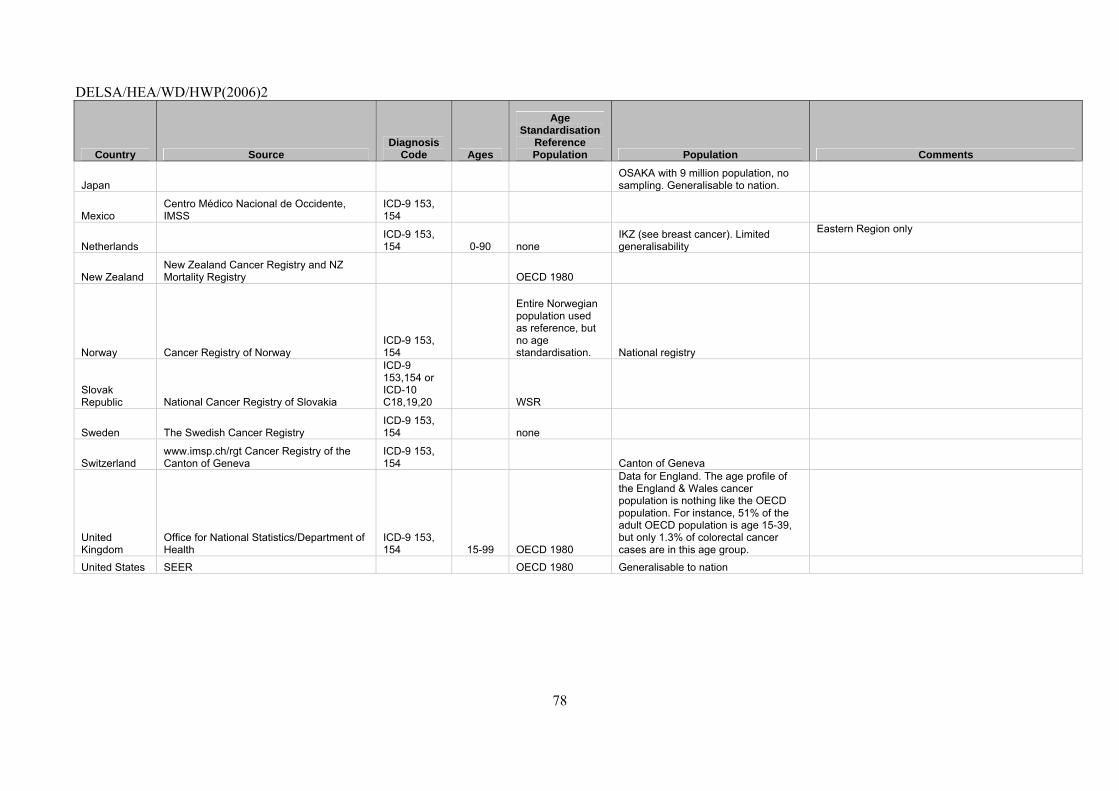
DELSA/HEA/WD/HWP(2006)2
78
Country Source Diagnosis
Code Ages
Age Standardisation
Reference Population Population Comments
Japan OSAKA with 9 million population, no sampling. Generalisable to nation.
Mexico Centro Médico Nacional de Occidente, IMSS
ICD-9 153, 154
Netherlands ICD-9 153, 154 0-90 none
IKZ (see breast cancer). Limited generalisability
Eastern Region only
New Zealand New Zealand Cancer Registry and NZ Mortality Registry OECD 1980
Norway Cancer Registry of Norway ICD-9 153, 154
Entire Norwegian population used as reference, but no age standardisation. National registry
Slovak Republic National Cancer Registry of Slovakia
ICD-9 153,154 or ICD-10 C18,19,20 WSR
Sweden The Swedish Cancer Registry ICD-9 153, 154 none
Switzerland www.imsp.ch/rgt Cancer Registry of the Canton of Geneva
ICD-9 153, 154 Canton of Geneva
United Kingdom
Office for National Statistics/Department of Health
ICD-9 153, 154 15-99 OECD 1980
Data for England. The age profile of the England & Wales cancer population is nothing like the OECD population. For instance, 51% of the adult OECD population is age 15-39, but only 1.3% of colorectal cancer cases are in this age group.
United States SEER OECD 1980 Generalisable to nation
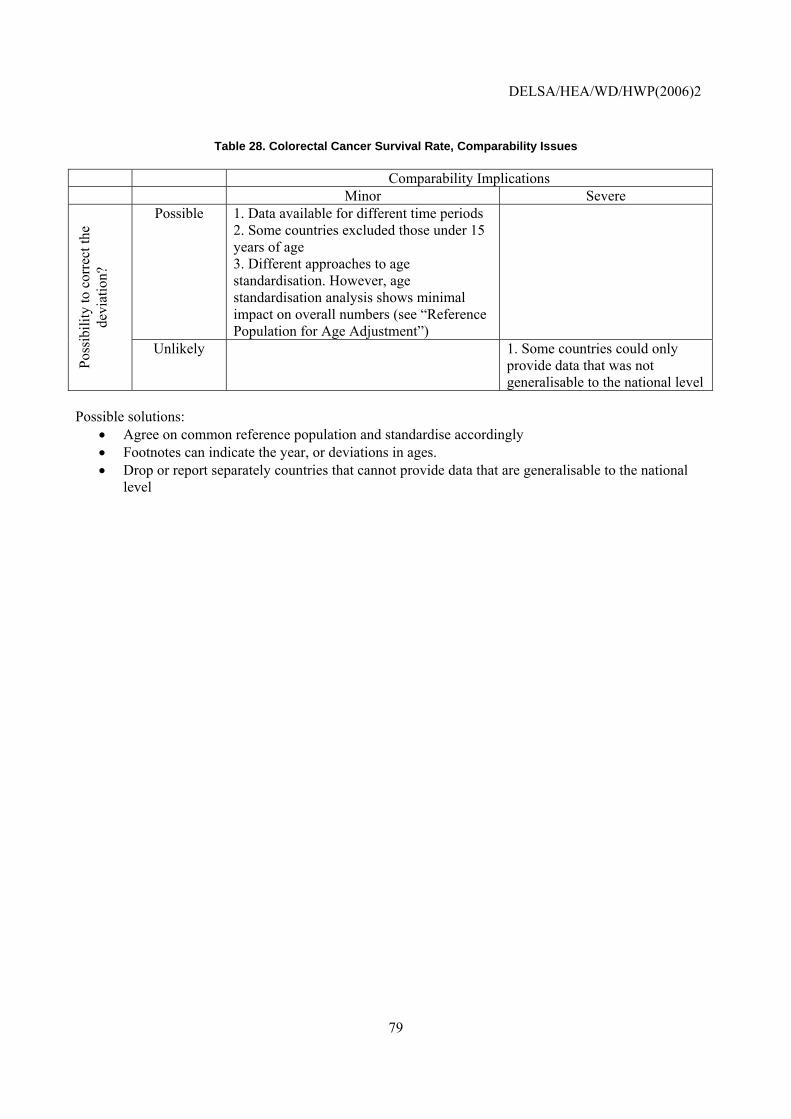
DELSA/HEA/WD/HWP(2006)2
79
Table 28. Colorectal Cancer Survival Rate, Comparability Issues
Comparability Implications Minor Severe
Possible 1. Data available for different time periods 2. Some countries excluded those under 15 years of age 3. Different approaches to age standardisation. However, age standardisation analysis shows minimal impact on overall numbers (see “Reference Population for Age Adjustment”)
Poss
ibili
ty to
cor
rect
the
devi
atio
n?
Unlikely 1. Some countries could only provide data that was not generalisable to the national level
Possible solutions:
• Agree on common reference population and standardise accordingly • Footnotes can indicate the year, or deviations in ages. • Drop or report separately countries that cannot provide data that are generalisable to the national
level
DELSA/HEA/WD/HWP(2006)2
80
6. Incidence of Vaccine Preventable Diseases (Pertussis, Measles, and Hepatitis B)
Operational Definition
Numerator: Number of reported cases Denominator: Total 100,000 population
Importance
136. Incidence: Pertussis infected an estimated 1 171 000 people in WHO Euro A countries in 2000, an incidence rate of 284 per 100 000. Measles infected an estimated 74 000 people in WHO Euro A countries in 2000, an incidence rate of 18 per 100 000. Hepatitis B infected an estimated 66 000 people in WHO Euro A countries in 2000, an incidence rate of 16 per 100 000.
137. Cost: Infectious diseases are the 14th highest attributable contributor to cost of illness in Canada (1.3% of direct and indirect costs). Treating those three diseases has important implications for health care spending. Data for the years 1980 to 1989 show that 69% of infants with pertussis required hospitalisation and 0.6% died.74 Measles can lead to acute and life-threatening complications, such as pneumonia and brain inflammation, and also to chronic complications, like Sub-acute Sclerosing Panencephalitis (SSPE), a chronic inflammation of the brain leading to progressive neurological deficits and finally death. Hepatitis B can lead to acute liver failure, requiring liver transplantation, and to liver cirrhosis.
138. Influenced by health system: Safe and effective vaccines exist for all three diseases.
Scientific Soundness
139. Face validity: Pertussis, measles, and Hepatitis B are almost completely preventable diseases. National vaccination programmes against these three diseases exist in most OECD countries.
140. Content validity: Reviews of the evidence supporting the efficacy of vaccines against these three diseases have concluded that the vaccines are highly effective.75,76,77 There is no evidence showing that the administration of these vaccines causes a specific allergy, asthma, autism, multiple sclerosis, or sudden infant death syndrome.78 Drops in the vaccination rate in OECD countries, such as the decline in pertussis vaccination in the United Kingdom in the 1970s due to a belief that it caused brain damage, have been associated with increased morbidity and mortality.79
74. http://www.pertussis.com/backgrounder.html , accessed 18 August 2003.
75. Gordon A. “Vaccines and vaccination.” New England Journal of Medicine 2001. 345(14): 1042-1053.
76. Bedford H. “Concerns about immunisation.” British Medical Journal 2000. 320:240-3.
77. Damme PV, Kane M, Medeus A. “Integration of hepatitis B vaccination into national immunisation programmes.” British Medical Journal 1997. 314:1033.
78. Gordon A. “Vaccines and vaccination.” New England Journal of Medicine 2001. 345(14): 1042-1053.
79. Gordon A. “Vaccines and vaccination.” New England Journal of Medicine 2001. 345(14): 1042-1053.
DELSA/HEA/WD/HWP(2006)2
81
141. Reliability: The incidence of these diseases may be affected by differences in the surveillance activities in each country. Countries may have different legal requirements concerning reporting. Enhanced diagnosis and awareness has lead to apparent increases in incidence of pertussis in several studies.80
Feasibility
142. Data availability: Incidence rates are available for 22 countries (Table 29). The incidence data submitted were for a range of years. In two countries reporting is mandated by the state, and in two other countries reporting is not mandatory, or it is only required for hepatitis B. One country does not distinguish between acute and non-acute Hepatitis B. One country was so concerned about the validity of the Hepatitis registry data that they did not report incidence. One country indicated that their measles rate is likely to be an overestimate. As discussed earlier in this report, considerable work remains to be done to harmonise different sources of data on this indicator, including the OECD HCQI data, WHO Health for All data and country data sources.
143. Comparability issues: Detailed documentation is provided in Table 29. Ideally, with regular HCQI data collection, countries will be able to provide rates for more closely rated time periods. The main comparability concerns are whether the data is from registries where reporting is mandatory, or voluntary, whether there is any systematic underreporting or over-reporting in those registries, and how this varies from county to country. A detailed review of this issue is presented above in “Notification on Cases of Vaccine-Preventable Disease.”
144. Overall Assessment: Overall, most countries were able to provide data on this indicator. Most countries already have national infectious disease registries.
80. Crowcroft NS. “Whooping cough – a continuing problem.” British Medical Journal. 2002. 324: 1537-8.
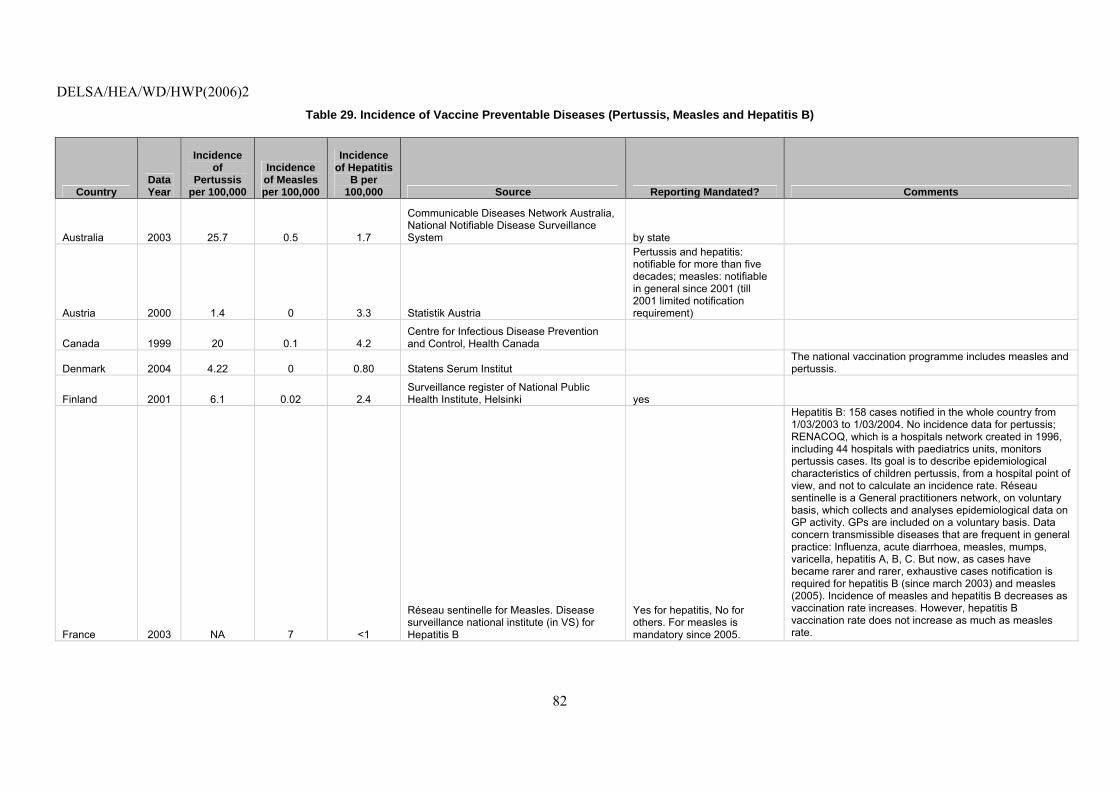
DELSA/HEA/WD/HWP(2006)2
82
Table 29. Incidence of Vaccine Preventable Diseases (Pertussis, Measles and Hepatitis B)
Country Data Year
Incidence of
Pertussis per 100,000
Incidence of Measles per 100,000
Incidence of Hepatitis
B per 100,000 Source Reporting Mandated? Comments
Australia 2003 25.7 0.5 1.7
Communicable Diseases Network Australia, National Notifiable Disease Surveillance System by state
Austria 2000 1.4 0 3.3 Statistik Austria
Pertussis and hepatitis: notifiable for more than five decades; measles: notifiable in general since 2001 (till 2001 limited notification requirement)
Canada 1999 20 0.1 4.2 Centre for Infectious Disease Prevention and Control, Health Canada
Denmark 2004 4.22 0 0.80 Statens Serum Institut The national vaccination programme includes measles and pertussis.
Finland 2001 6.1 0.02 2.4 Surveillance register of National Public Health Institute, Helsinki yes
France 2003 NA 7 <1
Réseau sentinelle for Measles. Disease surveillance national institute (in VS) for Hepatitis B
Yes for hepatitis, No for others. For measles is mandatory since 2005.
Hepatitis B: 158 cases notified in the whole country from 1/03/2003 to 1/03/2004. No incidence data for pertussis; RENACOQ, which is a hospitals network created in 1996, including 44 hospitals with paediatrics units, monitors pertussis cases. Its goal is to describe epidemiological characteristics of children pertussis, from a hospital point of view, and not to calculate an incidence rate. Réseau sentinelle is a General practitioners network, on voluntary basis, which collects and analyses epidemiological data on GP activity. GPs are included on a voluntary basis. Data concern transmissible diseases that are frequent in general practice: Influenza, acute diarrhoea, measles, mumps, varicella, hepatitis A, B, C. But now, as cases have became rarer and rarer, exhaustive cases notification is required for hepatitis B (since march 2003) and measles (2005). Incidence of measles and hepatitis B decreases as vaccination rate increases. However, hepatitis B vaccination rate does not increase as much as measles rate.
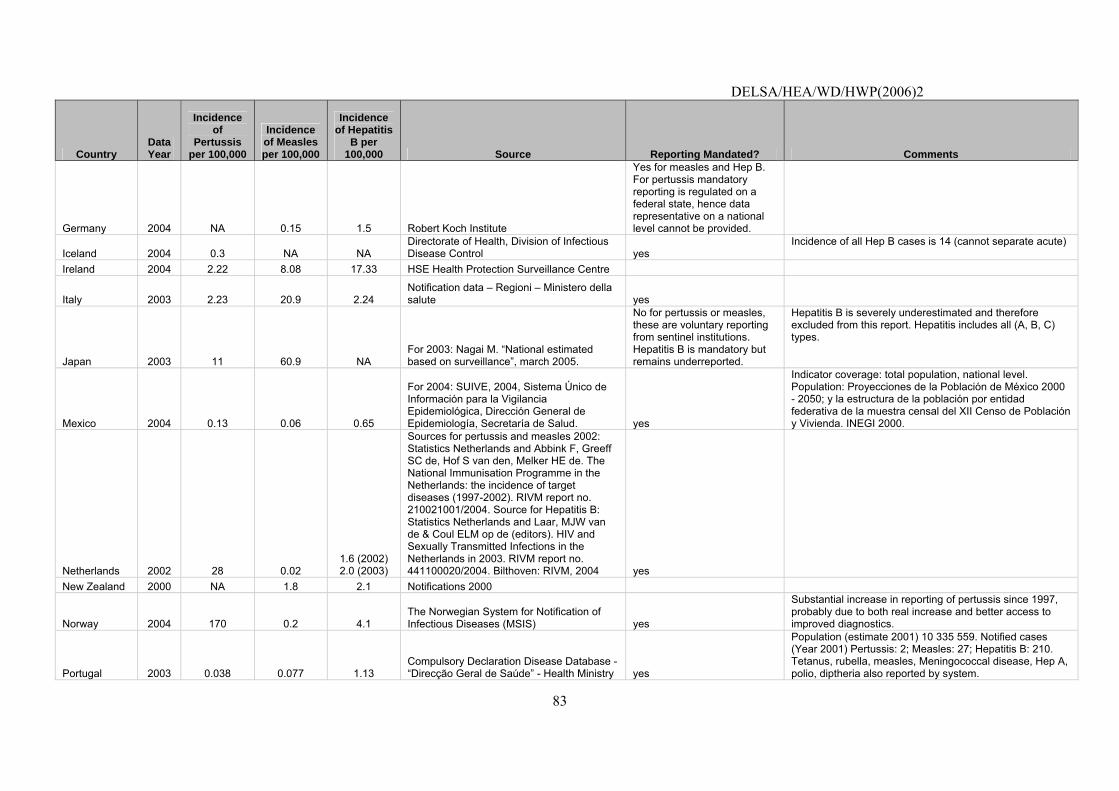
DELSA/HEA/WD/HWP(2006)2
83
Country Data Year
Incidence of
Pertussis per 100,000
Incidence of Measles per 100,000
Incidence of Hepatitis
B per 100,000 Source Reporting Mandated? Comments
Germany 2004 NA 0.15 1.5 Robert Koch Institute
Yes for measles and Hep B. For pertussis mandatory reporting is regulated on a federal state, hence data representative on a national level cannot be provided.
Iceland 2004 0.3 NA NA Directorate of Health, Division of Infectious Disease Control yes
Incidence of all Hep B cases is 14 (cannot separate acute)
Ireland 2004 2.22 8.08 17.33 HSE Health Protection Surveillance Centre
Italy 2003 2.23 20.9 2.24 Notification data – Regioni – Ministero della salute yes
Japan 2003 11 60.9 NA For 2003: Nagai M. “National estimated based on surveillance”, march 2005.
No for pertussis or measles, these are voluntary reporting from sentinel institutions. Hepatitis B is mandatory but remains underreported.
Hepatitis B is severely underestimated and therefore excluded from this report. Hepatitis includes all (A, B, C) types.
Mexico 2004 0.13 0.06 0.65
For 2004: SUIVE, 2004, Sistema Único de Información para la Vigilancia Epidemiológica, Dirección General de Epidemiología, Secretaría de Salud. yes
Indicator coverage: total population, national level. Population: Proyecciones de la Población de México 2000 - 2050; y la estructura de la población por entidad federativa de la muestra censal del XII Censo de Población y Vivienda. INEGI 2000.
Netherlands 2002 28 0.02 1.6 (2002) 2.0 (2003)
Sources for pertussis and measles 2002: Statistics Netherlands and Abbink F, Greeff SC de, Hof S van den, Melker HE de. The National Immunisation Programme in the Netherlands: the incidence of target diseases (1997-2002). RIVM report no. 210021001/2004. Source for Hepatitis B: Statistics Netherlands and Laar, MJW van de & Coul ELM op de (editors). HIV and Sexually Transmitted Infections in the Netherlands in 2003. RIVM report no. 441100020/2004. Bilthoven: RIVM, 2004 yes
New Zealand 2000 NA 1.8 2.1 Notifications 2000
Norway 2004 170 0.2 4.1 The Norwegian System for Notification of Infectious Diseases (MSIS) yes
Substantial increase in reporting of pertussis since 1997, probably due to both real increase and better access to improved diagnostics.
Portugal 2003 0.038 0.077 1.13 Compulsory Declaration Disease Database - “Direcção Geral de Saúde” - Health Ministry yes
Population (estimate 2001) 10 335 559. Notified cases (Year 2001) Pertussis: 2; Measles: 27; Hepatitis B: 210. Tetanus, rubella, measles, Meningococcal disease, Hep A, polio, diptheria also reported by system.
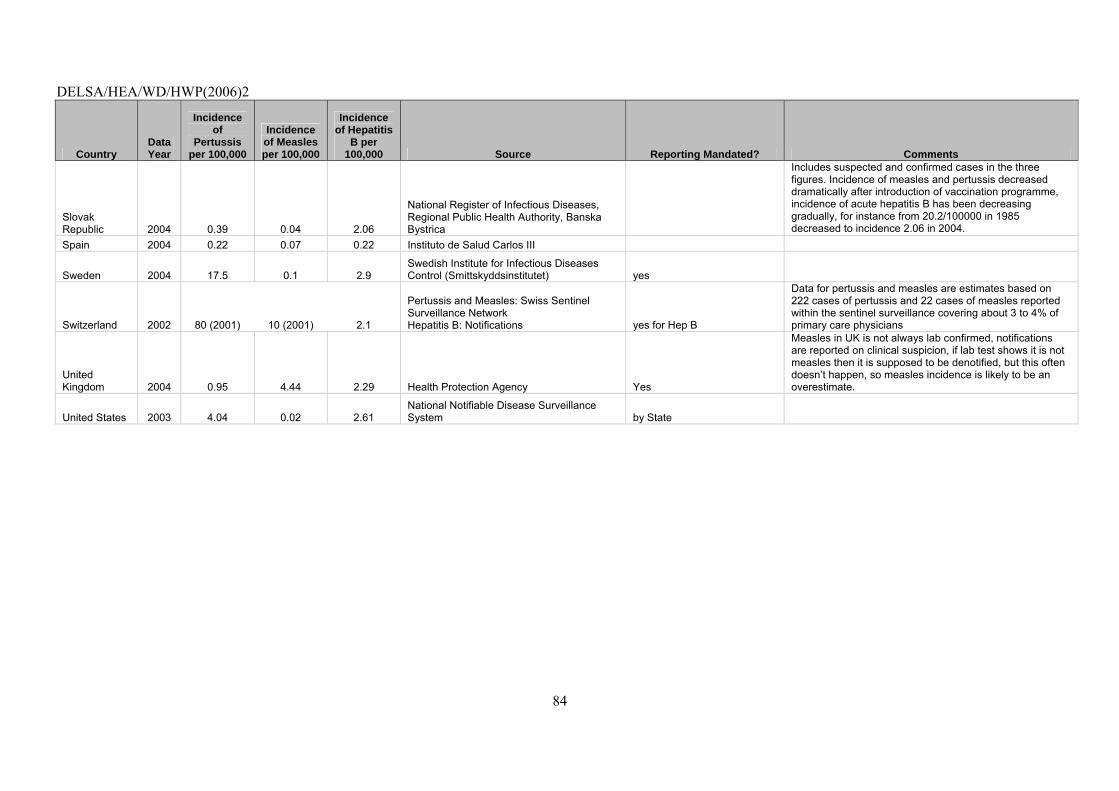
DELSA/HEA/WD/HWP(2006)2
84
Country Data Year
Incidence of
Pertussis per 100,000
Incidence of Measles per 100,000
Incidence of Hepatitis
B per 100,000 Source Reporting Mandated? Comments
Slovak Republic 2004 0.39 0.04 2.06
National Register of Infectious Diseases, Regional Public Health Authority, Banska Bystrica
Includes suspected and confirmed cases in the three figures. Incidence of measles and pertussis decreased dramatically after introduction of vaccination programme, incidence of acute hepatitis B has been decreasing gradually, for instance from 20.2/100000 in 1985 decreased to incidence 2.06 in 2004.
Spain 2004 0.22 0.07 0.22 Instituto de Salud Carlos III
Sweden 2004 17.5 0.1 2.9 Swedish Institute for Infectious Diseases Control (Smittskyddsinstitutet) yes
Switzerland 2002 80 (2001) 10 (2001) 2.1
Pertussis and Measles: Swiss Sentinel Surveillance Network Hepatitis B: Notifications yes for Hep B
Data for pertussis and measles are estimates based on 222 cases of pertussis and 22 cases of measles reported within the sentinel surveillance covering about 3 to 4% of primary care physicians
United Kingdom 2004 0.95 4.44 2.29 Health Protection Agency Yes
Measles in UK is not always lab confirmed, notifications are reported on clinical suspicion, if lab test shows it is not measles then it is supposed to be denotified, but this often doesn’t happen, so measles incidence is likely to be an overestimate.
United States 2003 4.04 0.02 2.61 National Notifiable Disease Surveillance System by State
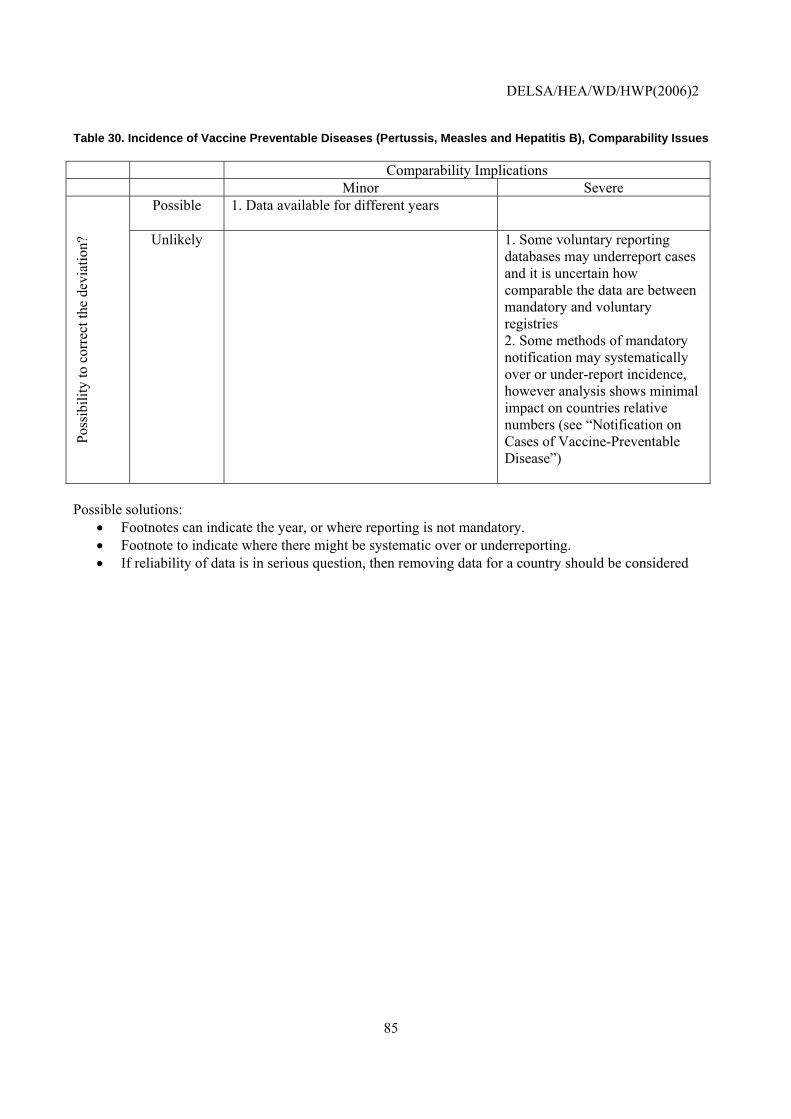
DELSA/HEA/WD/HWP(2006)2
85
Table 30. Incidence of Vaccine Preventable Diseases (Pertussis, Measles and Hepatitis B), Comparability Issues
Comparability Implications Minor Severe
Possible 1. Data available for different years
Poss
ibili
ty to
cor
rect
the
devi
atio
n? Unlikely 1. Some voluntary reporting
databases may underreport cases and it is uncertain how comparable the data are between mandatory and voluntary registries 2. Some methods of mandatory notification may systematically over or under-report incidence, however analysis shows minimal impact on countries relative numbers (see “Notification on Cases of Vaccine-Preventable Disease”)
Possible solutions:
• Footnotes can indicate the year, or where reporting is not mandatory. • Footnote to indicate where there might be systematic over or underreporting. • If reliability of data is in serious question, then removing data for a country should be considered
DELSA/HEA/WD/HWP(2006)2
86
7. Coverage for Basic Vaccination Programme, Age 2
Operational Definition
Numerator: Number of children who are fully immunised at age 2 for basic vaccination programme Denominator: Number of children age 2 years
Importance
145. Incidence: Childhood-cluster diseases (pertussis, poliomyelitis, diphtheria, measles, and tetanus) occurred in 1 245 000 people in WHO Euro A countries in 2000 (all pertussis and measles).
146. Cost: Infectious diseases are the 14th highest attributable contributor to cost of illness in Canada (1.3% of direct and indirect costs). Acute and chronic complications can be severe and are expensive to treat.
Scientific Soundness
147. Face validity: National governments have set goals for basic vaccination and should be able to compare how well they meet those goals compared to how well other countries meet theirs.
148. Content validity: Each country will have established its basic vaccination programme based on its interpretation of the evidence supporting each vaccine.
Feasibility
149. Data availability: Vaccination coverage rates are available for 20 countries (Table 31). The vaccination data provided were for the years 2000-2005. Some countries use slightly different age ranges. These ages tend to correspond to specific vaccination programmes in the individual countries. Most data comes from Health Ministries, although 2 came from studies of vaccination rates.
150. Comparability Issues: Detailed documentation is provided in Table 32 and 33. This indicator is fairly unique among the other potential indicators. This indicator is meant to measure compliance with national vaccination policies, rather than a uniform vaccination programme. Thus the deviations in age are not considered a threat to comparability as long as they reflect national policies. For this reason, it has been counted as “one” indicator, even though there are obviously a range of antigens included in each country’s vaccination policies and relative performance on each antigen’s vaccination levels.
151. Overall Assessment: A total of 20 countries were able to provide data for this indicator. Most countries regularly collect data on childhood vaccination, so there would be little additional collection burden.
.
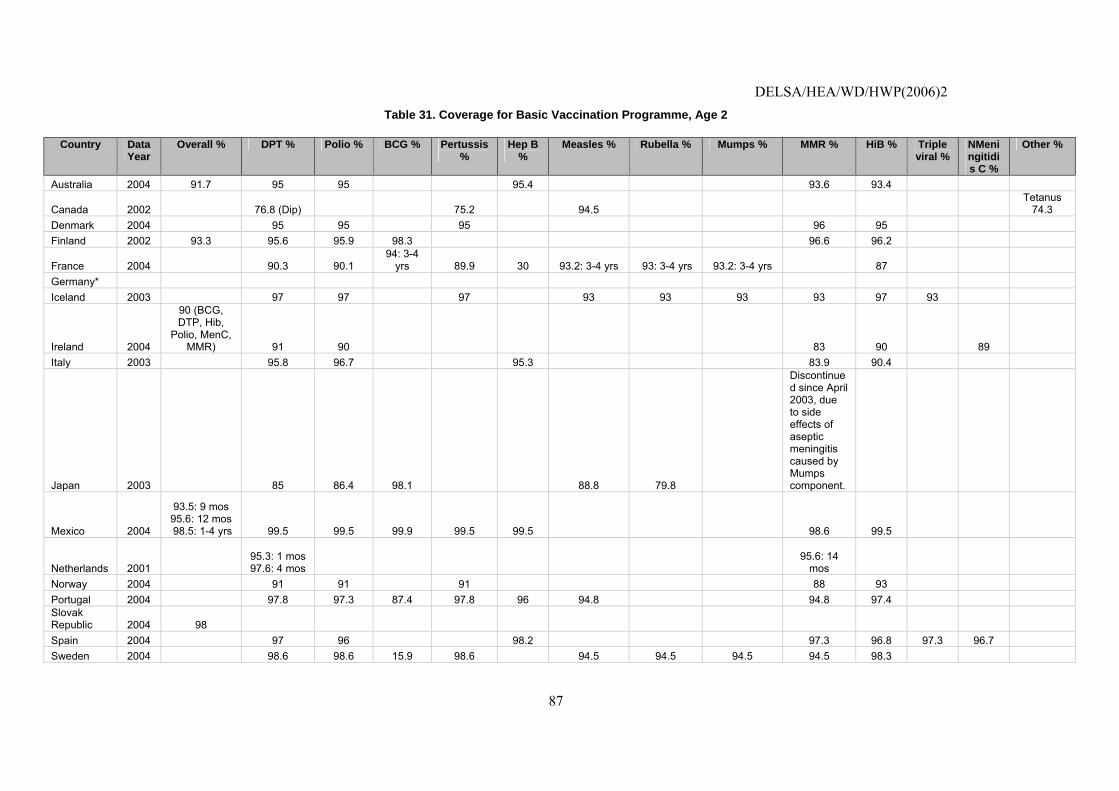
DELSA/HEA/WD/HWP(2006)2
87
Table 31. Coverage for Basic Vaccination Programme, Age 2
Country Data Year
Overall % DPT % Polio % BCG % Pertussis %
Hep B %
Measles % Rubella % Mumps % MMR % HiB % Triple viral %
NMeningitidis C %
Other %
Australia 2004 91.7 95 95 95.4 93.6 93.4
Canada 2002 76.8 (Dip) 75.2 94.5 Tetanus
74.3 Denmark 2004 95 95 95 96 95 Finland 2002 93.3 95.6 95.9 98.3 96.6 96.2
France 2004 90.3 90.1 94: 3-4
yrs 89.9 30 93.2: 3-4 yrs 93: 3-4 yrs 93.2: 3-4 yrs 87 Germany* Iceland 2003 97 97 97 93 93 93 93 97 93
Ireland 2004
90 (BCG, DTP, Hib,
Polio, MenC, MMR) 91 90 83 90 89
Italy 2003 95.8 96.7 95.3 83.9 90.4
Japan 2003 85 86.4 98.1 88.8 79.8
Discontinued since April 2003, due to side effects of aseptic meningitis caused by Mumps component.
Mexico 2004
93.5: 9 mos 95.6: 12 mos 98.5: 1-4 yrs 99.5 99.5 99.9 99.5 99.5 98.6 99.5
Netherlands 2001 95.3: 1 mos 97.6: 4 mos
95.6: 14
mos Norway 2004 91 91 91 88 93 Portugal 2004 97.8 97.3 87.4 97.8 96 94.8 94.8 97.4 Slovak Republic 2004 98 Spain 2004 97 96 98.2 97.3 96.8 97.3 96.7 Sweden 2004 98.6 98.6 15.9 98.6 94.5 94.5 94.5 94.5 98.3
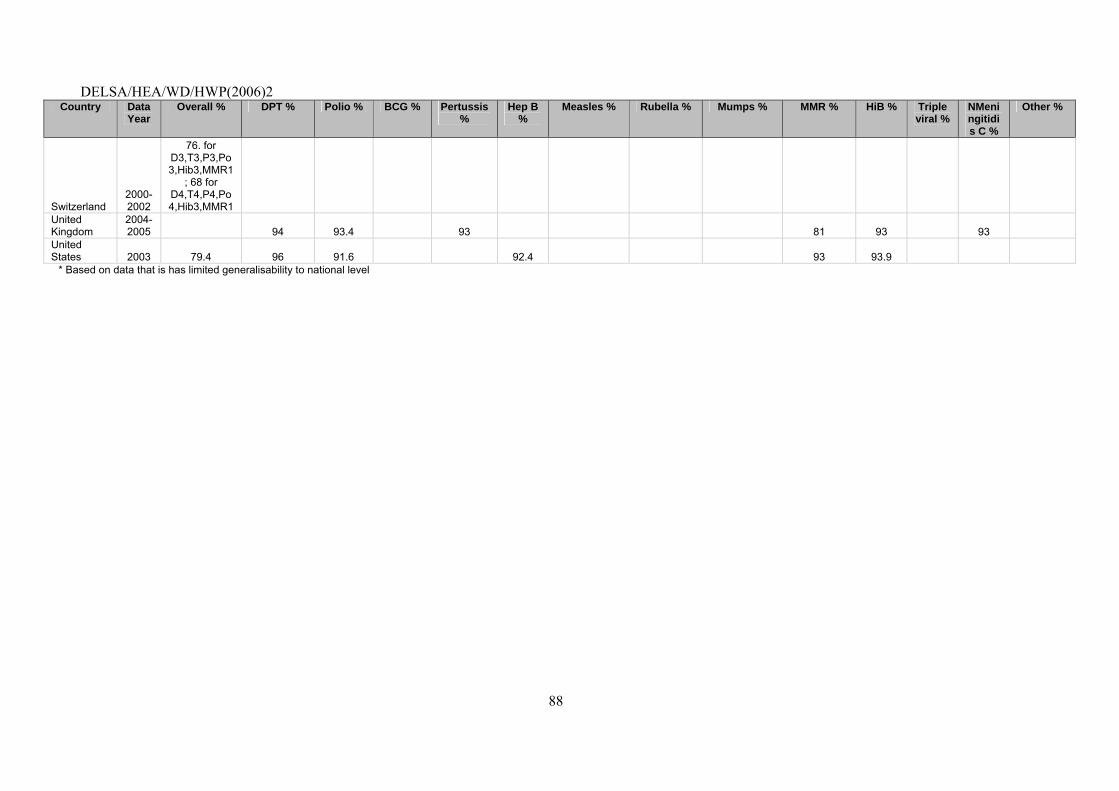
DELSA/HEA/WD/HWP(2006)2
88
Country Data Year
Overall % DPT % Polio % BCG % Pertussis %
Hep B %
Measles % Rubella % Mumps % MMR % HiB % Triple viral %
NMeningitidis C %
Other %
Switzerland 2000-2002
76. for D3,T3,P3,Po3,Hib3,MMR1
; 68 for D4,T4,P4,Po4,Hib3,MMR1
United Kingdom
2004-2005 94 93.4 93 81 93 93
United States 2003 79.4 96 91.6 92.4 93 93.9
* Based on data that is has limited generalisability to national level
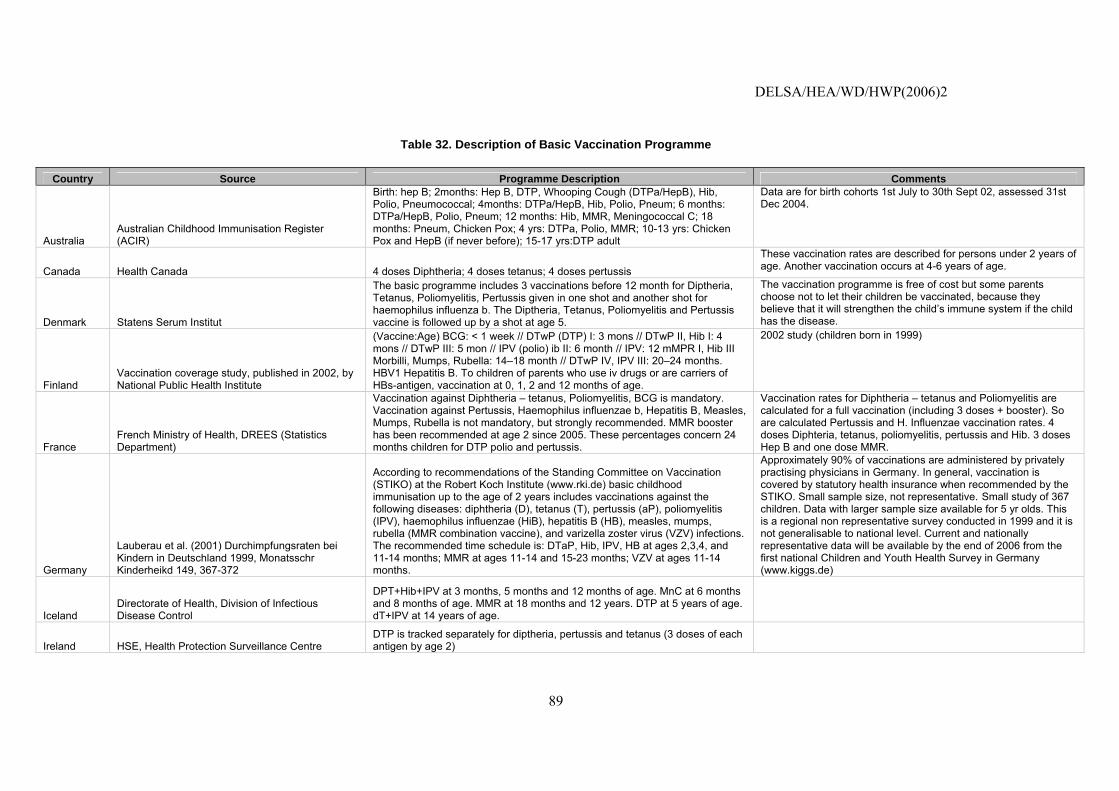
DELSA/HEA/WD/HWP(2006)2
89
Table 32. Description of Basic Vaccination Programme
Country Source Programme Description Comments
Australia Australian Childhood Immunisation Register (ACIR)
Birth: hep B; 2months: Hep B, DTP, Whooping Cough (DTPa/HepB), Hib, Polio, Pneumococcal; 4months: DTPa/HepB, Hib, Polio, Pneum; 6 months: DTPa/HepB, Polio, Pneum; 12 months: Hib, MMR, Meningococcal C; 18 months: Pneum, Chicken Pox; 4 yrs: DTPa, Polio, MMR; 10-13 yrs: Chicken Pox and HepB (if never before); 15-17 yrs:DTP adult
Data are for birth cohorts 1st July to 30th Sept 02, assessed 31st Dec 2004.
Canada Health Canada 4 doses Diphtheria; 4 doses tetanus; 4 doses pertussis
These vaccination rates are described for persons under 2 years of age. Another vaccination occurs at 4-6 years of age.
Denmark Statens Serum Institut
The basic programme includes 3 vaccinations before 12 month for Diptheria, Tetanus, Poliomyelitis, Pertussis given in one shot and another shot for haemophilus influenza b. The Diptheria, Tetanus, Poliomyelitis and Pertussis vaccine is followed up by a shot at age 5.
The vaccination programme is free of cost but some parents choose not to let their children be vaccinated, because they believe that it will strengthen the child’s immune system if the child has the disease.
Finland Vaccination coverage study, published in 2002, by National Public Health Institute
(Vaccine:Age) BCG: < 1 week // DTwP (DTP) I: 3 mons // DTwP II, Hib I: 4 mons // DTwP III: 5 mon // IPV (polio) ib II: 6 month // IPV: 12 mMPR I, Hib III Morbilli, Mumps, Rubella: 14–18 month // DTwP IV, IPV III: 20–24 months. HBV1 Hepatitis B. To children of parents who use iv drugs or are carriers of HBs-antigen, vaccination at 0, 1, 2 and 12 months of age.
2002 study (children born in 1999)
France French Ministry of Health, DREES (Statistics Department)
Vaccination against Diphtheria – tetanus, Poliomyelitis, BCG is mandatory. Vaccination against Pertussis, Haemophilus influenzae b, Hepatitis B, Measles, Mumps, Rubella is not mandatory, but strongly recommended. MMR booster has been recommended at age 2 since 2005. These percentages concern 24 months children for DTP polio and pertussis.
Vaccination rates for Diphtheria – tetanus and Poliomyelitis are calculated for a full vaccination (including 3 doses + booster). So are calculated Pertussis and H. Influenzae vaccination rates. 4 doses Diphteria, tetanus, poliomyelitis, pertussis and Hib. 3 doses Hep B and one dose MMR.
Germany
Lauberau et al. (2001) Durchimpfungsraten bei Kindern in Deutschland 1999, Monatsschr Kinderheikd 149, 367-372
According to recommendations of the Standing Committee on Vaccination (STIKO) at the Robert Koch Institute (www.rki.de) basic childhood immunisation up to the age of 2 years includes vaccinations against the following diseases: diphtheria (D), tetanus (T), pertussis (aP), poliomyelitis (IPV), haemophilus influenzae (HiB), hepatitis B (HB), measles, mumps, rubella (MMR combination vaccine), and varizella zoster virus (VZV) infections. The recommended time schedule is: DTaP, Hib, IPV, HB at ages 2,3,4, and 11-14 months; MMR at ages 11-14 and 15-23 months; VZV at ages 11-14 months.
Approximately 90% of vaccinations are administered by privately practising physicians in Germany. In general, vaccination is covered by statutory health insurance when recommended by the STIKO. Small sample size, not representative. Small study of 367 children. Data with larger sample size available for 5 yr olds. This is a regional non representative survey conducted in 1999 and it is not generalisable to national level. Current and nationally representative data will be available by the end of 2006 from the first national Children and Youth Health Survey in Germany (www.kiggs.de)
Iceland Directorate of Health, Division of Infectious Disease Control
DPT+Hib+IPV at 3 months, 5 months and 12 months of age. MnC at 6 months and 8 months of age. MMR at 18 months and 12 years. DTP at 5 years of age. dT+IPV at 14 years of age.
Ireland HSE, Health Protection Surveillance Centre DTP is tracked separately for diptheria, pertussis and tetanus (3 doses of each antigen by age 2)
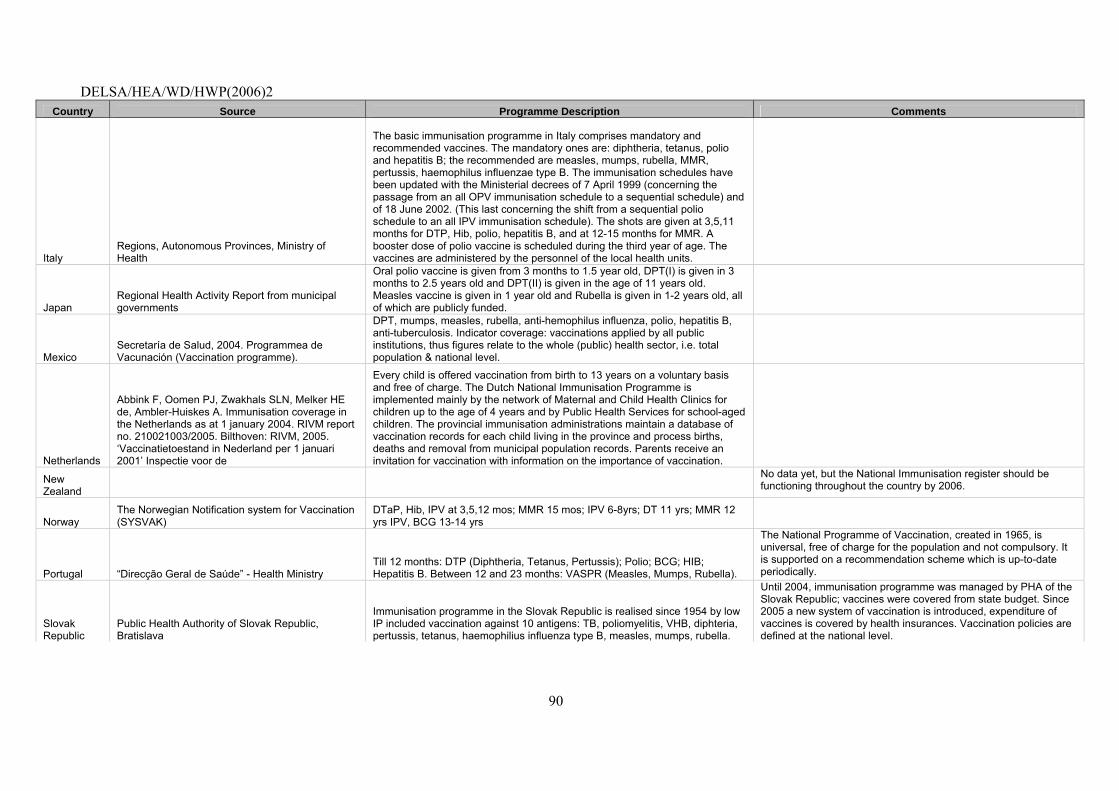
DELSA/HEA/WD/HWP(2006)2
90
Country Source Programme Description Comments
Italy Regions, Autonomous Provinces, Ministry of Health
The basic immunisation programme in Italy comprises mandatory and recommended vaccines. The mandatory ones are: diphtheria, tetanus, polio and hepatitis B; the recommended are measles, mumps, rubella, MMR, pertussis, haemophilus influenzae type B. The immunisation schedules have been updated with the Ministerial decrees of 7 April 1999 (concerning the passage from an all OPV immunisation schedule to a sequential schedule) and of 18 June 2002. (This last concerning the shift from a sequential polio schedule to an all IPV immunisation schedule). The shots are given at 3,5,11 months for DTP, Hib, polio, hepatitis B, and at 12-15 months for MMR. A booster dose of polio vaccine is scheduled during the third year of age. The vaccines are administered by the personnel of the local health units.
Japan Regional Health Activity Report from municipal governments
Oral polio vaccine is given from 3 months to 1.5 year old, DPT(I) is given in 3 months to 2.5 years old and DPT(II) is given in the age of 11 years old. Measles vaccine is given in 1 year old and Rubella is given in 1-2 years old, all of which are publicly funded.
Mexico Secretaría de Salud, 2004. Programmea de Vacunación (Vaccination programme).
DPT, mumps, measles, rubella, anti-hemophilus influenza, polio, hepatitis B, anti-tuberculosis. Indicator coverage: vaccinations applied by all public institutions, thus figures relate to the whole (public) health sector, i.e. total population & national level.
Netherlands
Abbink F, Oomen PJ, Zwakhals SLN, Melker HE de, Ambler-Huiskes A. Immunisation coverage in the Netherlands as at 1 january 2004. RIVM report no. 210021003/2005. Bilthoven: RIVM, 2005. ‘Vaccinatietoestand in Nederland per 1 januari 2001’ Inspectie voor de
Every child is offered vaccination from birth to 13 years on a voluntary basis and free of charge. The Dutch National Immunisation Programme is implemented mainly by the network of Maternal and Child Health Clinics for children up to the age of 4 years and by Public Health Services for school-aged children. The provincial immunisation administrations maintain a database of vaccination records for each child living in the province and process births, deaths and removal from municipal population records. Parents receive an invitation for vaccination with information on the importance of vaccination.
New Zealand
No data yet, but the National Immunisation register should be functioning throughout the country by 2006.
Norway The Norwegian Notification system for Vaccination (SYSVAK)
DTaP, Hib, IPV at 3,5,12 mos; MMR 15 mos; IPV 6-8yrs; DT 11 yrs; MMR 12 yrs IPV, BCG 13-14 yrs
Portugal “Direcção Geral de Saúde” - Health Ministry Till 12 months: DTP (Diphtheria, Tetanus, Pertussis); Polio; BCG; HIB; Hepatitis B. Between 12 and 23 months: VASPR (Measles, Mumps, Rubella).
The National Programme of Vaccination, created in 1965, is universal, free of charge for the population and not compulsory. It is supported on a recommendation scheme which is up-to-date periodically.
Slovak Republic
Public Health Authority of Slovak Republic, Bratislava
Immunisation programme in the Slovak Republic is realised since 1954 by low IP included vaccination against 10 antigens: TB, poliomyelitis, VHB, diphteria, pertussis, tetanus, haemophilius influenza type B, measles, mumps, rubella.
Until 2004, immunisation programme was managed by PHA of the Slovak Republic; vaccines were covered from state budget. Since 2005 a new system of vaccination is introduced, expenditure of vaccines is covered by health insurances. Vaccination policies are defined at the national level.
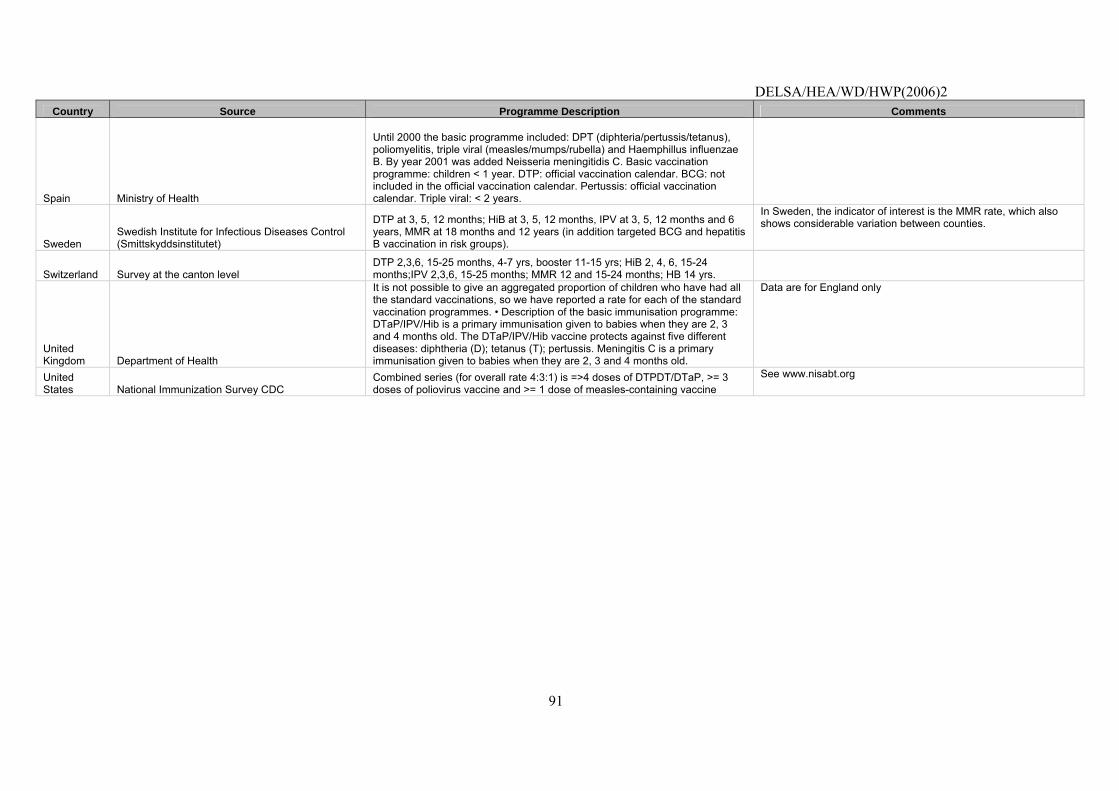
DELSA/HEA/WD/HWP(2006)2
91
Country Source Programme Description Comments
Spain Ministry of Health
Until 2000 the basic programme included: DPT (diphteria/pertussis/tetanus), poliomyelitis, triple viral (measles/mumps/rubella) and Haemphillus influenzae B. By year 2001 was added Neisseria meningitidis C. Basic vaccination programme: children < 1 year. DTP: official vaccination calendar. BCG: not included in the official vaccination calendar. Pertussis: official vaccination calendar. Triple viral: < 2 years.
Sweden Swedish Institute for Infectious Diseases Control (Smittskyddsinstitutet)
DTP at 3, 5, 12 months; HiB at 3, 5, 12 months, IPV at 3, 5, 12 months and 6 years, MMR at 18 months and 12 years (in addition targeted BCG and hepatitis B vaccination in risk groups).
In Sweden, the indicator of interest is the MMR rate, which also shows considerable variation between counties.
Switzerland Survey at the canton level DTP 2,3,6, 15-25 months, 4-7 yrs, booster 11-15 yrs; HiB 2, 4, 6, 15-24 months;IPV 2,3,6, 15-25 months; MMR 12 and 15-24 months; HB 14 yrs.
United Kingdom Department of Health
It is not possible to give an aggregated proportion of children who have had all the standard vaccinations, so we have reported a rate for each of the standard vaccination programmes. • Description of the basic immunisation programme: DTaP/IPV/Hib is a primary immunisation given to babies when they are 2, 3 and 4 months old. The DTaP/IPV/Hib vaccine protects against five different diseases: diphtheria (D); tetanus (T); pertussis. Meningitis C is a primary immunisation given to babies when they are 2, 3 and 4 months old.
Data are for England only
United States National Immunization Survey CDC
Combined series (for overall rate 4:3:1) is =>4 doses of DTPDT/DTaP, >= 3 doses of poliovirus vaccine and >= 1 dose of measles-containing vaccine
See www.nisabt.org
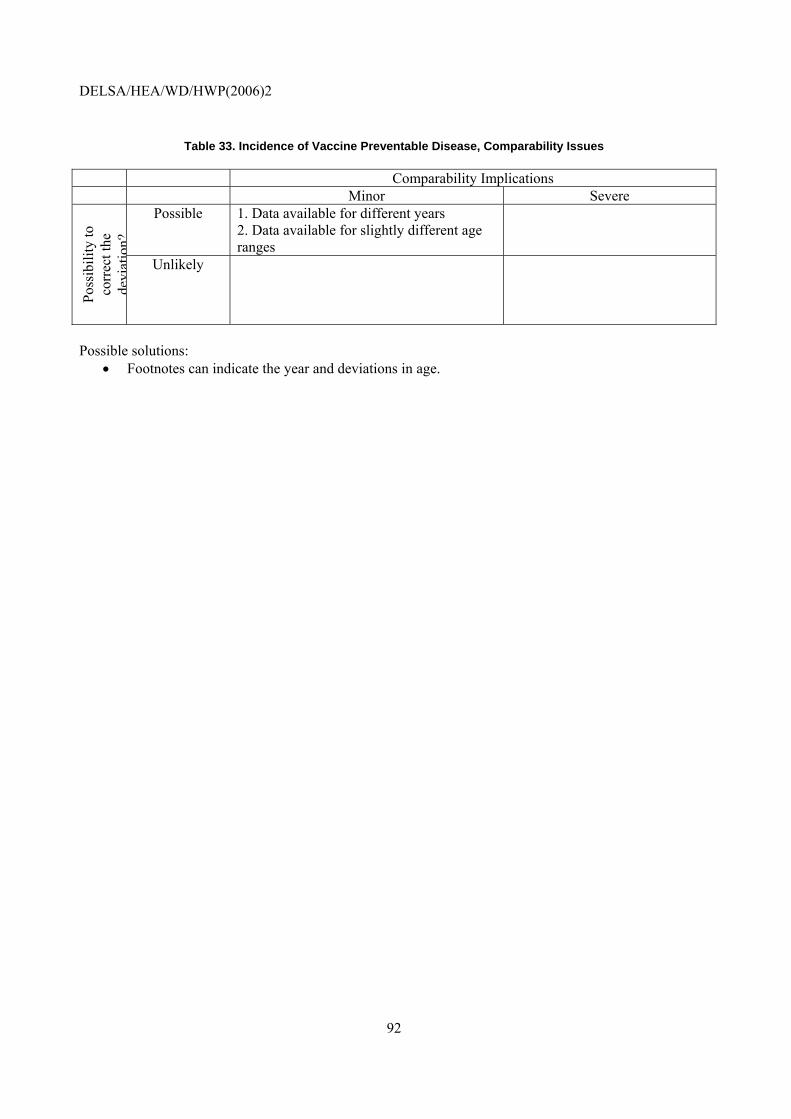
DELSA/HEA/WD/HWP(2006)2
92
Table 33. Incidence of Vaccine Preventable Disease, Comparability Issues
Comparability Implications Minor Severe
Possible 1. Data available for different years 2. Data available for slightly different age ranges
Poss
ibili
ty to
co
rrec
t the
de
viat
ion?
Unlikely
Possible solutions:
• Footnotes can indicate the year and deviations in age.
DELSA/HEA/WD/HWP(2006)2
93
8. Asthma Mortality Rate, Age 5-39
Operational Definition
Numerator: Number of people dying from asthma as a primary cause, age 5-39 [Asthma diagnostic codes ICD-9-493 or ICD-10-J45, J 46] Denominator: 100,000 people age 5-39
Importance
152. Mortality: Asthma was responsible for an estimated 3.4 deaths per 100 000 people in WHO Euro A countries in 2000. This represents 0.3% of all deaths.
153. Prevalence: Asthma affected an estimated five of every 100 people in WHO Euro A countries in 2000.
154. Cost: Respiratory diseases are the 5th attributable contributor to cost of illness in Canada (5.4% of direct and indirect costs). In the United States, costs for asthma total between $11.3 billion and $14 billion, with direct costs of hospital care, physician services, and prescriptions as much as $9.4 billion.81,82
Scientific Soundness
155. Face validity: Deaths from asthma should be preventable if the condition is managed appropriately. Asthma mortality rates have been used for health system comparison in the European Community, United Kingdom, Australia National Health Priority Areas, and several research studies.83
156. Content validity: No known studies have examined the content validity of asthma mortality.
157. Reliability: Differences in the coding of death certificates could affect the mortality rate. A study of the accuracy of death certificate coding for asthma found a low sensitivity (42%) but high specificity (99%), indicating that death certificates tend to underreport the true asthma mortality rate, but almost all deaths attributed to asthma are attributed correctly.84 The age group chosen, 5-39, was the group for which attribution of death to asthma was considered most reliable by consensus of a group of clinician experts from Australia, Canada, New Zealand, the UK, and the US.
81. US Department of Health and Human Services. US National Healthcare Quality Report 2004. Rockville, MD: Agency
for Healthcare Research and Quality.
82. National Heart, Lung, and Blood Institute. Data fact sheet: asthma statistics. Bethesda, MD: U.S. Department of Health and Human Services, National Institutes of Health, National Heart, Lung, and Blood Institute; 1999. Available at: http://www.nhlbi.nih.gov/health/prof/lung/asthma/asthstat.pdf
83. Charlton JR, Hartley RM, Silver R, Holland WW. Geographical variation in mortality from conditions amenable to medical intervention in England and Wales. Lancet. 1983; 1(8236 pt 1): 691-696; Holland WW and the EC Working Group on Health Services and “Avoidable Death.” Eds. European Community Atlas of Avoidable Death 1985-1989. 3rd ed. Oxford: Oxford University Press, 1997; Manuel DG, Mao Y. “Avoidable mortality in the United States and Canada, 1980-1996.” American Journal of Public Health. 2002. 92(9):1481-84; Australian National Health Priority Areas, http://www.aihw.gov.au/nhpa/asthma/indicators.html, accessed May 2003.
84. Hunt LW, Silverstein MD, Reed CE, O’Connell EJ, O’Fallon WM, Yunginger JW. “Accuracy of the death certificate in a population-based study of asthmatic patients.” JAMA 1993, 269(15): 1947-1952.
DELSA/HEA/WD/HWP(2006)2
94
Feasibility
158. Data Availability: Asthma mortality rates are available for 22 countries (Table 34). The asthma mortality data provided range from 1998-2004. Some countries used ICD-9 codes, and some used ICD-10 codes and the ICD-10 codes included differed. Age standardisation, when done, was performed with a number of different reference populations. Countries were able to comply with the OECD age range. One country expressed concern that asthma deaths may have been recorded as more general respiratory deaths.
159. Comparability issues: Detailed documentation is provided in Table 35. While there is a one-to-one crosswalk between the ICD-9 and ICD-10 coding systems, some countries did not include the ICD-10 J46 (status asthmaticus), which denotes a severe exacerbation of asthma. Since patients with such severe attacks are at higher mortality risk, this coding difference may have a severe impact on comparability. For at least one country, there was concern that some deaths may have been recorded as more general respiratory deaths. This issue was investigated in depth as part of the data comparability analyses and a presentation of the summary of the findings is presented in the main section of this report.
160. Overall assessment: A total of 22 countries were able to provide data for this indicator. This indicator would be available through administrative records. In the future, the data should be age-standardised to a consistent reference population.

DELSA/HEA/WD/HWP(2006)2
95
Table 34. Asthma Mortality Rate, Ages 5-39
Country
Asthma Mortality
per 100,000 people
Data Year Source Diagnosis Code
Reference Population for Age
Adjustment Comments
Australia 0.37 2003 Australia Institute for Health and Welfare Mortality Database OECD 1980
Austria 0.1 2000 Statistik Austria
Canada 0.11 2002 Canadian Vital Statistics Mortality Database ICD-10 J45, J46 1991 Census of Canada
Denmark 0.407 2001 Causes of Death Register ICD-10 J45, J46 none
Denmark wishes to make sure that the possibility of underreporting for this indicator is recognised. The underreporting makes comparisons difficult and misleading.
Finland 0 2003 Statistics Finland ICD-9-493 / ICD-10-J45, J46 none
ages 5-39
France 0.3 2001
Numerator: national exhaustive mortality data (centre for epidemiology of medical causes of deaths – INSERM-CépiDc) for numerator, INSEE (Statistics National Institute) for population) ICD-10 J45, 46 none
Germany 0.16 2003 Todesursachenstatistik (causes of death statistics) ICD-10 J45, J46 none Value for ICD-10 J40-J47 is: 0.28.
Iceland 0 2003 National Death Registry ICD-10 J45 none
Ireland 0.38 2003 PHIS ICD-9-493 PHIS Population Data
Italy 0.144 2001 Italian Mortality data base, collected by ISTAT and processed by Istituto Superiore di Sanità ICD-9 493 Italian Census 1991
Japan 0.24 2004 Vital statistics of Japan 2004 ICD-10-J45, J46
Mexico 0.32 2002 Estadísticas Vitales, INEGI 2002. Proyecciones de Población de México 2000-2050, Conapo 2001. ICD-10 J45-46 none
Netherlands 0.127 2002 Statistics Netherlands ICD-10 J45, 46 European standard population 1990
Data from Statistics Netherlands, processed by Public Health Forecasting (VTV part of RIVM, funded by ministry of public health)
New Zealand 0.8 2000 New Zealand Deaths OECD 1980
Norway 0.18 2003 Statistics Norway (SSB) ICD-10 J45
Portugal 0.16 2002 Data Base of Statistics National Institute ICD-9 493 none Slovak Republic 0.111 2004
Spain 0.197 1998 Instituto Nacional de Estadística
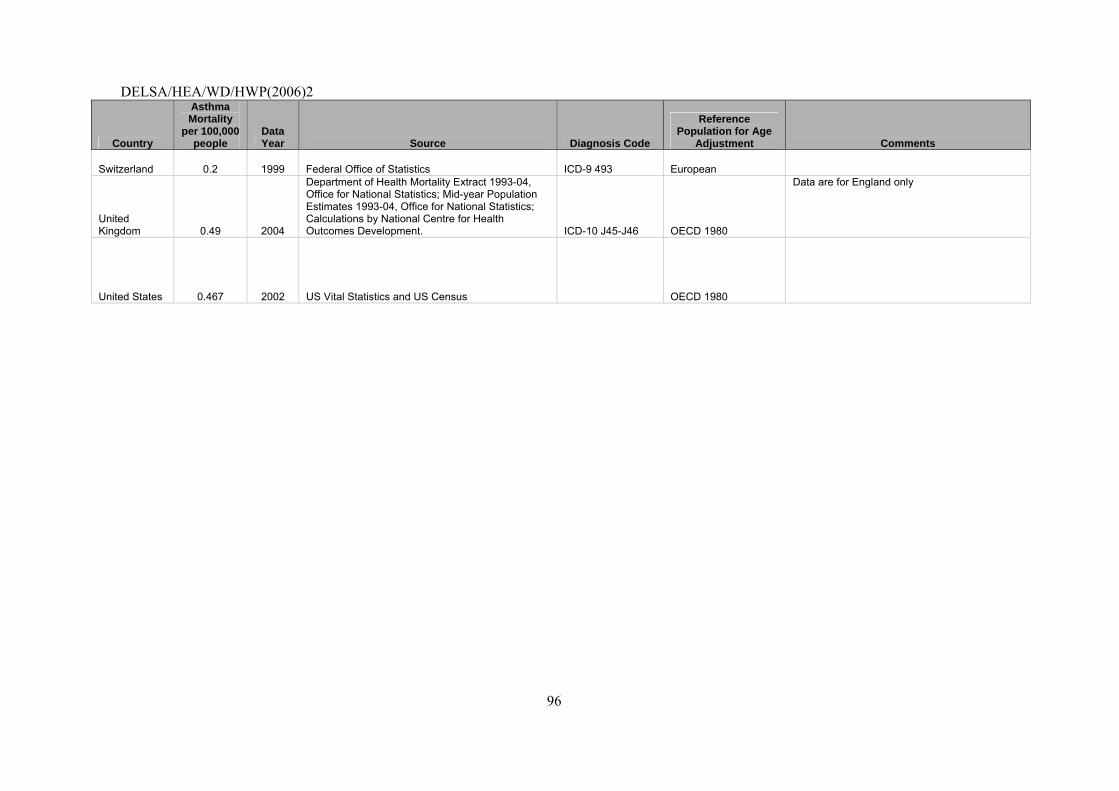
DELSA/HEA/WD/HWP(2006)2
96
Country
Asthma Mortality
per 100,000 people
Data Year Source Diagnosis Code
Reference Population for Age
Adjustment Comments
Switzerland 0.2 1999 Federal Office of Statistics ICD-9 493 European
United Kingdom 0.49 2004
Department of Health Mortality Extract 1993-04, Office for National Statistics; Mid-year Population Estimates 1993-04, Office for National Statistics; Calculations by National Centre for Health Outcomes Development. ICD-10 J45-J46 OECD 1980
Data are for England only
United States 0.467 2002 US Vital Statistics and US Census OECD 1980
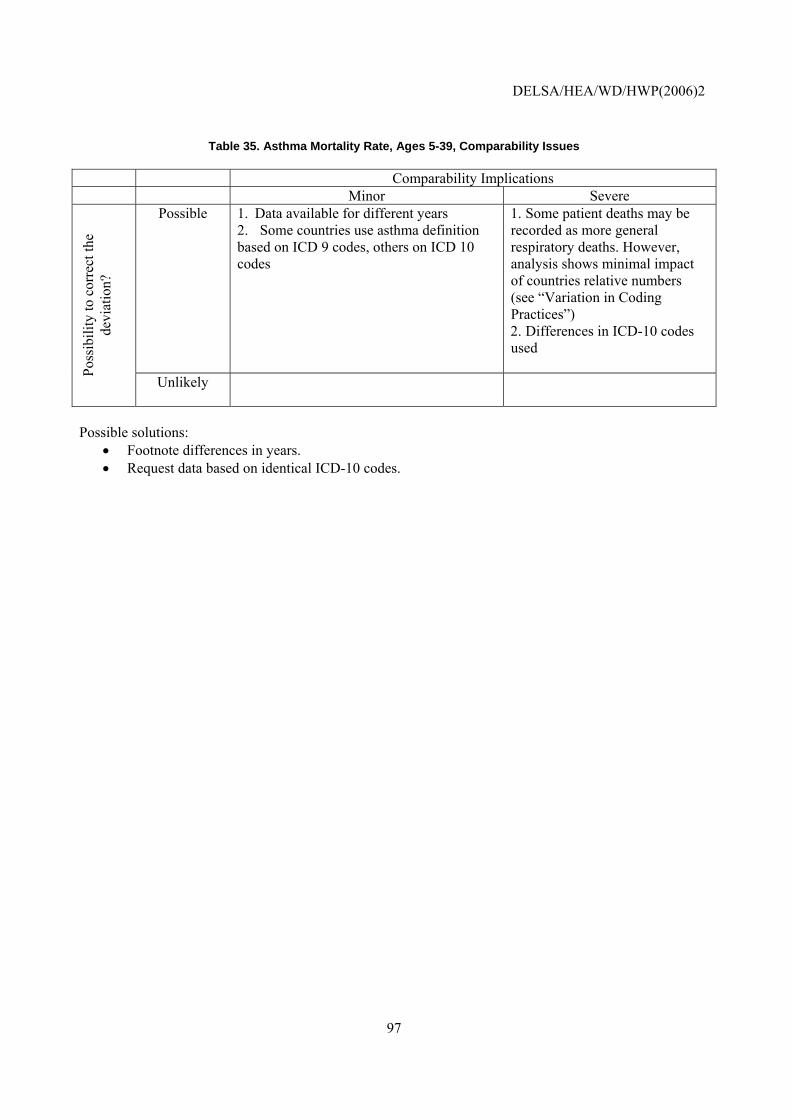
DELSA/HEA/WD/HWP(2006)2
97
Table 35. Asthma Mortality Rate, Ages 5-39, Comparability Issues
Comparability Implications Minor Severe
Possible 1. Data available for different years 2. Some countries use asthma definition based on ICD 9 codes, others on ICD 10 codes
1. Some patient deaths may be recorded as more general respiratory deaths. However, analysis shows minimal impact of countries relative numbers (see “Variation in Coding Practices”) 2. Differences in ICD-10 codes used
Poss
ibili
ty to
cor
rect
the
devi
atio
n?
Unlikely
Possible solutions:
• Footnote differences in years. • Request data based on identical ICD-10 codes.
DELSA/HEA/WD/HWP(2006)2
98
9. Acute Myocardial Infarction 30-Day Case-Fatality Rate/In-Hospital Mortality Rate
Operational Definition
Numerator: Number of deaths in the hospital that occurred within 30 days of hospital admission with primary diagnosis of acute myocardial infarction (ICD-9 410 or ICD-10 I21, I22) Denominator: Number of people hospitalised with primary diagnosis of acute myocardial infarction.
Importance
161. Mortality: Ischemic heart disease was responsible for an estimated 185 deaths per 100 000 people in WHO Euro A countries in 2000, the leading cause of death. This represents 18.7% of all deaths.
162. Prevalence: The point prevalence of angina pectoris was estimated at 8.3 per 1 000 people in WHO Euro A countries in 2000.
163. Cost: Cardiovascular diseases are the largest attributable contributor to cost of illness in Canada (11.6% of direct and indirect costs). The cost of heart disease and stroke in the United States is projected to be $368 billion in 2004.85
Scientific Soundness
164. Face validity: Many research studies have linked processes of care for AMI with survival improvements, resulting in detailed practice guidelines.86 AMI case-fatality rates have been used for hospital benchmarking by the US Agency for Healthcare Research and Quality (AHRQ),87 the United Kingdom’s National Health Service, and a variety of hospital associations and quality monitoring groups in the US. They have also been employed for international comparisons by the OECD Ageing-Related Diseases Project88 and the WHO Monica Project89
165. Content validity: The content validity of this indicator was reviewed by AHRQ for use at the hospital level.90 The review found clear evidence that specific processes of care lead to improved outcomes, including mortality, at the patient level. At the hospital level, the evidence supporting content validity was considered “substantial.” This was based on studies linking hospitals with higher quality ratings based on processes of care provided, peer reputation, or other means with lower case-fatality rates. No validation studies have been performed at the international level.
85 Centers for Disease Control and Prevention. Preventing heart disease and stroke: addressing the Nation's leading
killers. Atlanta, GA: Centers for Disease Control and Prevention; 2004. Available at:http://www.cdc.gov/nccdphp/aag/pdf/aag_cvh2004.pdf.
86. Davies SM, Geppert J, McClellan M, McDonald KM, Romano PS, Shojania KJ. “Refinement of the HCUP quality indicators.” AHRQ publication 01-0035, May 2001.
87. Davies SM, Geppert J, McClellan M, McDonald KM, Romano PS, Shojania KJ. “Refinement of the HCUP quality indicators.” AHRQ publication 01-0035, May 2001.
88. Organisation for Economic Cooperation and Development. A Disease-Based Comparison of Health Systems: What is Best at What Cost? (Paris: OECD, 2003).
89. http://www.ktl.fi/monica/public/brief.html accessed 19 August 2003.
90. Davies SM, Geppert J, McClellan M, McDonald KM, Romano PS, Shojania KJ. “Refinement of the HCUP quality indicators.” AHRQ publication 01-0035, May 2001.
DELSA/HEA/WD/HWP(2006)2
99
166. Reliability: The measurement of rates may be affected by differences in coding practices among hospitals and countries; no evidence on the reliability of international comparisons using AMI coding exists. Differences in the average severity of the acute event and the underlying and concomitant chronic disease in different countries may also influence rates. Another threat to reliably measuring AMI mortality rates is the reliance on the identification of the event based on hospital administrative data. Differences in admission practices for AMI cases would affect the denominator of this indicator.
167. An important threat to reliability is the fact that constructing case-fatality rates requires following patients after hospital discharge, which is not possible in many countries for data limitations and confidentiality reasons. If in-hospital mortality rates were used as a proxy for case-fatality rates, differences in discharge practices would affect the numerator since any deaths after discharge or transfer to another care institution would not be captured.
168. Data from countries with can provide both in-hospital and 30-day case-fatality rates show that most deaths occur in the hospital, with mortality rates increasing with age. Patients age 40-44 had an average 4.3% case-fatality rate in the hospital, with another 0.2% case-fatality rate after discharge; patients age 65-69 had average in-hospital case-fatality of 12.5%, and 1.8% case-fatality after discharge; and patients age 85-89 had an average 31.7% in-hospital case-fatality rate, with 3.4% dying after discharge.91 The variation among countries in the percentage of deaths occurring in-hospital versus out-of-hospital was small; the percentage of deaths occurring in-hospital ranged from 74-90% in the 40-59 age group, from 78-89% in the 60-74 age group, and from 77-90% in the 75-89 age group. These results suggest that the in-hospital case-fatality rate captures the majority of deaths following AMI. Only few patients die after hospital discharge, suggesting that in-hospital mortality rates may be regarded a suitable proxy for true case-fatality rates at the national level.
Feasibility
169. Data availability: AMI 30-day in-hospital mortality rates were available for 20 countries. (Table 36) Countries provided data for years ranging from 1999 to 2004. Seven countries excluded some age groups. While some countries use ICD-9 and some use ICD-10 code, the definitions are fully equivalent. One country included deaths outside the hospital.
170. Comparability issues: Detailed documentation is provided in Table 37 and an assessment in Table 38. Some countries have a unique patient identifier that allows identifying hospital readmissions. Those countries will be able to accurately determining the denominator based on unique cases, whereas countries without such an identifier base the denominator on hospital episodes. Using hospital admission will underestimate the case-fatality rate. To illustrate this with an example, a patient discharged after 15 days, who was readmitted seven days later and died two days after the second admission, would contribute two episodes to the denominator, one with and one without death, if no unique identifier was available. The identifier would allow correctly determining that this constituted only one case. This issue was investigated in detail as part of the data comparability analyses and is reported in the main section of this report.
171. For the numerator, some countries are able to track patients after hospital discharge and are thus able to provide a true 30-day case fatality rate, whereas other can only provide the in-hospital mortality rate, which will be lower. As we have shown, in-hospital deaths represent about 90% of all deaths, but the proportion differs by country. Another challenge is that this indicator only covers patients who die in the 91. The countries studied were Denmark, the United States, Finland, Sweden, and Canada (province of Ontario). The
results are published in Moise P and Jacobzone S, “OECD study of cross-national differences in the treatment, costs and outcomes of ischemic heart disease.” OECD Health Working Papers no. 3. Paris: OECD, 2003. Case-fatality for men and women was calculated separately.
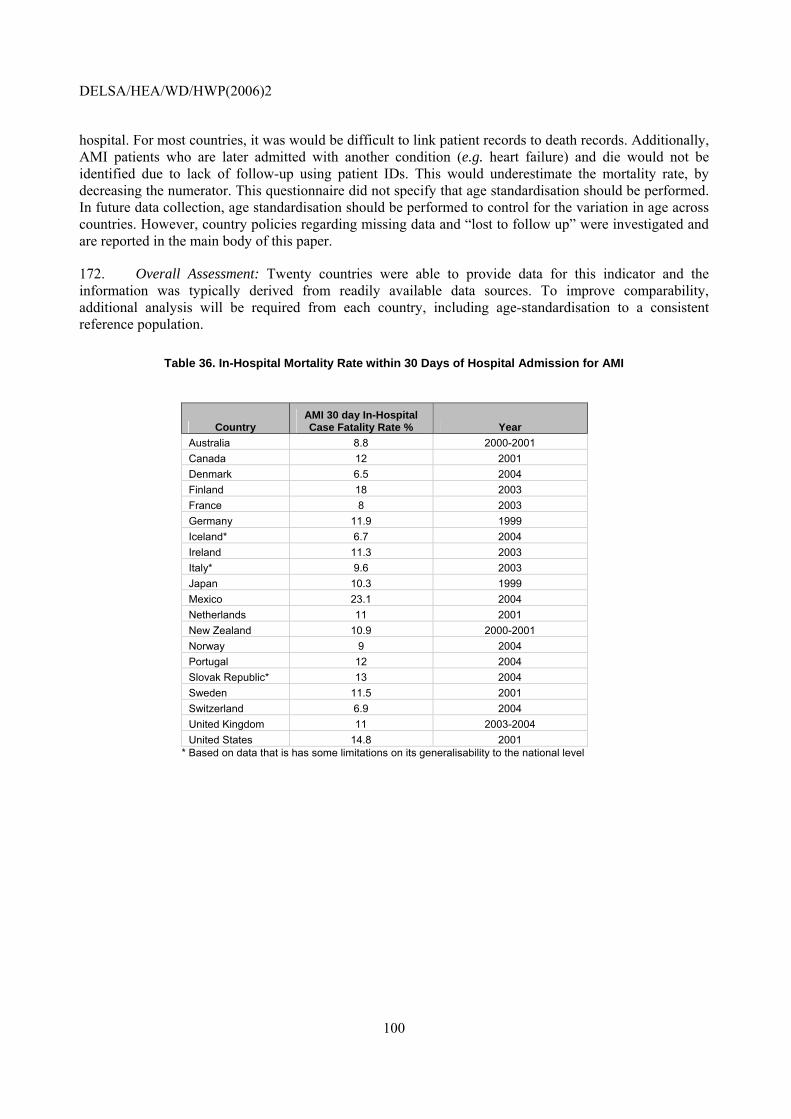
DELSA/HEA/WD/HWP(2006)2
100
hospital. For most countries, it was would be difficult to link patient records to death records. Additionally, AMI patients who are later admitted with another condition (e.g. heart failure) and die would not be identified due to lack of follow-up using patient IDs. This would underestimate the mortality rate, by decreasing the numerator. This questionnaire did not specify that age standardisation should be performed. In future data collection, age standardisation should be performed to control for the variation in age across countries. However, country policies regarding missing data and “lost to follow up” were investigated and are reported in the main body of this paper.
172. Overall Assessment: Twenty countries were able to provide data for this indicator and the information was typically derived from readily available data sources. To improve comparability, additional analysis will be required from each country, including age-standardisation to a consistent reference population.
Table 36. In-Hospital Mortality Rate within 30 Days of Hospital Admission for AMI
Country AMI 30 day In-Hospital Case Fatality Rate % Year
Australia 8.8 2000-2001 Canada 12 2001 Denmark 6.5 2004 Finland 18 2003 France 8 2003 Germany 11.9 1999 Iceland* 6.7 2004 Ireland 11.3 2003 Italy* 9.6 2003 Japan 10.3 1999 Mexico 23.1 2004 Netherlands 11 2001 New Zealand 10.9 2000-2001 Norway 9 2004 Portugal 12 2004 Slovak Republic* 13 2004 Sweden 11.5 2001 Switzerland 6.9 2004 United Kingdom 11 2003-2004 United States 14.8 2001
* Based on data that is has some limitations on its generalisability to the national level
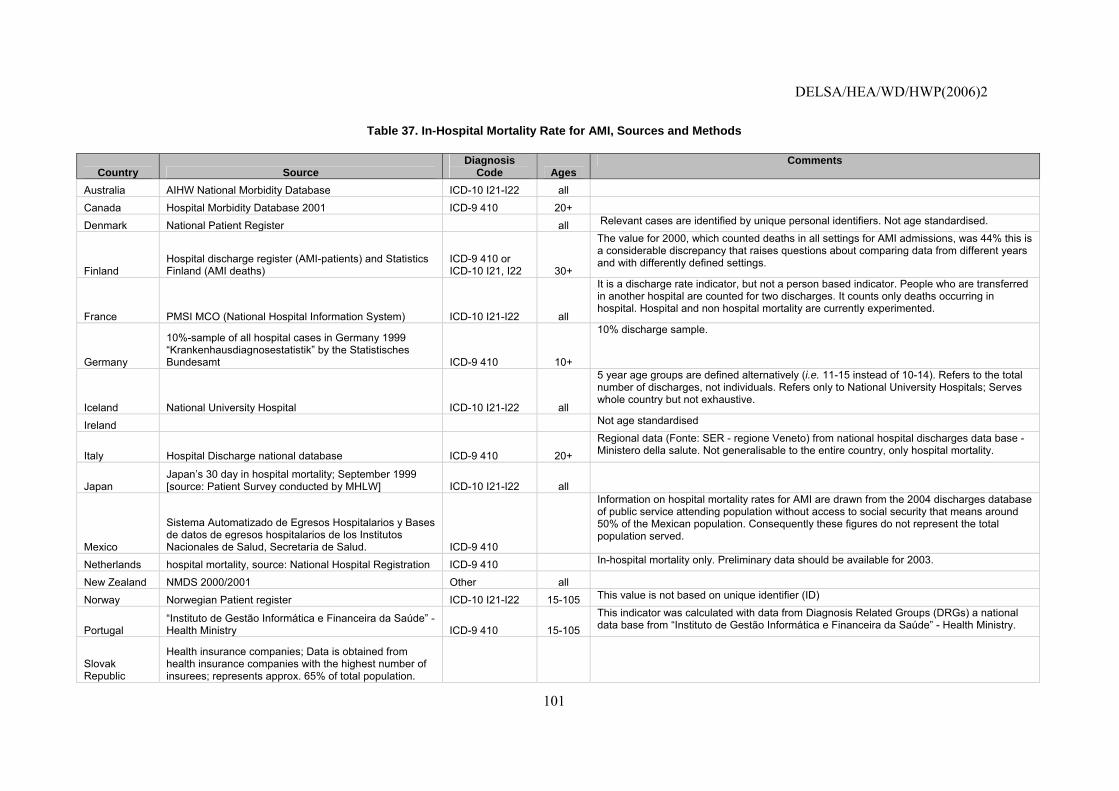
DELSA/HEA/WD/HWP(2006)2
101
Table 37. In-Hospital Mortality Rate for AMI, Sources and Methods
Country Source Diagnosis
Code Ages Comments
Australia AIHW National Morbidity Database ICD-10 I21-I22 all
Canada Hospital Morbidity Database 2001 ICD-9 410 20+
Denmark National Patient Register all Relevant cases are identified by unique personal identifiers. Not age standardised.
Finland Hospital discharge register (AMI-patients) and Statistics Finland (AMI deaths)
ICD-9 410 or ICD-10 I21, I22 30+
The value for 2000, which counted deaths in all settings for AMI admissions, was 44% this is a considerable discrepancy that raises questions about comparing data from different years and with differently defined settings.
France PMSI MCO (National Hospital Information System) ICD-10 I21-I22 all
It is a discharge rate indicator, but not a person based indicator. People who are transferred in another hospital are counted for two discharges. It counts only deaths occurring in hospital. Hospital and non hospital mortality are currently experimented.
Germany
10%-sample of all hospital cases in Germany 1999 “Krankenhausdiagnosestatistik” by the Statistisches Bundesamt ICD-9 410 10+
10% discharge sample.
Iceland National University Hospital ICD-10 I21-I22 all
5 year age groups are defined alternatively (i.e. 11-15 instead of 10-14). Refers to the total number of discharges, not individuals. Refers only to National University Hospitals; Serves whole country but not exhaustive.
Ireland Not age standardised
Italy Hospital Discharge national database ICD-9 410 20+
Regional data (Fonte: SER - regione Veneto) from national hospital discharges data base - Ministero della salute. Not generalisable to the entire country, only hospital mortality.
Japan Japan’s 30 day in hospital mortality; September 1999 [source: Patient Survey conducted by MHLW] ICD-10 I21-I22 all
Mexico
Sistema Automatizado de Egresos Hospitalarios y Bases de datos de egresos hospitalarios de los Institutos Nacionales de Salud, Secretaría de Salud. ICD-9 410
Information on hospital mortality rates for AMI are drawn from the 2004 discharges database of public service attending population without access to social security that means around 50% of the Mexican population. Consequently these figures do not represent the total population served.
Netherlands hospital mortality, source: National Hospital Registration ICD-9 410 In-hospital mortality only. Preliminary data should be available for 2003.
New Zealand NMDS 2000/2001 Other all
Norway Norwegian Patient register ICD-10 I21-I22 15-105 This value is not based on unique identifier (ID)
Portugal “Instituto de Gestão Informática e Financeira da Saúde” - Health Ministry ICD-9 410 15-105
This indicator was calculated with data from Diagnosis Related Groups (DRGs) a national data base from “Instituto de Gestão Informática e Financeira da Saúde” - Health Ministry.
Slovak Republic
Health insurance companies; Data is obtained from health insurance companies with the highest number of insurees; represents approx. 65% of total population.
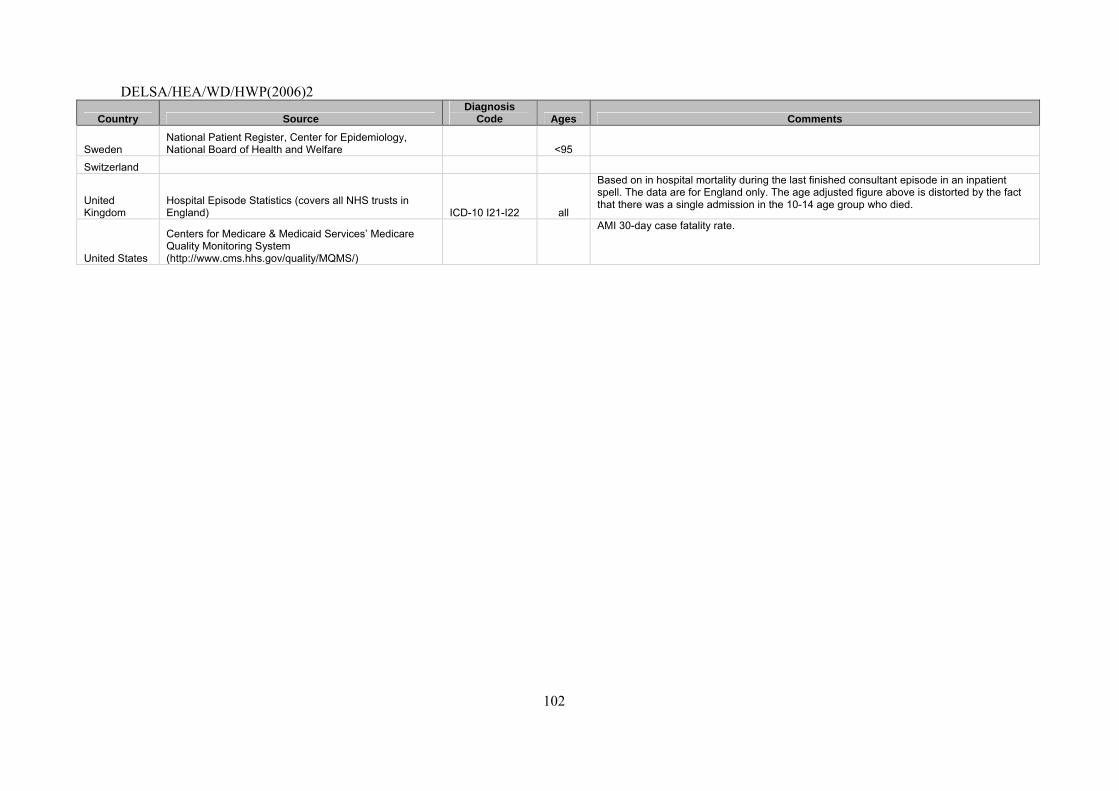
DELSA/HEA/WD/HWP(2006)2
102
Country Source Diagnosis
Code Ages Comments
Sweden National Patient Register, Center for Epidemiology, National Board of Health and Welfare <95
Switzerland
United Kingdom
Hospital Episode Statistics (covers all NHS trusts in England) ICD-10 I21-I22 all
Based on in hospital mortality during the last finished consultant episode in an inpatient spell. The data are for England only. The age adjusted figure above is distorted by the fact that there was a single admission in the 10-14 age group who died.
United States
Centers for Medicare & Medicaid Services’ Medicare Quality Monitoring System (http://www.cms.hhs.gov/quality/MQMS/)
AMI 30-day case fatality rate.
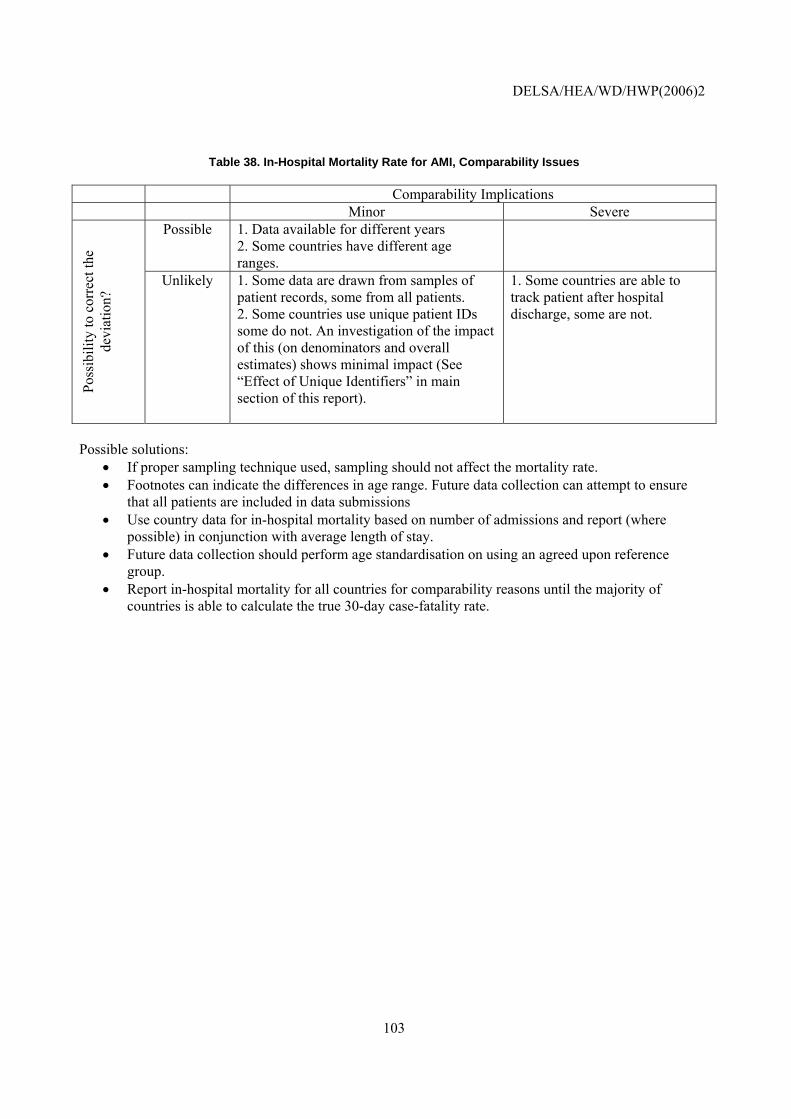
DELSA/HEA/WD/HWP(2006)2
103
Table 38. In-Hospital Mortality Rate for AMI, Comparability Issues
Comparability Implications Minor Severe
Possible 1. Data available for different years 2. Some countries have different age ranges.
Poss
ibili
ty to
cor
rect
the
devi
atio
n? Unlikely 1. Some data are drawn from samples of
patient records, some from all patients. 2. Some countries use unique patient IDs some do not. An investigation of the impact of this (on denominators and overall estimates) shows minimal impact (See “Effect of Unique Identifiers” in main section of this report).
1. Some countries are able to track patient after hospital discharge, some are not.
Possible solutions:
• If proper sampling technique used, sampling should not affect the mortality rate. • Footnotes can indicate the differences in age range. Future data collection can attempt to ensure
that all patients are included in data submissions • Use country data for in-hospital mortality based on number of admissions and report (where
possible) in conjunction with average length of stay. • Future data collection should perform age standardisation on using an agreed upon reference
group. • Report in-hospital mortality for all countries for comparability reasons until the majority of
countries is able to calculate the true 30-day case-fatality rate.
DELSA/HEA/WD/HWP(2006)2
104
10. Stroke 30-Day Case-Fatality Rate/In-Hospital Mortality Rate
Operational Definition
Numerator: Number of deaths in the hospital that occurred within 30 days of hospital admission with primary diagnosis of a) hemorrhagic stroke (ICD-9 430-432 or ICD-10 I61-I62) and b) ischemic stroke (ICD-9 433, 434, and 436 or ICD-10 I63-I64). Denominator: Number of people hospitalised with primary diagnosis of stroke
Importance
173. Mortality: Cerebrovascular disease was responsible for an estimated 114 deaths per 100 000 people in WHO Euro A countries in 2000. This represents 11.5% of all deaths.
174. Prevalence: The prevalence of cerebrovascular disease was 13.7 per 1 000 people in WHO Euro A countries in 2000.
175. Cost: Nervous system diseases are the 8th largest attributable contributor to cost of illness in Canada (3.4% of direct and indirect costs).
Scientific Soundness
176. Face validity: Hospital care is expected to improve stroke survival although the severity of the stroke is a more important determinant and many deaths occur outside of the hospital (AHRQ). Stroke case-fatality rates case-fatality rates have been used for hospital benchmarking by the US Agency for Healthcare Research and Quality (AHRQ)92 and a variety of hospital associations and quality monitoring groups in the US, and for international comparisons by the OECD Ageing-Related Diseases Project.93
177. Content validity: A review by AHRQ concluded that this indicator has sufficient content validity for use at the hospital level.94 The review found that there was evidence showing that specific processes of care improve outcomes, including mortality, at the patient level, but no evidence at the hospital level. Some evidence, mainly from European countries, has linked the existence of dedicated stroke units in hospitals with improved outcomes.95 No validation studies have been performed at the international level.
178. Reliability: As for AMI mortality rates, this indicator may be affected by differences in coding practices among hospitals and countries; no evidence on the reliability of stroke coding exists internationally. Differences in the average severity of the acute event and the underlying chronic disease in different countries may also influence rates. In order to account for some of the differential risk, ischemic
92. Davies SM, Geppert J, McClellan M, McDonald KM, Romano PS, Shojania KJ. “Refinement of the HCUP quality
indicators.” AHRQ publication 01-0035, May 2001.
93. Organisation for Economic Cooperation and Development. A Disease-Based Comparison of Health Systems: What is Best at What Cost? (Paris: OECD, 2003).
94. Davies SM, Geppert J, McClellan M, McDonald KM, Romano PS, Shojania KJ. “Refinement of the HCUP quality indicators.” AHRQ publication 01-0035, May 2001.
95. How do stroke units improve patient outcomes? A collaborative systematic review of the randomized trials. Stroke Unit Trialists Collaboration. Stroke 1997;28(11):2139-44.; Langhorne P, Williams BO, Gilchrist W, et al. Do stroke units save lives? Lancet 1993;342(8868):395-8.
DELSA/HEA/WD/HWP(2006)2
105
stroke and hemorrhagic stroke were considered separately. While their clinical presentation is similar, ischemic and hemorrhagic stroke have different pathophysiologic causes. In ischemic stroke, the blood supply to a part of the brain is interrupted, leading to a necrosis of the affected part. In hemorrhagic stroke, rupture of a blood vessel causes bleeding into the brain, usually causing more wide-spread damage to the brain. Similar to AMI mortality rates, a threat to reliably measuring stroke case-fatality is the reliance on hospital administrative data. Differences in admission practices would affect the denominator of the case-fatality rate.
179. As for the AMI mortality indicator, the question arises whether in-hospital fatality rates may be used as a reliable proxy for 30-day case fatality rates. Data presented in a previous version of this report from two countries with both in-hospital mortality and 30-day case-fatality rates after ischemic stroke show that most deaths occur in the hospital. The average 30-day case-fatality rate was 18.7% in the hospital and 2.1% after discharge.96 The two countries had similar out-of-hospital case-fatality rates (2.2 and 3.6%). These results are similar to the analysis carried out as part of this project’s sensitivity analysis (see “Effect of Unique Identifiers”.) These results suggest that the in-hospital mortality rate captures the majority of deaths following stroke, suggesting that it can be used as a proxy for the 30-day case-fatality rate.
Feasibility
180. Data availability: Stroke in-hospital mortality rates are available for 17 countries and are hemorrhagic and ischemic stroke are both presented here as part of this “one” indicator (Table 39). Countries provided data for years ranging from 1999 to 2004. Four countries had excluded some age groups. Some countries use ICD-9 and some use ICD 10 code. One country was unable to separate hemorrhagic and ischemic stroke mortality rates.
181. Comparability Issues: Detailed documentation is provided in Table 40 and an assessment in Table 41. Minor challenges are the differences in the years for which countries provided the data, the covered age range and the sampling procedure. Major issues arise in the identification of cases for the numerator and the denominator. For the denominator, some countries use ICD-10 and some ICD-9 diagnoses, and the set of ICD-9 diagnoses differed in that some countries include 433 and some did not. ICD-10 allows for a clear distinction between occlusion of cerebral and pre-cerebral arteries with (I63 and I64) and without (I65) damage to the brain and only the former group should be included in the denominator, while ICD-9 differentiates on the basis of a fifth digit coding modification (e.g., 433.01 vs. 433.11), which might be unreliably recorded.
182. Another issue is that some countries have a unique patient identifier that allows identifying hospital readmissions. Those countries will be able to accurately determining the denominator based on unique cases, whereas countries without such an identifier base the denominator on hospital episodes. This issue is investigated and reported in detail in the main section of this report.
183. For the numerator, some countries are able to track patients after hospital discharge and are thus able to provide a true 30-day case fatality rate, whereas other can only provide the in-hospital mortality rate, which will be lower. As we have shown, in-hospital deaths represent about 80% of all deaths. This questionnaire did not specify that age standardisation should be performed. In future data collection, age standardisation to a common reference population should be performed to control for the variation in age across countries.
96. The three countries are Sweden, Canada (Ontario), and the United Kingdom (Oxford). The data are from the OECD
Ageing-related Diseases Project (forthcoming).
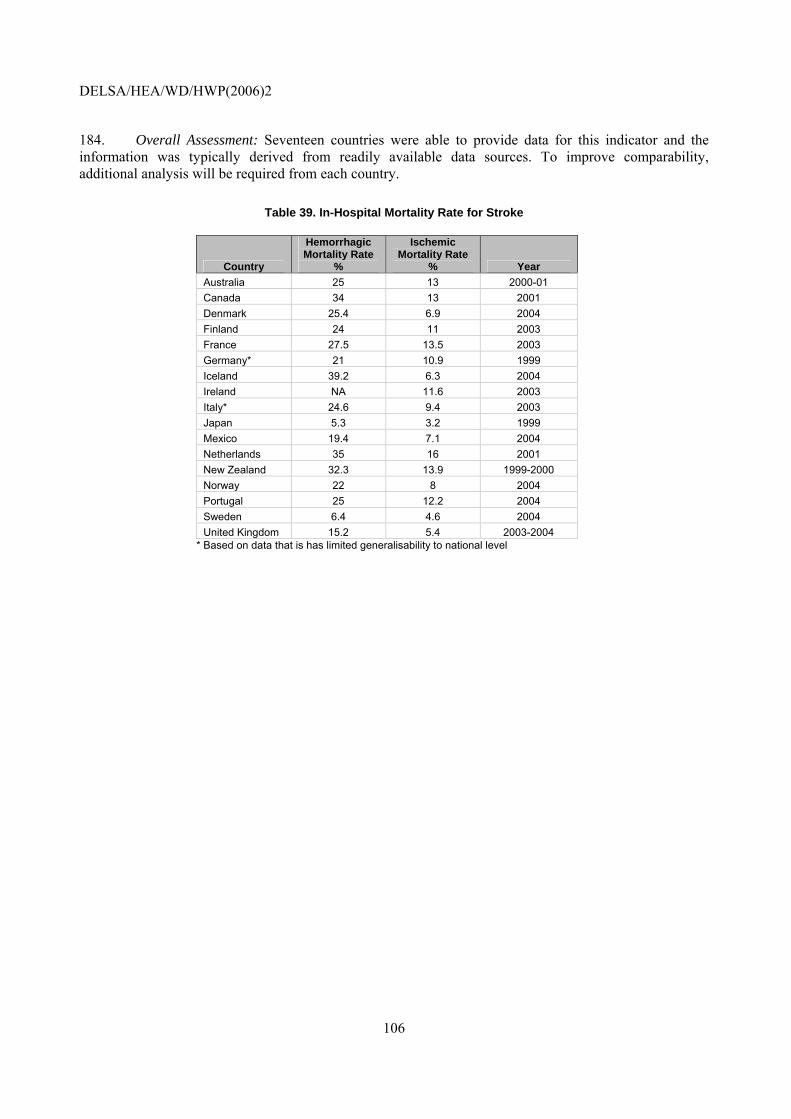
DELSA/HEA/WD/HWP(2006)2
106
184. Overall Assessment: Seventeen countries were able to provide data for this indicator and the information was typically derived from readily available data sources. To improve comparability, additional analysis will be required from each country.
Table 39. In-Hospital Mortality Rate for Stroke
Country
Hemorrhagic Mortality Rate
%
Ischemic Mortality Rate
% Year Australia 25 13 2000-01 Canada 34 13 2001 Denmark 25.4 6.9 2004 Finland 24 11 2003 France 27.5 13.5 2003 Germany* 21 10.9 1999 Iceland 39.2 6.3 2004 Ireland NA 11.6 2003 Italy* 24.6 9.4 2003 Japan 5.3 3.2 1999 Mexico 19.4 7.1 2004 Netherlands 35 16 2001 New Zealand 32.3 13.9 1999-2000 Norway 22 8 2004 Portugal 25 12.2 2004 Sweden 6.4 4.6 2004 United Kingdom 15.2 5.4 2003-2004
* Based on data that is has limited generalisability to national level
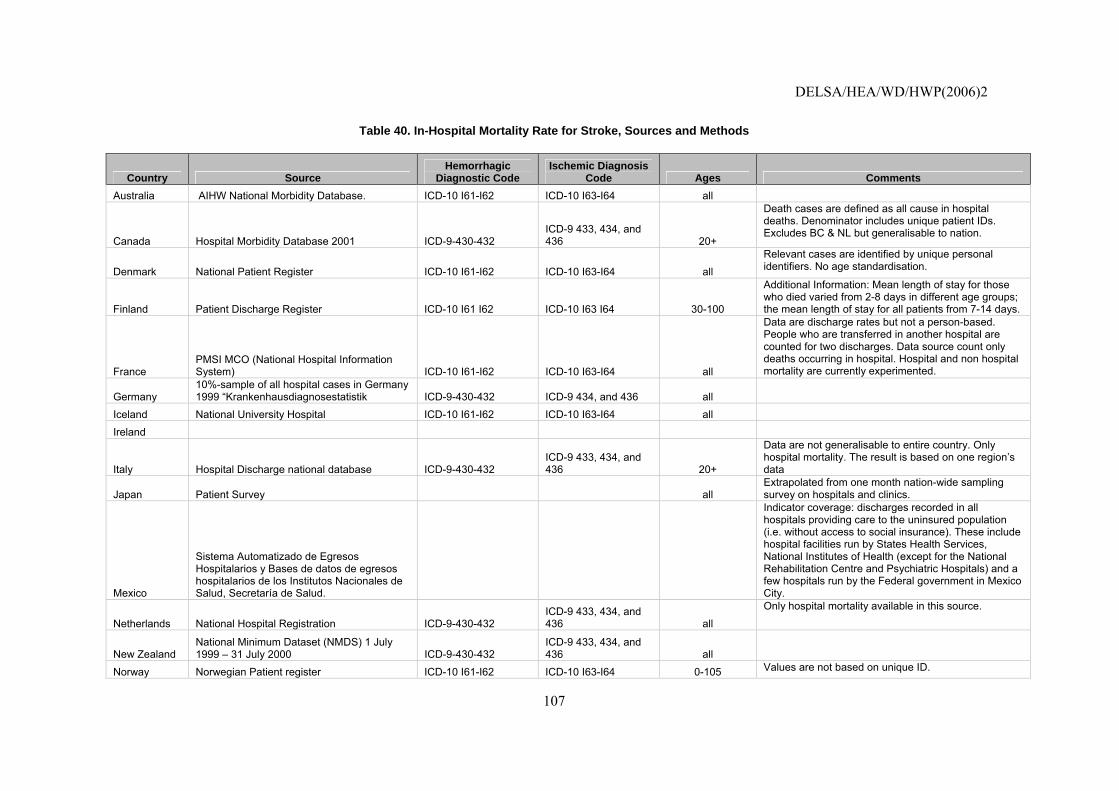
DELSA/HEA/WD/HWP(2006)2
107
Table 40. In-Hospital Mortality Rate for Stroke, Sources and Methods
Country Source Hemorrhagic
Diagnostic Code Ischemic Diagnosis
Code Ages Comments Australia AIHW National Morbidity Database. ICD-10 I61-I62 ICD-10 I63-I64 all
Canada Hospital Morbidity Database 2001 ICD-9-430-432 ICD-9 433, 434, and 436 20+
Death cases are defined as all cause in hospital deaths. Denominator includes unique patient IDs. Excludes BC & NL but generalisable to nation.
Denmark National Patient Register ICD-10 I61-I62 ICD-10 I63-I64 all
Relevant cases are identified by unique personal identifiers. No age standardisation.
Finland Patient Discharge Register ICD-10 I61 I62 ICD-10 I63 I64 30-100
Additional Information: Mean length of stay for those who died varied from 2-8 days in different age groups; the mean length of stay for all patients from 7-14 days.
France PMSI MCO (National Hospital Information System) ICD-10 I61-I62 ICD-10 I63-I64 all
Data are discharge rates but not a person-based. People who are transferred in another hospital are counted for two discharges. Data source count only deaths occurring in hospital. Hospital and non hospital mortality are currently experimented.
Germany 10%-sample of all hospital cases in Germany 1999 “Krankenhausdiagnosestatistik ICD-9-430-432 ICD-9 434, and 436 all
Iceland National University Hospital ICD-10 I61-I62 ICD-10 I63-I64 all
Ireland
Italy Hospital Discharge national database ICD-9-430-432 ICD-9 433, 434, and 436 20+
Data are not generalisable to entire country. Only hospital mortality. The result is based on one region’s data
Japan Patient Survey all Extrapolated from one month nation-wide sampling survey on hospitals and clinics.
Mexico
Sistema Automatizado de Egresos Hospitalarios y Bases de datos de egresos hospitalarios de los Institutos Nacionales de Salud, Secretaría de Salud.
Indicator coverage: discharges recorded in all hospitals providing care to the uninsured population (i.e. without access to social insurance). These include hospital facilities run by States Health Services, National Institutes of Health (except for the National Rehabilitation Centre and Psychiatric Hospitals) and a few hospitals run by the Federal government in Mexico City.
Netherlands National Hospital Registration ICD-9-430-432 ICD-9 433, 434, and 436 all
Only hospital mortality available in this source.
New Zealand National Minimum Dataset (NMDS) 1 July 1999 – 31 July 2000 ICD-9-430-432
ICD-9 433, 434, and 436 all
Norway Norwegian Patient register ICD-10 I61-I62 ICD-10 I63-I64 0-105 Values are not based on unique ID.
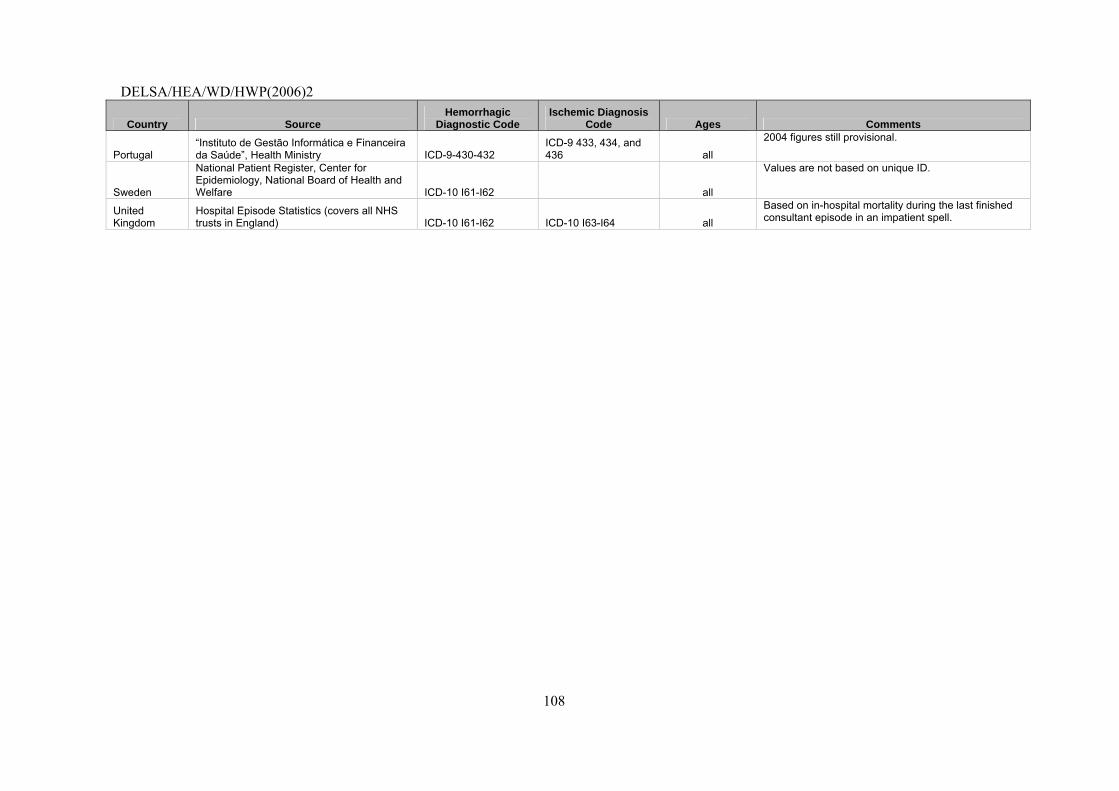
DELSA/HEA/WD/HWP(2006)2
108
Country Source Hemorrhagic
Diagnostic Code Ischemic Diagnosis
Code Ages Comments
Portugal “Instituto de Gestão Informática e Financeira da Saúde”, Health Ministry ICD-9-430-432
ICD-9 433, 434, and 436 all
2004 figures still provisional.
Sweden
National Patient Register, Center for Epidemiology, National Board of Health and Welfare ICD-10 I61-I62 all
Values are not based on unique ID.
United Kingdom
Hospital Episode Statistics (covers all NHS trusts in England) ICD-10 I61-I62 ICD-10 I63-I64 all
Based on in-hospital mortality during the last finished consultant episode in an impatient spell.

DELSA/HEA/WD/HWP(2006)2
109
Table 41. In-Hospital Mortality Rate for Stoke, Comparability Issues
Comparability Implications Minor Severe
Possible 1. Data available for different years 2. Some countries have different age ranges.
1. Different ICD-9 codes are used for the denominator 2. Data are not yet age standardised.
Poss
ibili
ty to
cor
rect
the
devi
atio
n?
Unlikely 1. Some data drawn from samples of patient records, some from all patients. 2. ICD-9 and ICD-10 definitions for the denominator are not fully equivalent 3. Some countries use unique patient IDs some do not. An investigation of the impact of this (on denominators and overall estimates) shows minimal impact (See “Effect of Unique Identifiers” in main section of this report).
1. Some countries are able to track patient after hospital discharge, some are not.
Possible solutions:
• If proper sampling technique used, sampling should not affect the mortality rate. • Footnotes can indicate the differences in the age range. Future data collection can attempt to ensure
that all patients are included in data submissions • Footnotes can indicate whether ICD 9 or ICD 10 codes were used, and the same ICD-9 definition
should be used for all countries. • Use country data for in-hospital mortality based on number of admissions and report (where
possible) in conjunction with average length of stay. • Report in-hospital mortality for all countries for comparability reasons until the majority of
countries is able to calculate the true 30-day case-fatality rate. • Future data collection should perform age standardisation.
DELSA/HEA/WD/HWP(2006)2
110
11. Waiting Times for Surgery after Hip Fracture, Age 65+
Operational Definition
Numerator: The number of patients with surgery initiated within 48 hours
Denominator: The number of patients age 65 and older admitted to the hospital with a diagnosis of upper femur fracture (ICD-10 S72.0, S72.1, S72.2 or ICD-9 820)
Importance
185. Prevalence: In industrialised countries, the lifetime risk of hip fracture is 18% in women and 6% in men.97 One in five people die within one year of a hip fracture, and one in four require long-term care.98
186. Cost: Hip fractures cause an economic and quality of life burden on elderly men and women. One Belgian study, using a matched case-control design, estimated the hospitalisation costs for hip fractures at 9 534 USD and the excess costs of the hip fracture during the year following hospitalisation to be 7 300 USD.99
Scientific Soundness
187. Face validity: Rapid surgery after a hip fracture can reduce the incidence of life-threatening complications such as pulmonary embolism.100 The waiting time for surgery after hip fracture is used as a national quality indicator in Norway.
188. Content validity: A review of the evidence from clinical trials of surgery after hip fracture concluded that surgery should be performed within 48 hours, preferably within 24 hours.101 Zuckerman et al. found that delays in surgery after hip fracture of more than two days approximately doubled the risk of death within one year, controlling for age, sex, and pre-existing medical conditions.102 Laberge et al. also found increasing risk of death with the length of operative delay.103
189. Reliability: No known studies have examined the reliability of this indicator.
97. Gillespie WJ, “Hip fracture.” British Medical Journal 2000, 321: 968-75.
98. Gillespie WJ, “Hip fracture.” British Medical Journal 2000, 321: 968-75.
99 Haentjens P, Autier P, Barette M, Boonen S; Belgian Hip Fracture Study Group. The economic cost of hip fractures among elderly women. A one-year, prospective, observational cohort study with matched-pair analysis. Belgian Hip Fracture Study Group. J Bone Joint Surg Am. 2001 Apr;83-A(4):493-500.
100. Laberge A, Bernard PM, Lamarche PA. “Relation entre le délai pré-opératoire pour une fracture de hanche, les complications post-opératoires et le risque de décès." Rev. Epidém. Et Santé Publ. 1997. 45; 5-12.
101. Parker MJ. "Managing an elderly patient with a fractured femur.” British Medical Journal 2000, 320: 102-3.
102. Zuckerman JD, Skovron ML, Koval KJ, Anaronoff G, Frankel VH. “Postoperative complications and mortality associated with operative delay in older patients who have a fracture of the hip.” The Journal of Bone and Joint Surgery. 1995. 77(10): 1551-1556.
103. Laberge A, Bernard PM, Lamarche PA. “Relation entre le délai préopératoir pour une fracture de hanche, les complications post-opératoires et le risqué de décès. ” Rev. Epidém. Et Santé Publ. 1997. 45; 5-12.
DELSA/HEA/WD/HWP(2006)2
111
Feasibility
190. Data availability: Hip fracture waiting times are available for eleven countries (Table 42). Several countries have problems with the time specifications for the numerator. Data reported for years between 1999 and 2004. There is no problem with diagnosis, or age range comparability.
191. Comparability issues: Detailed documentation is provided in Table 42 and an assessment in Table 43. Consistency in the indicator numerator (whether countries can measure surgery initiated within 48 hours, or use 2 or 3 hospital days/nights as a proxy for 48 hours) is a minor concern. Definition will need to be more specifically defined to determine whether re-operations on a femur fracture (elective surgery) should be included in this indicator. Some countries use ICD 9 codes, some ICD 10 codes. This is not a threat to comparability, because there is a one-to-one match between the two sets of codes. Procedure codes for vary between countries, which would be a problem only if the national codes did not map into the common definition.
192. Overall Assessment: Eleven countries attempted to provide data for this indicator. Data would be available in medical records, but would require a dedicated record review, which is not routinely done in most national data collection systems. A more widespread adoption of electronic medical records would improve data availability.

DELSA/HEA/WD/HWP(2006)2
112
Table 42. In-Hospital Waiting Times for Surgery after Hip Fracture, Age 65+
Country Year
Femur Fractures operated within 48
hours, age 65+,
% Source Diagnosis Code Comments
Canada 2002 79.5 Discharge Abstract Database
0.7947 is the crude rate; age standardised = 0.7959. CIHI DAD has operation dates but no hours. Therefore, rate is for 3 days. Excludes Quebec and some hospitals in Manitoba. This data used the most responsible diagnosis field only, rather than all re-admission diagnosis fields.
Denmark 2004 68.1 National Patient Register ICD-10 S72.0, S72.1, S72.2
Finland 2003 86 National Patient Registry ICD-10 S72.0, S72.1, S72.2 or ICD-9 820
Validities of person’s age, admission day and main diagnosis in the register are very good and all inpatient hospital visits are included in the register.
Iceland 1999-2003 73.1 Directorate of Health in Iceland
ICD-10 S72.0, S72.1, S72.2 or ICD-9 820
No missing cases. Indicator tracks surgery within two calendar days e.g. admission on January 1st, surgery before January 3rd.
Italy 2003 32.7 National Hospital Discharges data base – Ministero della salute ICD-10 S72.0, S72.1, S72.2
Numerator: the number of patients with surgery initiated within 48 hours. Denominator: the number of patients aged 65 and older admitted to hospital with diagnosis of upper femur fracture.
Mexico 2003 65.1 Hospital de Traumatología de Lomas Verdes, IMSS
Data reported includes patients operated within 120 hrs.
Netherlands 2001 80.4 LMR ICD-10 S72.0, S72.1, S72.2 or ICD-9 820
Norway 2004 93 Patient Administrative Data ICD-10 S72.0, S72.1, S72.2
Portugal 2004 50.1 “Instituto de Gestão Informática e Financeira da Saúde”, Health Ministry ICD-9 820
This indicator was calculated with data from Diagnosis Related Groups (DRGs) a national data base from “Instituto de Gestão Informática e Financeira da Saúde” - Health Ministry.
Sweden 2003 93.5 National quality register for hip fractures
ICD-10 S72.0, S72.1, S72.2 or ICD-9 820
National data not available, information from some regions included in a special project under The National Hip Fracture Register. The register covers around 80% of all surgeries in Sweden. The register does not measure the exact time of arrival at the hospital only the date.
United Kingdom
2002-2003 61.5
Hospital Episode Statistics (covers all NHS trusts in England) ICD-10 S72.0, S72.1 S72.2
Based on admission (epiorder = 1) finished (Epistat = 3) consultant episodes. Numerator is calculated as the number of primary operations (oper_1) carried out on date op_dte_1 within 48 hours of admission date (admidate). We only include those who have either HRG chapter of H or primary operation OPCS-4 chapter of W. The data are for England only

DELSA/HEA/WD/HWP(2006)2
113
Table 43. In-Hospital Waiting Times for Surgery after Hip Fracture, Comparability Issues
Comparability Implications Minor Severe
Possible 1. Some countries using 48 hours, and some using 2 or 3 hospital days/nights for numerator.
Poss
ibili
ty to
co
rrec
t the
de
viat
ion?
Unlikely 1. Data available for different years 2. Procedure codes vary between countries
1. One country could only provide information on the percentage of surgeries initiated within 120 hours.
Possible solutions:
• OECD can work with countries to investigate whether differences in procedure codes introduce any problems to data comparability.
• Footnotes can indicate the year and deviations in the numerator. • Drop or list separately countries that cannot provide numerator within 48 hours or 2/3 hospital
days/nights.
DELSA/HEA/WD/HWP(2006)2
114
12. Annual HbA1c Test for Patients with Diabetes
NOTE that this indicator was not recommended for inclusion in the initial HCQI indicator set. It is included in this paper to illustrate current data concerns with the indicator and their possible future
solutions
Operational Definition
Numerator: Number of patients with at least one test of HbA1c levels in the reporting year
Denominator: People age 18-75 with diabetes mellitus type I or II, defined as: at least one physician visit with a diagnosis of diabetes or patient dispensed insulin and/or hypoglycaemic agent, excluding those with gestational diabetes and those not seen for continuing care.
Importance
193. Mortality: Diabetes mellitus was responsible for an estimated 21 deaths per 100 000 people in WHO Euro A countries in 2000. This represents 2.1% of all deaths.
194. Prevalence: Diabetes mellitus affected an estimated 3 of every 100 people living in WHO Euro A countries in 2000. Diabetes mellitus constitutes a major public health burden in the industrialised countries, affecting, for example in the US an estimated 15.7 million people, including an estimated 5.4 million people not yet diagnosed. In addition to being the seventh leading cause of death in the US,104 diabetes mellitus is also the leading cause of blindness in people ages 20-74, the leading cause of end-stage renal disease (ESRD), the most frequent cause of non-traumatic lower limb amputations, and a major risk factor for heart disease and stroke. The prevalence of diabetes in the US is projected to increase from the present rate of 5.9% to 8.9% by 2025.105
195. Cost: Endocrine diseases, of which diabetes is the most common, are the 12th attributable contributor to cost of illness in Canada (2.2% of direct and indirect costs). In the United States, the costs of diabetes totalled $132 billion in 2002, including about $92 billion in direct medical expenditures and about $40 billion in lost productivity and premature death.106
Scientific Soundness
196. Face validity: There is now strong evidence that reducing blood glucose to normal levels can reduce the risk of complications associated with both Type 1107 and Type 2108 diabetes. Because of the severity of the complications associated with chronic diabetes, because diabetes does not cause any
104. American Diabetes Association “Facts and Figures”, http://www.diabetes.org; NIDDK “Diabetes Overview”,
http://www.niddk.nih.gov/health/diabetes/pubs/dmover/dmover.htm.
105. American Diabetes Association “Facts and Figures”, http://www.diabetes.org; NIDDK “Diabetes Overview”, http://www.niddk.nih.gov/health/diabetes/pubs/dmover/dmover.htm.
106 Hogan P, Dall T, Nikolov P. Economic costs of diabetes in the US in 2002. Diabetes Care 2003;26(3):917-32.
107. American Diabetes Association Position Statement: Implications of the Diabetes Control and Complications Trial, Diabetes Care 24(1) supplement, ADA Clinical Practice Recommendations 2001, http://www.diabetes.org/clinicalrecommendations/Supplement101/S25.htm.
108. American Diabetes Association Position Statement: Implications of the United Kingdom Prospective Diabetes Study, Diabetes Care 24(1) supplement, ADA Clinical Practice Recommendations 2001, http://www.diabetes.org/clinicalrecommendations/Supplement101/S28.htm.
DELSA/HEA/WD/HWP(2006)2
115
symptoms in its initial stages and because of the long period between the commencement of sustained hyperglycaemia and observable complications, diabetes is a prime candidate for aggressive, outpatient based, primary preventive care. Blood glucose testing using HbA1c is recommended as a quality indicator by the American Medical Association and is used by the US Veteran’s Administration. The American Diabetes Association and many other national scientific societies have issued guidelines for the management of diabetes that reflect the implications of this research.109 These guidelines have been disseminated widely, and adapted by many health care provider organisations to reflect local practice. Yet as in other areas of clinical practice, numerous studies have documented that the level of clinician adherence to diabetes practice guidelines’ recommendations for routine monitoring and screening remains variable and often quite low.110
197. Content validity: Reviews of the evidence from clinical trials of diabetes management, including those conducted by the Cochrane Collaboration, the American Diabetes Association, the New Zealand Guidelines Group, and others, have all concluded that good glycemic control reduces the occurrence of retinopathy, nephropathy, and neuropathy, and improves functional status and well-being among people with Type 1 and Type 2 diabetes.111
198. Reliability: Data on the frequency of HbA1c testing is usually derived from studies using medical chart review or prospective data collection. International comparison of these studies is therefore affected by all differences in study design.
Feasibility
199. Data availability: HbA1c test rates are available for eight countries (Table 44). The HbA1c screening data supplied were for 2000-2005. Five countries provided data that was a slight deviation from the OECD age range requested. Countries provided data based on samples from primary care clinics, and from patient surveys. Countries that reported from general surveys also reported a problem that many diabetics are not familiar with the term of HbAc1.
200. Comparability issues: Detailed documentation is provided in Table 44 and an assessment in Table 45. There should be concern over comparing the results of patient surveys, to a review of patient records. A major challenge to this indicator relates to fielding surveys that who might be able to accurately collect information on HbAc1 testing. Because diabetics are not always familiar with the term HbAc1, self-reported data may not be reliable, resulting in one country not reporting their data. Data derived as part of research project may not be generalisable to a country, because care patterns and patient characteristics may be systematically different from the general population.
109. American Diabetes Association Position Statement: Standards of Medical Care for Patients with Diabetes Mellitus,
Diabetes Care 24(1) supplement, ADA Clinical Practice Recommendations 2001, http://www.diabetes.org/clinicalrecommendations/Supplement101/S33.htm.
110. See, for example, Streja DA, Rabkin SW, “Factors Associated with Implementation of Preventive Care Measures in Patients with Diabetes Mellitus”, Arch Intern Med 159:294-302, 8 Feb. 1999; and Lawler FH, Viviani N, “Patient and Physician Perspectives Regarding Treatment of Diabetes: Compliance with Practice Guidelines”, J Fam Pract 44(4):369-373, Apr 1997.
111. Renders CM, Valk GD, Griffin S, Wagner EH, Eijk JThM van, Assendelft WJJ. “Interventions to improve the management of diabetes mellitus in primary care, outpatient and community settings (Cochrane Review). In: The Cochrane Library, Issue 2, 2002. Oxford: Update Software; New Zealand Guidelines Group, “Primary care guidelines for the management of core aspects of diabetes,” http://www.nzgg.org.nz/library/gl_complete/diabetes/index.cfm#contents, accessed May 2003; Nathan DM, “Initial management of glycemia in type 2 diabetes mellitus,” New England Journal of Medicine 2002, 347(17): 1342-49.

DELSA/HEA/WD/HWP(2006)2
116
201. Overall assessment: Only eight countries could provide data on this indicator. It also appears that some of the data comes from research projects and may not be regularly collected. However, during the course of the project, data availability improved for this indicator and it may warrant examination in future HCQI efforts.
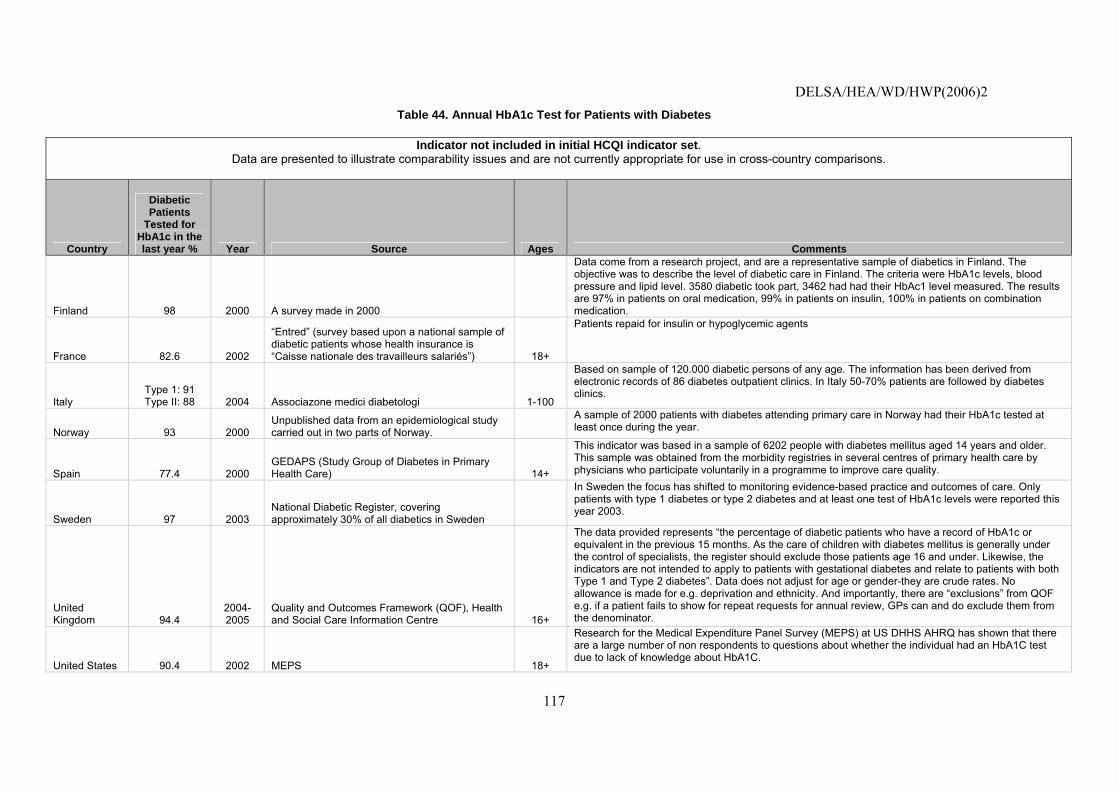
DELSA/HEA/WD/HWP(2006)2
117
Table 44. Annual HbA1c Test for Patients with Diabetes
Indicator not included in initial HCQI indicator set. Data are presented to illustrate comparability issues and are not currently appropriate for use in cross-country comparisons.
Country
Diabetic Patients
Tested for HbA1c in the last year % Year Source Ages Comments
Finland 98 2000 A survey made in 2000
Data come from a research project, and are a representative sample of diabetics in Finland. The objective was to describe the level of diabetic care in Finland. The criteria were HbA1c levels, blood pressure and lipid level. 3580 diabetic took part, 3462 had had their HbAc1 level measured. The results are 97% in patients on oral medication, 99% in patients on insulin, 100% in patients on combination medication.
France 82.6 2002
“Entred” (survey based upon a national sample of diabetic patients whose health insurance is “Caisse nationale des travailleurs salariés”) 18+
Patients repaid for insulin or hypoglycemic agents
Italy Type 1: 91 Type II: 88 2004 Associazone medici diabetologi 1-100
Based on sample of 120.000 diabetic persons of any age. The information has been derived from electronic records of 86 diabetes outpatient clinics. In Italy 50-70% patients are followed by diabetes clinics.
Norway 93 2000 Unpublished data from an epidemiological study carried out in two parts of Norway.
A sample of 2000 patients with diabetes attending primary care in Norway had their HbA1c tested at least once during the year.
Spain 77.4 2000 GEDAPS (Study Group of Diabetes in Primary Health Care) 14+
This indicator was based in a sample of 6202 people with diabetes mellitus aged 14 years and older. This sample was obtained from the morbidity registries in several centres of primary health care by physicians who participate voluntarily in a programme to improve care quality.
Sweden 97 2003 National Diabetic Register, covering approximately 30% of all diabetics in Sweden
In Sweden the focus has shifted to monitoring evidence-based practice and outcomes of care. Only patients with type 1 diabetes or type 2 diabetes and at least one test of HbA1c levels were reported this year 2003.
United Kingdom 94.4
2004-2005
Quality and Outcomes Framework (QOF), Health and Social Care Information Centre 16+
The data provided represents “the percentage of diabetic patients who have a record of HbA1c or equivalent in the previous 15 months. As the care of children with diabetes mellitus is generally under the control of specialists, the register should exclude those patients age 16 and under. Likewise, the indicators are not intended to apply to patients with gestational diabetes and relate to patients with both Type 1 and Type 2 diabetes”. Data does not adjust for age or gender-they are crude rates. No allowance is made for e.g. deprivation and ethnicity. And importantly, there are “exclusions” from QOF e.g. if a patient fails to show for repeat requests for annual review, GPs can and do exclude them from the denominator.
United States 90.4 2002 MEPS 18+
Research for the Medical Expenditure Panel Survey (MEPS) at US DHHS AHRQ has shown that there are a large number of non respondents to questions about whether the individual had an HbA1C test due to lack of knowledge about HbA1C.
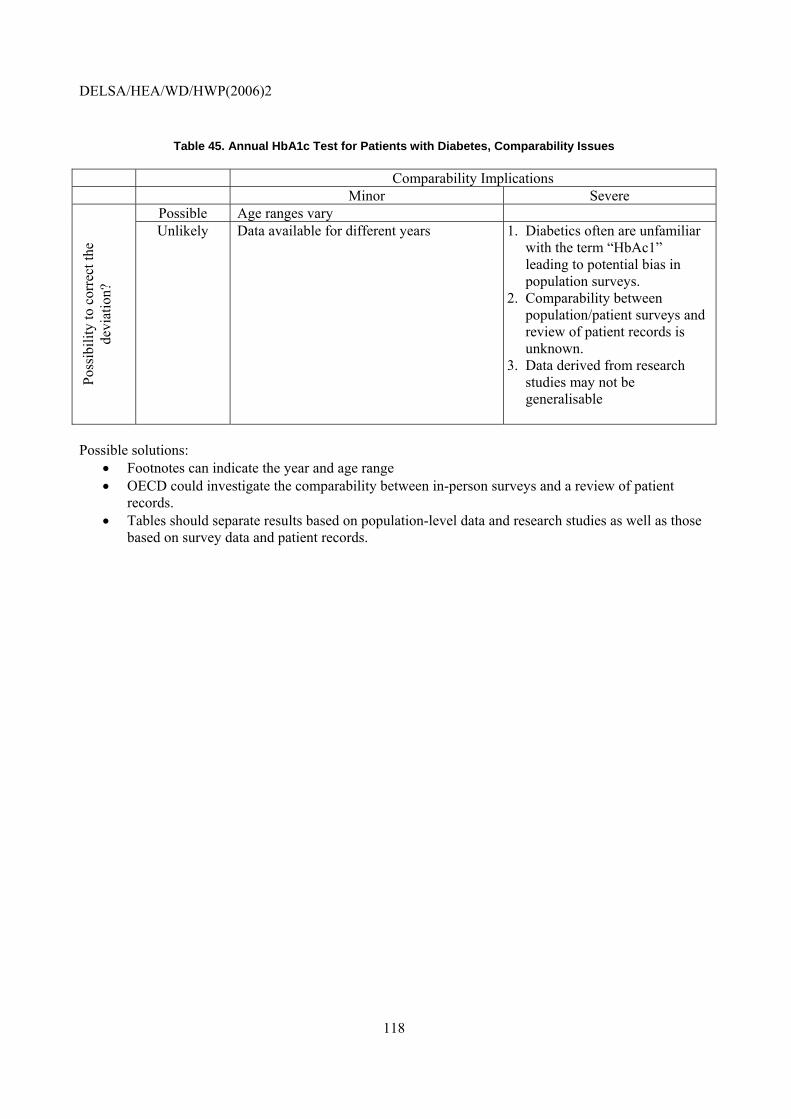
DELSA/HEA/WD/HWP(2006)2
118
Table 45. Annual HbA1c Test for Patients with Diabetes, Comparability Issues
Comparability Implications Minor Severe
Possible Age ranges vary
Poss
ibili
ty to
cor
rect
the
devi
atio
n?
Unlikely Data available for different years
1. Diabetics often are unfamiliar with the term “HbAc1” leading to potential bias in population surveys.
2. Comparability between population/patient surveys and review of patient records is unknown.
3. Data derived from research studies may not be generalisable
Possible solutions:
• Footnotes can indicate the year and age range • OECD could investigate the comparability between in-person surveys and a review of patient
records. • Tables should separate results based on population-level data and research studies as well as those
based on survey data and patient records.

DELSA/HEA/WD/HWP(2006)2
119
13. Patients with Diabetes with Poor Glucose Control
NOTE that this indicator was not recommended for inclusion in the initial HCQI indicator set. It is included in this paper to illustrate current data concerns with the indicator and their possible future
solutions
Operational Definition
Numerator: Number of patients with HbA1c levels greater than 9.5% at the most recent test given in the reporting year. Denominator: People age 18-75 with diabetes mellitus type I or II who had HbA1c levels tested within the reporting year (Diabetes defined as: at least one physician visit with a diagnosis of diabetes OR patient dispensed insulin and/or hypoglycaemic agent, excluding those with gestational diabetes).
Importance (for a more detailed discussed, please see above under HbA1c Test Rate)
202. Mortality: Diabetes mellitus was responsible for an estimated 21 deaths per 100 000 people in WHO Euro A countries in 2000. This represents 2.1% of all deaths.
203. Prevalence: Diabetes mellitus affected an estimated three of every 100 people living in WHO Euro A countries in 2000.
204. Cost: Endocrine diseases, of which diabetes is the most common, are the 12th attributable contributor to cost of illness in Canada (2.2% of direct and indirect costs). In the United States, the costs of diabetes totalled $132 billion in 2002, including about $92 billion in direct medical expenditures and about $40 billion in lost productivity and premature death.112
Scientific Soundness
205. Face validity: HbA1c has been termed the memory of glucose control. Chronically elevated blood glucose levels, indicating poor glycemic control, lead to chemical alterations of the haemoglobin, the component of the red blood cells that transport oxygen. By measuring HbA1c-levels, clinicians gain insight into the glycemic control of a patient over the last couple of weeks. Thus, the test allows determining how well a patient’s diabetes is managed and elevated values indicated uncontrolled diabetes.
206. Content validity: Reviews of the evidence from clinical trials of diabetes management, including those conducted by the Cochrane Collaboration, the American Diabetes Association, the New Zealand Guidelines Group, and others, have all concluded that good glycemic control reduces the occurrence of retinopathy, nephropathy, and neuropathy, and improves functional status and well-being among people with Type 1 and Type 2 diabetes.113 Many diabetic patients have poor glycemic control.114 The threshold
112. Hogan P, Dall T, Nikolov P. Economic costs of diabetes in the US in 2002. Diabetes Care 2003;26(3):917-32.
113. Renders CM, Valk GD, Griffin S, Wagner EH, Eijk JThM van, Assendelft WJJ. “Interventions to improve the management of diabetes mellitus in primary care, outpatient and community settings (Cochrane Review). In: The Cochrane Library, Issue 2, 2002. Oxford: Update Software; New Zealand Guidelines Group, “Primary care guidelines for the management of core aspects of diabetes,” http://www.nzgg.org.nz/library/gl_complete/diabetes/index.cfm#contents, accessed May 2003; Nathan DM, “Initial management of glycemia in type 2 diabetes mellitus,” New England Journal of Medicine 2002, 347(17): 1342-49.

DELSA/HEA/WD/HWP(2006)2
120
for this indicator, 9.5% (indicating very poor glycemic control), is based on a recommendation from a group of 15 experts in clinical diabetes developing indicators for the National Committee for Quality Assurance.115 This threshold, however, will need to be updated periodically, as numerous organisations, including the US National Quality Forum and the Alliance on Diabetes Quality Improvement (representing the American Medical Association, the American Diabetes Association and the Joint Commission on the Accreditation of Healthcare Organisations) have updated this threshold to a more stringent level.
207. Reliability: Different HbA1c tests could provide different results. However, the threshold chosen was judged high enough so that no patient, regardless of the test used or health condition should exceed the threshold.
Feasibility
208. Data availability: HbA1c levels are available for eleven countries (Table 46). The screening data are supplied for a range of years. Some countries provided data that was a slight deviation from the OECD age range requested. Some countries used population surveys, and others sampled from clinics or hospitals. One country used a sample from a specialty clinic, which may not be representative of diabetes care nationally. One country provided data with a definition that was significantly more rigorous than the OECD definition. (Although another country, while supplying the data as requested, regularly uses the more rigorous target as well.) One country provided data for a specific ethnic group that is not generalisable to the national level.
209. Comparability issues: Detailed documentation is provided in Table 46 and an assessment in Table 47. The differences in years provided at age deviations do not appear to be significant threats to validity. The variation in definition of poor glucose control (HbAc1>9.5%) is a significant problem with respect to international comparability. The differing sampling techniques are likely to pose threats to comparability.
210. Overall assessment: Eleven countries could provide data on this indicator. It appears that some of the data stem from research studies and may not be regularly collected. Data would be available in patient records, but would require a review of patient records which, currently, is not routinely done in most national data collection systems.
114. Renders CM, Valk GD, Griffin S, Wagner EH, Eijk JThM van, Assendelft WJJ. “Interventions to improve the
management of diabetes mellitus in primary care, outpatient and community settings (Cochrane Review). In: The Cochrane Library, Issue 2, 2002. Oxford: Update Software.
115. National Committee for Quality Assurance, “Diabetes Quality Improvement Project initial measure set (final version).” http://www.ncqa.org/dprp/dqip2.htm, accessed May 2003.
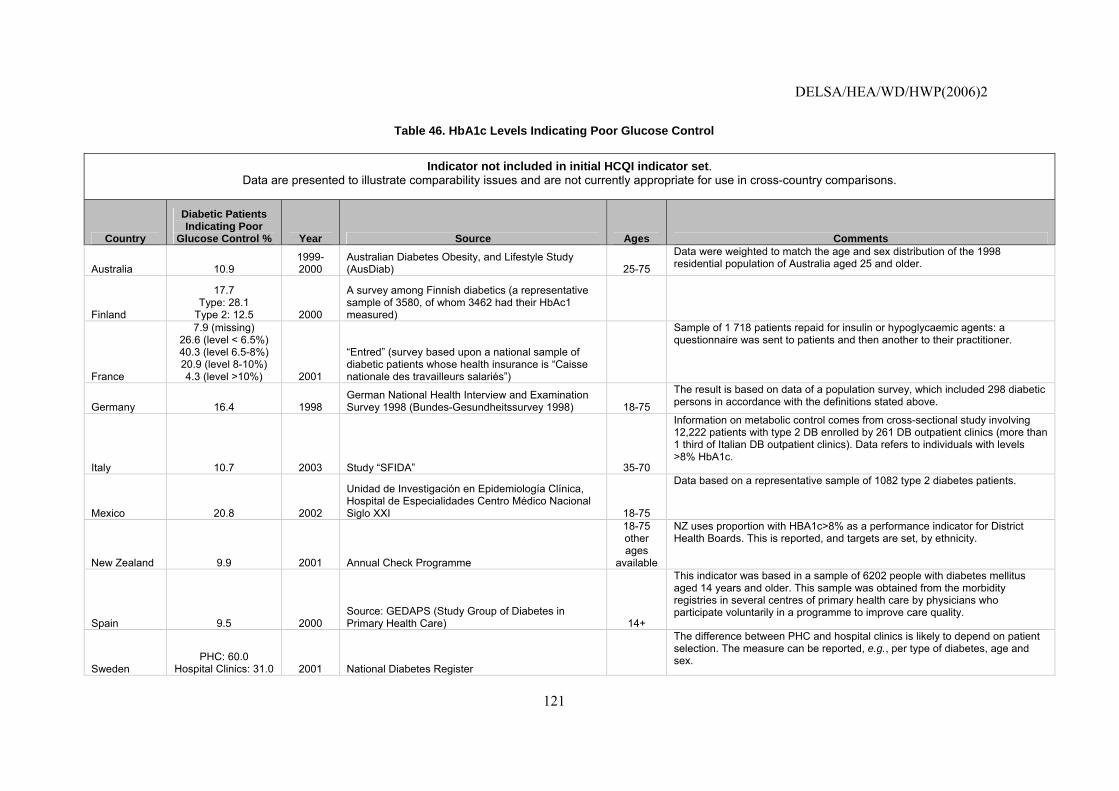
DELSA/HEA/WD/HWP(2006)2
121
Table 46. HbA1c Levels Indicating Poor Glucose Control
Indicator not included in initial HCQI indicator set. Data are presented to illustrate comparability issues and are not currently appropriate for use in cross-country comparisons.
Country
Diabetic Patients Indicating Poor
Glucose Control % Year Source Ages Comments
Australia 10.9 1999-2000
Australian Diabetes Obesity, and Lifestyle Study (AusDiab) 25-75
Data were weighted to match the age and sex distribution of the 1998 residential population of Australia aged 25 and older.
Finland
17.7 Type: 28.1
Type 2: 12.5 2000
A survey among Finnish diabetics (a representative sample of 3580, of whom 3462 had their HbAc1 measured)
France
7.9 (missing) 26.6 (level < 6.5%) 40.3 (level 6.5-8%) 20.9 (level 8-10%) 4.3 (level >10%) 2001
“Entred” (survey based upon a national sample of diabetic patients whose health insurance is “Caisse nationale des travailleurs salariés”)
Sample of 1 718 patients repaid for insulin or hypoglycaemic agents: a questionnaire was sent to patients and then another to their practitioner.
Germany 16.4 1998 German National Health Interview and Examination Survey 1998 (Bundes-Gesundheitssurvey 1998) 18-75
The result is based on data of a population survey, which included 298 diabetic persons in accordance with the definitions stated above.
Italy 10.7 2003 Study “SFIDA” 35-70
Information on metabolic control comes from cross-sectional study involving 12,222 patients with type 2 DB enrolled by 261 DB outpatient clinics (more than 1 third of Italian DB outpatient clinics). Data refers to individuals with levels >8% HbA1c.
Mexico 20.8 2002
Unidad de Investigación en Epidemiología Clínica, Hospital de Especialidades Centro Médico Nacional Siglo XXI 18-75
Data based on a representative sample of 1082 type 2 diabetes patients.
New Zealand 9.9 2001 Annual Check Programme
18-75 other ages
available
NZ uses proportion with HBA1c>8% as a performance indicator for District Health Boards. This is reported, and targets are set, by ethnicity.
Spain 9.5 2000 Source: GEDAPS (Study Group of Diabetes in Primary Health Care) 14+
This indicator was based in a sample of 6202 people with diabetes mellitus aged 14 years and older. This sample was obtained from the morbidity registries in several centres of primary health care by physicians who participate voluntarily in a programme to improve care quality.
Sweden PHC: 60.0
Hospital Clinics: 31.0 2001 National Diabetes Register
The difference between PHC and hospital clinics is likely to depend on patient selection. The measure can be reported, e.g., per type of diabetes, age and sex.
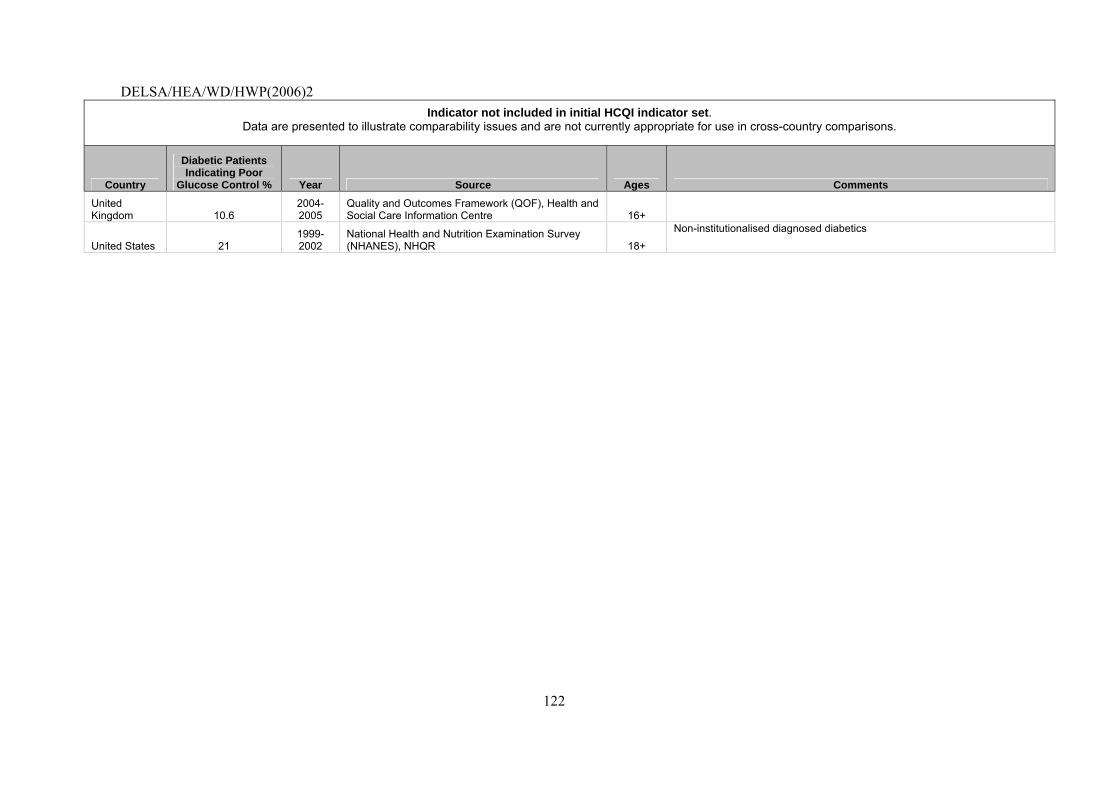
DELSA/HEA/WD/HWP(2006)2
122
Indicator not included in initial HCQI indicator set. Data are presented to illustrate comparability issues and are not currently appropriate for use in cross-country comparisons.
Country
Diabetic Patients Indicating Poor
Glucose Control % Year Source Ages Comments United Kingdom 10.6
2004-2005
Quality and Outcomes Framework (QOF), Health and Social Care Information Centre 16+
United States 21 1999-2002
National Health and Nutrition Examination Survey (NHANES), NHQR 18+
Non-institutionalised diagnosed diabetics
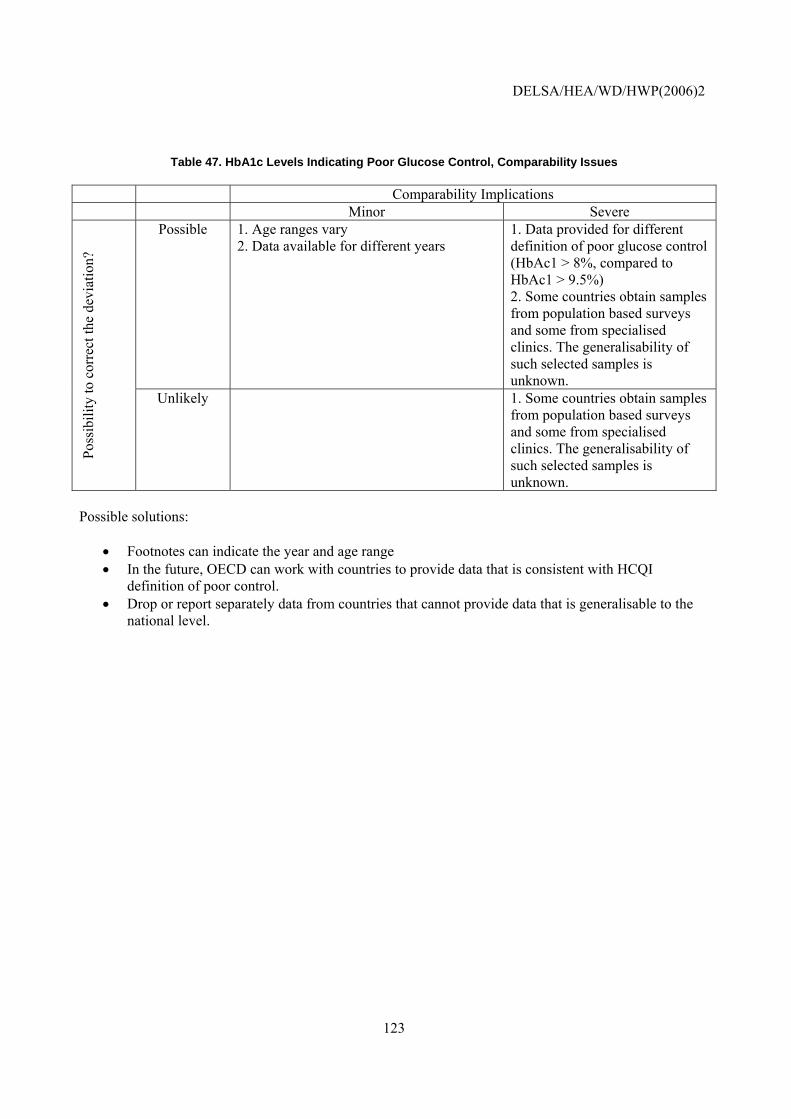
DELSA/HEA/WD/HWP(2006)2
123
Table 47. HbA1c Levels Indicating Poor Glucose Control, Comparability Issues
Comparability Implications Minor Severe
Possible 1. Age ranges vary 2. Data available for different years
1. Data provided for different definition of poor glucose control (HbAc1 > 8%, compared to HbAc1 > 9.5%) 2. Some countries obtain samples from population based surveys and some from specialised clinics. The generalisability of such selected samples is unknown.
Poss
ibili
ty to
cor
rect
the
devi
atio
n?
Unlikely 1. Some countries obtain samples from population based surveys and some from specialised clinics. The generalisability of such selected samples is unknown.
Possible solutions:
• Footnotes can indicate the year and age range • In the future, OECD can work with countries to provide data that is consistent with HCQI
definition of poor control. • Drop or report separately data from countries that cannot provide data that is generalisable to the
national level.
DELSA/HEA/WD/HWP(2006)2
124
14. Retinal Exams in Diabetics
NOTE that this indicator was not recommended for inclusion in the initial HCQI indicator set. It is included in this paper to illustrate current data concerns with the indicator and their possible future
solutions
Operational Definition
Numerator: Number of diabetic patients who received a dilated eye exam or evaluation of retinal photography by an ophthalmologist or optometrist in a given year.
Denominator: Number of patients with diabetes (Type 1 and Type 2) ages 18-75 years.
Importance
211. Mortality: Diabetes mellitus was responsible for an estimated 21 deaths per 100,000 people in WHO Euro A countries in 2000. This represents 2% of all deaths.
212. Incidence: Diabetes mellitus affected an estimated 3 of every 100 people living in WHO Euro A countries in 2000. Diabetes mellitus constitutes a major public health burden in the industrialised countries, affecting, for example in the US an estimated 15.7 million people, including an estimated 5.4 million people not yet diagnosed. The prevalence of diabetes in the US is projected to increase from the present rate of 5.9% to 8.9% by 2025.116 In addition to being the seventh leading cause of death in the US;117 diabetes mellitus is also the leading cause of blindness in people ages 20-74. Retinopathy poses a serious threat to vision. In the United States, diabetes is responsible for 8% of legal blindness, making it the leading cause of new cases of blindness in adults 20-74 years of age. 118 Each year, between 12,000 and 24,000 people lose their sight because of diabetes. Nearly all patients who have type 1 diabetes for about 20 years will have evidence of diabetic retinopathy. Up to 21% of people with type 2 diabetes have retinopathy when they are first diagnosed with diabetes, and most will eventually develop some degree of retinopathy.
213. Cost: Endocrine diseases, of which diabetes is the most common, are the 12th attributable contributor to cost of illness in Canada (2.2% of direct and indirect costs). In the United States, the costs of diabetes totalled $132 billion in 2002, including about $92 billion in direct medical expenditures and about $40 billion in lost productivity and premature death.119
Scientific Soundness
214. Face validity: The prevalence of retinopathy is strongly related to the duration and control of diabetes, rendering adequate glycemic control the key measure to prevent retinopathy. But even in patients with manifest retinopathy, treatment modalities exist that can delay progression and eventual blindness.120
116. American Diabetes Association “Facts and Figures”, http://www.diabetes.org; NIDDK “Diabetes Overview”,
http://www.niddk.nih.gov/health/diabetes/pubs/dmover/dmover.htm.
117. Ibid.
118. American Diabetes Association, http://www.diabetes.org/diabetes-statistics/eye-complications.jsp. Accessed, 28/07/04. 119 Hogan P, Dall T, Nikolov P. Economic costs of diabetes in the US in 2002. Diabetes Care 2003;26(3):917-32.
120. American Diabetes Association: Clinical Practice Recommendations 2002. Diabetic Retinopathy (Position Statement).2002; 25(sup.1):90-93. Available at: http://care.diabetesjournals.org/cgi/content/full/25/suppl_1/s90.
DELSA/HEA/WD/HWP(2006)2
125
People with proliferative retinopathy can reduce their risk of blindness by 95% with timely treatment and appropriate follow-up care.121 Because a person can have retinopathy and not realise it, a regular check-up with an eye care professional is essential for early detection and treatment.
215. In addition, there have been several cost-effectiveness analyses of screening for diabetic retinopathy. Even though modelling techniques and component costs have differed substantially, the result of all the analyses is the same: screening for diabetic retinopathy saves vision at a relatively low cost, and the cost is less than the disability payments provided to people who would go blind in the absence of a screening programme.122
216. Construct validity: A number of associations, such as the American Association of Clinical Endocrinologists/American College of Endocrinology, American Diabetes Association, and American Academy of Ophthalmology, offer clinical guidelines recommending that annual eye exams be performed on patients with diabetes. In addition, annual retinal exams are one of five diabetes management tests recommended by the US Alliance on Diabetes Quality Improvement (which includes the American Diabetes Association.) They recommend that for the patient group 29 years or younger that the first examination be made within 3-5 years after diagnosis of diabetes once the patient is age 10 or older, with a minimum routine follow up yearly. For the patient group 30 years an older, it is recommended that the first examination be conducted at the time of diagnosis of diabetes and with yearly minimum routine follow-ups. Women with diabetes planning pregnancy should have a comprehensive eye examination and be counselled on the risk of development of retinopathy, and also have a comprehensive eye examination in the 1st trimester with close follow up throughout pregnancy.
217. Reliability: Countries use national surveys to determine eye exam rates. These rates will be affected by national aspects of survey design such as the question used, sampling, and method of administering the survey. Survey questions are also sensitive to cultural differences in survey responses in different countries, potentially leading to recall bias.
Feasibility
218. Data availability: Retinal eye exam rates are available for ten countries (Table 48). Data are provided for years 1999 to 2005. Some countries use slightly different age ranges. One country could only provide regional data. One country provided data for retinal exams in the last two years. One country could only provide rate of eye exams by diabetics. Countries obtained their data from population surveys and from patient records, or clinical surveys.
219. Comparability issues: Detailed documentation is provided in Table 48 and an assessment in Table 49. The deviations in age and years are minor. Another minor problem is comparing a country using rate of “eye exams” in diabetics to the dilated eye exam. The different methods of collecting data represent major threats to comparability. There are two basic ways to obtain estimates for this indicator, population based surveys, and surveys at clinical sites or a review of patient records. Population based surveys rely on respondents to self-report their diabetes diagnosis and their most recent eye exam. Population based surveys are likely to capture diabetics who might not be regularly seeing a physician. However, there may be recall bias associated with these surveys—in that respondents may not accurately be able to remember their last exam. Data obtained from patient records are likely to be more accurate with respect to the frequency of tests, but exclude diabetics who do not regularly seek medical care. For these reasons rates
121. National Eye Institute, http://www.nei.nih.gov/health/diabetic/retinopathy.asp#15. Accessed, 28/07/04.
122. American Diabetes Association: Clinical Practice Recommendations 2002. Diabetic Retinopathy (Position Statement).2002; 25(sup.1):90-93. Available at: http://care.diabetesjournals.org/cgi/content/full/25/suppl_1/s90.

DELSA/HEA/WD/HWP(2006)2
126
obtained from population based surveys should be compared with caution to rates obtained from clinical surveys or clinical records.
220. Overall assessment: Only ten countries were able to provide data for this indicator. Not many countries routinely survey diabetics, or include such detailed questions in general population surveys. Obtaining data from patient records can be burdensome.
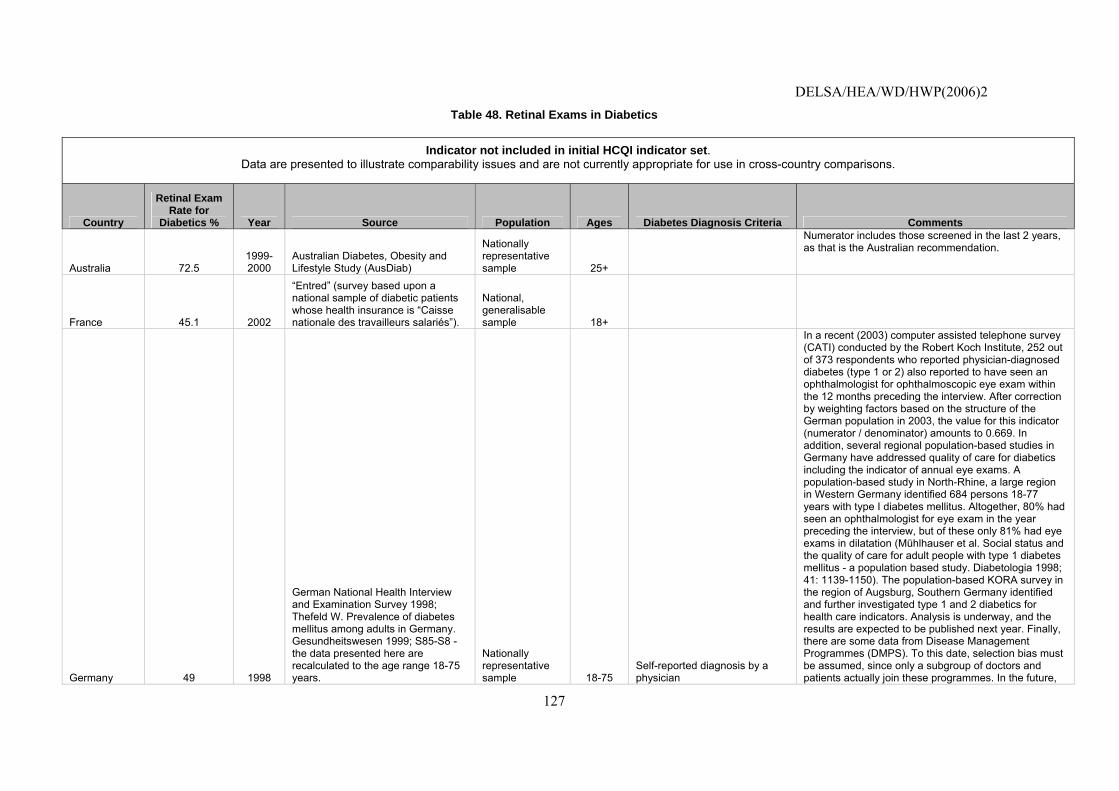
DELSA/HEA/WD/HWP(2006)2
127
Table 48. Retinal Exams in Diabetics
Indicator not included in initial HCQI indicator set. Data are presented to illustrate comparability issues and are not currently appropriate for use in cross-country comparisons.
Country
Retinal Exam Rate for
Diabetics % Year Source Population Ages Diabetes Diagnosis Criteria Comments
Australia 72.5 1999-2000
Australian Diabetes, Obesity and Lifestyle Study (AusDiab)
Nationally representative sample 25+
Numerator includes those screened in the last 2 years, as that is the Australian recommendation.
France 45.1 2002
“Entred” (survey based upon a national sample of diabetic patients whose health insurance is “Caisse nationale des travailleurs salariés”).
National, generalisable sample 18+
Germany 49 1998
German National Health Interview and Examination Survey 1998; Thefeld W. Prevalence of diabetes mellitus among adults in Germany. Gesundheitswesen 1999; S85-S8 - the data presented here are recalculated to the age range 18-75 years.
Nationally representative sample 18-75
Self-reported diagnosis by a physician
In a recent (2003) computer assisted telephone survey (CATI) conducted by the Robert Koch Institute, 252 out of 373 respondents who reported physician-diagnosed diabetes (type 1 or 2) also reported to have seen an ophthalmologist for ophthalmoscopic eye exam within the 12 months preceding the interview. After correction by weighting factors based on the structure of the German population in 2003, the value for this indicator (numerator / denominator) amounts to 0.669. In addition, several regional population-based studies in Germany have addressed quality of care for diabetics including the indicator of annual eye exams. A population-based study in North-Rhine, a large region in Western Germany identified 684 persons 18-77 years with type I diabetes mellitus. Altogether, 80% had seen an ophthalmologist for eye exam in the year preceding the interview, but of these only 81% had eye exams in dilatation (Mühlhauser et al. Social status and the quality of care for adult people with type 1 diabetes mellitus - a population based study. Diabetologia 1998; 41: 1139-1150). The population-based KORA survey in the region of Augsburg, Southern Germany identified and further investigated type 1 and 2 diabetics for health care indicators. Analysis is underway, and the results are expected to be published next year. Finally, there are some data from Disease Management Programmes (DMPS). To this date, selection bias must be assumed, since only a subgroup of doctors and patients actually join these programmes. In the future,
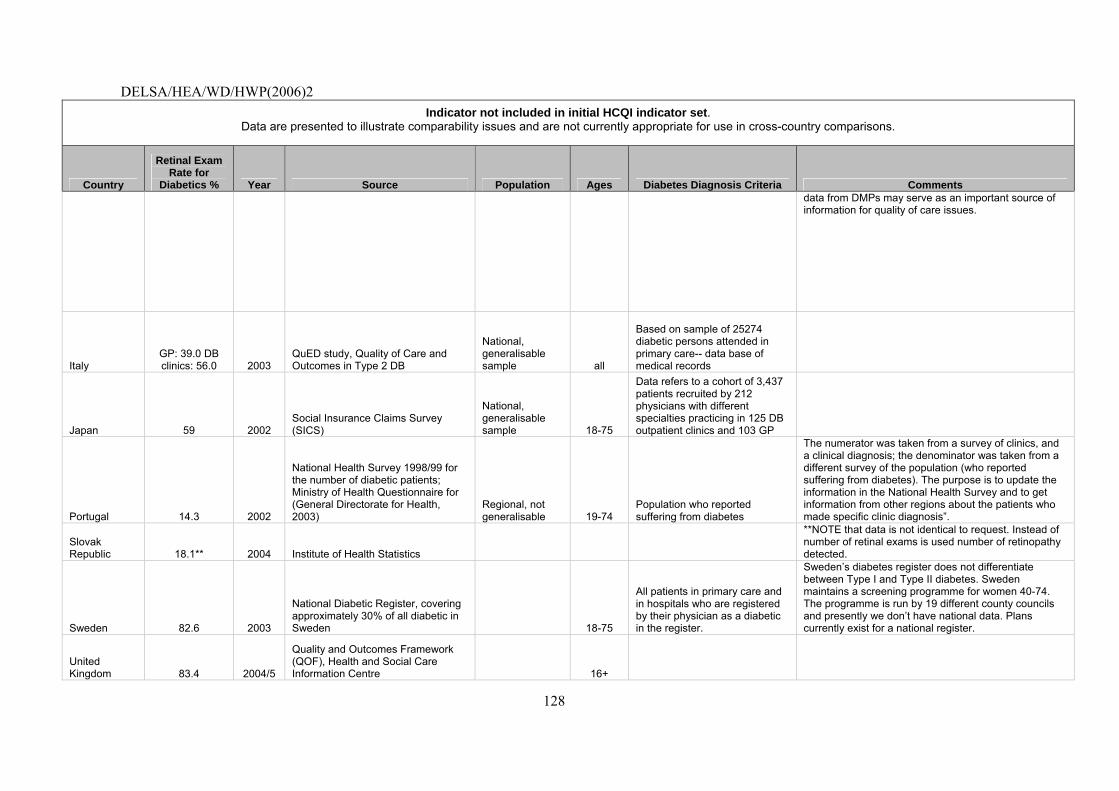
DELSA/HEA/WD/HWP(2006)2
128
Indicator not included in initial HCQI indicator set. Data are presented to illustrate comparability issues and are not currently appropriate for use in cross-country comparisons.
Country
Retinal Exam Rate for
Diabetics % Year Source Population Ages Diabetes Diagnosis Criteria Comments data from DMPs may serve as an important source of information for quality of care issues.
Italy GP: 39.0 DB clinics: 56.0 2003
QuED study, Quality of Care and Outcomes in Type 2 DB
National, generalisable sample all
Based on sample of 25274 diabetic persons attended in primary care-- data base of medical records
Japan 59 2002 Social Insurance Claims Survey (SICS)
National, generalisable sample 18-75
Data refers to a cohort of 3,437 patients recruited by 212 physicians with different specialties practicing in 125 DB outpatient clinics and 103 GP
Portugal 14.3 2002
National Health Survey 1998/99 for the number of diabetic patients; Ministry of Health Questionnaire for (General Directorate for Health, 2003)
Regional, not generalisable 19-74
Population who reported suffering from diabetes
The numerator was taken from a survey of clinics, and a clinical diagnosis; the denominator was taken from a different survey of the population (who reported suffering from diabetes). The purpose is to update the information in the National Health Survey and to get information from other regions about the patients who made specific clinic diagnosis”.
Slovak Republic 18.1** 2004 Institute of Health Statistics
**NOTE that data is not identical to request. Instead of number of retinal exams is used number of retinopathy detected.
Sweden 82.6 2003
National Diabetic Register, covering approximately 30% of all diabetic in Sweden 18-75
All patients in primary care and in hospitals who are registered by their physician as a diabetic in the register.
Sweden’s diabetes register does not differentiate between Type I and Type II diabetes. Sweden maintains a screening programme for women 40-74. The programme is run by 19 different county councils and presently we don’t have national data. Plans currently exist for a national register.
United Kingdom 83.4 2004/5
Quality and Outcomes Framework (QOF), Health and Social Care Information Centre 16+
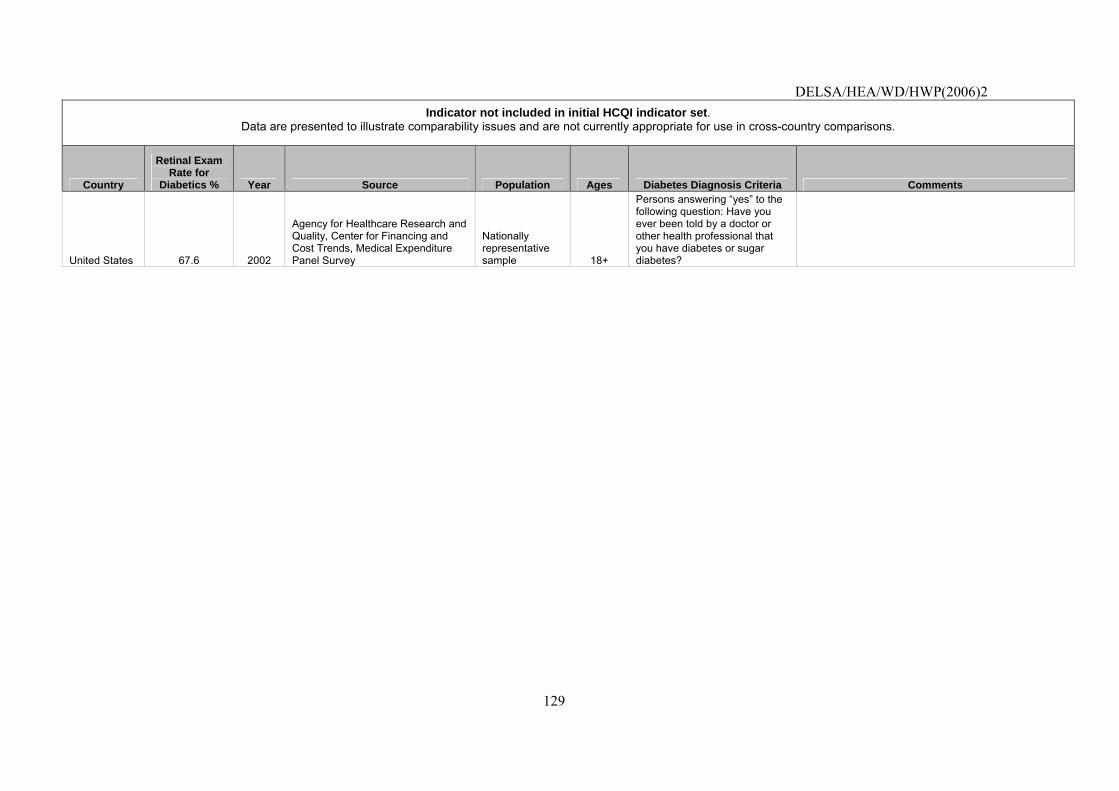
DELSA/HEA/WD/HWP(2006)2
129
Indicator not included in initial HCQI indicator set. Data are presented to illustrate comparability issues and are not currently appropriate for use in cross-country comparisons.
Country
Retinal Exam Rate for
Diabetics % Year Source Population Ages Diabetes Diagnosis Criteria Comments
United States 67.6 2002
Agency for Healthcare Research and Quality, Center for Financing and Cost Trends, Medical Expenditure Panel Survey
Nationally representative sample 18+
Persons answering “yes” to the following question: Have you ever been told by a doctor or other health professional that you have diabetes or sugar diabetes?
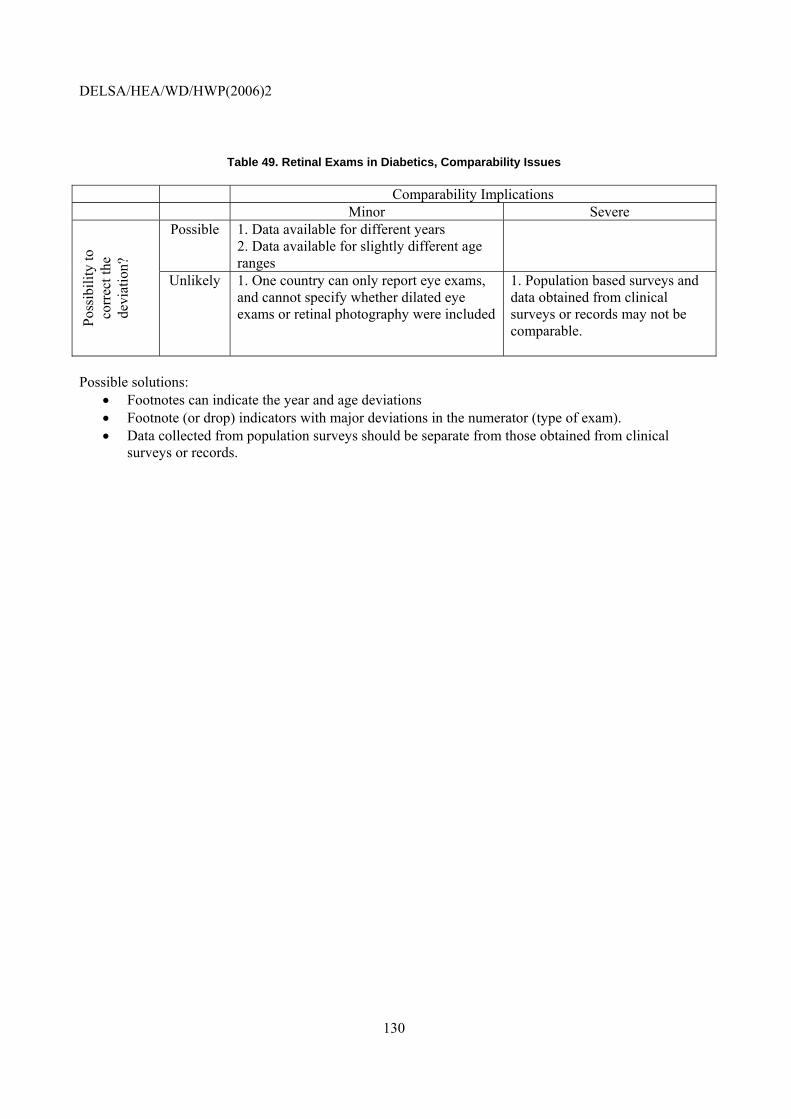
DELSA/HEA/WD/HWP(2006)2
130
Table 49. Retinal Exams in Diabetics, Comparability Issues
Comparability Implications Minor Severe
Possible 1. Data available for different years 2. Data available for slightly different age ranges
Poss
ibili
ty to
co
rrec
t the
de
viat
ion?
Unlikely 1. One country can only report eye exams, and cannot specify whether dilated eye exams or retinal photography were included
1. Population based surveys and data obtained from clinical surveys or records may not be comparable.
Possible solutions:
• Footnotes can indicate the year and age deviations • Footnote (or drop) indicators with major deviations in the numerator (type of exam). • Data collected from population surveys should be separate from those obtained from clinical
surveys or records.
DELSA/HEA/WD/HWP(2006)2
131
15. Major Amputation in Diabetics
NOTE that this indicator was not recommended for inclusion in the initial HCQI indicator set. It is included in this paper to illustrate current data concerns with the indicator and their possible future
solutions
Operational Definition
Numerator: Number of diabetic patients with major (above or below knee) amputations in a given year.
Denominator: Number of patients with diabetes (Type 1 and Type 2) ages 18-75 years.
Importance123
221. Mortality: Diabetes mellitus was responsible for an estimated 21 deaths per 100,000 people in WHO Euro A countries in 2000. This represents 2% of all deaths.
222. Prevalence: Each year, more than 10,000 Americans with diabetes face decisions related to amputation. Two of the main complications of longstanding inadequate glycemic control or poor diabetes management are peripheral vascular disease, the chronic deprivation of blood supply of the legs due to arteriolosclerosis, and peripheral neuropathy, damage to the peripheral nervous system. The combination of those two complications put diabetics at great risk for lower extremity lesions: The insensate foot makes it more likely that minor trauma occurs and goes unnoticed, the inadequate blood supply results in impaired healing of the wound and greater risk of infection. Thus, osteomyelitis (severe infections of the bone) and gangrene (infection induced tissue necrosis) may result. For about 75% of the cases, a partial amputation of a foot may be enough to stop the foot ulcer from progressing, but for the remaining 25%, it will be necessary to remove the leg from below the knee.124 Diabetics are also at higher risk of developing uninfected necroses of the lower extremities because of vascular complications. In the US, minority populations have had the highest rates of amputations and it is thought that socioeconomic status is a major factor leading to amputations. Thus, differences in level and distribution of wealth may be reflected in the measure together with differences in quality of care.
223. Cost: Endocrine diseases, of which diabetes is the most common, are the 12th attributable contributor to cost of illness in Canada (2.2% of direct and indirect costs). The total annual economic cost of diabetes in the US in 2002 was estimated to be $132 billion, or one out of every 10 health care dollars spent. 125 Amputations also have a large impact on health, particularly on quality of life, and result in substantial follow-on cost in the form of rehabilitation, prostheses and disability.
123. For additional discussion on the importance of diabetes, please refer to the discussion above under the
retinal exam indicator. 124. Mundell, E.J., “Simple Test Predicts Diabetes Amputation Success” (2004), available at:
http://www.wtoctv.com/global/story.asp?s=2113336&ClientType=printable. Accessed 03/08/04. 125. American Diabetes Association “Facts and Figures”, http://www.diabetes.org; NIDDK “Diabetes Overview”,
http://www.niddk.nih.gov/health/diabetes/pubs/dmover/dmover.htm.
DELSA/HEA/WD/HWP(2006)2
132
Scientific Soundness
224. Face validity: Adequate glycemic control has been shown to reduce the risk and severity of neuropathy and vascular complications in diabetics.126 It is also widely believed that careful monitoring for an intensive treatment of minor lesions in the presence of neuropathic and arterial disease of the extremities can prevent amputations, but are only a few randomised trials to support this.127
225. Construct validity: The main challenge to the construct validity of this indicator is a certain disjoint of the underlying concept and the operationalisation. Precisely speaking the concept behind the indicator is that proper diabetes management should reduce the risk of severe tissue damage to lower extremities. However, the indicator measures amputation rates, a closely related but slightly different concept that captures the typical consequence of severe tissue damage. One could also argue that, while severe tissue damage is unambiguously negative, the decision to amputate is not so that the indicator does not clearly indicate better or worse quality of care. However, many regard major amputation rates as reasonable proxy for severe tissue damage rates and thus a valid quality indicator.128 Because of the importance of this complication and plausibility of the concept behind the indicator, this measure has great potential. But it needs to be further studied before adopting it for international comparisons.
226. Reliability: As this indicator is derived from hospital discharge information, the ability to construct it reliably for international comparisons depends on the comparability of coding and reporting practices across countries. Amputation rates should be ascertainable in a reliable fashion in administrative data, as is done currently in the US by the Centers for Disease Control and Prevention,129 because such major procedures usually influence hospital payments and are thus reliably reported. But it may be difficult to reliably identify the diabetic population, because diabetes may only be recorded as comorbid condition rather than the primary reason for admission and coding of such secondary diagnoses may vary across countries.
Feasibility
227. Data availability: Major amputations in diabetics’ rates are available for 14 countries (Table 50). The data were reported for years ranging from 1994 to 2004. The OECD definition is for all ages, and five countries had deviations in the age range. All countries use hospital records for the numerator, but the method of estimating the denominator varied. Some countries used previous estimates or population surveys to obtain the denominators. Other countries used administrative data to obtain the denominator, which would not capture all diabetics but only the diabetics receiving hospital or other medical care, and the diagnostic codes to capture the diabetic population varied. One country indicated that hospital records may be incompletely coded, and may underestimate the amputations on diabetics. Countries used different procedure codes, and even some using the same coding system included different (more or less) procedures. Countries used varying inclusion criteria for the procedure, even accounting for differences in national coding systems. This is of serious concern to comparability and one that is investigated and presented in Part II of this report.
126. Renders C.M., Valk G.D., Griffin S, et al. “Interventions to improve the management of diabetes mellitus in primary
care, outpatient and community settings (Cochrane Review). In: The Cochrane Library, Issue 2, 2002. Oxford: Update Software.
127. Lavery L and Gazewood JD (2000), “Assessing the feet of patients with diabetes” J Fam Pract, 49(11 Suppl):9-16.
128. The situation is clearly different for minor amputations (e.g., toes), where timely amputations can avoid progression of the disease.
129. NCQA, Available at: http://www.ncqa.org/index.asp. Accessed August 2003.

DELSA/HEA/WD/HWP(2006)2
133
228. Comparability issues: Detailed documentation is provided in Table 50 and an assessment in Table 51. There are serious concerns about comparability, both from the estimation of the denominator, and because different procedures are being included, the HCQI project will have to ensure that countries are reporting the same type of amputations.
229. Overall assessment: Fourteen countries provided data on this indicator. While information for this indicator might exist in hospital records of other countries as well, it is unclear how many countries would be able to construct this indicator on a routine basis. Additionally, a significant amount of analytic work will have to be done in order to ensure that the data are internationally comparable. However, data comparability and availability for this indicator improved during the project and the indicator may warrant examination in the future as part of HCQI indicator updates.
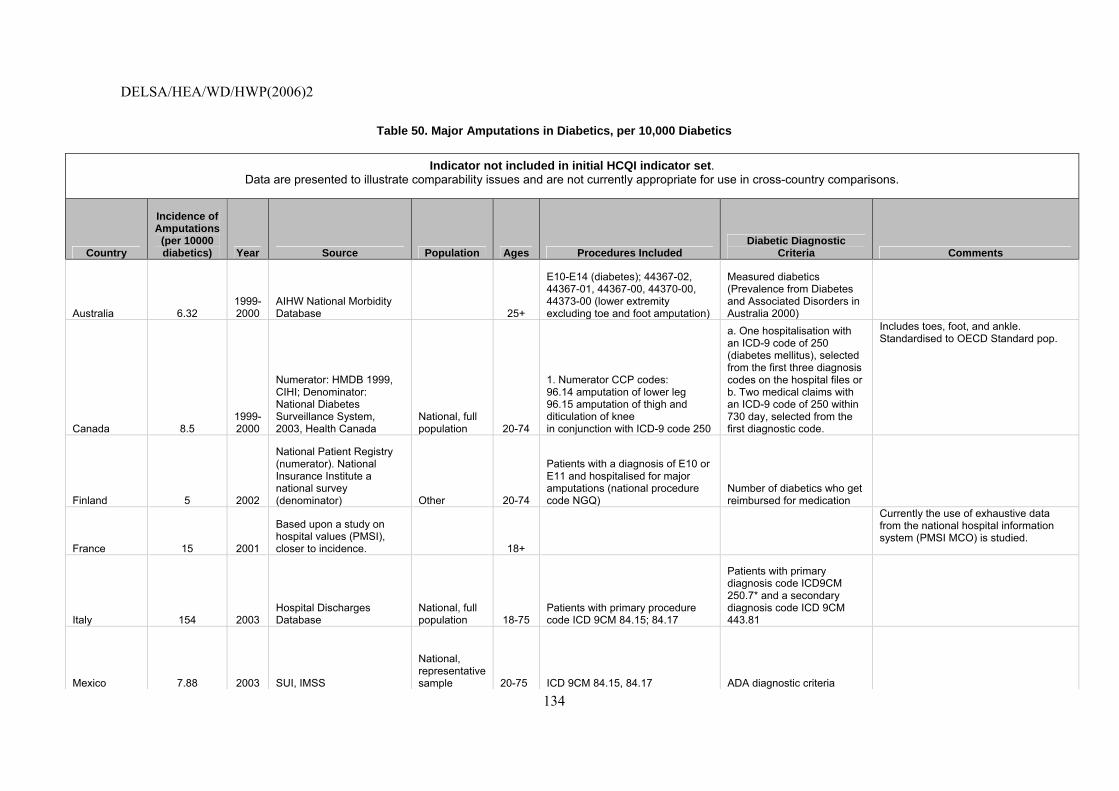
DELSA/HEA/WD/HWP(2006)2
134
Table 50. Major Amputations in Diabetics, per 10,000 Diabetics
Indicator not included in initial HCQI indicator set. Data are presented to illustrate comparability issues and are not currently appropriate for use in cross-country comparisons.
Country
Incidence of Amputations
(per 10000 diabetics) Year Source Population Ages Procedures Included
Diabetic Diagnostic Criteria Comments
Australia 6.32 1999-2000
AIHW National Morbidity Database 25+
E10-E14 (diabetes); 44367-02, 44367-01, 44367-00, 44370-00, 44373-00 (lower extremity excluding toe and foot amputation)
Measured diabetics (Prevalence from Diabetes and Associated Disorders in Australia 2000)
Canada 8.5 1999-2000
Numerator: HMDB 1999, CIHI; Denominator: National Diabetes Surveillance System, 2003, Health Canada
National, full population 20-74
1. Numerator CCP codes: 96.14 amputation of lower leg 96.15 amputation of thigh and diticulation of knee in conjunction with ICD-9 code 250
a. One hospitalisation with an ICD-9 code of 250 (diabetes mellitus), selected from the first three diagnosis codes on the hospital files or b. Two medical claims with an ICD-9 code of 250 within 730 day, selected from the first diagnostic code.
Includes toes, foot, and ankle. Standardised to OECD Standard pop.
Finland 5 2002
National Patient Registry (numerator). National Insurance Institute a national survey (denominator) Other 20-74
Patients with a diagnosis of E10 or E11 and hospitalised for major amputations (national procedure code NGQ)
Number of diabetics who get reimbursed for medication
France 15 2001
Based upon a study on hospital values (PMSI), closer to incidence. 18+
Currently the use of exhaustive data from the national hospital information system (PMSI MCO) is studied.
Italy 154 2003 Hospital Discharges Database
National, full population 18-75
Patients with primary procedure code ICD 9CM 84.15; 84.17
Patients with primary diagnosis code ICD9CM 250.7* and a secondary diagnosis code ICD 9CM 443.81
Mexico 7.88 2003 SUI, IMSS
National, representative sample 20-75 ICD 9CM 84.15, 84.17 ADA diagnostic criteria
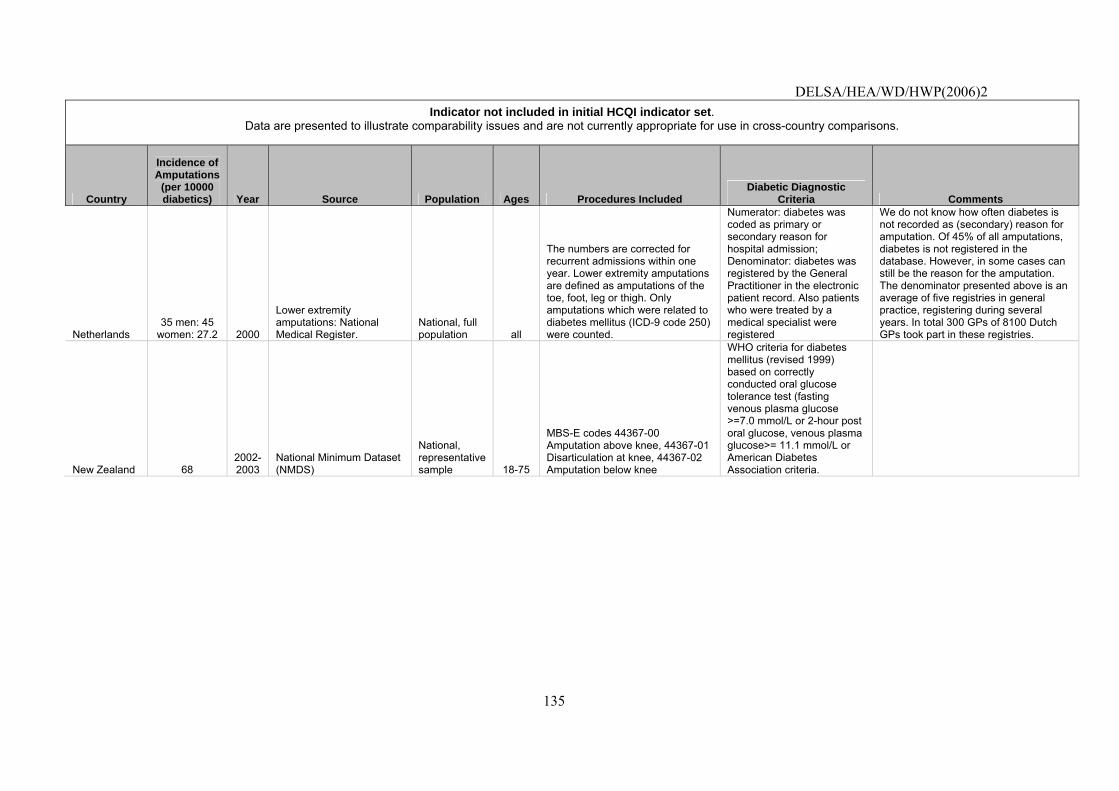
DELSA/HEA/WD/HWP(2006)2
135
Indicator not included in initial HCQI indicator set. Data are presented to illustrate comparability issues and are not currently appropriate for use in cross-country comparisons.
Country
Incidence of Amputations
(per 10000 diabetics) Year Source Population Ages Procedures Included
Diabetic Diagnostic Criteria Comments
Netherlands 35 men: 45
women: 27.2 2000
Lower extremity amputations: National Medical Register.
National, full population all
The numbers are corrected for recurrent admissions within one year. Lower extremity amputations are defined as amputations of the toe, foot, leg or thigh. Only amputations which were related to diabetes mellitus (ICD-9 code 250) were counted.
Numerator: diabetes was coded as primary or secondary reason for hospital admission; Denominator: diabetes was registered by the General Practitioner in the electronic patient record. Also patients who were treated by a medical specialist were registered
We do not know how often diabetes is not recorded as (secondary) reason for amputation. Of 45% of all amputations, diabetes is not registered in the database. However, in some cases can still be the reason for the amputation. The denominator presented above is an average of five registries in general practice, registering during several years. In total 300 GPs of 8100 Dutch GPs took part in these registries.
New Zealand 68 2002-2003
National Minimum Dataset (NMDS)
National, representative sample 18-75
MBS-E codes 44367-00 Amputation above knee, 44367-01 Disarticulation at knee, 44367-02 Amputation below knee
WHO criteria for diabetes mellitus (revised 1999) based on correctly conducted oral glucose tolerance test (fasting venous plasma glucose >=7.0 mmol/L or 2-hour post oral glucose, venous plasma glucose>= 11.1 mmol/L or American Diabetes Association criteria.
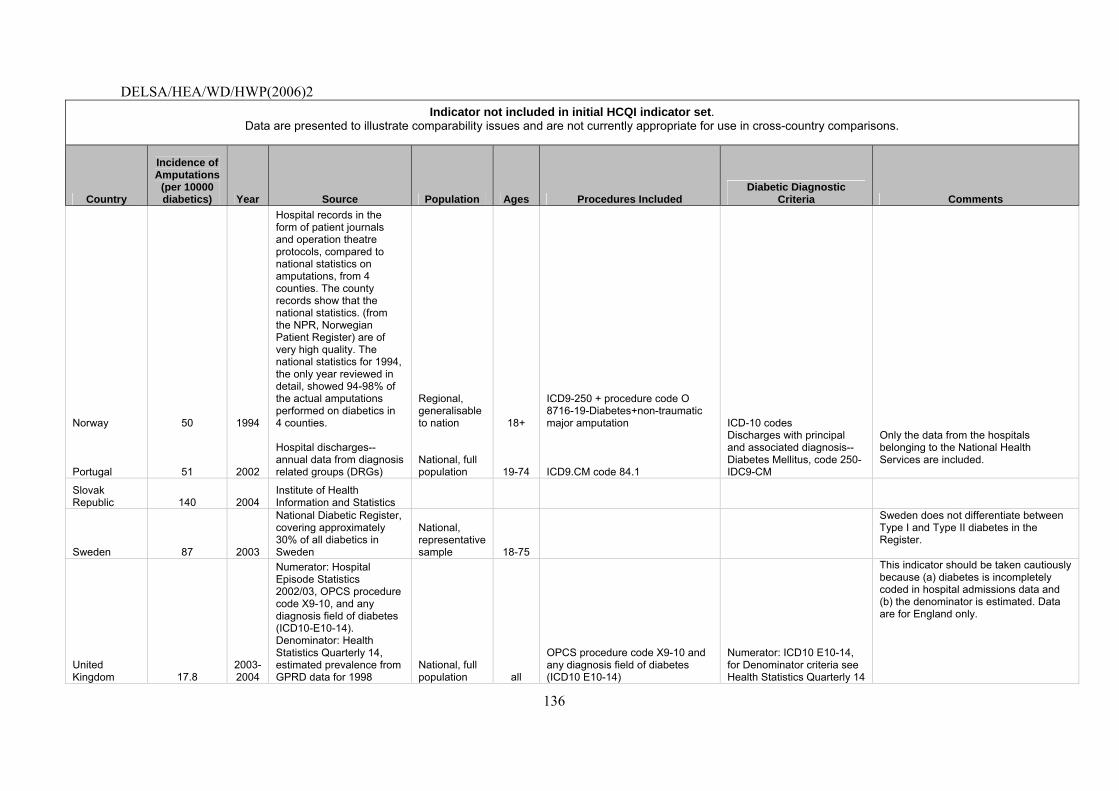
DELSA/HEA/WD/HWP(2006)2
136
Indicator not included in initial HCQI indicator set. Data are presented to illustrate comparability issues and are not currently appropriate for use in cross-country comparisons.
Country
Incidence of Amputations
(per 10000 diabetics) Year Source Population Ages Procedures Included
Diabetic Diagnostic Criteria Comments
Norway 50 1994
Hospital records in the form of patient journals and operation theatre protocols, compared to national statistics on amputations, from 4 counties. The county records show that the national statistics. (from the NPR, Norwegian Patient Register) are of very high quality. The national statistics for 1994, the only year reviewed in detail, showed 94-98% of the actual amputations performed on diabetics in 4 counties.
Regional, generalisable to nation 18+
ICD9-250 + procedure code O 8716-19-Diabetes+non-traumatic major amputation ICD-10 codes
Portugal 51 2002
Hospital discharges-- annual data from diagnosis related groups (DRGs)
National, full population 19-74 ICD9.CM code 84.1
Discharges with principal and associated diagnosis-- Diabetes Mellitus, code 250- IDC9-CM
Only the data from the hospitals belonging to the National Health Services are included.
Slovak Republic 140 2004
Institute of Health Information and Statistics
Sweden 87 2003
National Diabetic Register, covering approximately 30% of all diabetics in Sweden
National, representative sample 18-75
Sweden does not differentiate between Type I and Type II diabetes in the Register.
United Kingdom 17.8
2003-2004
Numerator: Hospital Episode Statistics 2002/03, OPCS procedure code X9-10, and any diagnosis field of diabetes (ICD10-E10-14). Denominator: Health Statistics Quarterly 14, estimated prevalence from GPRD data for 1998
National, full population all
OPCS procedure code X9-10 and any diagnosis field of diabetes (ICD10 E10-14)
Numerator: ICD10 E10-14, for Denominator criteria see Health Statistics Quarterly 14
This indicator should be taken cautiously because (a) diabetes is incompletely coded in hospital admissions data and (b) the denominator is estimated. Data are for England only.
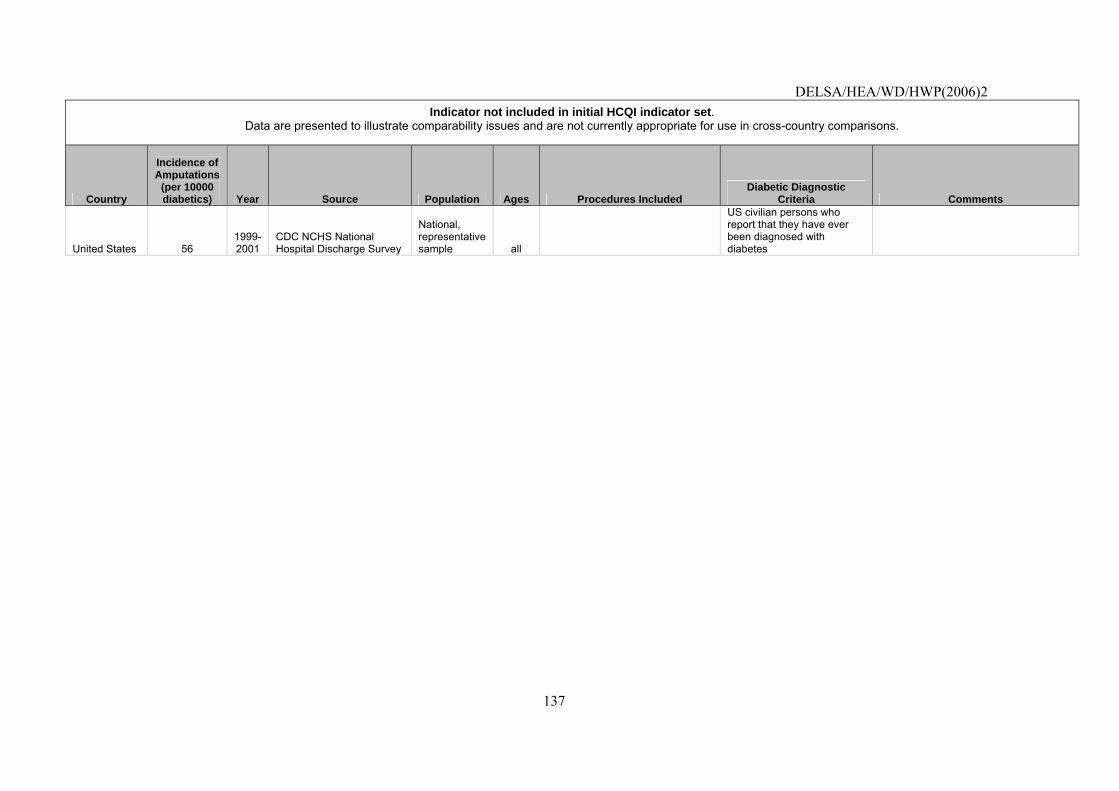
DELSA/HEA/WD/HWP(2006)2
137
Indicator not included in initial HCQI indicator set. Data are presented to illustrate comparability issues and are not currently appropriate for use in cross-country comparisons.
Country
Incidence of Amputations
(per 10000 diabetics) Year Source Population Ages Procedures Included
Diabetic Diagnostic Criteria Comments
United States 56 1999-2001
CDC NCHS National Hospital Discharge Survey
National, representative sample all
US civilian persons who report that they have ever been diagnosed with diabetes
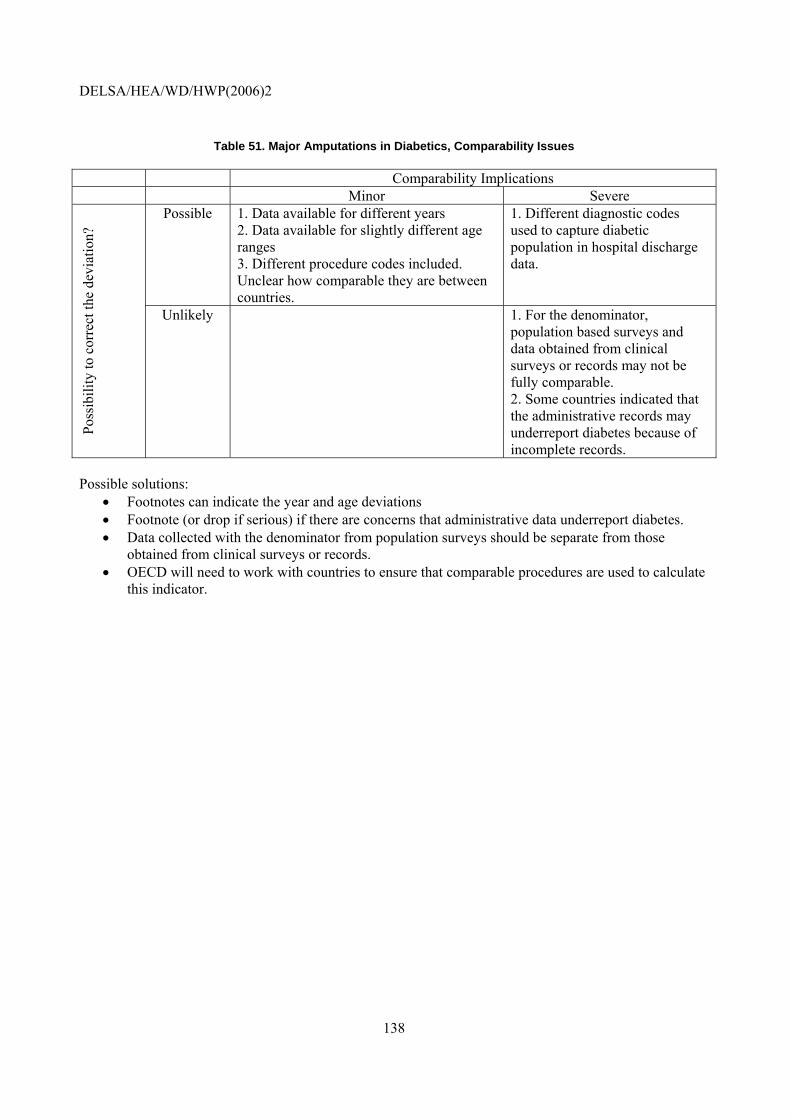
DELSA/HEA/WD/HWP(2006)2
138
Table 51. Major Amputations in Diabetics, Comparability Issues
Comparability Implications Minor Severe
Possible 1. Data available for different years 2. Data available for slightly different age ranges 3. Different procedure codes included. Unclear how comparable they are between countries.
1. Different diagnostic codes used to capture diabetic population in hospital discharge data.
Poss
ibili
ty to
cor
rect
the
devi
atio
n?
Unlikely 1. For the denominator, population based surveys and data obtained from clinical surveys or records may not be fully comparable. 2. Some countries indicated that the administrative records may underreport diabetes because of incomplete records.
Possible solutions:
• Footnotes can indicate the year and age deviations • Footnote (or drop if serious) if there are concerns that administrative data underreport diabetes. • Data collected with the denominator from population surveys should be separate from those
obtained from clinical surveys or records. • OECD will need to work with countries to ensure that comparable procedures are used to calculate
this indicator.
DELSA/HEA/WD/HWP(2006)2
139
16. Influenza Vaccination for Adults over 65
Operational definition
Numerator: Number offered an annual influenza vaccination.
Denominator: Number of adults over 65 years of age.
Importance
230. Mortality: Approximately 36,000 people in the US die from the flu every year.130 Influenza and pneumonia combined are the 7th leading cause of death among all Americans and the 5th leading cause of death among all Americans over the age of 65.131
231. Prevalence: About 10%-20% of US residents get the flu each year, and an average of 114,000 people is hospitalised as a result of it.132 Most people who get the flu will recover in one to two weeks, but some people will develop life-threatening complications, such as pneumonia, as result of the flu.133 Infection occurs most frequently among children but causes highest morbidity and mortality in adults 65 years of age and older. These adults are more likely to have serious complications from this illness which can affect their health and independence. In addition, global epidemics can occur, associated with increased rates of illness and death from influenza-related complications.
232. Cost: It is estimated that annual direct medical costs (hospitalisation, doctors office visits, medication, etc.) of influenza are up to $4.6 billion, and that 70.2 million work-loss days are attributed to influenza (in employed persons age 18 and older).134 It is also estimated that in the US, the influenza epidemics have cost the US economy $71-161 billion per year.135
233. Policy importance: Influenza vaccination coverage has immediate implications for health policy in terms of indicating the need for interventions to increase vaccine uptake, such as community-based interventions (e.g., mass media to increase awareness), individual based interventions such as patient reminder systems, primary care, hospital-based (e.g., vaccination of all patients at increased risk prior to influenza seasons if admitted to hospital) interventions and/or public health interventions such as improving access to vaccination (e.g., offering vaccination in public places such as shopping centres etc.).136,137
130. CDC, Fact Sheet: Key Facts About the Flu. December 11, 2003. 131. American Lung Association. Fact Sheet: Influenza. October 2002. Available at
http://www.texaslung.org/educationalresources/factsheets/influenza.htm, accessed August, 2004. 132. CDC, Fact Sheet: Key Facts About the Flu. December 11, 2003. 133. Ibid. 134. National Coalition for Adult Immunisation, Facts About Influenza for Adults. Available at
http://www.nfid.org/factsheets/influadult.html, accessed August, 2004. 135. WHO, Fact sheet No.211, Influenza, revised March 2003, available at:
http://www.who.int.mediacentre/factsheets/fs211/en/print.html, accessed August, 2004 136. Marshall, M., Campbell, S., Hacker, J., and Roland, M. (2002), “Quality indicators for general practice: A practical
guide to clinical quality indicators for primary care health professionals and managers” London: Royal Society of Medicine Press.
137. CDC. Prevention and Control of influenza. Recommendations of the Advisory Committee on Immunisation Practices (ACIP). MMWR 2000;49(RR-3):1-38.
DELSA/HEA/WD/HWP(2006)2
140
Scientific Soundness
234. Face validity: The determination of vaccination coverage is a well-established means of measuring the degree of vaccine-induced protection against influenza. The effectiveness of influenza vaccines depends on the degree of similarity with the inactivated vaccine virus strains and those in circulation. In addition, vaccine effectiveness is lower in older and immune compromised persons. In healthy adults < 65 years of age, annual vaccination prevents illness in 70-90% of persons vaccinated when the antigenic match is adequate.138 Vaccination of healthy adults has also been shown to decrease time lost from work as well as use of health care resources. Vaccine efficacy is lower in older persons and those with certain chronic diseases; however, in such cases, the vaccine can still prevent secondary complications and reduce the risk for hospitalisation (by 30-70% among non-institutionalised elderly persons) and death due to influenza. In institutionalised elderly persons, influenza vaccination has been shown to be 50-60% effective in preventing hospitalisation of pneumonia and 80% effective in preventing death, although only 30-40% effective in preventing any illness due to influenza.139 It should also be kept in mind that, depending on the particular institutional arrangements for the provision of care, some countries might not regard vaccination rates as a suitable performance indicator of their health care system.
235. Construct validity: The determination of vaccination coverage is an appropriate means of measuring the proportion of specified groups – in this case specific high risk groups – that have received the specified vaccination – in this case influenza vaccination. The validity of this measure will depend on the quality of vaccination documentation as well as on availability of documentation.
236. Reliability: Reliability of vaccination coverage will depend on the quality of data collected, which depends on the method of data collection and the quality and availability of vaccine documentation.
Feasibility
237. Data availability: Influenza vaccination rates for adults over 65 are available for 20 countries (Table 52). Data provided for years from the 2000/1 flu season to the 2004/5 flu season. One country only counts vaccinations for the flu season between October and December. Two countries use slightly different age ranges. One country includes other high-risk groups in counting the number of vaccinations given. These all appear to be very minor challenges to comparability. Some countries use data from administrative records, other use sample surveys. Some of the countries which use administrative records indicated that there was likely to have been underreporting.
238. Comparability issues: Detailed documentation is provided in Table 52 and an assessment in Table 53. The year, age and minor numerator deviations appear to be only minor threats to comparability. A major threat to comparability issues arises because of different data sources that are susceptible to different types of errors and biases: at some countries use patient surveys and others use administrative data. Surveys, for example, may suffer from incorrect recall, whereas administrative data can only capture vaccination delivered under the payment system covered by the data.
239. Overall assessment: Twenty countries were able to provide data for this indicator. Most countries regularly collect data on vaccination, but some utilised patient records to obtain this data. This indicator is already a part of the OECD Health Data, so there would be little additional collection burden. Over the long term however, for maximum comparability it would be best if the same estimation methods were 138. CDC. Prevention and Control of influenza. Recommendations of the Advisory Committee on
Immunisation Practices (ACIP). MMWR 2000;49(RR-3):1-38. 139. Fleming FM. The contribution of influenza to combined acute respiratory infections, hospital admissions
and death in winter. Commun Dis Public Health 2000;3:32-8.

DELSA/HEA/WD/HWP(2006)2
141
used. Moreover, harmonising recommendations of the HCQI Expert Group with indicator specifications for OECD’s Health Data would be ideal.
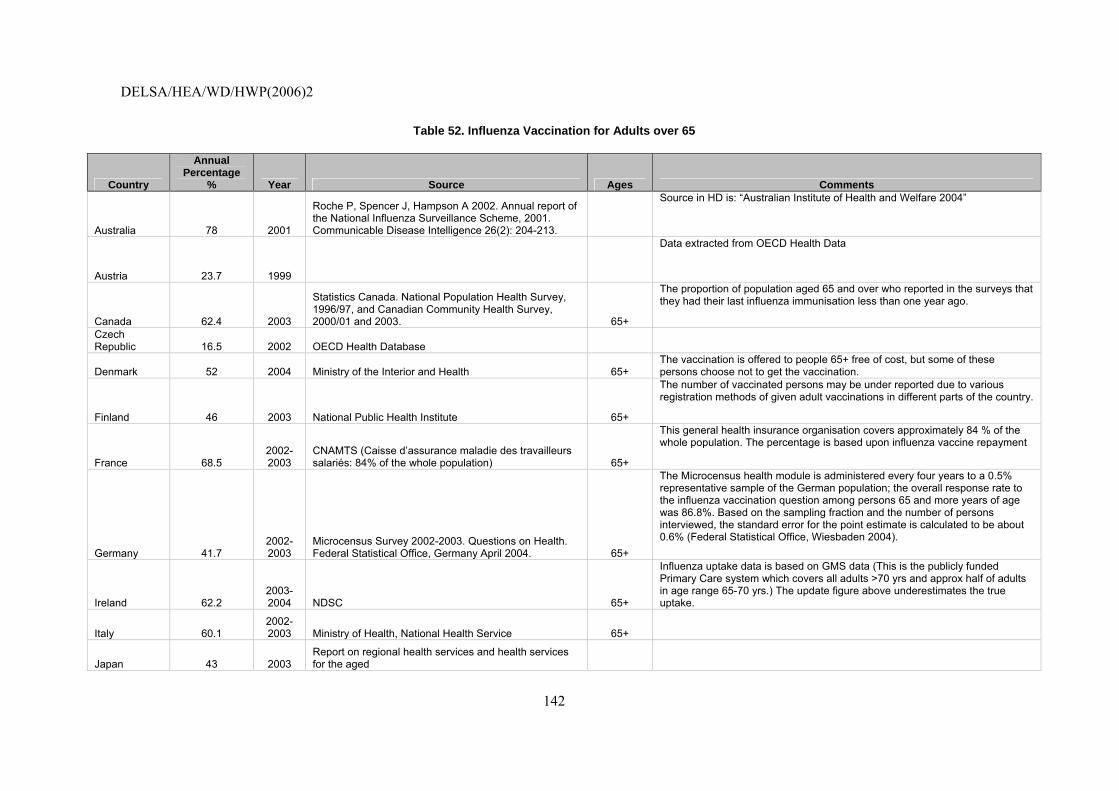
DELSA/HEA/WD/HWP(2006)2
142
Table 52. Influenza Vaccination for Adults over 65
Country
Annual Percentage
% Year Source Ages Comments
Australia 78 2001
Roche P, Spencer J, Hampson A 2002. Annual report of the National Influenza Surveillance Scheme, 2001. Communicable Disease Intelligence 26(2): 204-213.
Source in HD is: “Australian Institute of Health and Welfare 2004”
Austria 23.7 1999
Data extracted from OECD Health Data
Canada 62.4 2003
Statistics Canada. National Population Health Survey, 1996/97, and Canadian Community Health Survey, 2000/01 and 2003. 65+
The proportion of population aged 65 and over who reported in the surveys that they had their last influenza immunisation less than one year ago.
Czech Republic 16.5 2002 OECD Health Database
Denmark 52 2004 Ministry of the Interior and Health 65+ The vaccination is offered to people 65+ free of cost, but some of these persons choose not to get the vaccination.
Finland 46 2003 National Public Health Institute 65+
The number of vaccinated persons may be under reported due to various registration methods of given adult vaccinations in different parts of the country.
France 68.5 2002-2003
CNAMTS (Caisse d’assurance maladie des travailleurs salariés: 84% of the whole population) 65+
This general health insurance organisation covers approximately 84 % of the whole population. The percentage is based upon influenza vaccine repayment
Germany 41.7 2002-2003
Microcensus Survey 2002-2003. Questions on Health. Federal Statistical Office, Germany April 2004. 65+
The Microcensus health module is administered every four years to a 0.5% representative sample of the German population; the overall response rate to the influenza vaccination question among persons 65 and more years of age was 86.8%. Based on the sampling fraction and the number of persons interviewed, the standard error for the point estimate is calculated to be about 0.6% (Federal Statistical Office, Wiesbaden 2004).
Ireland 62.2 2003-2004 NDSC 65+
Influenza uptake data is based on GMS data (This is the publicly funded Primary Care system which covers all adults >70 yrs and approx half of adults in age range 65-70 yrs.) The update figure above underestimates the true uptake.
Italy 60.1 2002-2003 Ministry of Health, National Health Service 65+
Japan 43 2003 Report on regional health services and health services for the aged
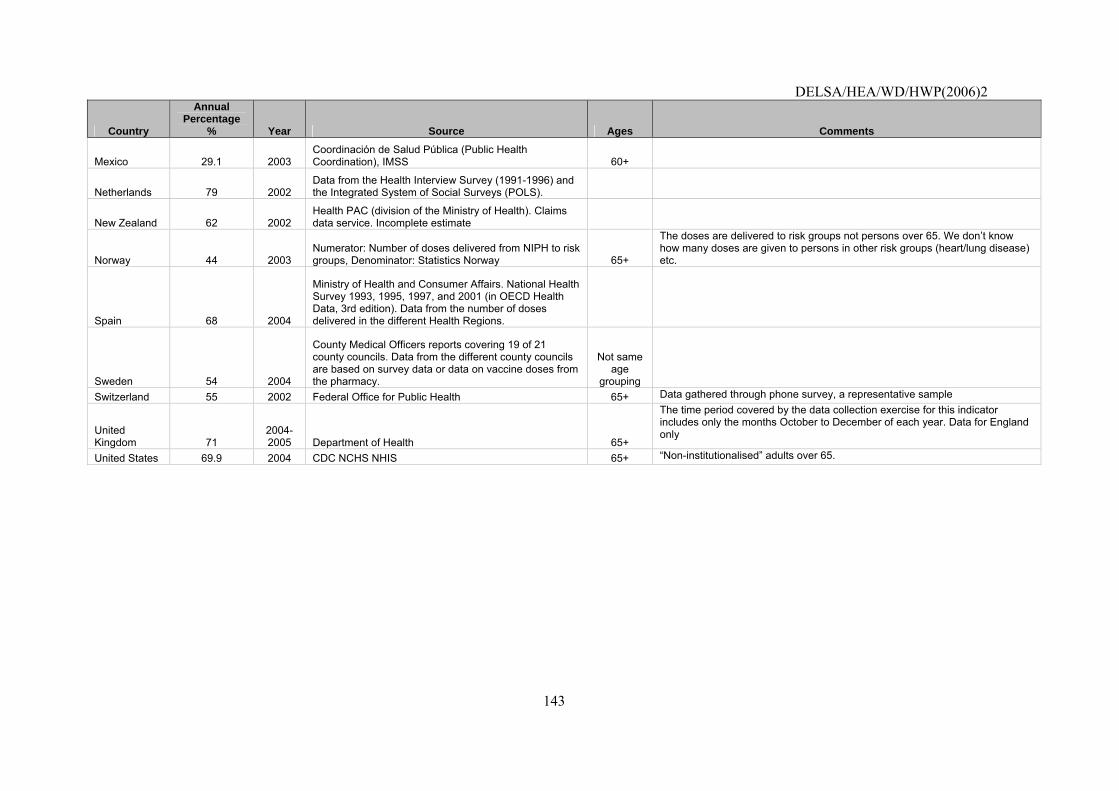
DELSA/HEA/WD/HWP(2006)2
143
Country
Annual Percentage
% Year Source Ages Comments
Mexico 29.1 2003 Coordinación de Salud Pública (Public Health Coordination), IMSS 60+
Netherlands 79 2002 Data from the Health Interview Survey (1991-1996) and the Integrated System of Social Surveys (POLS).
New Zealand 62 2002 Health PAC (division of the Ministry of Health). Claims data service. Incomplete estimate
Norway 44 2003 Numerator: Number of doses delivered from NIPH to risk groups, Denominator: Statistics Norway 65+
The doses are delivered to risk groups not persons over 65. We don’t know how many doses are given to persons in other risk groups (heart/lung disease) etc.
Spain 68 2004
Ministry of Health and Consumer Affairs. National Health Survey 1993, 1995, 1997, and 2001 (in OECD Health Data, 3rd edition). Data from the number of doses delivered in the different Health Regions.
Sweden 54 2004
County Medical Officers reports covering 19 of 21 county councils. Data from the different county councils are based on survey data or data on vaccine doses from the pharmacy.
Not same age
grouping
Switzerland 55 2002 Federal Office for Public Health 65+ Data gathered through phone survey, a representative sample
United Kingdom 71
2004-2005 Department of Health 65+
The time period covered by the data collection exercise for this indicator includes only the months October to December of each year. Data for England only
United States 69.9 2004 CDC NCHS NHIS 65+ “Non-institutionalised” adults over 65.

DELSA/HEA/WD/HWP(2006)2
144
Table 53. Influenza Vaccination for Adults over 65, Comparability Issues
Comparability Implications Minor Severe
Possible 1. Data available for different years
Poss
ibili
ty to
cor
rect
th
e de
viat
ion?
Unlikely 1. Some countries include other high risk groups
1. Some countries use sample surveys, and some countries base data on administrative records 2. Some countries using administrative data know that their information underreports vaccinations each year.
Possible solutions:
• Footnotes can indicate the year and deviations in the numerator, or ages. • Footnote where underreporting is likely; drop data if reliability is of serious concern. • Separate tables should be used for countries using administrative data compared to those using
sample survey data.
DELSA/HEA/WD/HWP(2006)2
145
17. Smoking Rate
Operational definition
Numerator: Number of smokers. Denominator: Total population.
Importance
240. Mortality: Smoking is acknowledged as one of the highest, if not the highest, preventable cause of death across OECD Member countries – with upwards of one in five deaths directly attributable to smoking. In addition, it massively increases the burden of disease, particularly with respect to cardiovascular and respiratory conditions. According to the US Centers for Disease Control and Prevention, cigarette smoking is the leading preventable cause of death in the US Smoking results in more deaths each year in the United States than AIDS, alcohol, cocaine, heroin, homicide, suicide, motor vehicle crashes and fires – combined.140 Tobacco-related deaths number more than 430 000 per year among US adults, representing more than 5 million years of potential life lost.141
241. Cost: It is estimated that smoking results in over $75 billion per year in medical expenditures and another $80 billion per year resulting from lost productivity.142
Scientific Soundness
242. Face validity: While it is difficult to clearly attribute cause and effect given the numerous factors interplaying in relation to decisions to smoke or cease smoking, measurement of smoking rate is the most accessible way to indicate trends in society where the quality of the approach in primary care can be investigated, if studied in conjunction with relevant policy and legal initiatives. But it should be kept in mind that, depending on the particular institutional arrangements for the provision of care, some countries might not regard smoking rates as a suitable performance indicator of their health care system.
243. Construct validity: Definitional work by WHO EUROHIS and US sources, such as CDC amongst many others, given the importance attached to this area, show that convergence on an appropriate measure for this concept can be achieved.
244. Reliability: This indicator may be affected by differences in definition of “daily smokers” and whether the individual smokes cigarettes only or also includes the use of cigarillos, pipes, and other forms of tobacco. International comparability is limited due to the lack of standardisation in the measurement of smoking habits in health interview surveys across OECD countries. There is variation in the wording of questions, the response categories and the related administrative methods.143
140. CDC website. Available at http://www.cdc.gov/tobacco/research_data/health_consequences/mortali.htm. Accessed
August, 2004.
141. CDC. Smoking-attributable mortality and years of potential life lost — United States, 1990. Morbidity and Mortality Weekly Report 1993;42(33):645-8.
142. CDC. Tobacco Use at a Glance. Available at http://www.cdc.gov/nccdphp/aag/pdf/aag_osh2004.pdf. Accessed August, 2004.
143. A standard health interview survey instrument to measure smoking habits in a population has been recommended by the WHO Regional Office for Europe. The recommendation is described in detail in the publication: “Health Interview Surveys: Toward International Harmonisation of Methods and Instruments” WHO Regional Office for Europe, 1996.
DELSA/HEA/WD/HWP(2006)2
146
Feasibility
245. Data availability: Smoking rates are available for 22 countries (Table 54). The smoking rate data were for the years 1999-2004. Eight countries use slightly different age ranges. One country uses both “regular and occasional” smokers instead of daily smokers.
246. Comparability issues: Detailed documentation is provided in Table 54 and an assessment in Table 55. As all smoking data is collected by surveys, the key to comparability is ensuring that the surveys are asking the same equivalent questions. This survey did not ask for the specific country question text, but from the regular collection of OECD Health Data we know that most countries ask a respondent whether they are a daily smoker. The surveys may vary in terms of survey method, and survey instrument. This may compromise international comparability if the different methods systematically under or over reported the proportion of average daily smokers. However, ongoing efforts to standardise data definitions for OECD Health Data are likely to remedy residual comparability issues in the future.
247. Overall assessment: Twenty-two countries were able to provide data for this indicator. Most countries regularly collect data on smoking rates. This indicator is already a part of the OECD Health Data, so there would be little additional collection burden.
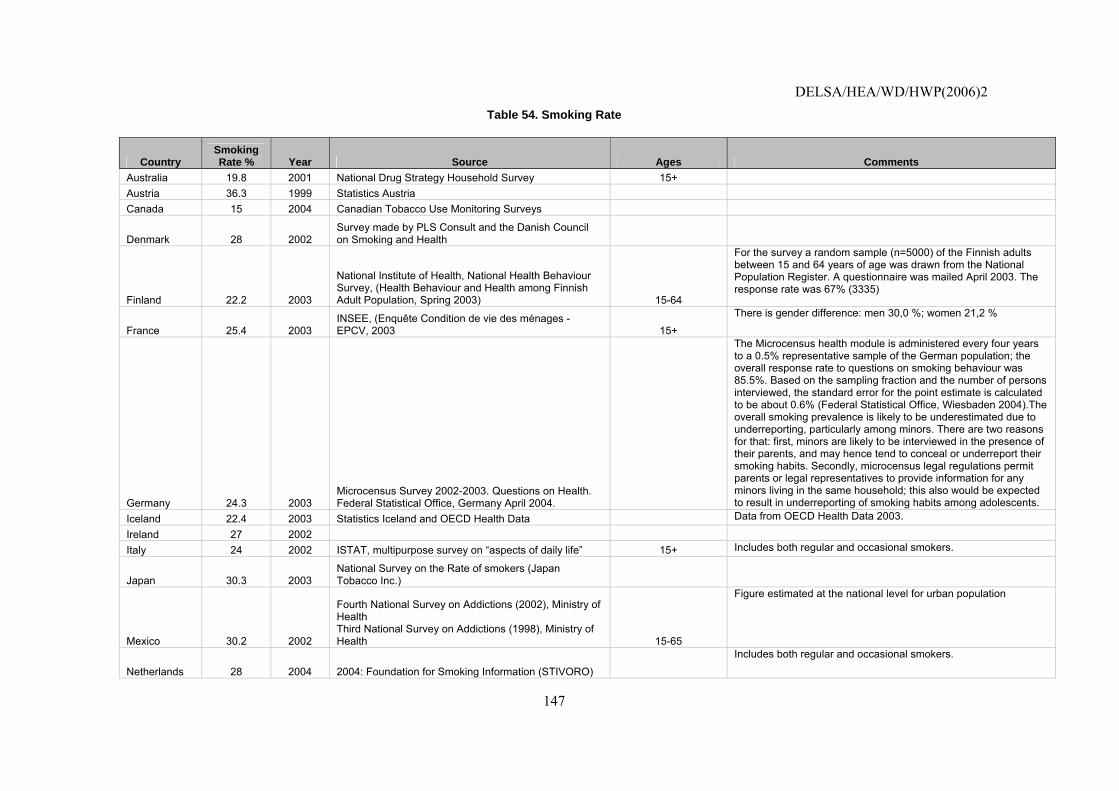
DELSA/HEA/WD/HWP(2006)2
147
Table 54. Smoking Rate
Country Smoking Rate % Year Source Ages Comments
Australia 19.8 2001 National Drug Strategy Household Survey 15+
Austria 36.3 1999 Statistics Austria
Canada 15 2004 Canadian Tobacco Use Monitoring Surveys
Denmark 28 2002 Survey made by PLS Consult and the Danish Council on Smoking and Health
Finland 22.2 2003
National Institute of Health, National Health Behaviour Survey, (Health Behaviour and Health among Finnish Adult Population, Spring 2003) 15-64
For the survey a random sample (n=5000) of the Finnish adults between 15 and 64 years of age was drawn from the National Population Register. A questionnaire was mailed April 2003. The response rate was 67% (3335)
France 25.4 2003 INSEE, (Enquête Condition de vie des ménages - EPCV, 2003 15+
There is gender difference: men 30,0 %; women 21,2 %
Germany 24.3 2003 Microcensus Survey 2002-2003. Questions on Health. Federal Statistical Office, Germany April 2004.
The Microcensus health module is administered every four years to a 0.5% representative sample of the German population; the overall response rate to questions on smoking behaviour was 85.5%. Based on the sampling fraction and the number of persons interviewed, the standard error for the point estimate is calculated to be about 0.6% (Federal Statistical Office, Wiesbaden 2004).The overall smoking prevalence is likely to be underestimated due to underreporting, particularly among minors. There are two reasons for that: first, minors are likely to be interviewed in the presence of their parents, and may hence tend to conceal or underreport their smoking habits. Secondly, microcensus legal regulations permit parents or legal representatives to provide information for any minors living in the same household; this also would be expected to result in underreporting of smoking habits among adolescents.
Iceland 22.4 2003 Statistics Iceland and OECD Health Data Data from OECD Health Data 2003.
Ireland 27 2002
Italy 24 2002 ISTAT, multipurpose survey on “aspects of daily life” 15+ Includes both regular and occasional smokers.
Japan 30.3 2003 National Survey on the Rate of smokers (Japan Tobacco Inc.)
Mexico 30.2 2002
Fourth National Survey on Addictions (2002), Ministry of Health Third National Survey on Addictions (1998), Ministry of Health 15-65
Figure estimated at the national level for urban population
Netherlands 28 2004 2004: Foundation for Smoking Information (STIVORO)
Includes both regular and occasional smokers.
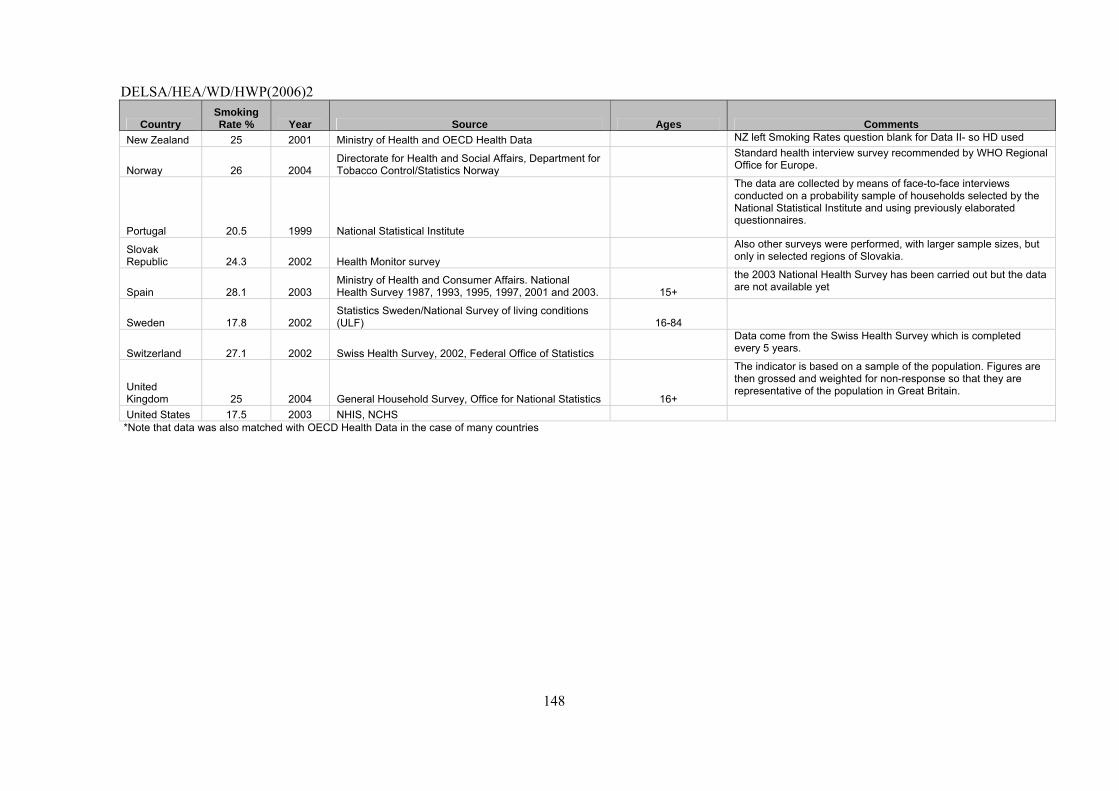
DELSA/HEA/WD/HWP(2006)2
148
Country Smoking Rate % Year Source Ages Comments
New Zealand 25 2001 Ministry of Health and OECD Health Data NZ left Smoking Rates question blank for Data II- so HD used
Norway 26 2004 Directorate for Health and Social Affairs, Department for Tobacco Control/Statistics Norway
Standard health interview survey recommended by WHO Regional Office for Europe.
Portugal 20.5 1999 National Statistical Institute
The data are collected by means of face-to-face interviews conducted on a probability sample of households selected by the National Statistical Institute and using previously elaborated questionnaires.
Slovak Republic 24.3 2002 Health Monitor survey
Also other surveys were performed, with larger sample sizes, but only in selected regions of Slovakia.
Spain 28.1 2003 Ministry of Health and Consumer Affairs. National Health Survey 1987, 1993, 1995, 1997, 2001 and 2003. 15+
the 2003 National Health Survey has been carried out but the data are not available yet
Sweden 17.8 2002 Statistics Sweden/National Survey of living conditions (ULF) 16-84
Switzerland 27.1 2002 Swiss Health Survey, 2002, Federal Office of Statistics
Data come from the Swiss Health Survey which is completed every 5 years.
United Kingdom 25 2004 General Household Survey, Office for National Statistics 16+
The indicator is based on a sample of the population. Figures are then grossed and weighted for non-response so that they are representative of the population in Great Britain.
United States 17.5 2003 NHIS, NCHS *Note that data was also matched with OECD Health Data in the case of many countries
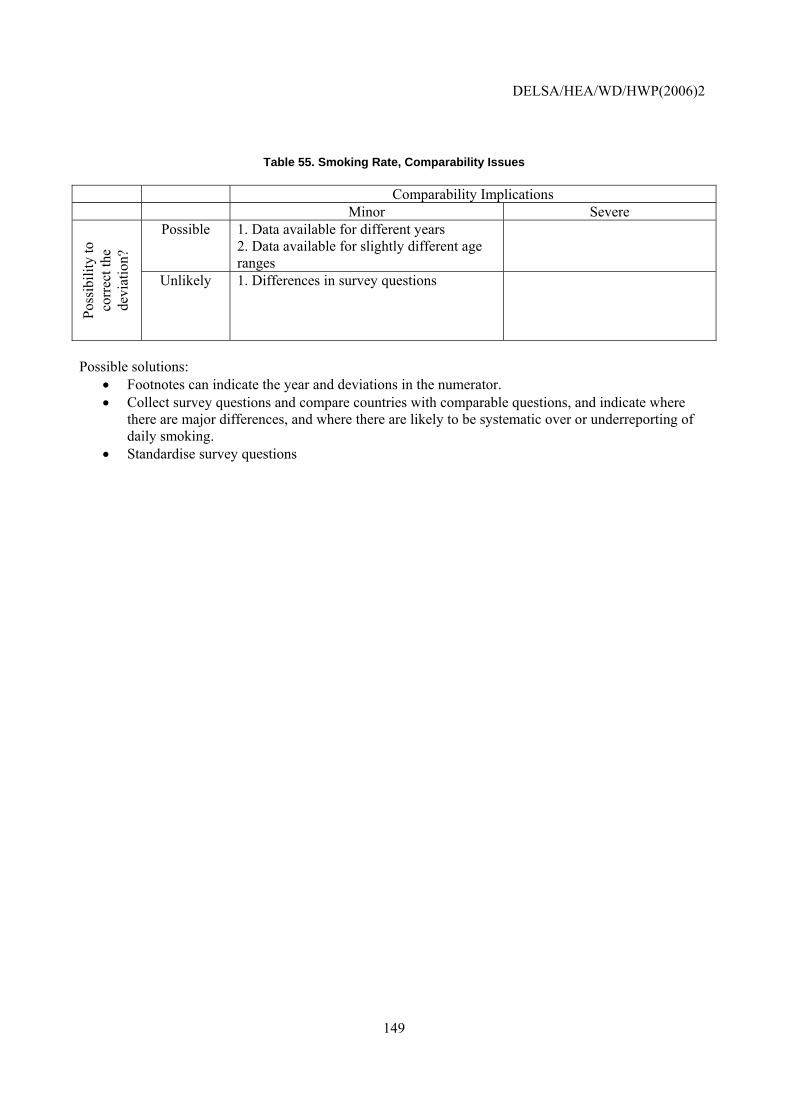
DELSA/HEA/WD/HWP(2006)2
149
Table 55. Smoking Rate, Comparability Issues
Comparability Implications Minor Severe
Possible 1. Data available for different years 2. Data available for slightly different age ranges
Poss
ibili
ty to
co
rrec
t the
de
viat
ion?
Unlikely 1. Differences in survey questions
Possible solutions:
• Footnotes can indicate the year and deviations in the numerator. • Collect survey questions and compare countries with comparable questions, and indicate where
there are major differences, and where there are likely to be systematic over or underreporting of daily smoking.
• Standardise survey questions
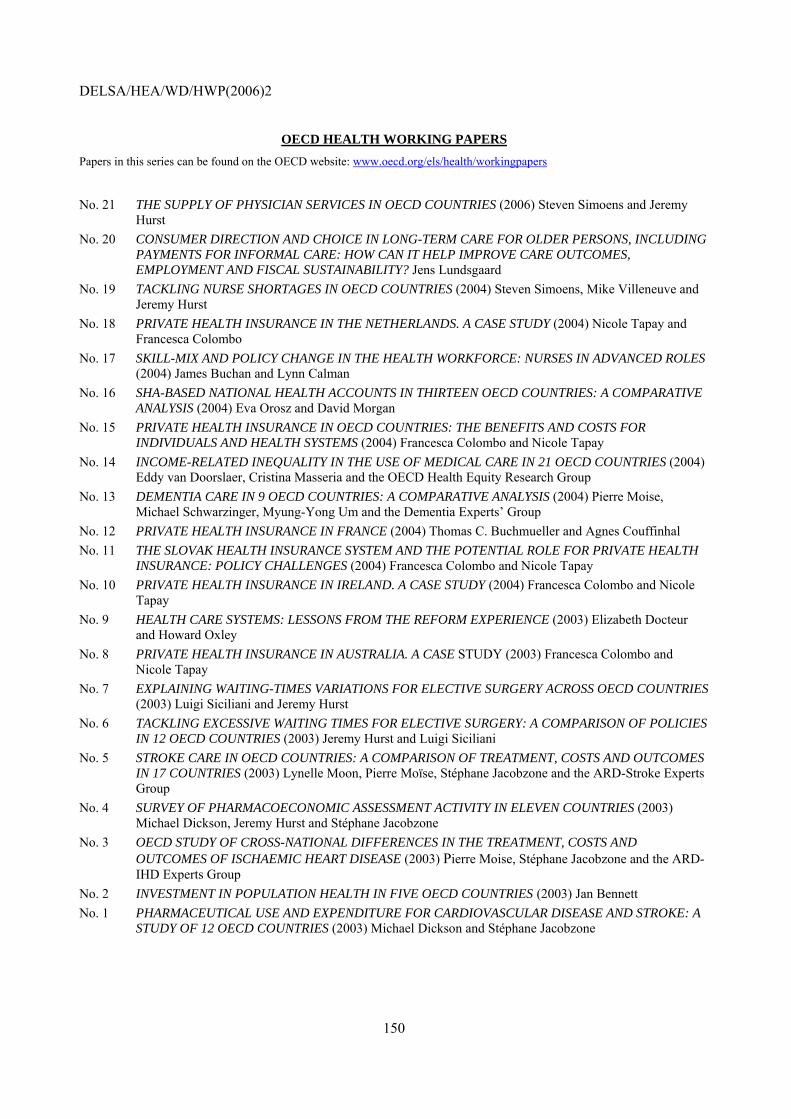
DELSA/HEA/WD/HWP(2006)2
150
OECD HEALTH WORKING PAPERS Papers in this series can be found on the OECD website: www.oecd.org/els/health/workingpapers
No. 21 THE SUPPLY OF PHYSICIAN SERVICES IN OECD COUNTRIES (2006) Steven Simoens and Jeremy Hurst
No. 20 CONSUMER DIRECTION AND CHOICE IN LONG-TERM CARE FOR OLDER PERSONS, INCLUDING PAYMENTS FOR INFORMAL CARE: HOW CAN IT HELP IMPROVE CARE OUTCOMES, EMPLOYMENT AND FISCAL SUSTAINABILITY? Jens Lundsgaard
No. 19 TACKLING NURSE SHORTAGES IN OECD COUNTRIES (2004) Steven Simoens, Mike Villeneuve and Jeremy Hurst
No. 18 PRIVATE HEALTH INSURANCE IN THE NETHERLANDS. A CASE STUDY (2004) Nicole Tapay and Francesca Colombo
No. 17 SKILL-MIX AND POLICY CHANGE IN THE HEALTH WORKFORCE: NURSES IN ADVANCED ROLES (2004) James Buchan and Lynn Calman
No. 16 SHA-BASED NATIONAL HEALTH ACCOUNTS IN THIRTEEN OECD COUNTRIES: A COMPARATIVE ANALYSIS (2004) Eva Orosz and David Morgan
No. 15 PRIVATE HEALTH INSURANCE IN OECD COUNTRIES: THE BENEFITS AND COSTS FOR INDIVIDUALS AND HEALTH SYSTEMS (2004) Francesca Colombo and Nicole Tapay
No. 14 INCOME-RELATED INEQUALITY IN THE USE OF MEDICAL CARE IN 21 OECD COUNTRIES (2004) Eddy van Doorslaer, Cristina Masseria and the OECD Health Equity Research Group
No. 13 DEMENTIA CARE IN 9 OECD COUNTRIES: A COMPARATIVE ANALYSIS (2004) Pierre Moise, Michael Schwarzinger, Myung-Yong Um and the Dementia Experts’ Group
No. 12 PRIVATE HEALTH INSURANCE IN FRANCE (2004) Thomas C. Buchmueller and Agnes Couffinhal No. 11 THE SLOVAK HEALTH INSURANCE SYSTEM AND THE POTENTIAL ROLE FOR PRIVATE HEALTH
INSURANCE: POLICY CHALLENGES (2004) Francesca Colombo and Nicole Tapay No. 10 PRIVATE HEALTH INSURANCE IN IRELAND. A CASE STUDY (2004) Francesca Colombo and Nicole
Tapay No. 9 HEALTH CARE SYSTEMS: LESSONS FROM THE REFORM EXPERIENCE (2003) Elizabeth Docteur
and Howard Oxley No. 8 PRIVATE HEALTH INSURANCE IN AUSTRALIA. A CASE STUDY (2003) Francesca Colombo and
Nicole Tapay No. 7 EXPLAINING WAITING-TIMES VARIATIONS FOR ELECTIVE SURGERY ACROSS OECD COUNTRIES
(2003) Luigi Siciliani and Jeremy Hurst No. 6 TACKLING EXCESSIVE WAITING TIMES FOR ELECTIVE SURGERY: A COMPARISON OF POLICIES
IN 12 OECD COUNTRIES (2003) Jeremy Hurst and Luigi Siciliani No. 5 STROKE CARE IN OECD COUNTRIES: A COMPARISON OF TREATMENT, COSTS AND OUTCOMES
IN 17 COUNTRIES (2003) Lynelle Moon, Pierre Moïse, Stéphane Jacobzone and the ARD-Stroke Experts Group
No. 4 SURVEY OF PHARMACOECONOMIC ASSESSMENT ACTIVITY IN ELEVEN COUNTRIES (2003) Michael Dickson, Jeremy Hurst and Stéphane Jacobzone
No. 3 OECD STUDY OF CROSS-NATIONAL DIFFERENCES IN THE TREATMENT, COSTS AND OUTCOMES OF ISCHAEMIC HEART DISEASE (2003) Pierre Moise, Stéphane Jacobzone and the ARD-IHD Experts Group
No. 2 INVESTMENT IN POPULATION HEALTH IN FIVE OECD COUNTRIES (2003) Jan Bennett No. 1 PHARMACEUTICAL USE AND EXPENDITURE FOR CARDIOVASCULAR DISEASE AND STROKE: A
STUDY OF 12 OECD COUNTRIES (2003) Michael Dickson and Stéphane Jacobzone
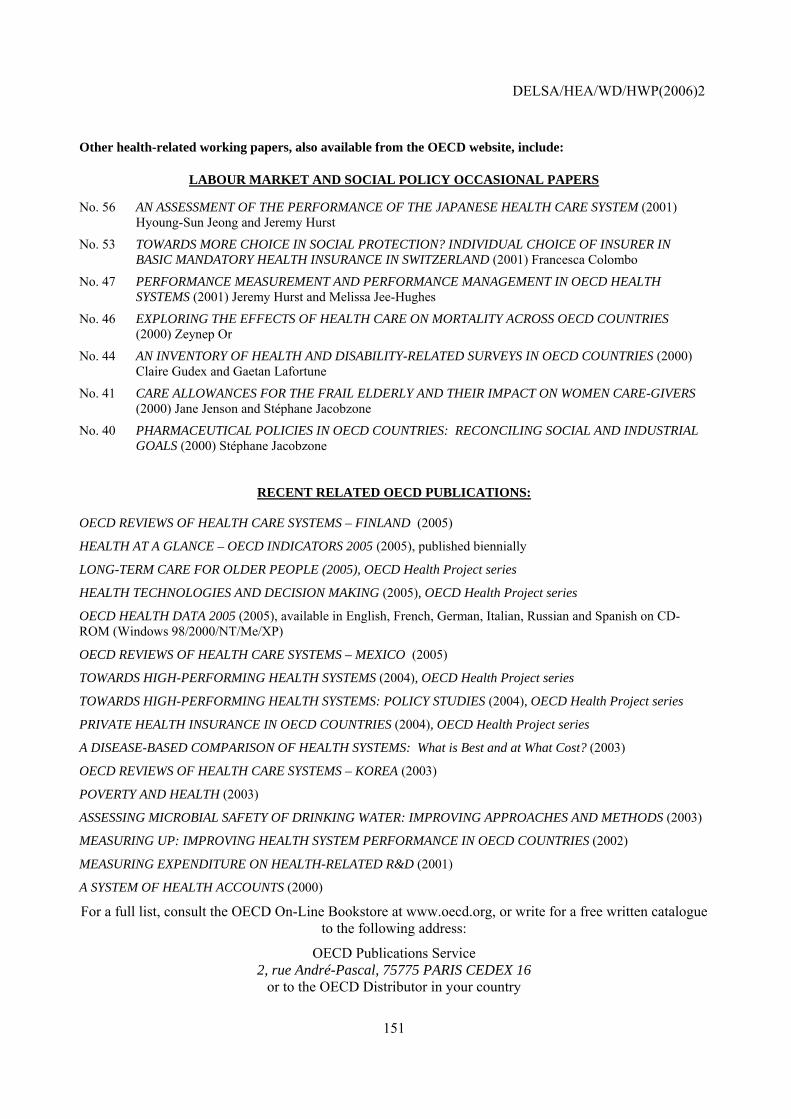
DELSA/HEA/WD/HWP(2006)2
151
Other health-related working papers, also available from the OECD website, include:
LABOUR MARKET AND SOCIAL POLICY OCCASIONAL PAPERS No. 56 AN ASSESSMENT OF THE PERFORMANCE OF THE JAPANESE HEALTH CARE SYSTEM (2001)
Hyoung-Sun Jeong and Jeremy Hurst
No. 53 TOWARDS MORE CHOICE IN SOCIAL PROTECTION? INDIVIDUAL CHOICE OF INSURER IN BASIC MANDATORY HEALTH INSURANCE IN SWITZERLAND (2001) Francesca Colombo
No. 47 PERFORMANCE MEASUREMENT AND PERFORMANCE MANAGEMENT IN OECD HEALTH SYSTEMS (2001) Jeremy Hurst and Melissa Jee-Hughes
No. 46 EXPLORING THE EFFECTS OF HEALTH CARE ON MORTALITY ACROSS OECD COUNTRIES (2000) Zeynep Or
No. 44 AN INVENTORY OF HEALTH AND DISABILITY-RELATED SURVEYS IN OECD COUNTRIES (2000) Claire Gudex and Gaetan Lafortune
No. 41 CARE ALLOWANCES FOR THE FRAIL ELDERLY AND THEIR IMPACT ON WOMEN CARE-GIVERS (2000) Jane Jenson and Stéphane Jacobzone
No. 40 PHARMACEUTICAL POLICIES IN OECD COUNTRIES: RECONCILING SOCIAL AND INDUSTRIAL GOALS (2000) Stéphane Jacobzone
RECENT RELATED OECD PUBLICATIONS:
OECD REVIEWS OF HEALTH CARE SYSTEMS – FINLAND (2005)
HEALTH AT A GLANCE – OECD INDICATORS 2005 (2005), published biennially
LONG-TERM CARE FOR OLDER PEOPLE (2005), OECD Health Project series
HEALTH TECHNOLOGIES AND DECISION MAKING (2005), OECD Health Project series
OECD HEALTH DATA 2005 (2005), available in English, French, German, Italian, Russian and Spanish on CD-ROM (Windows 98/2000/NT/Me/XP)
OECD REVIEWS OF HEALTH CARE SYSTEMS – MEXICO (2005)
TOWARDS HIGH-PERFORMING HEALTH SYSTEMS (2004), OECD Health Project series
TOWARDS HIGH-PERFORMING HEALTH SYSTEMS: POLICY STUDIES (2004), OECD Health Project series
PRIVATE HEALTH INSURANCE IN OECD COUNTRIES (2004), OECD Health Project series
A DISEASE-BASED COMPARISON OF HEALTH SYSTEMS: What is Best and at What Cost? (2003)
OECD REVIEWS OF HEALTH CARE SYSTEMS – KOREA (2003)
POVERTY AND HEALTH (2003)
ASSESSING MICROBIAL SAFETY OF DRINKING WATER: IMPROVING APPROACHES AND METHODS (2003)
MEASURING UP: IMPROVING HEALTH SYSTEM PERFORMANCE IN OECD COUNTRIES (2002)
MEASURING EXPENDITURE ON HEALTH-RELATED R&D (2001)
A SYSTEM OF HEALTH ACCOUNTS (2000)
For a full list, consult the OECD On-Line Bookstore at www.oecd.org, or write for a free written catalogue to the following address:
OECD Publications Service 2, rue André-Pascal, 75775 PARIS CEDEX 16
or to the OECD Distributor in your country