health and the political agency of womenftp.iza.org/dp6216.pdf · health and the political agency...
TRANSCRIPT

DI
SC
US
SI
ON
P
AP
ER
S
ER
IE
S
Forschungsinstitut zur Zukunft der ArbeitInstitute for the Study of Labor
Health and the Political Agency of Women
IZA DP No. 6216
December 2011
Sonia BhalotraIrma Clots-Figueras

Health and the
Political Agency of Women
Sonia Bhalotra University of Bristol
and IZA
Irma Clots-Figueras Universidad Carlos III de Madrid
Discussion Paper No. 6216 December 2011
IZA
P.O. Box 7240 53072 Bonn
Germany
Phone: +49-228-3894-0 Fax: +49-228-3894-180
E-mail: [email protected]
Any opinions expressed here are those of the author(s) and not those of IZA. Research published in this series may include views on policy, but the institute itself takes no institutional policy positions. The Institute for the Study of Labor (IZA) in Bonn is a local and virtual international research center and a place of communication between science, politics and business. IZA is an independent nonprofit organization supported by Deutsche Post Foundation. The center is associated with the University of Bonn and offers a stimulating research environment through its international network, workshops and conferences, data service, project support, research visits and doctoral program. IZA engages in (i) original and internationally competitive research in all fields of labor economics, (ii) development of policy concepts, and (iii) dissemination of research results and concepts to the interested public. IZA Discussion Papers often represent preliminary work and are circulated to encourage discussion. Citation of such a paper should account for its provisional character. A revised version may be available directly from the author.

IZA Discussion Paper No. 6216 December 2011
ABSTRACT
Health and the Political Agency of Women* We investigate whether politician gender influences policy outcomes in India. We focus upon antenatal and postnatal public health provision since the costs of poor services in this domain are disproportionately borne by women. Accounting for potential endogeneity of politician gender and the sample composition of births, we find that a one standard deviation increase in women’s political representation results in a 1.5 percentage point reduction in neonatal mortality. Women politicians are more likely to build public health facilities and encourage antenatal care, institutional delivery and immunization. The results are topical given that a bill proposing quotas for women in state assemblies is currently pending in the Indian Parliament. JEL Classification: H41, I18, O15 Keywords: political identity, gender, mortality, health, social preferences, India Corresponding author: Sonia Bhalotra Department of Economics University of Bristol 8 Woodland Road Bristol BS8 1TN United Kingdom E-mail: [email protected]
* We benefited from presenting this paper at the American Economic Association meetings, the Workshop on Gender Economics (FEDEA), a CEPR/BREAD/AMID conference in London, the NEUDC, the Indian Statistical Institute Delhi, the Public Health Foundation Delhi, the University of Oxford and NHH Bergen.

2
1. Introduction
This paper investigates whether women elected to state legislative assemblies are more
effective than their male counterparts in providing public health services in India. It binds two
streams of the literature, one concerned with political identity and the other with differences in
preferences between the sexes. In the benchmark model of democracy, policy choices are
independent of legislator identity (Downs 1957) but not in more recent citizen candidate models
(Besley and Coate 1997, Levitt 1996, Osborne and Slivinski 1996). Overlaid on the hypothesis
that the gender of politicians influences policy and thereby social outcomes is the hypothesis that
women have different preferences and so make different choices from men. Establishing the
empirical relevance of these differences is key to informing debates over quotas for women in
government, debates which refer to representation as much as to principles of fairness and
diversity (Squires 1996), but which suffer from a scarcity of causal evidence of the impact of
representation on policy outcomes.
Preference differences between the sexes identified in numerous settings suggest that
women are more likely than men to (i) invest in children and (ii) favour redistribution.1 These
findings suggest that women may be more likely to deliver public health improvements in
developing countries where there are sharp positive age and income gradients in health and the
essential policy challenge lies in addressing the early life health and survival of children in poor
families.2 Moreover, the benefits of interventions in this area flow differentially to women
because they disproportionately bear the costs of weak reproductive and child health services.
Women carry the burden of high fertility and child mortality: they care for the sick, witness their
children die, have further births, and risk dying in child birth.3 In line with our hypothesis, the
enfranchisement of women in early 20th century America led to a sharp rise in state health
expenditure and a steep drop in infant mortality (Miller 2008). And, strikingly, results of the
1 On (i), see Thomas 1990, Thomas and Welch 1991, Hoddinott 1995, Lundberg, Pollak and Wales 1997, Case 1998, Svaleryd 2002, Besley and Case 2003). One possible explanation of this is paternity uncertainty (Alexander 1974). On (ii), see Besley and Case 2000, Andreoni and Vesterlund 2001, Edlund and Pande 2002, Edlund, Haider and Pande 2005, Warner and Steel 1999, Washington 2008, Oswald and Powdthavee 2010. This has been linked to women being, on average, less likely to pay taxes and more likely to receive benefits (e.g. Alessina and La Ferrara 2005). 2 Early childhood death accounts for 30% of all deaths in poor countries compared with 1% in richer countries (Cutler et al. 2007). There are vast inequalities in health within poor countries and most childhood deaths occur in poor households. 3 In the sample period, almost one in ten children died in India before the age of one. Structural estimates on data from the Indian state of Uttar Pradesh indicate that for every neonatal death (which we analyse here), women have an additional 0.37 births (Bhalotra and van Soest 2008). Maternal mortality as a fraction of births is estimated at 0.5% (UNICEF).

3
British Election Survey of 2001 show that the single most important concern for men is low
taxes while, for women, it is the quality of the National Health Service (Campbell 2004).4
Most of the available evidence pertains to the agency of women as mothers and voters.
But, even if women in society have different preferences from men it does not necessarily follow
that female politicians will make different policy choices than male politicians. Under complete
policy commitment, policy choices reflect voter preferences and not politician identity but recent
models of democracy relax the assumption of complete policy commitment (Besley and Coate
1997, Osborne and Slivinski 1996). Hence evidence of the relevance of leader gender in politics
is informative of which of alternative characterisations of the democratic process is more
accurate. There is as yet only a small literature that delivers causal estimates of the political
agency of women (Duflo and Chattopadhyay 2004, Rehavi 2007, Beaman et al. 2009, Svaleryd
2009, Iyer et. al. 2011, Deininger et al. 2011, Clots-Figueras 2011, Clots-Figueras forthcoming). We
contribute to this literature in providing the first systematic analysis of the influence of women
elected to state legislative assemblies on the provision and effectiveness of public health services
for women and children.5
The failure of public health provision in developing countries is gaining increasing
attention in the global arena (Black et al. 2003) and in India (DasGupta 2007). Poverty is not a
compelling explanation for the scale of (maternal and) child death given that most deaths can be
averted by low cost interventions (Cutler et al. 2006). The evidence points to political failure
(Kiefer and Khemani 2003) but there is limited discussion of the potential significance of
women’s representation in improving the delivery of health services.
This is topical given that the Women's Reservation Bill proposing that a third of seats in
state assemblies and parliament be reserved for women is currently under debate. The Bill was
introduced in September 1996 and passed by the Rajya Sabha (Upper House) in March 2010 but
is pending in the Lok Sabha (Lower House). Political reservations for women were successfully
introduced in local government as part of a decentralisation package reflected in the 73rd
Constitutional Amendment, effective 1993. This was a victory for India’s women’s movement,
which emphasised the grassroots involvement of village women in village-level development
programmes. The more limited support for the move to introduce reservations in state and
national parliaments reflects, in part, a concern that women who claim those seats will tend to be
4 At the turn of the century, fertility and infant mortality rates in America were similar to those in our estimation sample for India. In Britain in 2001, both were dramatically smaller. Even so, most women expect to engage with public health services at least once through pregnancy and this makes them heavier users, other conditions equal. The greater concern of women for public health in contemporary Britain may also reflect their representation of children and of the poor. 5 We delineate further contributions of our work below and discuss earlier findings in section 2.

4
elite and therefore unlikely to represent the interests of the majority of women citizens ((Mishra
2000, Rai 2002). Here we effectively test the hypothesis that this implies their detachment from
the interests of the common woman.
The available evidence of women’s political agency in India (cited above) does not
illuminate this question, as it largely pertains to women in village councils (Gram Panchayats).
Also, most of this evidence concerns women’s headship, while we investigate incremental
changes in women’s political representation. In particular we investigate whether the district-level
share of state assembly constituencies in which a woman is elected influences individual health
outcomes and village public goods in the district. This is an importantly different question.
Women occupy a small share of seats in state assemblies and it is conceivable that incremental
changes in their share will have limited policy influence even if their headship counts. Our focus
on political representation in state assemblies is relevant since this is the level at which most
decisions pertaining to public health provision were made until 1993 (Rao and Singh 1998). Even
after 1993, when powers over the implementation of developmental projects were devolved to
the district and village level, state legislators continued to have substantial say and to play a
potentially important role in negotiation with and coordination across layers of local
government. In the empirical analysis we allow for a break in the coefficient of interest in 1993,
and a further contribution of our work is that it provides evidence of the policy relevance of
women’s political representation for a longer period of India’s democratic history, prior to 1993.
Since the reservation of a third of the headships of village councils within each state was
randomised (by dictate), studies of politician gender in Indian panchayats have exploited quasi
experimental data to identify causal effects. However, as the authors recognise, reservation may
have direct effects on policy outcomes by changing the nature of political competition
(Franceschet et al. 2009). The current project investigates the policy influence of competitively
elected women. This leads us to different identification issues.
The main identification challenge is that the gender of a competitively elected leader is
potentially endogenous. For instance, more progressive electorates may be more likely to elect
women and, independently, more likely to invest in child health. A further potential problem is
that the composition of births is endogenous to the political regime. We address these problems
using a fixed effects instrumental variables estimator that exploits constituency-level information
on close elections between men and women on the one hand and information on siblings in a
large sample survey on the other (section 4). The estimation sample contains more than 70000
individual births to some 18000 mothers that occur across 246 districts (in 16 states) over the 32
year period, 1967-1998 matched to electoral data.

5
We find that a one standard deviation increase in women’s political representation in the
birth year (and similarly in the two years preceding birth) results in a 1.5 percentage point (24%)
reduction in neonatal mortality, which is a 0.06 standard deviation change. These changes in
neonatal mortality drive similarly large impacts on infant mortality. To put this effect size in
perspective, consider that the causal impact of democratization on infant mortality in sub-
Saharan Africa in the post-Cold War period is estimated to be a 1.2% point drop in infant
mortality, which is 12% of the sample mean (Kudamatsu forthcoming).
These estimates stand up to a battery of robustness checks and we report several
extensions. We also identify mechanisms consistent with politician gender exerting an impact on
both the health infrastructure and the information and encouragement that recent studies
suggest is important in determining the demand for public health services. Using village level
data and instrumenting as before using close elections, we find that women politicians are more
likely to invest in the village level public health infrastructure while men are more likely to invest
in the financial (and telecommunications) infrastructure. However public health facilities in India
are often poorly staffed (Das and Hammer 2007, Banerjee, Deaton and Duflo 2003) and uptake
of publicly provided services such as immunization low (Banerjee et al. 2011). So we also
investigated a range of indicators of the utilization of publicly provided health inputs, all of
which have established impacts on childhood mortality risk. Using a smaller sample of more
recent births and a similar identification strategy to that in the main analysis, we find that raising
female political representation results in substantially improved probabilities of attending
antenatal care, taking iron supplements during pregnancy, giving birth in a government facility as
opposed to at home (note: we establish no change in the probability of giving birth in a private
facility), early initiation of breastfeeding, and full immunization by the age of one. We argue that
impacts on early breastfeeding and antenatal care, for instance, are consistent with politician-led
information campaigns.
Overall, we establish the effectiveness of women politicians in delivering public health.
Our results reject the Downsian model in favour of more recent citizen-candidate models of
political identity. They resonate with a diverse literature, different segments of which suggest that
women exhibit a stronger propensity to invest in children and have more progressive social
preferences.
2. Background: Women and Politics in India
India is the largest and oldest democracy in the developing world. It is a federal country
in which the constitution devolves significant control over their own government to the 28 states
and 7 union territories and population health in particular falls under the purview of State

6
Legislative Assemblies. States and union territories are divided into single-member constituencies
in which candidates are elected in first-past-the-post elections. The boundaries of assembly
constituencies are drawn to make sure that there are, as near as practicable, the same number of
inhabitants in each constituency. Thus, state assemblies vary in size with the state population.
Districts are an important level of local government between state and village governments.
Women are severely under-represented in politics the world over and India is no
different (section 3a).6 Using data from two states and comparing villages with and without
reserved headship for women, Duflo and Chattopadhyay (2004) and Beaman et al. (2007) find
that the composition of public infrastructure at the village level is a function of the gender of the
leader, with women being more likely to invest in drinking water and roads. Other studies
identify impacts of women’s village council headship on political participation (Beaman et al.
2007, 2009, Deininger et al. 2011) and the willingness of women to report crimes against them
(Iyer et al. 2011). The only previous analysis of women in state assemblies in India is in Clots-
Figueras (2011), Clots-Figueras (forthcoming) who establishes impacts on state budgets and urban
primary education respectively using close election data. We motivate a substantive focus on
health and complement close election data with sibling data to account for mother-level
unobserved heterogeneity in preferences, which can affect the timing of births. In the wider
international domain the only related study that we are aware of is Rehavi (2007) who also uses
close election data and finds that state health expenditure in the United States is increasing in the
share of women in state legislatures. Since state health expenditure has a bad press in developing
countries (Filmer and Pritchett 1999, Filmer, Hammer and Pritchett 2000), we investigate
indicators of public health provision that more directly measure the effectiveness of state
intervention, and at a more local level.
3. Data and Descriptive Statistics
Political Variables: A detailed dataset on every constituency election to State
Legislatures in India during 1967-2001 was gathered from publications of the Election
Commission of India. From this we draw the gender of the winning candidate and the runner up
and the number of votes obtained by each. The data contain information on 29686 politicians
who contested in the 16 larger states.7 This is aggregated to the district level to produce the
6 There are improvements on this front and India’s rank in a recent index of women’s political empowerment was not much below that of the UK. India held the rank of 113 in 134 countries in the Global Gender Gap Index for 2008, averaging over gaps in education, health, economic participation and political empowerment. Isolating political empowerment, India ranked 28th. In contrast, the UK ranked 13th on average but 21st on political empowerment. 7 These 16 states account for more than 90 per cent of the total population in India, about 935 million people. They are Andhra Pradesh, Assam, Bihar, Gujarat, Haryana, Jammu & Kashmir, Karnataka,

7
district-level share of state assembly constituencies to which a woman was elected for each
election year. This share persists till the following election. Elections are routinely every five
years but states often hold mid-term elections at shorter intervals. Each district has between 1
and 37 electoral constituencies and the median is 9.
The mean of the proportion of seats in a district won by women is 3.6% (s.d. 7.4%). The
median is zero and the 75th and 90th percentiles are, respectively, 5.5 and 14.3%. So the
distribution is highly skewed (Figure A1 in the Appendix). At least one woman was elected in
26.4% of district-electoral years and in this sub-sample, the share of seats held by women is
13.8%. There is an upward trend in the share of seats held by women (Figure 1) and substantial
differences in both the level and trend by state (Figure 2).
We define close elections as elections in which the winner and the runner-up are of
opposite gender and the vote margin between them is less than 3.5%. Across the sample period,
only 7.45% of district-years had at least one close election. They have become more common
over time: Fewer than 1 in 400 seats had close elections between women and men in the 1960s
and 1970s, but that figure jumped to more than 1 in 100 for the 1980s and 1990s.
Health Outcomes and Facilities: Individual data on child survival are obtained from
retrospective fertility histories reported in the second round of the Indian National Family
Health Survey (NFHS) by a representative sample of ever-married women aged 15-49 in 1998-
99.8 This makes it straightforward to identify siblings. The histories provide information on the
year of birth and death for births that occur across three decades, so these data can be matched
to the time variation in the political data. The data indicate the district of current residence and
the years that the mother has lived in her current location. We drop mothers who had births in a
location other than the current residence, but we investigate this restriction. To allow for full
exposure to neonatal [infant] morality risk we exclude children born less than a month [a year]
before the date of the survey. The NFHS also provides information on health-seeking
behaviours in the four years preceding the survey date and on village facilities at the time of the
survey. These are defined in the data appendix and discussed further in the results section. The
NFHS data are merged with the political data by district and (lagged) birth year to produce a
micro panel of births within mother nested within a district level panel. There is an average of
3.8 births per mother, conditional on at least 2. Descriptive statistics are in Table 1. A non-
parametric (lowess) plot of the relationship between neonatal mortality risk and the share of
women leaders at the district level shows that for most of the range of the data, the
Kerala, Madhya Pradesh, Maharashtra, Orissa, Punjab, Rajasthan, Tamil Nadu, Uttar Pradesh and West Bengal. 8 For further information, including sampling design, see IIPS and ORC Macro (2000).

8
unconditional relationship is negative (Figure A2). We now investigate whether a negative
relationship persists after allowing for endogeneity and heterogeneity.
4. Empirical Specification
4.1 Identification
We are interested in the relationship between indicators of individual-level access to public
health services and women’s political representation at the district level. If common
unobservables drive both electoral preferences for women and health-related behaviours then
our estimates will be biased. To address this, we instrument the overall share of women
politicians with the share of women who win in close elections against men, that is, elections in
which the winner and the runner up are of opposite gender and the margin of victory is small.
The premise is that the identity (gender) of the leader is quasi-random in close elections between
the sexes. To see this, note that in a first-past-the-post electoral system, the probability of being
elected is a function of the vote difference between the winner and the runner-up and this
function has a discontinuity at zero. As the vote difference approaches the discontinuity,
constituencies in which a woman wins by a small vote margin are increasingly similar to
constituencies in which a man wins by a small margin (Lee 2001, Pettersson-Lidbom 2001).
Since we use not a binary outcome (man/woman) at the constituency level but the share of
women at the district level, our specification is similar to a fuzzy regression discontinuity (e.g.
Angrist and Pischke 2008: chapter 6), but one in which we aggregate to the district level over
discontinuities at the constituency level. We control for a polynomial in the constituency-specific
margins of victory or defeat of each man-woman close election in the district.
Although the gender of the winner in a close election may be considered random, the
existence of close elections between women and men may not, for example, it may depend on
the number of female candidates in the district. To allow for this, we control for the fraction of
seats in the district that had close elections between female and male candidates in the first and
second stage of the instrumental variables procedure.
Since we focus upon newborns, a further potential source of bias arises from endogenous
heterogeneity in the timing of fertility. For instance, households may consciously advance or
defer fertility in response to the policy [political] regime. Alternatively, selective foetal death
[miscarriage or female foeticide] may vary with reproductive health facilities and campaigns
discouraging foeticide.9 These responses may vary across mothers. So, whether by selection into
conception or into foetal survival, the composition of live births in the sample may vary
9 Similar arguments concerning the conscious timing of fertility and selective survival of the foetus to birth in the context of booms and recessions are made in Dehejia and Lleras-Muney (2004) and Bhalotra (2010) respectively.

9
systematically with the gender composition of politicians. This will tend to bias the parameter of
interest and the direction of this bias is, a priori, unclear. We limit this problem by using mother
fixed effects. These will of course purge all fixed mother-level unobservables including the time-
invariant component of their political preferences and any tendency they may have to
compensate or reinforce state investments in children (crowding-out or crowding-in). This is a
considerable improvement relative to using district fixed effects.
The first set of estimated models is
(1) mortalityimdt= αm+qt +b womendt-1+ åå==
¶+¶N
j
jdtj
N
j
jdtjdtj ImFI1
2
1
1 )(* + ltotalclosedt-1+ Ximdtz +
+Zdtμ +jst + εimdt
(2) womendt= cm + wt + t womenclosedt + åå==
¶+¶N
j
jdtj
N
j
jdtjdtj ImFI1
4
1
3 )(* +ytotalclose dt +
+Ximdtr+ Zdtπ +ust + eimdt
The subscripts denote the individual child i of mother m born in district d (in state s) in year t.
Mortality is an indicator for the index child dying by the age of one month (neonatal), women is the
district-level share of state assembly constituencies to which a woman was elected in the year
before the child was born and b is the parameter of interest. The other variables in equation (1),
in order, are mother and cohort fixed effects, a third-order polynomial (F) in the victory margin
(m) between the winner and the runner up for the man-woman election j, interacted with Ijdt, an
indicator for whether such an election exists, totalclose is the fraction of constituencies in the
district that experienced a close election, X is a vector of child or mother-specific controls, Z is a
vector of district-year varying controls and j are state-specific trends. Equation (2) represents
the first stage of the IV procedure. It shows the potentially endogenous regressor, women,
regressed upon the instrument, womenclose, and the same set of controls. The instrument is the
fraction of constituencies in the district in which a woman won against a man in a close election.
The cohort dummies control for aggregate time-variation associated with, for example,
secular improvements in health technology, episodic shocks like famines, floods and epidemics
and any aggregate economic or political regime changes. The state specific trends allow for
omitted trends that vary by state, for example, GDP or trends in the status of women. The
district level controls Z include the shares of the population that are female, urban and low caste
and male and female literacy rates. Controls X include dummies for the gender, birth order,
rural/urban location, religion, and caste of the child and an indicator for whether the child is one

10
of a multiple birth. We use a linear model since fixed effects probit estimates are inconsistent in
short panels (Nickell 1982) and the relevant panel in this case is the micro-panel, where T is the
number of children per mother. Standard errors are robust to arbitrary forms of
heteroskedasticity and clustered at the district-level to allow for correlation at any time and
across time within district (e.g. Bertrand et al. 2004). This also allows for correlation of the
standard errors across siblings because, by construction, siblings are all in the same district.
In sum, the estimated specification delivers an estimate of the change in mortality risk
across children of the same mother born at different times and so potentially under different
political regimes, with the change in political regime constructed as a quasi-random assignment
of the gender of politicians in the district of birth. We investigate the identifying assumptions
that underlie the use of close elections. In view of our use of mother fixed effects, we check on
the further identifying assumption that there are no omitted mother-specific trends the effects of
which may load onto the variable of interest. We conduct a range of sensitivity checks including
a placebo test and we explore the timing of effects and investigate heterogeneity in impact by
individual characteristics and over time.
We then estimate equations that replace mortality in equation (1) with a vector of village
public goods on the one hand and a vector of antenatal and early postnatal health inputs on the
other. The identification strategies we use to analyse these further outcomes are similar and are
detailed below, alongside the results.
5. Results
5.1. Survival Outcomes
Estimates of equations (1) and (2) are in Table 2; refer the richest specification in column
(5). Raising the share of seats held by women at the district level (women) by one standard
deviation (0.0740) is estimated to result in declines in neonatal [infant] mortality of 1.5 [1.4]%.
This is 24[14]% of the mean rate in the sample, which is 6.3[9.8]% and it corresponds to a
0.063[0.048] change in the s.d. of neonatal [infant] mortality. Since the distribution of women is
skewed (Figure A1), we consider the survival improvements brought about by electing one
additional woman. The median district has nine constituencies and so nine seats. As it happens,
close to 10% of districts in the sample have exactly nine seats and in this set the mean (0.034)
and median (0) share of seats held by women is very similar to the sample mean (0.036) and
median (0). If one additional woman wins, the median number of seats goes from 0 to 1 and the
share from 0 to 1/9=0.11. If we plug this in to the estimated equations, we get even larger
numbers. The predicted decline in neonatal [infant] mortality is now 2.3 [2.1]%. We investigate

11
this later (section 5.3) and find that the effects of politician gender on infant mortality are entirely
determined by its effects on neonatal mortality.
Table 2 shows how the estimates for neonatal mortality evolve as the specification is
enriched to improve identification. The OLS coefficient is small and insignificant and there is no
significant change in it when the sample is restricted to mothers with at least two births. The
2SLS coefficient without mother fixed effects is larger by a factor of eight and borders on
significance. It rises by about one standard deviation and becomes statistically significant once
we introduce mother fixed effects. Introducing the household and district level controls listed
earlier makes no significant difference although the coefficient is slightly larger.10
The OLS coefficient is expected to be biased by the endogeneity of voter preferences (or
self-selection of women into political candidacy). Our finding that it is biased downwards is
consistent with women being more likely to be elected (or to come forward) in districts with
poorer baseline health. Another possibility is that women who run in close races against men are
positively selected on characteristics. The relationship between the local average identified off
close races and the average effect depends on the underlying theoretical model, and our findings
are consistent with a citizen candidate model. The cost of a close race is higher than of non-close
races so a candidate needs a higher payoff to play, suggesting that only candidates with far apart
preferences will play (e.g. Rehavi 2007). In general IV coefficients will be larger when the
variable of interest is measured with error but we expect that measurement error in counting
women winners in Indian elections is small. Indeed if measurement error were important then,
as this is exacerbated by differencing, we would expect attenuation of the coefficient upon
introduction of mother fixed effects. Instead the coefficient is larger still. This may indicate that
parents reinforce endowments in allocations across siblings, consistent with other evidence that
points in this same direction (Datar et al. 2007, Aizer and Cunha 2010).
The first stage of the 2SLS estimates is reported in the lower panel of Table 2. The
instrument is powerful and the share of women who win across all elections moves
proportionately to the share of women who win in close elections. With the share of women
winners in close elections constant, the share of all women winners is negatively associated with
the total share of close elections within a district since this now varies only with the share of
male winners. We also report the reduced form of the equation system (1), (2) (see Table 3, panel
B column 6).
10 Table 2 reports only the coefficient on the regressor of interest. Appendix Table A7 reports the full set of coefficients. Given that the effect we find for infant mortality is mainly capturing the effect on neonatal mortality, from now own we will only report results for neonatal mortality. Robustness checks using infant mortality as a dependent variable are in appendix Tables A9 and A10.

12
5.2. Robustness Checks
We subjected the baseline specification to a number of checks (Table 3).
Specification of electoral variables: Since regression discontinuity underlies the close election
IV approach, we investigate parameterisation of the vote margin between the winner and runner
up. The baseline specification uses a third order polynomial but the coefficient of interest is not
sensitive to replacing this with a first or second order polynomial (columns 1-2). The premise
that the gender of the leader is random in a close election only holds in a small window around
the point where the vote margin between the winner and the runner up is zero, but there is an
efficiency-robustness trade off in deciding the width of the window. We therefore investigate the
chosen threshold for identification of close elections, varying this downwards and upwards from
the selected 3.5% to include the range 2 to 4%. The coefficient on women is almost identical
when we use a 2% margin, and it is insignificantly different for the other choices (columns 3-6).
We restricted the sample to district-year observations (41% of the baseline sample) in which
there was at least one election between a man and a woman as these are the observations upon
which identification rests, and we find this makes no significant difference (col. 7). To control
for the possibility that certain political parties strategically appoint women candidates more than
others (Rai 2002), we condition upon the district share of seats occupied by each of seven
parties.11 We also control for the district share of state assembly seats reserved for low caste
candidates to allow for the possibility that women and men compete differently for these seats.
These changes do not alter the coefficient of interest (column 8). Using the outer fence of the
interquartile range, we removed outliers in women’s representation above the 75th percentile.
This amounts to removing the 1.45% of observations with women greater than 28%, and it
corresponds to the visually evident outliers in Figure A2. The estimates are little changed
(column 9).
Within-mother trends: In a model with mother fixed effects, identification of calendar
time effects can only come from mothers having children at different moments in time but there
is necessarily a trend in birth order and the mother’s age at birth between siblings. This makes it
important to isolate the effects of time-variation in women’s political representation from the
effects of birth-order and the age of the mother at each birth. We already control flexibly for
birth order, using dummies for each order. We now introduce age at birth dummies and more
flexible controls for mother’s age at birth, namely, dummies for mother’s cohort*child cohort
(columns 1-2 of panel B, Table 3). This sort of nonparametric control allows for the functional
11 Following Besley and Burgess (2002), seven party groups are constructed: Congress, Hard Left, Soft Left, Janata, Hindu, Regional parties, and Independents coupled with other small parties (data appendix).

13
relationship between survival and mother’s age to have changed over time with improvements in
the survival technology.12
Unobserved trends: We further investigated strengthening controls for unobservable trends
in general. We extend the baseline specification to include state-specific quadratic trends,
state*year dummies and district*mother’s cohort dummies (columns 3-5, panel B). The last is
important because a potential problem with using only district fixed effects is that different
cohorts of mothers in different districts, having been exposed to different income and health
conditions, are more or less likely to have children with lower survival chances.13 To further
mitigate concerns that we are capturing omitted trends, we implemented a placebo, modelling
the neonatal mortality risk of cohorts born in t as a function of future politician gender (t+1 to
t+9). These coefficients are all essentially zero (Table 4)14.
The estimates in Table 2 are on the sample of mothers that have had all their births in
their current place of residence. This is a rather strong restriction. We relax it to include only
children who were born in the current place of residence of the mother. In order to investigate
the extent of any selectivity in migration, we also estimate the model with no restrictions. The
coefficient of interest grows smaller as we successively lift restrictions on the sample but it
remains significant and within two standard errors of the baseline coefficient (Table A8 in the
Appendix). This puts aside any concern that our selection of a non-migrant mother sample is
either creating a bias or producing results that may be altogether unrepresentative.
Close election data: Following the initial use of the close election identification strategy in
the context of close elections between Democrats and Republicans in the US (Lee 2001),
concerns have been raised that the outcomes of close elections may be biased in favour of
incumbents or in favour of candidates from parties that have strategic control over the election
process (Snyder 2005, Caughey and Sekhon 2010, Grimmer et al. 2011). We investigate
incumbency and party affiliation in addition to other observables but find no evidence of this in
the case of close elections between men and women in India. A simple regression shows that the
12 Controls for mother’s age at birth are also important in correcting for the fact that retrospective fertility (and mortality) data grow increasingly unrepresentative of mother’s age as we go further back in time (Rindfuss et al. 1982). 13 See Bhalotra and Rawlings (2010) on the importance of mother’s birth year conditions for offspring health and see Kudamatsu (forthcoming) for a similar discussion in the context of mother fixed effects estimation of the impact of democratization on mortality. 14 We investigated a further placebo, estimating our model on the sample of mothers that moved to the current location a year or more after the birth of their youngest child. Their births are effectively matched to politicians that they were never exposed to. Again, the coefficient on women is small and insignificant (Table A8 column 1). However, the problem with this test is that we do not know whether the previous location was in the same district or in a different one, which adds noise to the estimates.

14
proportion of women in a district who won in a close election against a man is independent of
the history of close elections in the district, the history of women being elected, the share of
seats that each of eight parties contested in close elections and a host of district-time varying
demographic variables (Table A1). Candidate and constituency characteristics are also
independent of the gender of the winner in close elections. This includes the number of other
female candidates in the constituency, whether the winner was the incumbent, the number of
close elections in the past, the votes received by the winner and the total votes in the
constituency (Table A2). These results lend support to the identifying assumption that the
gender of the winner in close elections between men and women is random.
Although district-specific unobservables are absorbed by mother fixed effects, we also
show that districts that had a close election are matched on observables to districts that did not.
The observables include district demographics, the share of villages with hospitals and schools
and the share of seats won by each gender in elections that were not close (Table A3). Similarly,
while we control in the regressions for the district-level vote-shares of each of eight parties, it is
useful to observe that there are no systematic correlations between political party and the
incidence of close elections (Table A4).
5.3. Extensions
Timing: The reported specification investigates the influence of the gender composition
of politicians in the year before birth (let’s call this t-1) since neonatal mortality is primarily
determined by antenatal services and the health of the mother during pregnancy. We extend the
model to allow for persistence in the impact of politician gender. Some persistence is built in by
virtue of state elections typically taking place every five years.15 We re-estimate the baseline
model, allowing neonatal mortality to depend upon politicians in power as long as five years
before birth (t-5). We find that politician gender in the two years before birth and in the birth
year (t-2, t-1, t) has a similar sized significant impact but that the share of women in power more
than two years before the index birth has no impact. (Table 4). This particular pattern of fading
is consistent with, for instance, politicians targeting married women with information about
antenatal behaviours. This is because the median duration between marriage and first birth in
India is one to two years.
Timing, mechanisms and birth order: The evidence (below) suggests that women politicians
enhance health facilities and disseminate information on healthy behaviours. Since both facilities
and information are likely to persist within mother for the relatively short space of time between
15 The gender mix of politicians elected in a given election year will, on average, persist through the next five years. So politicians in power at t-5 will tend to exit before or in the birth year t, politicians in power in t-4 will tend to exit before or in t+1, and so on.

15
births (mean of about two years), we may expect exposure to women politicians to have its
largest impact on the health of first births. This is indeed what we find (see the first two columns
of Table 5). In their analysis of women’s social networks, Aizer and Currie (2004) adduce a
similar distinction between first and higher order births, focusing on information diffusion.
Heterogeneity by other child characteristics: We allow the effects of politician gender to differ by
the caste, gender and rural/urban location of the child for the following reasons. Differentiation
by caste of the child is a crude test of the progressiveness of women politicians since low caste
children are relatively poor. Earlier studies suggest that as women’s power in decision making
within the household increases marginal gains for girls exceed those for boys (e.g. Duflo 2003,
Thomas 1990). So, if politician identity influences policy outcomes then it is plausible that
women politicians make a larger difference for girls, for example, by campaigning against son
preference or by encouraging immunization of girls. The scope for politicians to impact health is
greater in rural areas since public services are weaker and health outcomes poorer. We find larger
point estimates for boys, for low caste (SC and ST) children and for children born in urban areas,
but in no case is the group difference statistically significant.
Pre/post devolution: We also investigated heterogeneity in the treatment effect in the time
dimension. The 1993 Constitutional Amendment described in sections 1 and 2 devolved control
over the implementation of development programmes to the panchayat level and this included
aspects of health provision such as drinking water and immunization delivered through the
Integrated Child Development Services programme. We therefore allow for a weakening of the
influence of politicians in state assemblies post-devolution. The estimated coefficient is not
significantly different pre/post-1993. This suggests that women’s political representation
mattered for the entire three decades in our sample and that the power of politicians elected to
state assemblies to influence health services was not substantially eroded upon the empowerment
of village councils.
We estimated the model for post-neonatal mortality and found no effects of politician
gender (Table A6).16 However these estimates are biased by endogenous selection into post-
neonatal exposure to mortality risk because children only enter this sample if they have survived
the neonatal period, and we have seen that neonatal survival is dependent upon politician gender.
Our observation of larger impacts of women’s representation on neonatal than on post-neonatal
mortality is also consistent with the tighter identification of neonatal mortality with state-level
investments in women (maternal health and place of delivery). As children age into the post-
16 Mortality in the first month of life is neonatal and between the second and twelfth month is post-neonatal. Infant mortality is the sum of these. Mortality risk declines sharply with age, and neonatal mortality contributes two-thirds of infant deaths.

16
neonatal period, they are exposed to a more diverse set of household-level influences including for
example income, nutrition and aspects of parenting behaviour like hygiene. It is therefore harder
to attribute improvements in post-neonatal health to public provision and this weakens politician
incentives.
The probability that a child is born, and the sex of the child conditional upon birth
may depend upon women’s political representation. As we have the entire fertility history of each
mother, we expanded the data so that for every woman there is an observation for every year in
which she is exposed to the risk of birth (starting with her age at marriage and stopping at age 49
or the date of interview). There is no significant fertility response. However, the probability that
a birth is female is increasing in the share of women politicians (Appendix Table A11)17.
6. Health Inputs
6.1 Village Public Goods
We now investigate how women’s political representation influences tangible (and
durable) supply-side investments. For this we use the under-exploited village facilities survey of
the NFHS to look at rural infrastructure choices, similarly to Duflo and Chattopadhyay (2004).
The estimation sample contains 1591 villages (in the 246 districts), 76% of which are surveyed in
1998 and the rest in 1997. So we do not have much time variation in these data but there is
district variation. Facility is an indicator for a specified facility in village v in district d in year t.
Using year and district fixed effects and instrumenting for the district share of women as before,
we estimate this linear equation system using 2SLS-
(3) facilityvdt= αd +qt +b womendt-1+ åå==
¶+¶N
j
jdtj
N
j
jdtjdtj ImFI1
2
1
1 )(* + ltotalclosedt-1+ Zdtμ + εimdt
(4) womendt= cd + wt +t womenclosedt + åå==
¶+¶N
j
jdtj
N
j
jdtjdtj ImFI1
2
1
1 )(* +ytotalclose dt + Zdtπ + eimdt
We find that village public facilities are a significant function of the share of women politicians in
the district in which the village lies (Table 6). The estimates are sharp and consistent across
categories. A 10% increase in women raises the probability that the village has a primary health
17 A ready explanation of this would be that women politicians have been more committed to controlling female feticide. To test this hypothesis, we divided the sample at 1985, because ultrasound scanners started to be imported in 1987 and thereafter widely used for prenatal sex detection and it is only after the mid-80s that there is a significant trend departure of the sex ratio at birth from the biologically normal level (Bhalotra and Cochrane 2010). Our expectation was that we would see a positive impact of female political representation on the female-male ratio at birth after and only after 1985. However the post-85 coefficients are imprecise and we cannot reject the hypothesis that they are equal before and after 1985. We are therefore unable to nail down an explanation of this finding.

17
centre, a community health centre, a government dispensary and a government hospital by 0.22,
0.19, 0.18 and 0.057 respectively. With a view to identifying the sorts of village infrastructure that
male politicians are more likely to provide, we ran the regressions reported in the lower panel of
Table 6. A 10% increase in the share of women politicians (which decreases the share of male
politicians) significantly lowers the probability that the village has a bank. We also observe
sizeable negative coefficients on indicators for post offices and telephone facilities, although
these are poorly determined. In sum, the evidence suggests that women politicians are
significantly more likely to invest in the public health infrastructure while men are more likely to
invest in the financial and telecommunications infrastructure. This ties in with our initial
hypothesis.
6.2. Individual Indicators of Antenatal and Postnatal Care
With a view to identifying policy-amenable inputs to neonatal mortality, we investigated a
range of prenatal and early postnatal health-seeking behaviours.18 These data are only available
for births that occur in the four years preceding the survey date (1994/5-1998/9). There are
siblings in this sample (for 15.3% of mothers) but they are characterised by short intervening
birth intervals and given the evidence that a short preceding birth interval compromises the
health of a child (e.g. Bhalotra and van Soest 2008), this is a selected sample. So, while we use the
close elections instrument as before, instead of mother fixed effects, we use fixed effects for
finely defined mother-groups, an approach similar to that taken in Kudamatsu (forthcoming). We
construct around 1000 fixed effects for groups defined on a multidimensional space of mother
traits, namely height (above/below mean), education (above/below primary), caste (SC, ST,
OBC or high caste), urban/rural location and the birth year of the mother. The estimated
equation system looks similar to (1) and (2), the only differences being in the dependent variable
and in mother group fixed effects replacing straightforward mother fixed effects.
The results are in Table 7 and the mean and s.d. of each dependent variable is in Table 1.
As in Table 2, OLS estimates (not shown) are smaller than the IV estimates and tend to be
insignificant. The table displays 2SLS estimates with and without the quasi- mother fixed effects.
Here we discuss the richer specification and present effects flowing from a 10 percentage point
increase in women’s representation (which, we explained above, is the approximate change in
share associated with moving the number of women politicians elected in the median district
from 0 to 1).
18 Since the samples we use for estimation of equations for survival and for health inputs are constrained to be different, we cannot conduct an accounting exercise measuring the contributions of the inputs to neonatal mortality but the association of the inputs we consider with neonatal mortality is widely documented.

18
Antenatal care, iron and tetanus: The Indian government defines a complete course of
antenatal care as including at least 3 antenatal visits, a 3-month supply of iron tablets and two
tetanus injections. Only 37% of women in our sample achieve a complete course. We find that
women’s political representation increases the number of antenatal visits a woman makes by
0.28, which is 12% of the mean. It raises the probability that iron supplements are taken by
about 10% points, relative to a mean of 57%. This is important given the high prevalence of
anemia amongst Indian mothers (NFHS data) and the fact that it is a risk factor for low birth
weight offspring and child survival (Bhalotra and Rawlings (2011). The probability that a woman
has at least one tetanus injection during pregnancy (which is important in lowering the risk of
neonatal tetanus) is increasing in women but not significantly.
Breastfeeding: Women’s political representation raises the probability of early
breastfeeding by 13.4% points, which is a 28% increase. Although the vast majority of Indian
women breastfeed and 77% of children are being breastfed at 20-23 months (UNICEF
indicators), there are cultural inhibitions to breastfeeding immediately after birth and only 48%
of Indian women in our sample initiate breastfeeding in the first 24 hours. This is when the
benefits of breastfeeding are greatest, lowering the risk of contracting infectious diseases such as
diarrhoea and pneumonia and, thereby, lowering neonatal mortality risk (Jones et al. 2003).
Place of birth: Some 69% of births to Indian women in our sample occur at home,
while the remaining 31% are distributed equally between public and private facilities.19 Since
home births are typically unattended by professionals, they generate neonatal survival risks that
can be averted in the presence of birth attendants trained in the management of sepsis
(septicaemia, meningitis, pneumonia); see Bang et al. (1999).
We find that a 10% increase in women’s political representation lowers home deliveries
by 8.8% points. Moreover, there is evidence that this represents a shift of births into government
hospitals: the same increase in women raises the probability of giving birth in a government facility
by 11% points while there is no significant change in the probability of giving birth in a private
facility. Contrast this with the impact of a 10% increase in state income: this similarly lowers
home deliveries (by a more modest 1.1% points) but this arises entirely from a shift towards
private sector deliveries; there is no change in the share of births in government hospitals
(Bhalotra 2010). This suggests that putting women at the helm leads to improved access to
government hospitals, consistent with the results in section 6.1.
19 The share of home births is higher in rural areas, at 78%, compared with 33% in urban areas. The share of the residual births in public and private facilities is similar in rural and urban areas.

19
Immunization: A 10 percentage point increase in women increases the number of
vaccinations a child has by 1.8, against a mean of 5.3 and a maximum of 8. In the estimation
sample, only 41% are fully immunized and 12.5% have had no immunizations20
Since breastfeeding does not require public infrastructure, the impact of women’s
representation on breastfeeding suggests a role for information campaigns. This is probably also
an important component of the other improvements we observe. The survey data we use (the
NFHS) asked women what inhibited them in making antenatal care visits and an astounding 60%
said that they did not think it was necessary. This suggests that information campaigns have the
potential to generate large improvements in antenatal care.21 A recent study of immunization in
India concludes that uptake of publicly provided services is low because people do not seem to
fully recognise their benefits (Banerjee et al. 2011). An advantage of studying outcomes (does a
child survive, does a mother receive iron supplements, etc.) is that it captures the effects not only
of infrastructure or expenditure choices but also of policy influences that are less often
documented, including information campaigns. Information is particularly important in the
health domain. For example, Miller (2008) finds that door to door campaigns advocating home
hygiene played a critical role in the steep decline in infant mortality in American history.22
7. Conclusions
We investigated whether women politicians invest more in antenatal care and early child
health because women incur the costs of reproduction and replacement fertility and they make
greater investments in the early life health of their offspring. We identify significant causal
impacts of women’s political representation on neonatal survival, indicators of prenatal and early
postnatal care, and the village level public health infrastructure. We control for voter (and
mother) characteristics but are unable to control for politician characteristics. Therefore some
part of the relationships that we identify may flow from women who win in close [political] races
against men being positively selected.
As discussed, women’s representation is a live issue in the Indian Parliament. On the
wider international scale, quotas for women in government have been established in more than
100 countries in the last 15 years (Dahlerup and Francisco 2005). Even if competitively elected
women are positively selected, our findings are relevant to debates concerning political
20 Since immunizations are spread across the first year of life, the sample upon which the immunization equations are estimated is the sample of (surviving) births aged 12-24 months. 21 Access to publicly provided care is clearly relevant too since the next highest frequency, 16%, was recorded for it costing too much. Only 3.5% said it was too inconvenient or too far and 1.6% said it was because a health worker did not visit. 22 There may be complementarities in the outcomes we look at and between provision of facilities and information, for example, mothers who give birth in a facility rather than at home are more likely to receive information and encouragement to initiate breastfeeding soon after birth.

20
reservations for women for two reasons. First, increasing the political representation of women
may increase female voter turnout (a question we are currently exploring,) and so shift the
preferences of the median voter in the direction of women’s preferences. Second, there are likely
dynamic effects or effects of having women in power that persist after they have gone, in
particular, exposure to women may reduce voter bias against them (Beaman et al. 2009,
Bhavnani 2009, Deininger et al. 2011).
References
Aizer, A., and J. Currie (2004). “Networks or neighborhoods? Correlations in the use of publicly funded maternity care in California.” Journal of Public Economics, 88, 2573-2585. Aizer, A., and F. Cunha (2010), “Child endowments, parental investments and the development of human capital.” Mimeograph, Brown University. Alesina, A., and E. Ferrara (2005). “Preference for redistribution in the land of opportunities.” Journal of Public Economics 89, 897-931. Alexander, R.D (1974). “The evolution of social behavior.” Annual Review of Ecology and Systematics, 5, 325-383. Andreoni, James, and Lise Vesterlund (2001). “Which is the Fair Sex? Gender Differences in Altruism.” The Quarterly Journal of Economics, 2001, 116, 293-312. Angrist, Joshua D., and Jörn-Steffen Pischke (2008). Mostly Harmless Econometrics: An Empiricist's Companion Princeton University Press. Banerjee, A. L., Angus Deaton, and Esther Duflo (2003), “Health Care Delivery in rural Rajasthan.” Mimeograph, MIT. Banerjee, A. L., Duflo, E., Glennerster, R., and Kothari, D. (2010). “Improving Immunization Coverage in Rural India: A Clustered Randomized Controlled Evaluation of Immunization Campaigns with and without Incentives.” British Medical Journal, 340, c2220. Bang, Abhay, T., Rani A. Bang, Sanjay B. Baitule, M. Hanimi Reddy, Mahesh D. Deshmukh (1999), “Effect of home-based neonatal care and management of sepsis on neonatal mortality: field trial in rural India.” The Lancet, 354, 1955-1961. Black, R.E., Morris S.S., Bryce J. (2003). “Where and why are 10 million children dying every year?” Lancet 361:2226-2234. Beaman, L., E. Duflo, R. Pande, and P. Topalova (2007). “Powerful Women Politicians, Gender Bias, and Policy-making in Rural India.” Background Paper, The State of The World’s Children, UNICEF. Beaman, L., R. Chattopadhyay, E. Duflo, R. Pande, and P. Topalova (2009). “Powerful Women: Does Exposure Reduce Bias?” Quarterly Journal of Economics, 124, 1497-540. Bertrand, M., E. Duflo, and S. Mullainathan (2004). “How much can we trust difference-in-difference estimators?” Quarterly Journal of Economics, 249-275. Besley, T., and A. Case (2000). “A. Unnatural Experiments? Estimating the Incidence of Endogenous Policies. The Economic Journal, 110, 672-694. Besley, T., and A. Case (2003). “Political Institutions and Policy Choices: Evidence from the United States.” Journal of Economic Literature, 41, 7-73. Besley, T., and S. Coate (1997). “An Economic Model of Representative Democracy.”Quarterly Journal of Economics, 112(1). Besley, T., and Robin Burgess (2002). “The Political Economy of Government Responsiveness: Theory and Evidence from India”. Quarterly Journal of Economics, 117, 1415-1451. Bhalotra, S., and Arthur van Soest (2008). “Birth-Spacing, Fertility and Neonatal Mortality In India: Dynamics, Frailty and Fecundity.” Journal of Econometrics, 143, 274-290. Bhalotra, S. (2010). “Fatal Fluctuations: Cyclicality in Infant Mortality in India.” Journal of Development Economics. 93, 7-19 Bhalotra, Sonia, and Tom Cochrane (2010). “Where Have All the Young Girls Gone? Identification of Sex Selection in India.” IZA Discussion Paper #5381. Bhalotra, S, and S. Rawlings (2010). “Intergenerational persistence in health in developing countries: The

21
penalty of gender inequality?” Journal of Public Economics, 95, 286-299. Bhavnani, R. R. (2009). “Do Electoral Quotas Work after They Are Withdrawn? Evidence from a Natural Experiment in India.” American Political Science Review, 103, 23-35. Campbell, R. (2004). “Gender, Ideology and Issue Preference: Is There Such a Thing as a Political Women’s Interest in Britain?” British Journal of Politics and International Relations, 6, 20–46. Chattopadhay,R., and E. Duflo (2004). “Women as Policy Makers: Evidence from a India-Wide Randomized Policy Experiment.” Econometrica, 72, 1409–1443. Clots-Figueras, Irma (2007). “Are Female Leaders Good for Education? Evidence from India.” American Economic Journal: Applied Economics. Forthcoming, January 2012. Clots-Figueras, I., (2011). “Women in Politics. Evidence from the Indian States”. Journal of Public Economics Economics, 95, 664-690. Cutler, David, Angus Deaton, Adriana Lleras-Muney, (2006). “The Determinants of Mortality,” Journal of Economic Perspectives. 20, 97-120. Dahlerup, D., and J. Francisco (2005). “Gender, Governance and Democracy: Women in Politics.” (1) 5- 48 Isis International-Manila and Women and Gender Institute (WAGI) Manila. Das, Jishnu, and Hammer, Jeffrey (2007). “Money for nothing: The dire straits of medical practice in Delhi, India.” Journal of Development Economics, 83, 1-36. DasGupta, M. (2007). “Public Health in India: An Overview”, in Kaushik Basu, ed., The Oxford Companion to Economics in India. Oxford University Press. Datar, A, A., Ghosh, and Neeraj Sood (2007). “Mortality Risks, Health Endowments, and Parental Investments in Infancy: Evidence from Rural India.” NBER Working Paper 13649 November. Dehejia, R., and A. Lleras-Muney (2004). “Booms, busts and babies’ health.” Quarterly Journal of Economics 119, 1091-1130. Deininger, Klaus, Songqing Jin, Fang Xia, and Nagarajan, Hari (2011). “Can political reservations improve female empowerment?”Evidence from local Panchayat elections in rural India. Mimeograph, The World Bank. Del Bono, E, and Rabe, B. (2011). “Estimating the causal effects of breastfeeding on early child outcomes.” Working paper, Institute for Social and Economic Research. Downs, A. (1957). An Economic Theory of Democracy. Harper Collins, New York. Duflo, Esther (2003). “Grandmothers and Granddaughters: Old-Age Pensions and Intrahousehold Allocation in South Africa.” The World Bank Economic Review, 17, 1-25. Edlund, Laila Haider, and Rohini Pande (2005). “Unmarried Parenthood and Redistributive Politics.” Journal of the European Economic Association, 3, 95-119. Edlund, Lena, and Rohini Pande (2002). “Why Have Women Become Left-Wing? The Political Gender Gap And The Decline In Marriage.” The Quarterly Journal of Economics, 117, 917-961. Franceschet, S., M. L. Krook, and J. M. Piscopo (2009). “The Impact of Gender Quotas: A Research Agenda.” MPSA Conference Paper. Chicago: Midwest Political Science Association National Conference. Filmer, D., and L. H. Pritchett (2000). “The impact of public spending on health: does money matter?” Social Science & Medicine, 49, 1309-1323. Filmer, D. J. S. Hammer, and L. H. Pritchett (2000). “Weak Links in the Chain: A Diagnosis of Health Policy in Poor Countries.” World Bank Research Observer, 15, 199-224. Hoddinott, John (1995). “Does female income share influence household expenditures? Evidence from Côte d'Ivoire.” Oxford Bulletin of Economics and Statistics. IIPS, and ORC Macro (2000). “National Family Health Survey (NFHS-2) 1998-9: India.” Mumbai: International institute For Population Sciences (IIPS). Iyer, L., A. Mani, P. Mishra, and P. Topalova (2011). “Political representation and crime: Evidence from India.” Draft paper. Harvard Business School. Jones G., Steketee R. W., Black R. E., Bhutta Z. A., Morris S. S. (2003). The Bellagio Child Survival Study “How Many Child Deaths Can We Prevent This Year?” Lancet, 362, 65–71. Kiefer, Philip, and Stuti Khemani (2003). “Democracy, Public Expenditures and the Poor.” World Bank Policy Research Working Paper Series no. 3164. Kudamatsu, M. (2007). “Has Democratization Reduced Infant Mortality in Sub-Saharan Africa? Evidence from Micro Data.” Journal of the European Economic Association, forthcoming. Lee, D.S. (2001). “The Electoral Advantage to Incumbency and Voter’s Valuation of Politician’s Experience: A Regression Discontinuity Analysis of Elections to the U.S. House.” NBER working

22
paper 8441. Levitt, S. (1996). “How do senators vote? Disentangling the role of voter preferences, party affiliation and senator ideology.” The American Economic Review, 86, 425–441. Lundberg, S., Pollak, R., Wales, T. (1997). “Do husbands and wives pool their resources? Evidence from the United Kingdom Child Benefit.” The Journal of Human Resources, 32, 1132–1151. Miller, G., (2008). “Women's suffrage, political responsiveness, and child survival in American history.” Quarterly Journal of Economics, 123, 1287–1327. Miller, G., and P. Urdinola (2010). “Cyclicality, Mortality, and the Value of Time: The Case of Coffee Price Fluctuations and Child Survival in Colombia,” Journal of Political Economy 118, 113-155. Mishra, R.C. (2000). Role of Women in Legislatures in India. A Study. Anmol Publications PVT, LTD. Osborne, M.J., Slivinski, A. (1996). “A model of political competition with citizen candidates.” Quarterly Journal of Economics, 111, 65–96. Oswald, A., and N. Powdthavee (2010). “Daughters and Left-Wing Voting.” The Review of Economics and Statistics, 92, 213–227. Pettersson-Lidbom, P. (2001). “Do Parties Mater for Fiscal Policy Choices? A Regression- Discontinuity Approach.” Mimeo, Stockholm University. Rai, Shirin (2002). “Class, Caste and Gender – Women in Parliament in India.” International IDEA, Women in Parliament, Stockholm. http://www.idea.int. Rao, Govinda, M., and N. Singh (1998a). “The Assignment of Taxes and Expenditures in India, http://eac.gov.in/aboutus/mempro1.htm Rehavi, M. (2003). “When Women Hold the Purse Strings: the Effects of Female State Legislators on US State Spending Priorities, 1978-2000.” MSc in Economics and Economic History Dissertation. London School of Economics. Rindfuss, R. R., Palmore, J. A., and Bumpass, L. L. (1982). “Selectivity and the analysis of birth intervals from survey data.” Asia Pacif. Census Forum, 8, no. 3, 5–16. Squires, Judith (1996). “Quotas for Women: Fair Representation?” Parliamentary Affairs. Svaleryd, H. (2009). “Women’s Political Representation and Public SpendingEuropean Journal of Political Economy, 25(2): 186-98. Thomas, Duncan (1990). “Intra-household resource allocation: An inferential approach.” Journal of Human Resources, 25, 635-664. Thomas, S., and S. Welch (1991). “The Impact of Gender on Activities and Priorities of State Legislators.” The Western Political Quarterly. 44, 445-456. Warner, R. L., and B. Steel (1999). “Child Rearing as a Mechanism for Social Change: The Relationship of Child Gender to Parents’ Commitment to Gender Equity.” Gender and Society, 13, 503–517. Washington, Ebonya (2008). “Family Socialization: How Daughters Affect Their Legislator Fathers’ Voting on Women’s Issues.” American Economic Review. 98, 311–332.

��������������� ���������������������������������
��������������� ��������������������������������
0.0
2.0
4.0
6.0
8P
roport
ion o
f seats
in the d
istr
ict w
on b
y a
fem
ale
polit
icia
n
1970 1980 1990 2000Year
0.0
5.1
.15
.15
Andhra Pradesh Assam Bihar Gujarat
Haryana Jammu&Kashmir Karnataka Kerala
Avera
ge d
istr
ict seats
won b
y a
wom
an
00
.05
.1.1
50
.05
.1.1
50
.05
.1.1
5
1970 1980 1990 2000 1970 1980 1990 2000 1970 1980 1990 2000 1970 1980 1990 2000
Haryana Jammu&Kashmir Karnataka Kerala
Madhya Pradesh Maharahstra Orissa Punjab
Rajasthan Tamil Nadu Uttar Pradesh West Bengal
Avera
ge d
istr
ict seats
won b
y a
wom
an
YearGraphs by State

TA
BL
E 1
A:
DE
SC
RIP
TIV
ES
Unit
of
Obse
rvat
ion:
Indiv
idual
(ch
ild),
cohort
s 1968-1
999 i
n 2
46 d
istr
icts
mea
nsd
Neo
nat
al m
ort
alit
y0.0
627
0.2
423
Infa
nt
mort
alit
y0.0
980
0.2
973
Bir
th o
rder
2.7
561
1.8
099
Mult
iple
bir
th0.0
138
0.1
166
Gir
l0.4
770
0.4
995
Sch
edule
d C
aste
(S
C)
0.1
959
0.3
969
Sch
edule
d T
ribe
(ST
)0.1
080
0.3
104
Musl
im0.1
070
0.3
092
Chri
stia
n0.0
113
0.1
057
Oth
er r
elig
ion
0.0
332
0.1
791
Rura
l0.7
816
0.4
131
Age
of
the
moth
er a
t bir
th22.7
412
5.0
420
Obse
rvat
ions
75339
Unit
of
Obse
rvat
ion:
Indiv
idual
(ch
ild)
in t
he
four
yea
rs b
efore
the
surv
ey d
ate
(1998/9
)m
ean
sd
Num
ber
of
ante
nat
al v
isit
s2.3
190
2.4
403
Del
iver
y a
t hom
e0.6
920
0.4
617
Del
iver
y i
n a
gover
nm
ent
inst
ituti
on
0.1
618
0.3
683
Del
iver
y i
n a
pri
vat
e in
stit
uti
on
0.1
462
0.3
533
Bre
astf
ed i
n t
he
firs
t 24 h
ours
0.4
816
0.4
997
Num
ber
of
vac
cines
per
chil
d5.3
617
3.0
431
Took i
ron a
nd f
oli
c ac
id s
upple
men
ts d
uri
ng p
regnan
cy0.5
714
0.4
949
Rec
eived
a t
etan
us
inje
ctio
n d
uri
ng p
regnan
cy0.7
361
0.4
408
Obse
rvat
ions
8853
TA
BL
E 1
B:
DE
SC
RIP
TIV
ES
Unit
of
Obse
rvat
ion:
Dis
tric
t in
an e
lect
ora
l yea
r ,
elec
tions
bet
wee
n 1
967-1
998 i
n 2
46 d
istr
icts
mea
nsd
Pro
port
ion o
f se
ats
won b
y w
om
en (
wom
en)
0.0
364
0.0
740
Pro
port
ion o
f dis
tric
ts t
hat
had
at
leas
t one
wom
an p
oli
tici
an0.2
640
0.4
409
Pro
port
ion o
f se
ats
that
had
clo
se e
lect
ions
bet
wee
n w
om
en a
nd m
en,
close
: 3.5
% m
argin
(to
talc
lose
)0.0
084
0.0
333
Pro
port
ion o
f dis
tric
ts t
hat
had
at
leas
t one
elec
tion b
etw
een a
wom
an a
nd a
man
0.4
025
0.4
905
Pro
port
ion o
f dis
tric
ts t
hat
had
at
leas
t one
close
ele
ctio
n b
etw
een a
wom
an a
nd a
man
(3.5
%)
0.0
745
0.2
626
Pro
port
ion o
f se
ats
won b
y w
om
en i
n c
lose
ele
ctio
ns
agai
nst
men
(3.5
%)
(wom
encl
ose
)0.0
041
0.0
227
Pro
port
ion o
f dis
tric
ts t
hat
had
at
leas
t one
wom
an p
oli
tici
an w
ho w
on i
n a
clo
se e
lect
ion a
gai
nst
a m
an (
3.5
%)
0.0
383
0.1
921
Dum
my f
or
the
firs
t e
lect
ion b
etw
een a
wom
an a
nd a
man
(I_
j)*
0.4
025
0.4
905
Dum
my f
or
the
seco
nd
elec
tion b
etw
een a
wom
an a
nd a
man
0.1
292
0.3
356
Dum
my f
or
the
thir
d
elec
tion b
etw
een a
wom
an a
nd a
man
0.0
389
0.1
934
Dum
my f
or
the
fourt
h
elec
tion b
etw
een a
wom
an a
nd a
man
0.0
071
0.0
841
Dum
my f
or
the
fift
h
elec
tion b
etw
een a
wom
an a
nd a
man
0.0
044
0.0
661
Dum
my f
or
the
sixth
el
ecti
on b
etw
een a
wom
an a
nd a
man
0.0
011
0.0
331

Vote
mar
gin
for
the
firs
t e
lect
ion b
etw
een a
wom
an a
nd a
man
(m
_j)*
*0
.01
42
0.1
82
0
Vote
mar
gin
for
the
seco
nd
elec
tion b
etw
een a
wom
an a
nd a
man
0.0
307
0.2
499
Vote
mar
gin
for
the
thir
d
elec
tion b
etw
een a
wom
an a
nd a
man
0.0
024
0.3
002
Vote
mar
gin
for
the
fourt
h
elec
tion b
etw
een a
wom
an a
nd a
man
0.0
115
0.3
105
Vote
mar
gin
for
the
fift
h
elec
tion b
etw
een a
wom
an a
nd a
man
-0
.0241
0.3
827
Vote
mar
gin
for
the
sixth
el
ecti
on b
etw
een a
wom
an a
nd a
man
0.0
092
0.4
649
Pro
port
ion o
f se
ats
rese
rved
for
SC
/ST
can
did
ates
0.2
366
0.1
785
Pro
port
ion o
f se
ats
won b
y C
ongre
ss p
arti
es0.4
519
0.3
317
Pro
port
ion o
f se
ats
won b
y H
ard L
eft
par
ties
0.0
589
0.1
512
Pro
port
ion o
f se
ats
won b
y S
oft
Lef
t par
ties
0.0
231
0.0
901
Pro
port
ion o
f se
ats
won b
y J
anat
a par
ties
0.1
661
0.2
727
Pro
port
ion o
f se
ats
won b
y H
indu
par
ties
0.1
280
0.2
290
Pro
port
ion o
f se
ats
won b
y R
egio
nal
par
ties
0.0
772
0.2
027
Fem
ale
lite
racy
rat
e 0.2
844
0.1
720
Mal
e li
tera
cy r
ate
0.5
352
0.1
559
Pro
port
ion o
f S
C/S
Ts
0.2
524
0.1
344
Pro
port
ion o
f urb
an p
opula
tion
0.2
041
0.1
409
Pro
port
ion o
f fe
mal
e popula
tion
0.4
811
0.0
167
Obse
rvat
ions
1826
*T
he
firs
t, s
econd, et
c. e
lect
ion r
efer
to t
he
num
ber
of
const
ituen
cies
wit
hin
a d
istr
ict
that
hav
e a
man
-wom
an e
lect
ion.
So 4
0%
of
dis
tric
ts h
ave
at l
east
one
const
ituen
cy (
seat
) th
at w
as w
on i
n a
man
-wom
an e
lect
ion, 13%
of
dis
tric
ts h
ave
at l
east
tw
o, an
d s
o o
n.
**T
he
vote
mar
gin
s ar
e ord
ered
by a
bso
lute
val
ue
in d
istr
icts
wit
h m
ore
than
one
elec
tion a
nd n
ow
fir
st, se
cond, et
c. m
argin
ref
er t
o t
he
firs
t, s
econd e
tc c
onst
ituen
cy.
TA
BL
E 1
C D
ES
CR
IPT
IVE
S
Unit
of
obse
rvat
ion:
vil
lage
mea
nsd
Pri
mar
y h
ealt
h s
ubce
ntr
e0.3
517
0.4
777
Pri
mar
y h
ealt
h c
ente
r0.1
418
0.3
490
Com
munit
y h
ealt
h c
entr
e0.0
815
0.2
737
Gover
nm
ent
dis
pen
sary
0.1
252
0.3
310
Gover
nm
ent
hosp
ital
0.0
353
0.1
846
Ele
ctri
city
2.1
797
0.6
976
Post
off
ice
0.3
755
0.4
844
Tel
egra
ph
0.2
015
0.4
013
ST
D (
tele
phone)
booth
0.1
958
0.3
969
Ban
k0.2
831
0.4
506
Obse
rvat
ions
1558

�������������� �����!���
����������������
��"������������
OL
SO
LS
2S
LS
2S
LS
2S
LS
OL
SO
LS
2S
LS
2S
LS
2S
LS
12
34
56
78
910
Fra
ctio
n o
f se
ats
in d
istr
ict
won b
y f
emal
e poli
tici
ans
-0.0
050
-0.0
148
-0.1
176
-0.1
942**
-0.2
061***
0.0
081
0.0
029
-0.0
540
-0.1
645
-0.1
916*
(wom
en)
(0.0
16)
(0.0
18)
(0.0
74)
(0.0
79)
(0.0
78)
(0.0
19)
(0.0
22)
(0.0
98)
(0.1
07)
(0.1
04)
Dis
tric
t F
Ex
xx
xx
x
Cohort
FE
xx
xx
xx
xx
xx
Moth
er F
Ex
xx
x
Contr
ols
xx
Vote
Mar
gin
s3rd
ord
er3rd
ord
er3rd
ord
er3rd
ord
er3rd
ord
er3rd
ord
er
poly
nom
ial
poly
nom
ial
poly
nom
ial
poly
nom
ial
poly
nom
ial
poly
nom
ial
Obse
rvat
ions
95,0
16
71,4
98
71,4
98
71,4
98
71,4
98
91,1
69
68,6
65
68,6
65
68,6
65
68,6
65
Num
ber
of
moth
ers
18,7
54
18,7
54
18,0
03
18,0
03
���������#����#�����$ �
%���������&������������������"�����������'�����������(������"����������������
12
34
56
Fra
ctio
n o
f se
ats
in d
istr
ict
won b
y f
emal
e poli
tici
ans
in c
lose
0.8
939***
0.9
011***
0.8
964***
0.9
202***
0.9
302***
0.9
255***
elec
tions
agai
nst
mal
e poli
tici
ans
(wom
encl
ose
)(0
.0714)
(0.0
785)
(0.0
789)
(0.0
982)
(0.0
744)
(0.0
752)
Fra
ctio
n o
f se
ats
in d
istr
ict
that
had
clo
se e
lect
ions
-0
.4303***
-0.4
514***
-0.4
495***
-0.4
575***
-0.4
818***
-0.4
797***
Fra
ctio
n o
f se
ats
in d
istr
ict
that
had
clo
se e
lect
ions
-0
.4303***
-0.4
514***
-0.4
495***
-0.4
575***
-0.4
818***
-0.4
797***
bet
wee
n f
emal
e an
d m
ale
candid
ates
(to
talc
lose
)(0
.0528)
(0.0
559)
(0.0
559)
(0.0
507)
(0.0
537)
(0.0
540)
F F
irst
Sta
ge
156.2
7131.6
129.1
187.6
156.3
151.3
��������������� ���������������� ��� ������������������������������������������������������������������������������������������ ���� ����������������� ����������������������
��������������������� �����������
�������� ������������ �����������������!��������"#$%&��������������� �'���� ���������#$����'����#$������ ������������ ��� ��� �����
���������������������� �������������'� ����������(�)�����'� �����'� � ���������������� ������������� ��� ��� ���''������ ���������������� ��������������� (���� ���������
�����������������������'� ��� ������ ��������������� ����� ���������� �������������������������������������������� ���� ����������������'����'��"����������%�

������)��$�!�� ���
PA
NE
L A
Neo
na
tal
mo
rta
lity
12
34
56
78
9
Fra
ctio
n o
f se
ats
in d
istr
ict
won
by f
emal
e p
oli
tici
ans
-0.1
90
2***
-0.1
98
4***
-0.1
96
9**
-0.2
61
6***
-0.2
61
1***
-0.1
42
2**
-0.2
28
9**
-0.1
98
8**
-0.2
21
2**
(0.0
73
)(0
.07
3)
(0.0
91
)(0
.08
8)
(0.0
77
)(0
.07
2)
(0.0
91
)(0
.07
9)
(0.0
86
)
Coh
ort
FE
xx
xx
xx
xx
x
Moth
er F
Ex
xx
xx
xx
xx
Con
trols
xx
xx
xx
xx
x
Mar
gin
s1
st o
rd p
ol
2n
d o
rd p
ol.
3rd
ord
pol.
3rd
ord
pol.
3rd
ord
pol.
3rd
ord
pol.
3rd
ord
pol.
3rd
ord
pol.
3rd
ord
pol.
Ro
bu
stn
ess
chec
ksvo
te m
arg
invo
te m
arg
in2
%2
.50
%3
%4
%a
t le
ast
po
liti
cal
ou
tlie
rs
on
e w
-m e
leco
ntr
ols
Ob
serv
atio
ns
71
,49
87
1,4
98
71
,49
87
1,4
98
71
,49
87
1,4
98
29
,97
97
1,4
98
70
,58
1
Nu
mb
er o
f m
oth
ers
18
,75
41
8,7
54
18
,75
41
8,7
54
18
,75
41
8,7
54
9,9
89
18
,75
41
8,5
91
PA
NE
L B
Neo
na
tal
mo
rta
lity
12
34
56
Fra
ctio
n o
f se
ats
in d
istr
ict
won
by f
emal
e p
oli
tici
ans
-0.2
09
1***
-0.1
88
6**
-0.2
00
1***
-0.2
07
9**
-0.1
67
0**
(0.0
79
)(0
.07
6)
(0.0
76
)(0
.08
2)
(0.0
80
)
Fra
ctio
n o
f se
ats
in d
istr
ict
won
by f
emal
e p
oli
tici
ans
-0.1
84
7***
in c
lose
ele
ctio
ns
agai
nst
mal
e p
oli
tici
ans
(0.0
70
)
Coh
ort
FE
xx
xx
xx
Coh
ort
FE
xx
xx
xx
Moth
er F
Ex
xx
xx
Con
trols
xx
xx
xx
Mar
gin
s3
rd o
rd p
ol.
3rd
ord
pol.
3rd
ord
pol.
3rd
ord
pol.
3rd
ord
pol.
3rd
ord
pol.
Ro
bu
stn
ess
chec
ksa
ge
mo
ther
m
oth
er c
oh
ort
*q
ua
d t
ren
ds
sta
te*
yea
r d
um
dis
tric
t*m
oth
er
red
uce
d f
orm
FE
chil
d b
irth
yr
FE
coh
ort
FE
Ob
serv
atio
ns
71
,49
87
1,4
98
71
,49
87
1,4
98
71
,49
87
1,4
98
Nu
mb
er o
f m
oth
ers
18
,75
41
8,7
54
18
,75
41
8,7
54
18
,75
4
���*������)�� �+�,���������������������-����������������������� �'����)�� �+��� �'���.+��������������� ��'
�����������������. ��� ����'�������� �'���./������������������ ���
� ����������������������'������� ���������������"������������. ��� %����'���������� �������������� �'�0����'�������'�� ��������.��'� ������������������ �������� ��������������
��'�����'����� �'�1��� �������� ����������������������������������� ����� ������"���������������!%�������������������������� �������"��(�)%���� �������� �'�2�'����
��� ��������"��������!�%�3����� 4��� �'�����+��� ����������� �� �!�� ������ ���'����5������������� �'���� ���� ��������6������������������� �'�7��������������''������ �'�
���������.'����5����������!����������� �'�/��������������'�����+�8��6���������� ��)�� �+�

������*��������"��'���""��������������"���������+������
,��""�����������������"�����������'�����������(������"����������������
Chil
d's
age
when
poli
tici
an w
as i
n p
ow
erco
eff
se
-50.1
067
0.0
840
-40.0
069
0.0
780
-3-0
.0983
0.0
900
-2-0
.2257**
0.0
990
-1-0
.2061***
0.0
780
0-0
.1975**
0.0
840
1-0
.0417
0.0
830
2-0
.0338
0.0
820
3-0
.0121
0.0
810
4-0
.0114
0.0
760
50.0
676
0.0
700
60.0
247
0.0
860
70.0
200
0.0
860
80.0
410
0.0
950
9-0
.0801
0.0
940
������-�.��������������""����
Neo
nat
al m
ort
alit
y
Neo
nat
al M
ort
alit
y
���*������)�� �+�)������ �������������������� �'����)�� �+����������� ��".�%���������'�!���� ������������������� ��� �������������� '��� ����� ��� ����'�������������
������'�������������������)����6���������.����'�������� �������� ���".����%�����������������������������'����������������� �������������'���������������� ����������������
� �������"������ �%�����������������9�� ������������� ���"���2%���� ��������������� �����"��������!�%�
������-�.��������������""����
Neo
nat
al m
ort
alit
y
12
34
56
78
9
Fra
ctio
n o
f se
ats
in d
istr
ict
won b
y f
emal
e poli
tici
ans
-0.2
604*
-0.0
701
-0.1
427*
-0.5
839**
-0.2
802*
-0.1
963**
-0.1
469
-0.2
326**
-0.2
043**
(wom
en)
(0.1
52)
(0.0
79)
(0.0
81)
(0.2
59)
(0.1
43)
(0.0
98)
(0.1
38)
(0.1
15)
(0.0
83)
Fra
ctio
n o
f se
ats
in d
istr
ict
won b
y f
emal
e poli
tici
ans
-0.0
119
inte
ract
ed w
ith a
dum
my f
or
yea
rs a
fter
1993
(0.1
19)
Cohort
FE
XX
XX
XX
XX
X
Moth
er F
EX
XX
XX
XX
Contr
ols
XX
XX
XX
XX
X
Sam
ple
firs
t ch
ild
subse
quen
t ru
ral
urb
an
low
er c
ast
ehig
her
cast
egir
lsboys
post
-93
chil
dre
nSC
/ST
inte
ract
ion
Obse
rvat
ions
18,5
62
52,9
36
56,2
73
15,2
25
21,8
27
49,6
71
27,8
86
31,8
71
71,4
98
Num
ber
of
moth
ers
14,4
01
4,3
53
5,4
16
13,3
38
9,8
45
11,7
97
18,7
54
����������)�� �+��� �'���.1���������������������������� ������������ ������������������������ ��������9��������'������!���������������������� �'��������
���!�'� ���'��������� �������������� ������������3��� �'�����������������.�22��''������������� ����������"���%�)�����������'�������������������������� ����������

������/�0������� ������#����
PA
NE
L A
(1)
(2)
(3)
(4)
(5)
Pri
mar
yP
rim
ary
Com
munit
yG
over
nm
ent
Gover
nm
ent
VA
RIA
BL
ES
Hea
lth S
ubce
ntr
eH
ealt
h C
entr
eH
ealt
h C
entr
eD
ispen
sary
Hosp
ital
Fra
ctio
n o
f se
ats
in d
istr
ict
won b
y f
emal
e poli
tici
ans
3.4
769
2.2
365**
1.8
871**
1.7
857**
0.5
682*
(wom
en)
(2.2
15)
(1.1
20)
(0.8
49)
(0.9
00)
(0.3
11)
Yea
r dum
mie
sx
xx
xx
Dis
tric
t dum
mie
sx
xx
xx
Obse
rvat
ions
1,5
58
1,5
58
1,5
58
1,5
58
1,5
58
R s
quar
ed0.3
26
0.3
42
0.3
54
0.3
70
0.2
10
PA
NE
L B
(1)
(2)
(3)
(4)
(5)
Ele
ctri
city
Ban
kP
ost
Tel
egra
ph
ST
D (
Tel
ephone)
VA
RIA
BL
ES
Off
ice
Booth
Fra
ctio
n o
f se
ats
in d
istr
ict
won b
y f
emal
e poli
tici
ans
0.9
865
-2.4
616*
-2.1
704
0.6
037
-0.9
293
(wom
en)
(1.2
25)
(1.4
94)
(2.2
18)
(1.2
41)
(1.5
89)
(wom
en)
(1.2
25)
(1.4
94)
(2.2
18)
(1.2
41)
(1.5
89)
Yea
r dum
mie
sx
xx
xx
Dis
tric
t dum
mie
sx
xx
xx
Obse
rvat
ions
1,5
58
1,5
58
1,5
58
1,5
58
1,5
58
R s
quar
ed0.4
55
0.2
80
0.3
06
0.2
31
0.2
38
See
Note
sto
Tab
le2.
As
inT
able
2,
wom
enis
inst
rum
ente
dw
ith
wom
encl
ose
.A
llre
gre
ssio
ns
incl
ude
the
dis
tric
tco
ntr
ols
incl
uded
inT
able
2.
The
mea
ns
of
the
dep
enden
tvar
iab
les
are
inT
able
1.

������1�.����'����2������'�&�����
12
34
56
78
Pan
el A
Fra
ctio
n o
f se
ats
in d
istr
ict
won b
y f
emal
e poli
tici
ans
3.6
524**
2.7
745*
1.0
663***
0.9
518**
0.1
798
0.3
113
1.2
758***
1.3
406**
(wom
en)
(1.7
83)
(1.6
62)
(0.3
64)
(0.4
29)
(0.3
20)
(0.3
76)
(0.4
62)
(0.5
35)
Dis
tric
t F
Ex
xx
xx
xx
x
Cohort
FE
xx
xx
xx
xx
Moth
er G
roup F
Ex
xx
x
Obse
rvat
ions
7,4
48
7,4
48
8,4
29
8,4
29
8,3
83
8,3
83
8,0
62
8,0
62
12
34
56
78
Pan
el B
Num
ber
of
vac
cines
per
chil
d
Fra
ctio
n o
f se
ats
in d
istr
ict
won b
y f
emal
e poli
tici
ans
-0.8
698**
-0.8
768*
1.0
344***
1.0
904***
-0.1
646
-0.2
136
8.3
516
18.1
244**
(wom
en)
(0.4
33)
(0.5
22)
(0.3
46)
(0.3
94)
(0.3
44)
(0.3
50)
(5.5
81)
(7.8
488)
Dis
tric
t F
Ex
xx
xx
xx
x
Cohort
FE
xx
xx
xx
xx
Bre
astf
ed f
irst
24 h
rs
Del
iver
y a
t hom
e
Num
ber
of
ante
nat
al v
isit
s
Del
iver
y g
ov.
inst
ituti
on
Del
iver
y p
riv.
inst
ituti
on
Iron &
foli
c su
pple
men
tsT
etan
us
inje
ctio
n i
n p
reg.
Cohort
FE
xx
xx
xx
xx
Moth
er G
roup F
Ex
xx
x
Obse
rvat
ions
8,4
08
8,4
08
8,4
08
8,4
08
8,4
08
8,4
08
4,8
31
4,8
31
See
Note
sto
Tab
le2.
As
inT
able
2,
wom
enis
inst
rum
ente
dw
ith
wom
encl
ose
.M
eans
of
the
dep
enden
tvar
iab
les
are
inT
able
1.
Moth
ergro
up
FE
are
def
ined
inth
ete
xt,
they
are
FE
def
ined
over
mu
ltip
le
dim
ensi
ons
of
moth
er-l
evel
ob
serv
able
s.

25
�
������������� ������������
����������������������������
�

������������� ���������� ����� ������ ��� ��������������������� ������
�������������������� ��������� ������ ��� ������������� � ���������������������� ���������� ������ ��� ������� �

Tab
le A
1:
Prob
ab
ilit
y t
hat
a W
om
an
Win
s in
a C
lose
Ele
cti
on
again
st a
Man
Dep
enden
t var
iable
: p
roport
ion o
f w
om
en w
ho w
on i
n c
lose
ele
ctio
ns
agai
nst
a m
an p
er d
istr
ict
and e
lect
ora
l yea
r. S
ample
1967-2
001.
1
Pro
port
ion o
f se
ats
conte
stin
g c
lose
ele
ctio
ns
Congre
ss-1
.412
(2.6
07)
Pro
port
ion o
f se
ats
conte
stin
g c
lose
ele
ctio
ns
Reg
ional
Par
ties
-3.3
32
(4.8
82)
Pro
port
ion o
f se
ats
conte
stin
g c
lose
ele
ctio
ns
Hin
du
-1.2
47
(2.7
06)
Pro
port
ion o
f se
ats
conte
stin
g c
lose
ele
ctio
ns
Janat
a-1
.81
(2.0
75)
Pro
port
ion o
f se
ats
conte
stin
g c
lose
ele
ctio
ns
Oth
ers
-0.4
33
(2.3
89)
Pro
port
ion o
f se
ats
conte
stin
g c
lose
ele
ctio
ns
Indep
enden
t-1
.546
(2.3
03)
Dum
my=
1 i
f th
e dis
tric
t nev
er h
ad c
lose
ele
ctio
ns
bef
ore
0.2
41
(0.6
35)
Pro
port
ion o
f urb
an p
opula
tion
12.5
87
(12.8
5)
Num
ber
of
tim
es t
hat
a w
om
an h
as w
on a
n e
lect
ion i
n t
he
dis
tric
t in
the
pas
t-0
.006
(0.0
51)
Pro
port
ion o
f S
C/S
T p
opula
tion
18.4
97
(19.4
96)
Pro
port
ion o
f popula
tion t
hat
is
fem
ale
-15.5
35
(27.6
62)
Mal
e li
tera
cy r
ate
-1.9
23
(10.8
17)
Fem
ale
lite
racy
rat
e-0
.494
(7.2
49)
Pro
port
ion o
f se
ats
rese
rved
for
SC
/ST
's-2
.931
(5.3
13)
Obse
rvat
ions
164
Adju
sted
R-s
quar
ed-0
.059
Robust
sta
ndar
d e
rrors
clu
ster
ed a
t th
e dis
tric
t le
vel
. D
istr
ict
and y
ear
fixed
eff
ects
are
incl
uded
in t
he
regre
ssio
n.

Tab
le A
2
Con
stit
uen
cy
an
d C
an
did
ate
Ch
aracte
ris
tics:
Clo
se E
lecti
on
s b
etw
een
Wom
en
an
d M
en
Unit
of
obse
rvat
ion:
candid
ate.
Sam
ple
1967-2
001.
Gro
up
Obs
Mea
nS
td.
Err
.
Oth
er f
emal
e ca
ndid
ates
in t
he
const
ituen
cy
Man
won i
n c
lose
ele
ctio
n120
0.1
083
0.0
370
Wom
an w
on i
n c
lose
ele
ctio
n110
0.2
000
0.0
480
Dif
fere
nce
-0.0
917
0.0
601
Win
ner
was
the
incu
mben
t
Man
won i
n c
lose
ele
ctio
n120
0.2
167
0.0
378
Wom
an w
on i
n c
lose
ele
ctio
n110
0.2
182
0.0
396
Dif
fere
nce
-0.0
015
0.0
547
Num
ber
of
close
ele
ctio
ns
in t
he
pas
t
Man
won i
n c
lose
ele
ctio
n120
1.0
750
0.0
241
Wom
an w
on i
n c
lose
ele
ctio
n110
1.0
727
0.0
249
Dif
fere
nce
0.0
023
0.0
347
Vote
s re
ceiv
ed b
y t
he
win
ner
Man
won i
n c
lose
ele
ctio
n120
31894.1
700
1328.4
220
Wom
an w
on i
n c
lose
ele
ctio
n110
33596.4
500
1330.2
330
Dif
fere
nce
-1702.2
880
1883.4
150
Tota
l vote
s in
the
const
ituen
cy
Man
won i
n c
lose
ele
ctio
n120
80188.3
300
2769.9
040
Wom
an w
on i
n c
lose
ele
ctio
n110
80947.2
700
2655.8
640
Dif
fere
nce
-758.9
394
3851.7
720

Table A3
Comparison: Districts with and without Close Elections
(District in an electoral year, sample 1967-2001) Close elections No close elections
Urban population (prop) mean 0.2149 0.1947
sd 0.0052 0.0039
observations 968 1124
Male literacy rate mean 0.5241 0.5454
sd 0.0054 0.0049
observations 946 1098
Female literacy rate mean 0.2878 0.2865
sd 0.0059 0.0054
observations 946 1098
SC/ST population (prop) mean 0.2618 0.2443
sd 0.0047 0.0038
observations 968 1124
SC/ST seats proportion mean 0.2564 0.2178
sd 0.0055 0.0054
observations 1223 1323
Seats total mean 10.8397 7.9426
sd 0.1382 0.1259
observations 1223 1323
Any educational institution mean 0.8212 0.7932
sd 0.0079 0.0084
observations 316 348
Hospitals mean 0.0290 0.0262
sd 0.0025 0.0025
observations 736 812
Table A4
Proportion of Seats Won by Parties
Close Elections No close elections
Party Percent Percent
Congress 40.43 41.16
Hard Left 7.83 8.17
Hindu 11.74 11.44
Independents 6.96 5.81
Janata 9.57 13.98
Regional 12.61 10.38
Soft Left 3.91 2.31
Others 6.96 6.75
Total 100 100
Sample 1967-2001
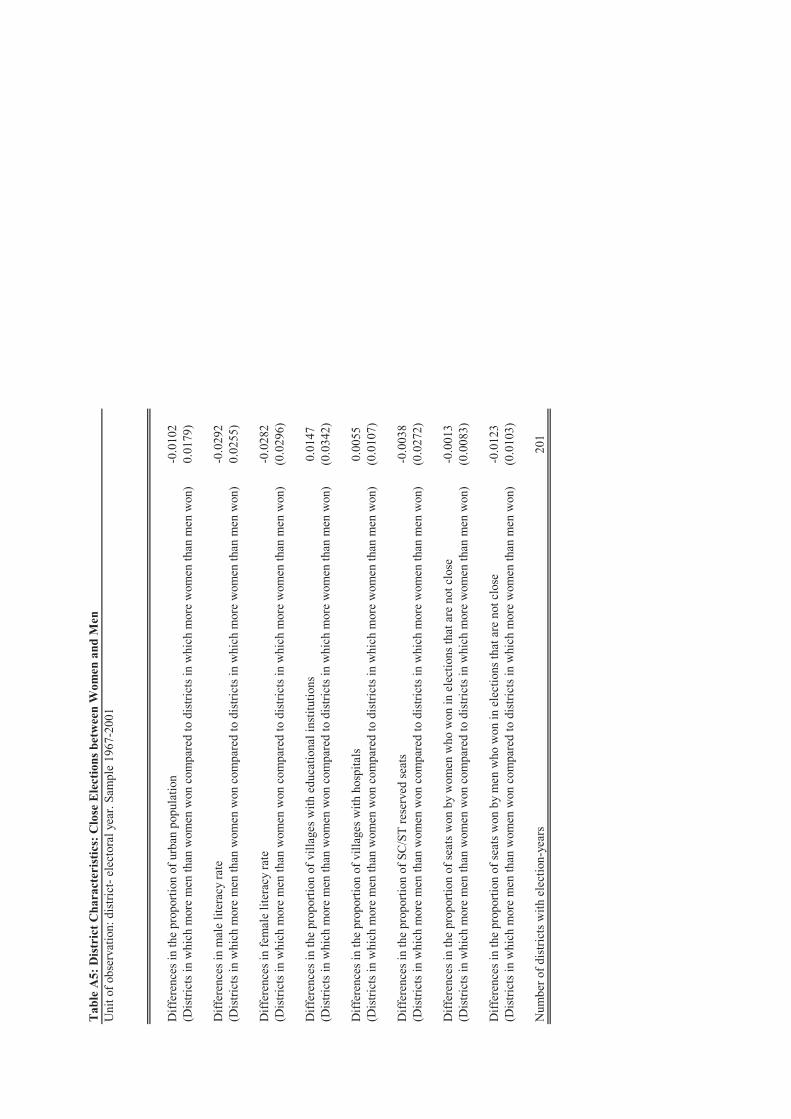
Tab
le A
5:
Dis
tric
t C
haracte
ris
tics:
Clo
se E
lecti
on
s b
etw
een
Wom
en
an
d M
en
Unit
of
obse
rvat
ion:
dis
tric
t- e
lect
ora
l yea
r. S
ample
1967-2
001
Dif
fere
nce
s in
the
pro
port
ion o
f urb
an p
opula
tion
-0.0
102
(Dis
tric
ts i
n w
hic
h m
ore
men
than
wom
en w
on c
om
par
ed t
o d
istr
icts
in w
hic
h m
ore
wom
en t
han
men
won)
0.0
179)
Dif
fere
nce
s in
mal
e li
tera
cy r
ate
-0.0
292
(Dis
tric
ts i
n w
hic
h m
ore
men
than
wom
en w
on c
om
par
ed t
o d
istr
icts
in w
hic
h m
ore
wom
en t
han
men
won)
0.0
255)
Dif
fere
nce
s in
fem
ale
lite
racy
rat
e-0
.0282
(Dis
tric
ts i
n w
hic
h m
ore
men
than
wom
en w
on c
om
par
ed t
o d
istr
icts
in w
hic
h m
ore
wom
en t
han
men
won)
(0.0
296)
Dif
fere
nce
s in
the
pro
port
ion o
f vil
lages
wit
h e
duca
tional
inst
ituti
ons
0.0
147
(Dis
tric
ts i
n w
hic
h m
ore
men
than
wom
en w
on c
om
par
ed t
o d
istr
icts
in w
hic
h m
ore
wom
en t
han
men
won)
(0.0
342)
Dif
fere
nce
s in
the
pro
port
ion o
f vil
lages
wit
h h
osp
ital
s0.0
055
(Dis
tric
ts i
n w
hic
h m
ore
men
than
wom
en w
on c
om
par
ed t
o d
istr
icts
in w
hic
h m
ore
wom
en t
han
men
won)
(0.0
107)
Dif
fere
nce
s in
the
pro
port
ion o
f S
C/S
T r
eser
ved
sea
ts-0
.0038
(Dis
tric
ts i
n w
hic
h m
ore
men
than
wom
en w
on c
om
par
ed t
o d
istr
icts
in w
hic
h m
ore
wom
en t
han
men
won)
(0.0
272)
Dif
fere
nce
s in
the
pro
port
ion o
f se
ats
won b
y w
om
en w
ho w
on i
n e
lect
ions
that
are
not
close
-0.0
013
(Dis
tric
ts i
n w
hic
h m
ore
men
than
wom
en w
on c
om
par
ed t
o d
istr
icts
in w
hic
h m
ore
wom
en t
han
men
won)
(0.0
083)
Dif
fere
nce
s in
the
pro
port
ion o
f se
ats
won b
y m
en w
ho w
on i
n e
lect
ions
that
are
not
close
-0.0
123
(Dis
tric
ts i
n w
hic
h m
ore
men
than
wom
en w
on c
om
par
ed t
o d
istr
icts
in w
hic
h m
ore
wom
en t
han
men
won)
(0.0
103)
Num
ber
of
dis
tric
ts w
ith e
lect
ion-y
ears
201

TABLE A6: Post-neonatal mortality
OLS 2SLS 2SLS 2SLS
1 2 3 4
Fraction of seats in district won by female politician 0.0155 0.0483 0.0219 0.0104
(0.014) (0.059) (0.074) (0.074)
District FE X X
Cohort FE X X X X
Mother FE X X
Controls X
Margins 3rd ord pol. 3rd ord pol. 3rd ord pol.
Full sample
Observations 63,876 63,876 63,876 63,876
Number of mothers 17,647 17,647
Table A7: Full set of covariates for baseline regression (column 5, Table 2)
VARIABLES neonatal mortality
Fraction of seats in district won by female politician -0.2065***
(0.078)
Fraction of seats in the district that had close elections between 0.0258
women and men (0.037)
Female literacy rate -0.1384
(0.119)
Male literacy rate 0.0263
(0.139)
Proportion of SC/STs -0.1526
See Notes to Table 2. The dependent variable neonatal moratality is replaced with post-neonatal mortality. The absence of any effects may bebecause (a) postneonatal mortality is necessarily conditional upon (endogenous) survival through the neonatal period, (b) attribution of neonatal
mortality to state policy interventions that improve antenatal and early postnatal care is clearer than is the case for post-neonatal mortality, which ismore sensitive to household-level variables including nutritional investments in children and the hygiene, sanitation and pollution levels in thehousehold, or (c) neonatal mortality is more sensitive to investments in mothers (as opposed to children) than post-neonatal mortality.
Proportion of SC/STs -0.1526
(0.120)
Proportion of the population that is urban -0.0245
(0.119)
Female dummy -0.0096***
(0.002)
Birth order 2 -0.0312***
(0.003)
Birth order 3 -0.0573***
(0.006)
Birth order 4 -0.0817***
(0.008)
Birth order 5 -0.0999***
(0.011)
Birth order 6 -0.1142***
(0.014)
Birth order 7 -0.1186***
(0.016)
Birth order 8 -0.1292***
(0.020)
Birth order 9 -0.1454***
(0.023)
Birth order 10 -0.1887***
(0.029)
Birth order 11 -0.1089***
(0.040)
Birth order 12 -0.2282***
(0.079)
Birth order 13 -0.0064
(0.230)
Birth order 14 -0.2419***
(0.086)
Multiple birth 0.3011***
(0.019)
Observations 71,498
Number of mothers 18,754

Tab
le A
8:
Fu
rth
er r
ob
ust
ness
ch
eck
s: m
igrati
on
an
d p
oli
ticia
n c
ast
e
12
34
VA
RIA
BL
ES
Neo
nat
al m
ort
alit
y
Fra
ctio
n o
f se
ats
in t
he
dis
tric
t0.0
592
-0.1
089*
-0.1
703**
won b
y a
wom
an(0
.2364)
(0.0
640)
(0.0
728)
Fra
ctio
n o
f se
ats
in t
he
dis
tric
t-0
.1106
won b
y l
ow
cas
te (
SC
/ST
) w
om
en(0
.084)
Fra
ctio
n o
f se
ats
in t
he
dis
tric
t-0
.1353*
won b
y h
igher
cas
te w
om
en(0
.077)
Robust
nes
sm
igra
nt
No r
estr
icti
on
Chil
d b
orn
gen
der
*ca
ste
pla
cebo
curr
ent
loc
Cohort
FE
XX
XX
Moth
er F
EX
XX
X
Contr
ols
XX
XX
Mar
gin
s3rd
ord
pol.
3rd
ord
pol.
3rd
ord
pol.
3rd
ord
pol.
Obse
rvat
ions
9921
129417
102748
71,4
98
Num
ber
of
seqid
2951
33779
27633
18,7
54
See
Note
sto
Tab
le2.
Usi
ng
the
spec
ific
atio
nin
colu
mn
5of
Tab
le2,
colu
mn
1ru
ns
the
pla
ceb
oon
mig
rati
on
des
crib
edin
the
text,
effe
ctiv
ely
mat
chin
gch
ildre
nto
the
"wro
ng
"se
tof
poli
tici
ans.
Colu
mn
2re
mo
ves
the
bas
elin
ere
stri
ctio
nw
hic
hre
sult
ed
See
Note
sto
Tab
le2.
Usi
ng
the
spec
ific
atio
nin
colu
mn
5of
Tab
le2,
colu
mn
1ru
ns
the
pla
ceb
oon
mig
rati
on
des
crib
edin
the
text,
effe
ctiv
ely
mat
chin
gch
ildre
nto
the
"wro
ng
"se
tof
poli
tici
ans.
Colu
mn
2re
mo
ves
the
bas
elin
ere
stri
ctio
nw
hic
hre
sult
ed
inusi
ng
only
the
sam
ple
of
moth
ers
who
had
nev
erm
igra
ted.
Colu
mn
3use
sth
ew
eaker
rest
rict
ion
whic
his
that
we
incl
ude
only
chil
dre
nw
ho
wer
eb
orn
inth
eir
curr
ent
pla
ceof
resi
den
ce-
sow
edef
init
ely
hav
eth
emco
rrec
tly
mat
ched
topoli
tici
an
gen
der
but
we
excl
ude
any
sib
lings
they
may
hav
efo
rw
ho
mth
em
atch
isunce
rtai
n.
Inco
lum
n4,
we
inte
ract
the
var
iab
leof
inte
rest
(wom
en)
wit
hth
eca
ste
of
wom
enp
oli
tici
ans.

TA
BL
E A
9:
Rob
ust
ness
Ch
eck
s fo
r I
nfa
nt
Morta
lity
PA
NE
L A
Infa
nt
mort
alit
y
12
34
56
78
9
Fra
ctio
n o
f se
ats
in d
istr
ict
won b
y f
emal
e poli
tici
an-0
.1724*
-0.1
779*
-0.1
420
-0.1
911
-0.2
505**
-0.1
210
-0.2
390*
-0.2
235*
-0.2
067**
(0.0
97)
(0.0
98)
(0.1
55)
(0.1
45)
(0.1
16)
(0.0
94)
(0.1
30)
(0.1
23)
(0.1
03)
Cohort
FE
xx
xx
xx
xx
x
Moth
er F
Ex
xx
xx
xx
xx
Contr
ols
xx
xx
xx
xx
x
Mar
gin
s1st
ord
pol
2nd o
rd p
ol.
3rd
ord
pol.
3rd
ord
pol.
3rd
ord
pol.
3rd
ord
pol.
3rd
ord
pol.
3rd
ord
pol.
3rd
ord
pol.
Robust
nes
svo
te m
arg
invo
te m
arg
in2
%2
.50
%3
%4
%a
t le
ast
ou
tlie
rsp
oli
tica
l
on
e w
-m e
leco
ntr
ols
Obse
rvat
ions
68,6
65
68,6
65
68,6
65
68,6
65
68,6
65
68,6
65
28,5
02
67,7
93
68,6
65
Num
ber
of
moth
ers
18,0
03
18,0
03
18,0
03
18,0
03
18,0
03
18,0
03
9,5
22
17,8
48
18,0
03
PA
NE
L B
Infa
nt
mort
alit
y
12
34
56
Fra
ctio
n o
f se
ats
in d
istr
ict
won b
y f
emal
e poli
tici
an-0
.1908*
-0.1
763
-0.1
357
-0.1
925*
-0.1
842*
(0.0
99)
(0.1
09)
(0.1
00)
(0.1
06)
(0.1
03)
(0.0
99)
(0.1
09)
(0.1
00)
(0.1
06)
(0.1
03)
Fra
ctio
n o
f se
ats
in d
istr
ict
won b
y f
emal
e poli
tici
an-0
.1773*
in a
clo
se e
lect
ion a
gai
nst
a m
ale
poli
tici
an(0
.097)
Cohort
FE
xx
xx
xx
Moth
er F
Ex
xx
xx
Contr
ols
xx
xx
xx
Mar
gin
s3rd
ord
pol.
3rd
ord
pol.
3rd
ord
pol.
3rd
ord
pol.
Robust
nes
sq
ua
dra
tic
tren
ds
sta
te*
yea
r d
um
dis
tric
t*m
oth
er
ag
e m
oth
er
mo
ther
co
ho
rt*
red
uce
d f
orm
coh
ort
fe
chil
d b
irth
yr
Obse
rvat
ions
68,6
65
68,6
65
68,6
65
68,6
65
68,6
65
68,6
65
Num
ber
of
moth
ers
18,0
03
18,0
03
18,0
03
18,0
03
18,0
03
See
no
tes
toT
able
3.N
eonat
alm
ort
alit
yis
now
rep
lace
dw
ith
infa
nt
mort
alit
y.

Ta
ble
A1
0:
Tim
ing
of
Eff
ects
an
d F
als
ific
ati
on
Ex
ercis
e f
or I
nfa
nt
Mo
rta
lity
Coef
fici
ent:
Fra
ctio
n o
f se
ats
in t
he
dis
tric
t w
on b
y f
emal
e p
oli
tici
ans
Infa
nt
mo
rtal
ity
Chil
d's
age
when
poli
tici
an w
as i
n p
ow
erco
eff
se
-50
.06
40
0.1
10
0
-40
.00
03
0.1
01
0
-3-0
.14
60
0.1
05
0
-2-0
.23
83
**
0.1
10
0
-1-0
.19
16
*0
.10
40
0-0
.21
54
*0
.11
30
1-0
.05
73
0.1
11
0
2-0
.04
94
0.0
96
0
3-0
.08
93
0.1
12
0
4-0
.09
53
0.1
02
0
5-0
.01
06
0.0
93
0
6-0
.03
49
0.1
01
0
7-0
.04
71
0.0
96
0
8-0
.02
15
0.0
98
0
9-0
.04
61
0.1
10
0
See
Note
sto
Tab
le4.H
ere
we
rep
lace
neo
nat
alw
ith
infa
nt
mort
alit
yas
the
dep
enden
tvar
iab
le.

Tab
le A
11:
Eff
ect
of
Fem
ale
Poli
ticia
ns
on
Bir
ths:
Ferti
lity
an
d G
en
der o
f B
irth
12
34
56
78
Dep
enden
t var
iable
: bir
thbir
thbir
thbir
thfe
mal
efe
mal
efe
mal
efe
mal
e
2S
LS
2S
LS
2S
LS
2S
LS
2S
LS
2S
LS
2S
LS
2S
LS
Fra
ctio
n o
f se
ats
in t
he
dis
tric
t w
on b
y a
fem
ale
0.0
913
0.0
800
-0.0
058
0.0
100
0.2
997**
0.3
008**
0.2
533*
0.2
217
poli
tici
an
(0.0
57)
(0.0
59)
(0.1
01)
(0.0
82)
(0.1
25)
(0.1
27)
(0.1
47)
(0.1
43)
Dis
tric
t F
Ex
xx
x
Cohort
FE
xx
xx
xx
xx
Moth
er F
Ex
xx
x
Contr
ols
xx
xx
Obse
rvat
ions
379,5
84
379,5
84
379,5
84
379,5
84
71,8
73
71,8
73
71,8
73
71,8
73
Num
ber
of
seqid
25,1
71
25,1
71
18,8
42
18,8
42
See
Note
sto
Tab
le2.
As
dis
cuss
edin
the
text,
we
exp
and
the
dat
ato
incl
ude
for
ever
ym
oth
era
pan
elof
ever
yyea
rat
whic
hsh
ew
asat
risk
of
bir
th.
We
then
esti
mat
eth
ep
rob
abil
ity
of
con
tin
uin
g
fert
ilit
y(1
ifb
irth
,0
ifnot,
inea
chyea
r,fo
rea
chw
om
an)
inco
lum
ns
1-4
and
the
pro
bab
ilit
yth
atth
eb
irth
isfe
mal
eco
ndit
ional
up
on
bir
thin
colu
mn
s5
-8.
Sin
ceco
lum
ns
1-4
sug
ges
tth
atth
ere
isn
o
endogen
eity
inb
irth
,th
eco
ndit
ionin
gon
bir
thin
colu
mns
5-8
isunli
kel
yto
crea
tean
ysi
gnif
ican
tse
lect
ivit
y.
The
four
colu
mns
inea
chse
to
fre
gre
ssio
ns
par
alle
lco
lum
ns
2-5
inT
able
2in
the
spec
ific
atio
ns
that
they
use
.W
ein
stru
men
tw
ith
close
elec
tion
outc
om
esas
inth
eb
asel
ine
spec
ific
atio
ns
for
mort
alit
yan
din
puts
tohea
lth
and
surv
ival
.T
her
eis
no
evid
ence
of
po
liti
can
gen
der
imp
acti
ng
fert
ilit
y.
Ther
eis
som
eev
iden
ceth
atp
oli
tica
ngen
der
imp
acts
the
sex
of
bir
ths,
wit
hth
ep
rob
abil
ity
that
the
bir
this
fem
ale
incr
easi
ng
inth
esh
are
of
fem
ale
po
liti
cian
sin
the
dis
tric
to
fb
irth
.

26
������������
� ������ � ���� ���� ��������� ���� ���� �� �������� �� ���� ������������ �������� � � �� ������������ �� �������������������������������������������� ���������� ���� ��������������� ����������������������������� ����������������������� ������ ���������������� !���� ������������������ ������ ��� �� "!#$%&& �� '��� ���������� � �� �� ������ ��� ���� ��� ���� �������� ������ (�� �������������������� ����������������� �������������� �)�������� �(����������������� ������ ������ ������ � ����� �������� � � ����� ������� � ����� ��������� (���� )� ������ ��� *���������� � ������� �������������� ����� ����+� ����� ����� ��� � �(��� ������� � � ������� ����� ���������� ��� �� ������������������������� ���� "" � �� ������������ �� ���� � � � � ������ ��� ��������������� �����(���� � ����� ����� ������ ��� ������ ���� ���� ���������� ���� "!� ��������� ����� ��� ��� ������ �������� ��� "!#��������������������% ����������� ������ ����������������������������������������������� ������ ��,���������������������������� � ��� � �� ��������������������+�������$���-� ������������+�������������+�������� ��������������� �������������������������������������� �������� � � ��.������/���� ������ ���� �� �� � � ���� ��,������ ���� �� ������(�� � ����� ������������� � �� ������ � � ���� �������� (� � ��� ����� ���������� ������� '����(� �� 0������ � � 0�������1%&&%2� (�� �� ������� ���� ����(� �� ������ �������� )� ������ �������� � ����� � �� � 3���� ���)� �����4��+� � �� �3���� ��� )� ������ ���������� 5������+� � � � �� �3���� ��� )� �������6��������������� � ����� ����)���� ����5������� � ��� � � ����)���� ����5������� � ���/��,����5�������� ���������������� � �����5��7�� ����������5����� � �����������5������ 8� ������������ � �����8� ���+� ��-� *��+� � � 8� ���� *��� ��������� 6� �� �������� � ����� ���� 0��������� 8� ���� 5����������� ��� �������� � ����� ������� *����+� ����� �� �� 5������+� 8����� 9� :������� 3���� ���)� �����+�������� �+�4-����)� �����+�������� ����-����*��+�� ������������������������������������� ������� �������� ���
������������������ ������ ��� ����� � � ���� ����� �� ��� �� ����� ������ ���������� �������������������� �����������������������������(�������$����� ��� ������������� ��� ��(������� ���+�(�� �� �� ���� ���������� � �������� ��� � �������� �� ���� ����� ��� ����� ���� �������� ���� ������������ �������7������������(�����������������,�������������������� �����-��'����,�����+����� ��������� �� ���������������(������������ ���� � ����� ��� ����� ��������� ���������� ������������
������ ���������� ������������������ ���������������������� ��������� ��������������� ������������������������ �� ������������������� ������� ������ � ���������������� � �� ��� ����������������� ��������������������� ��������������� ��� �� ������(���� �������� �� ����������(���������� ������������������3'6�������� ��� ��������� ������� �� �� ������� ������������ ��� ����������� �� ���� ������ � ��� ��� � � ��������� ��� ������� ��� ����� �� ���� ����� ��� ��� ���� �� ����������+� ��� (�� �� ��� ���� ���� � ����+� (�� �� �� � � � ������� ��� (������� ��� ��� ������������ ������� ��������� �� � � ���� ����� %;� ������ ����(� �� �� ������� � �� � � � ����������� 6� ������������� ����������������������-+��� ��� � �����������+����������������������������������� ��)��������� �� ��� �� ����� ��� � � � �������� ����� ���� ����������� ������� �� � � � � � ���� �� ��(������ ��$ ������� �� ������������������� ������������������������������������ �����������������������������������(��-�������� �<���� ������������������������� ������������� ���� ������������������� ��������������������������������� �<���� ���������������������������������������������� �������������� ����,������������������ �� ������������������������������ � ������������� ����� �� ��� � ��� �������������� ��� ����������� ������������� ������������ ��� �������� ������ ��� � � ����� �������� ������� ���� ����� ������� ���������$� ����� ������� � � ���� ���������������(�� ������������(����������������������� ���������� ������� �������(���� �������������������������� +�(��������������������������� ���� � ��������+���������� ���������������������������(������������������������ �����������=������� ��������������� �����
��(���$- �( � ��������(���� �������������� ��������� ���� ��� ����� ����� ����(���$������������������������ �����������(��� ���������������� ������(���������������������������������� ���������������� ������������ ��������(��� �(���(������� ����������������������1�� ������������ ">%2������� ��������������������������������������� �(���,������������������������������������� ��� � � ���� ������� �,�� ������ ����������� ��� ��� ���� �,�� �� ����� ����� (��� � �� ������������������������ � ������(+�(������ �������������������������������������(���� ����������������������� � ���� ������ ���(���� ������ ������ �,��� �������������������� ������������+� ��������� ��-����

27
�������� �������� ��� ������������������+� ��� ��� �� ����������� ����?� ���(���������������@;&����� &&+&&&��������� �%&&&�1�����0� -�6�����+�3������� �� �5�������� �*���2��