health and nutritional status of mothers and children ... · village project area, wolkite,...
TRANSCRIPT

1
Health and nutritional status of mothers and children below 5 years in the Bio-
Village Project Area, Wolkite, Ethiopia
Report written by Andrea Golder Hohenheim, February 2001 (e-mail: [email protected]) Collaborators: In Germany In Ethiopia Dr. Veronika Scherbaum Dr. Jürgen Greiling, ICIPE, Addis Ababa Prof. Dr. Hans-Konrad Biesalski Mr. Samson Taffesse, EHNRI, Addis Ababa Collaborating Institutions: Institute of Biological Chemistry and Nutrition, University of Hohenheim, Germany International Center of Insect Physiology and Ecology (ICIPE), Addis Ababa, Ethiopia Ethiopian Health and Nutrition Research Institute (EHNRI), Addis Ababa, Ethiopia

2
Acknowledgement First of all, I would like to express my gratitude to Dr. Jürgen Greiling (ICIPE) and Dr. Veronika Scherbaum (University of Hohenheim) who planned this survey as a co-operation between ICIPE, the Institute of Biological Chemistry and Nutrition, University of Hohenheim and EHNRI. I am especially grateful for all their support and encouragement throughout the whole process, from the planning of the survey to the writing of the report. My thanks are also addressed to Mr. Samson Taffesse from EHNRI for all his constructive discussions and practical advice. I am very much indebted to ISFE (International Foundation for Nutrition Research and Nutrition Education) for funding this research project. I would like to express my special thanks to Rahel Adamu and Dawit Estifanos with whom I undertook the field work from beginning to end. Not only did they fulfil their “official” work as translator (Rahel) and driver (Dawit), but they always supported all the work very enthusiastically wherever necessary, and until all the work was finished. In addition, my thanks are addressed to Abbay Bekele who conducted the focus group discussion with the men, and to Tilahun Amare who drove the car in the second half of the study period when the weather conditions became worse. It was not only a pleasure for me to work with all of you, but also to share our free time together in Wolkite as friends to help me to become familiar with the country and the culture. My special acknowledgements also go to Adanech Belehu, Fetlework Kefele, Tsige W/Medhin, Yenenesh from Wolkite, and to Ato Kebede from Attat Hospital who conducted the interviews with and health assessment of the children. At the Institute of Biological Chemistry and Nutrition, University of Hohenheim I would further like to thank Prof. Dr. Hans-Konrad Biesalski for his support. I am very thankful to Dr. Jürgen Erhardt for instructing me in the use of his nutrition programme NutriSurvey. From ICIPE, I acknowledge the kind support of Dr. Getachew Tikubet and Dr. Shiffa Ballo. Furthermore, I wish to thank the Regional Health Office, the Wolkite Health Center, and the Attat Hospital for their support by means of experienced health staff and by making available the necessary medicine for treatment. Special thanks go to the Attat Hospital for co-operating and identifying mothers of malnourished children from Luke in their nutrition department. Finally, I would especially like to thank Gillian Eisele from Great Britain who proof-read this paper for English wording and grammar. Last, but not least, my thanks go: To all the women and men in Tatessa who patiently answered all the questions during the pre-testing phase To all the women in Mamede and Luke who participated in this survey, willingly took their time to answer the questions during the interview, and came to a special place for anthropometric and health measurement. Hopefully this study will serve as a basis for improving their and their families’ situations so that they can profit from it in future.

3
ACKNOWLEDGEMENT 2
TABLE OF CONTENTS 3
ABBREVIATIONS AND EXPLANATIONS 6
1 INTRODUCTION 7
1.1 NUTRITIONAL AND HEALTH STATUS 7 1.1.1 CAUSES OF MALNUTRITION 7 1.1.2 CONSEQUENCES OF MALNUTRITION 8 1.1.3 NUTRITIONAL ASSESSMENT AND DEFINITIONS 9 1.1.4 DEFINITION OF MALNUTRITION ACCORDING TO ANTHROPOMETRIC INDICES 10 1.1.5 SEVERE MALNUTRITION 12 1.2 FOOD INTAKE 12 1.2.1 RELATIONSHIP BETWEEN NUTRITIONAL INTAKE, HEALTH AND NUTRITIONAL STATUS 12 1.2.2 DIETARY RECOMMENDATIONS 13 1.2.3 REFERENCE NUTRIENT DENSITIES FOR SELECTED NUTRIENTS 14 1.3 BACKGROUND TO THE COUNTRY 16 1.4 BIO-VILLAGE PROJECT AREA 16 1.4.1 BIO-VILLAGE PROJECT 16 1.4.2 INFORMATION ABOUT ENSET, THE STAPLE FOOD IN THE PROJECT AREA 17 1.4.3 INFORMATION ABOUT THE GURAGE 18 1.4.4 INFORMATION ABOUT THE PROJECT AREA 19 1.5 DESIGN OF THE STUDY 24 1.6 STUDY OBJECTIVES 24
2 METHODS 25
2.1 STUDY POPULATION 25 2.2 SAMPLE SIZE AND COVERAGE OF THE STUDY AREA 25 2.3 SURVEY SCHEDULE 27 2.4 METHODS OF DATA COLLECTION 28 2.5 HEALTH ASSESSMENT (“POINT PREVALENCE” OF UNDERLYING DISEASES) 30 2.6 ANTHROPOMETRIC ASSESSMENT 31 2.7 SURVEY TEAMS AND INTERVIEWER TRAINING 31 2.8 STATISTICAL ANALYSIS 32

4
3 RESULTS OF THE INDEX CHILDREN 33
3.1 HOUSEHOLD CHARACTERISTICS 33 3.1.1 HEAD OF THE HOUSEHOLD 33 3.1.2 AGE OF THE PARENTS 33 3.1.3 EDUCATION LEVEL OF THE PARENTS 34 3.1.4 NUMBER OF CHILDREN 35 3.1.5 RELIGION OF MOTHERS 37 3.1.6 NUMBER OF PREGNANT AND LACTATING MOTHERS 37 3.1.7 EXAMINATION IN A HEALTH INSTITUTION DURING PREGNANCY 38 3.2 ECONOMIC CHARACTERISTICS 39 3.2.1 INCOME-GENERATING ACTIVITIES OF THE FAMILY 39 3.2.2 AGRICULTURAL PRODUCTION 40 3.2.3 LIVESTOCK PROPERTY 42 3.3 SOCIAL CHARACTERISTICS 44 3.3.1 TIME NEEDED AND ALLOCATED RESPONSIBILITY FOR WATER COLLECTION 44 3.3.2 SUPPORT 45 3.3.3 NUMBER OF MEALS CONSUMED BY THE MOTHER AND THE INDEX CHILD 46 3.4 ANTHROPOMETRY 47 3.4.1 WFA, HFA AND WFH OF THE INDEX CHILDREN 47 3.4.2 BMI, WEIGHT AND HEIGHT OF THE NON-PREGNANT MOTHERS OF THE INDEX CHILDREN WHO WERE
INTERVIEWED 48 3.5 HEALTH STATUS (POINT PREVALENCE) 48 3.6 24-H RECALL 49 3.6.1 ENERGY DISTRIBUTION OF MACRO-NUTRIENTS, AND NUTRIENT DENSITY OF THE CHILDREN 49 3.6.2 ACTUAL NUTRIENT INTAKE OF THE NON BREAST-FED CHILDREN 51 3.6.3 ENERGY DISTRIBUTION OF MACRO-NUTRIENTS AND NUTRIENT DENSITY OF THE MOTHERS 53 3.6.4 ACTUAL NUTRIENT INTAKE OF THE MOTHERS 54 3.7 FOOD CONSUMPTION PATTERN OF THE INDEX CHILD 56 3.8 INFANT AND CHILD FEEDING PRACTICES AMONG THE INDEX CHILDREN 61 3.8.1 INITIATION OF BREAST-FEEDING AND PRE-LACTEAL FEEDING 61 3.8.2 DURATION OF EXCLUSIVE BREAST-FEEDING AND AGE FOR TERMINATION OF BREAST-FEEDING OF
THE INDEX CHILDREN 63 3.8.3 COMPLEMENTARY FEEDING 63 3.8.4 BOTTLE-FEEDING 64 3.9 EATING HABITS OF THE MOTHER DURING THE POSTNATAL PERIOD 65
4 RESULTS RELATING TO ALL OF THE CHILDREN (BELOW 5 YEARS) 66
4.1 ANTHROPOMETRY 66 4.1.1 WFA, HFA AND WFH OF ALL THE CHILDREN MEASURED 66 4.1.2 SEVERELY MALNOURISHED CHILDREN 67 4.1.3 BMI, WEIGHT AND HEIGHT OF THE NON-PREGNANT MOTHERS INTERVIEWED 67 4.2 HEALTH STATUS (POINT PREVALENCE) OF ALL THE CHILDREN (BELOW 5 YEARS) 68 4.3 DURATION OF EXCLUSIVE BREAST-FEEDING AND AGE FOR TERMINATION OF BREAST-FEEDING 69

5
5 DISCUSSION 71
5.1 HOUSEHOLD CHARACTERISTICS 71 5.2 ECONOMIC CHARACTERISTICS 72 5.3 SOCIAL CHARACTERISTICS 73 5.4 ANTHROPOMETRIC RESULTS 73 5.5 HEALTH ASPECTS 74 5.6 FOOD INTAKE 75 5.6.1 FOOD CONSUMPTION PATTERNS 75 5.6.2 FOOD INTAKE THE PREVIOUS DAY 76 5.7 BREAST-FEEDING AND COMPLEMENTARY FEEDING PRACTICES 80 5.8 COMPARISON BETWEEN THE TWO VILLAGES 83
6 RECOMMENDATIONS 86
6.1 RECOMMENDATIONS FOR THE BIO-VILLAGE PROJECT 86 6.1.1 PROMOTION OF AGRICULTURAL AND HOUSEHOLD ACTIVITIES 86 6.1.2 NUTRITION AND HEALTH EDUCATION PROGRAMMES 86 6.2 SPECIAL TOPICS OF HEALTH AND NUTRITIONAL EDUCATION 87 6.2.1 CHILDCARE 87 6.2.2 HEALTH EDUCATION 87 6.2.3 BREAST-FEEDING 87 6.2.4 COMPLEMENTARY FEEDING 88 6.2.5 PROMOTION OF THE MOTHERS’ NUTRITIONAL STATUS 88 6.2.6 GENERAL DIETARY HABITS FOR THE WHOLE FAMILY 89 6.3 TOPICS FOR FURTHER RESEARCH 89
7 SUMMARY 91
8 REFERENCES 98
9 APPENDIX 102

6
1 Abbreviations and Explanations
Adengwarrye Kidney beans Ater Peas Amicho Stem of the enset plant, unfermented, cooked and tasting like potatoes Bakela Broad beans Beso Beverage prepared from barley and water BMI Body Mass Index Bulla Refined, fermented product from enset (made by dehydrating the juice
collected during the decortication of the stem and pseudostem) cm Centimetre CHW Community Health Worker CSA Central Statistical Authority of Ethiopia Debo Working co-operation Eder Financial co-operation EHNRI Ethiopian Health and Nutrition Institute, formally called Ethiopian Nutrition Institute (ENI) Enset Ensete ventricosum, false banana, used for the staple food of the Gurage FAO Food and Agriculture Organization Gurage Tribe in Ethiopia HAZ Height for Age z-score HFA Height for Age ICIPE International Center for Insect Physiology and Ecology Injera Flat bread made from fermented tef dough, similar to a pancake kg Kilogram Kitfo Raw or roasted minced meat Kocho Fermented product of the starchy parts of enset Miser Lentils MoA Ministry of Agriculture NCHS National Center for Health Statistics RDA Recommended Dietary Allowance SD Standard deviation Shimbra Chick peas Tef Eragrostis tef, indigenous grain of Ethiopia, which is rich in iron Tela Locally prepared beer UNICEF United Nation Children’s Fund WAZ Weight for Age z-score WFA Weight for Age WFH Weight for Height WHO World Health Organization. WHZ Weight for Height z-score

7
2 Introduction
2.1 Nutritional and health status
2.1.1 Causes of malnutrition
There are various factors involved in the development of malnutrition. UNICEF (1998) derived a general model from previous diagrams to describe possible relationships. Figure 1: Causes of child malnutrition [Source: UNICEF, 1998].
Poor water/sanitation andinadequatehealth services
Inadequatematernal andchild-carepractices
Insufficientaccess to food
Underlying causes athousehold/family level
Quantity and quality ofactual resources — human,economic and organisational— and the way they arecontrolled
Potential resources:environment, technology, people
Basic causes atsocietal level
Immediate causesInadequatedietary intake Disease
OutcomesChild malnutrition,death and disability
Inadequate and/orinappropriateknowledge anddiscriminatoryattitudes limithousehold access toactual resources
Political, cultural,religious, economicand social systems,including women'sstatus, limit theutilisation ofpotential resources

8
Of further importance to the children’s development is the nutritional and health status of the mother. It is not only a main factor in the life quality of the mother herself, but strongly influences the health and nutritional status of her children. Poor nutritional and health status of the mother can be passed from one generation to the next as shown in Figure 2. Figure 2: Intergeneration cycle of growth failure [Source: ACC/SCN, 1992].
Low weight andheight in teenagers
Small adult woman
Child growthfailure
Early pregnancyLow-birthweightbaby
A mother who grew poorly in her own childhood and developed into a stunted women herself is more likely to give birth to a low weight infant, especially if it is a teenage pregnancy. If the infant is a girl, the cycle is likely to continue into the next generation (UNICEF, 1998). Furthermore, her capacity for work and attention to and care for her children is reduced if she herself is affected through poor nutritional and health status due to the underlying causes of child malnutrition, as seen in Figure 1. Therefore women are key persons whose nutrition has to be addressed in order to improve the nutritional situation of children, not only short-term, but for the whole of society in the long run. The causal relationship between these factors and the development of malnutrition in a certain population has to be examined and verified in order to develop measures appropriate to the improvement of a given situation.
2.1.2 Consequences of malnutrition
The health and social consequences of a high prevalence of impaired child growth are severe. Malnourished children tend to have a higher morbidity from diseases like the more severe diarrhoeal episodes (Briend, 1990), or pneumonia (Victora et al., 1994). There seems to be an association between increased mortality and increasing severity of anthropometric deficits. Indeed, out of 11.6 million deaths among children below 5 years in 1995 in low-income countries, it has been estimated that 6.3 millions (54%) of young child mortality were associated with malnutrition, the majority of which is due to the potentiating effect of mild to moderate malnutrition as opposed to severe malnutrition (Bailey et al., 1998). Further, there is strong evidence that poor growth or smaller size is associated with impaired development (Pollitt et al., 1993) demonstrated in a relation between growth status and school performance and intellectual achievement (Martorell et al.,

9
1992). However environmental or socio-economic factors have to be considered too. Nutritional status might also function as an indicator of a sub-optimal environment and socio-economic condition where the children grow up. An intervention study in Jamaica indicates that the developmental status of underweight children can be partly improved by food supplementation or by intellectual stimulation, but that greatest improvements are achieved through a combination of both (Grantham-McGregor et al., 1991). There are also important consequences in adult life in terms of body size associated with the risk of chronic diseases and reduced work capacity (Spurr et al., 1977), which in turn has an impact on economic productivity. In addition, maternal size is associated with specific reproductive outcomes which are partly mentioned in chapter 2.1.1. Therefore UNICEF states and summarises: “To assure proper development and quality of life, nutritional, health and caring aspects must be adequate, starting from early childhood onwards. In particular the period below 18 months of life is important for the physical, intellectual and emotional development of a child. Malnutrition increases a child’s risk of contracting respiratory infections, diarrhoea, measles and other diseases that often kill children or permanently harm their physical, psycho-social and cognitive development” (UNICEF, 1999).
2.1.3 Nutritional assessment and definitions
Anthropometric measurements are widely used in the assessment of the nutritional status, particularly when a chronic imbalance of energy and nutrients in a population occurs in conjunction with frequent diseases. Such disturbances change the patterns of physical growth and the relative proportions of body tissues such as fat, muscles, and total body water. Anthropometric measurements are of two types: growth, and body composition measurements. In the following survey the growth measurements derived from a single measurement of weight and height were used to assess the nutritional status of the women and children. Children: Weight and height in connection with age are needed for the following three indicators which are used for children below 5 years:
Weight-for-height (WFH) reflects the body proportion. It is an indicator for acute malnutrition, called wasting (the children are too thin for their height). Height-for-age (HFA) is an indicator of linear growth and reflects the degree of chronic malnutrition. If children are too small for their age, they are stunted. Weight-for-age (WFA) reflects a synthesis of both linear growth and body composition and indicates the level of underweight, if children are too light for their age.
The weight-for-height (WHZ), height-for-age (HAZ), Weight-for-age (WAZ) –z scores are used to classify the children according to their nutritional status with the following formula:
z-score (SD-score) = Observed value – median reference value Standard deviation of the reference population
The reference data of the National Center for Health Statistics (NCHS) are used world-wide and promoted by WHO or UNICEF for comparison of the nutritional status between regions or

10
countries. Formerly growth deficits were expressed as a percentage of the median reference curve. Now, most of the data are calculated in median z-scores in relation to the reference population. One important limiting factor has to be kept in mind in using the NCHS reference data. These data represent a number of children in the US in the 1970th who were predominantly formula-fed. It has been recognised that the growth pattern of breast-fed infants differs from that of formula-fed infants, starting from 4 to 6 months and during the first year (WHO, 2000). Therefore breast-fed infants often seem to suffer from growth faltering, when compared to the currently recommended NCHS reference curves, while they follow a different growth pattern. A new international growth reference is currently being established, but not yet available. Adults The degree of thinness in adults (above 18 years) is commonly assessed using the body mass index (BMI) as the indicator. The BMI is calculated from weight and height measurements using the following formula:
BMI = Weight (in kg) Height2 (in m2)
The BMI is known to be highly correlated with both fat and fat-free mass, although these associations may vary with age, sex and ethnicity. BMI reflects protein and fat reserves, which in turn reflect functional reserves, including the ability to survive nutritional deficit and some disease. It may be used to estimate the prevalence of chronic undernutrition for population-level (ACC/Sub-Committee on Nutrition, 2000). However, there are several difficulties associated with the use of BMI as an anthropometric index. Many factors other than nutritional status determine BMI. Most important of these is the body shape, in particular the ratio of leg-length to trunk-length (sitting height to standing height ratio [SH/S]). This index varies both between populations and within populations. Secondly, adult body size, shape and composition vary with age. Adults tend to lose fat free mass and increase fat mass with age, especially above 50 years level (ACC/Sub-Committee on Nutrition, 2000).
2.1.4 Definition of malnutrition according to anthropometric indices
Children In early classification systems of malnutrition the index weight for age was used and expressed as a percentage of the expected weight of a child of that age, using the 50th percentile (median) of the reference population as reference point (Gomez classification according to Gomez et al, 1956). The Waterlow classification system (1972) introduced the terms stunting and wasting, using the 50th percentile of the reference data as reference point. The Wellcome classification (1970) also used the weight for age as the index, but included, in addition, the occurrence of oedema to assist in distinguishing between marasmus and kwashiorkor. This classification was modified by Hendrickse, who divided the expected weight for age section into three instead of the previous two categories (see Table 1). Table 1: Modified Wellcome Classification of malnutrition (Hendrickse, 1991)
% expected weight for age Oedema Present Absent > 80% Kwashiorkor normal nutrition 80 – 60 % underweight kwashiorkor underweight < 60 % Marasmic kwashiorkor marasmus

11
However the categories with presence of oedema were abolished later because oedematous malnutrition is always a serious condition (WHO, 1999) independent of the weight categories. This is expressed in the new scheme published by WHO (1999) for the classification of malnutrition. Furthermore, the weight-for-age index is no longer used. The weight-for-height and height-for-age indexes are applied as shown in Table 2. The formerly used terms kwashiorkor and marasmus have been abolished, and terms like oedematous malnutrition, severe wasting and severe stunting are used instead. Table 2: WHO promoted classification of malnutrition (1999).
Moderate malnutrition Severe malnutrition1 Symmetrical oedema No Yes
oedematous malnutrition2 Weight-for-height -3 = SD-score < -23
(70-79%)4 < -3SD z-score
(< 70%) severe wasting5
Height-for age -3 = SD-score < -2 (85-89%)
< -3SD z-score (< 85%)
severe stunting 1 The diagnoses are not mutually exclusive. 2 This includes kwashiorkor and marasmic kwashiorkor in the older classifications. However, to avoid confusion with the clinical syndrome of kwashiorkor, which includes other features, the term “oedematous malnutrition” is preferred. 3 Below the median NCHS/WHO reference curve. 4 Percentage of the median NCHS/WHO reference curve. The percentage values used to define moderate and severe malnutrition vary among the indexes. 5 This corresponds to marasmus (without oedema) in the Welcome classification, and to grade III malnutrition in the Gomez system. However, to avoid confusion, the term “severe wasting” is preferred. According to WHO (1999), children whose weight-for-height is below –3 SD (or less than 70%) of the median NCHS/WHO reference values, or who have symmetrical oedema involving at least the feet should be admitted to hospital where they can be observed, treated and fed day and night. Stunted children are usually considered to be suffering from a milder, chronic form of malnutrition. Therefore stunted children may be satisfactorily managed in the community, rather than in hospital. However their condition can rapidly worsen with the onset of complications such as diarrhoea, respiratory infections or measles. In such situations, stunted or underweight children should also be admitted to a hospital. In addition, the WHO (1995) published a ”severity index for malnutrition in emergency situations” based on the prevalence of wasting (WHZ < -2SD) and mean weight-for-height z-score for children under 5 years. This index helps to classify the severity of the actual situation according to acute malnutrition, and to decide whether to take relief action or other measures. Table 3: Severity index for malnutrition based on the prevalence of wasting (WHZ < -2SD) and mean weight-for-height z-score for children < 5 years.
Classification of severity
Wasting (% <-2SD) Mean WFH z-score Proposed relief action
Acceptable < 5 > 0.40 Poor 5 – 9 - 0.40 to – 0.69 Supplementary feeding possible Serious 10 – 14 -0.70 to –0.99 Selective supplementary feeding of the
malnourished is of high priority Critical = 15 = -1.00 Improved basic food supply. Additional
food to all children and vulnerable groups

12
Adults The classification for adults (between 18 and 50 years) for providing data to identify chronically undernourished adult people in a population is presented in the following table: Table 4: Classification of categories of chronic malnutrition by adults by BMI.
BMI [kg/m2] Nutritional status = 18 Normal 17.0 – 18.49 Mild malnutrition 16.0 – 16.99 Moderate malnutrition < 16.0 Severe malnutrition There is increasing evidence that low BMI is related to increases in both morbidity and mortality [Reddy, 1991] and, in women of reproductive age, to a higher prevalence of low birth-weight babies.
2.1.5 Severe malnutrition
There are 2 main and visible types of severe malnutrition: oedematous (kwashiorkor) and non-oedematous malnutrition (marasmus) and a mixture of both (marasmic kwashiorkor).
The typical visible signs of the extreme forms of malnutrition are described as follows: The signs of marasmus are extremely low weight with evident extreme wasting of arms, legs and buttocks, because the child has lost much of its fat and muscles. The face may look like the face of an old person. The abdomen sticks out, because the muscles of the abdominal wall are wasted and weak (pot belly). Further the child seems irritable, fretful but is often alert and hungry, unless there is an active infection. The kwashiorkor child develops oedema of the face (moon face), legs and arms. The weight is not extremely low like that of a marasmic child, but often moderately low. There are wasted muscles especially over the shoulders, upper arms, and the scapulae. The children also develop a pot belly and the muscles are usually flabby. In contrast to the marasmic child, the kwashiorkor child is usually miserable and apathetic with poor appetite. The children often look pale. The skin appears thin and might peel. The hair is often sparse and thin with a lighter colour or reddish tinge and with poor roots so that it can easily be pulled out. There is usually an enlarged liver. Marasmic kwashiorkor is a condition showing both of the above described features, especially extremely low weight combined with oedema.
These signs of malnutrition can vary depending on the actual situation of the child and the family. Illnesses and times of food shortage may worsen the child’s condition, whereas the child may recover to some extent during times when the quantity and quality of food increases. Children who developed a severe form of malnutrition have an increased risk of becoming ill and dying (see also chapter 1.1.2).
2.2 Food intake1
2.2.1 Relationship between nutritional intake, health and nutritional status
The first stage of a nutritional deficiency is identified by dietary assessment methods. During this stage, the dietary intake of one or more nutrients is inadequate, either because of a primary
1 Further more detailed information on the methods used in this study is given in chapter 2.4.

13
deficiency (low levels in the diet), or because of a secondary deficiency, where dietary intakes may appear to meet nutritional needs, but conditioning factors, such as dietary components or disease states, interfere with the ingestion, absorption, transport, utilisation, or excretion of the nutrients. Therefore the examination of dietary patterns of a population is closely linked to the health status and directly influences the nutritional status (see Figure 1). Common diseases in many low-income countries are diarrhoea, acute respiratory infections, measles, malaria, worm infestations and AIDS. Both causes operate in a vicious cycle. Insufficient nutrient intake undermines the immune system, with impact on the susceptibility for infectious pathogens and degree of incidence, severity and duration of the disease. The disease itself suppresses appetite and causes insufficient nutrient absorption. At the same time the nutritional requirements of the body increase. This in turn leads to inadequate nutrient supply, which influences loss of weight, growth, the immune system and absorption of nutrients. (UNICEF, 1998)
2.2.2 Dietary recommendations
To interpret the average nutrient intake of a population, requirements for the nutrients are necessary. They are quantitative estimates usually setting out what is considered to be adequate to meet the nutrient needs, or the average nutrient intake, plus an added safe level, of practically all healthy populations. Therefore they may differ among countries. In Table 5 and Table 6 the WHO RDAs (recommended dietary allowances) are presented. Table 5: Energy and nutrient requirements for children from 1 to 4 years.
1 years 2 years 3 years 4 years Average weight [kg]1 8,3 9,9 11,8 12,8 Energy allowance [kcal per kg body weight]2 108 103 97 12,6 Daily energy needs [kcal]2 900 1020 1145 1200 Protein factor [g per kg body weight]3 1.2/2.0 1.15/1.93 1.1/1.85 1.1/1.85 Protein [g]3 10-17 12-20 13-22 15-24 Vitamin A [µg] RE4 400 400 400 400 Thiamine [mg]5 0.5 0.5 0.7 0.7 Riboflavin [mg]6 0.8 0.8 1.0 1.0 Vitamin C [mg]7 20 20 20 20 Calcium [mg]8 400 400 400 500 Iron [mg]9 13 13 14 14 1 The average weight calculated of the individual weight measurements of this survey. 2 The average individual energy requirement is calculated according to following the formula: Daily energy requirement = Body weight * Energy allowance (James & Schofield, 1990) 3 The daily protein requirement is calculated as follows: Daily protein requirement = Protein factor * Body weight (WHO 1985) There are two protein factors: one for a mixed balanced diet with little fibre and plenty of complete protein (digestibility factor 100%, amino acid score 100), the second on for a diet high in fibre and little content of animal protein (digestibility factor 85%, amino acid score 70). The diets in the study area are similar to description of the type two with high dietary fibre content and little content of animal protein (bold print). 4 WHO safe level (FAO 1988a) 5 FAO (1988b) 6 FAO (1988b) 7 WHO RNI (FAO 1970) 8 WHO RNI 1961 (In: Garrow & James, 1993) 9 For a diet with low iron availability, containing mostly non-haem iron and low vitamin C which would enhance non-haem iron absorption. (FAO 1988a)

14
Table 6: Energy and nutrient requirements for women of child-bearing age, pregnant or lactating.
Child bearing age
Pregnant Lactating
Average weight [kg]1 46.0 Basal Metabolic Rate (BMR) [kcal] 1158 Physical activity level (PAL) factor for moderate activity
1.64
Extra energy need for pregnant women [kcal] +100 Extra energy need for lactating women [kcal] +500 Daily energy requirement [kcal]2 1900 2000 2400 Extra energy need for undernourished women [kcal]
+200-285
Protein factor [g per kg body weight]3 0.88 Extra protein need for pregnant women [g] +7 Extra protein need for lactating women [g] +20.5 Daily protein requirement [g]3 40 47 60 Fat [g]4 43-64 Vitamin A [µg] RE5 500 600 850 Thiamine [mg]6 0.9 1.0 1.1 Riboflavin [mg]7 1.3 1.5 1.7 Vitamin C [mg]8 30 50 50 Calcium [mg]9 400-500 1000-1200 1000-1200 Iron [mg]10 48 76 26 1 The average weight calculated of the individual weight measurements of this survey. 2 The average individual energy requirement is calculated according to the following formula: Daily energy requirement = BMR (according to body weight) * Physical activity level for moderate work (PAL). For pregnant, lactating or undernourished women an additional factor is added (see table). (James & Schofield, 1990) 3 The daily protein requirement is calculated as follows: Daily protein requirement = Protein factor * Body weight (WHO 1985) There are two protein factors: one for a mixed balanced diet with little fibre and plenty of complete protein (digestibility factor 100%, amino acid score 100), the second on for a diet high in fibre and little content of animal protein (digestibility factor 85%, amino acid score 70). The diets in the study area are similar to description of the type two with high dietary fibre content and little content of animal protein. 4 The amount in grams is calculated according to the recommended percent of the total required energy intake for women of child-bearing age (>20% to 30%, FAO 1994). 5 WHO safe level (FAO 1988a) 6 FAO (1988b) 7 FAO (1988b) 8 WHO RNI (FAO 1970) 9 WHO RNI 1961 (In: Garrow & James, 1993) 10 For a diet with low iron availability, containing mostly non-haem iron and low vitamin C which would inhance non-haem iron absorption. (FAO 1988a)
2.2.3 Reference nutrient densities for selected nutrients
The concept of nutrient density was originally developed to compare the contribution of a food or diet according to the intake of essential micro-nutrients and protein, in relation to the energy that it provides. A food that is a good source of micro-nutrients or protein has a high nutrient density. This food would make a greater contribution to the intake of an essential nutrient than to meeting total energy needs. The concept is useful when energy intake is low, especially for children it is essential that nutrient-dense foods be included in the diet (FAO, 1998). In Table 7 requirements for nutrients are expressed as nutrient density per 1000 kcal. The data should be interpreted as a way of defining the adequacy of a given diet to meet the needs for specific nutrients if sufficient energy is consumed, and not for single foods or meals etc. The given

15
range identifies nutrients where there may be risks associated with high or low intakes as well as potential interactions of nutrients that may enhance or inhibit the biological quality of a given source. Table 7: Reference nutrient densities per 1000 kcal of selected nutrients (FAO, 1998).
Nutrient Density per 1000 kcal Comments Protein [g] 25-30 10-12% of total energy intake if
animal protein intake is low. Total fats [g] 16-39 20-30% of total energy intake.2 Carbohydrates [g] 140-190 55-75% of total energy intake. Dietary fibre [g] 8-20 Total dietary fibre must be
accounted for, not only “crude fibre”. Vitamin A (RE) [µg] 350-500 (RE) Thiamine [mg] 0.5-0.8 Riboflavin [mg] 0.6-0.9 Vitamin C [mg] 25-30 Functions as antioxidant and
enhances iron absorption. Calcium [mg] 250-400 Iron [mg] 11 For low bioavailability diets. 1 These nutrient densities refer to total diet. If intake is sufficient to meet energy needs, the diet will also meet the needs of all members except possibly infants <2 years of age and pregnant and lactating women. 2 There is a specific recommendation for children < 2 years which is 30-40% of the total energy intake (FAO, 1994).

16
2.3 Background to the country Three nation-wide surveys which also collected nutritional data have been conducted in the past 20 years. The results of wasting, stunting and underweight are listed in the following table. The prevalence of wasting seemed to increase, whereas the prevalence of stunting decreased. In comparison to the averages of the least developed countries, chronic malnutrition seems to effect Ethiopia more than acute malnutrition. Table 8: Countrywide prevalence of wasting, stunting and underweight among children below 5 years.
Ethiopia Indicator 1882/831 19922 19993 SSA4 LDC5 3Wasting [%] 8.1 7.6 10.7 9 12 Stunting [%] 59.8 64.0 51.2 41 47 Underweight [%] 37.3 46.9 47.1 32 40 1 MoH 1985 2 CSA 1993 3 CSA 2000 4 Sub-Saharan Africa, UNICEF, 2000 5 Least developed Countries, UNICEF, 2000 Several studies indicate that the prevalence of malnutrition increases in the 12-23 months age group. (UNICEF, 1993). An average of 27% of lactating women were found to be malnourished with a BMI below 18.5 in Ethiopia (Tabeb, 1992).
In Ethiopia, malnutrition and communicable diseases associated with food insecurity, poor personal hygiene and environmental sanitation, lack of safe water supply, harmful traditional practices, general low level of health awareness, and limited access to health services are reportedly primary causes of morbidity and mortality among children. Throughout the country HIV/AIDS has also become a major cause of death even among children under 5 years of age (Kebebew, 1999).
The median duration of exclusive breast-feeding is recorded with 7.1 months ranging from 3.7 to 12.7 months (NRNS, 1992). The median age for termination of breast-feeding was 25.3 months ranging from 19.7 to 29.0 months (NRNS, 1992). Problems are seen in too early or delayed onset of complementary feeding and insufficient quantity and quality of the food offered (UNICEF, 1993). Abrupt weaning habits and insufficient childcare especially during illness, can aggravate the situation and eventually lead to severe malnutrition (Scherbaum, 1996).
2.4 Bio-village project area
2.4.1 Bio-village project
The basis of the Bio-village Initiative is a sustainable rural development programme in Ethiopia. In 1995 it started with activities from the International Center of Insect Physiology and Ecology (ICIPE, Nairobi, Kenya). The goal was to achieve better human health by introducing husbandry practices to suppress the tsetse flies and to reduce the incidence of trypanosomiasis of livestock. The initiative was founded in three of the eleven woredas (districts) of the Gurage Zone (Cheha, Enoemor, Goro). In two villages, Mamede (Goro woreda) and Luke (Cheha woreda), the Bio-village activities have started and have ongoing activities. Trypanosomiasis is the major animal health

17
problem in this area, resulting in impaired productivity of cattle, which expresses itself in lack of growth, reduced fertility and milk yield, and lack of animal draught power, all of this severely affecting available food for humans. Malaria, diarrhoea, acute respiratory infections, intestinal infestations and malnutrition are the most common health problems affecting the population in the Bio-Village areas. Therefore the project developed into an interdisciplinary approach aiming at the improvement of the health of humans and livestock, at increasing agricultural production and marketing of agricultural products as well as at improving the nutritional situation of the most vulnerable groups of the society such as women in child-bearing age and young children.
2.4.2 Information about enset2, the staple food in the project area
Geographic distribution The distribution of enset is constrained by altitude and rainfall. Enset grows in areas between 1600 to 3200 m (Smeds, 1955) and prefers an evenly distributed rainfall of 1100 to 1500 mm per year, though it can withstand a dry period up to 150 days (Westerphal, 1975). Cultivation cycle The enset plant requires several years to reach the stage when it can be harvested. To reach this stage the plant passes through 4 growth stages (transplantations). Estimates range from 3 to 9 years until a plant can be harvested, depending on the sources, the type of plant, soil conditions, altitude, rainfall, amount of manure, etc. (Westerphal, 1975). The optimum harvest is once the plant has fully matured after about 6 to 7 years (Hamer, 1987). Approximately 15 to 20 plants per person per year are needed in the Gurage area to feed an adult (Huffnagel, 1961). On the final transplantation plots a minimum of 400 to 600 plants are necessary to meet the needs of a family of about 6 persons. This requires in total a minimum land area of 0.2 – 0.25 ha for enset plantation. Therefore the population density is found to be higher in enset growing areas. Role of animals The enset system cannot operate without livestock for the basic reason that the plant requires considerable manuring at each stage of the growth cycle, otherwise there will very soon be an exhaustion of soil. On the other hand, the enset production system also enables an intensification of livestock production since the leaves can be given to cattle as fodder. Products of the enset plant The enset and its products are used for different nutritional, medical and non-nutritional purposes. The main food product of enset is the starch in the stem and pseudostem. Kocho is the fermented product of these starchy parts and can be baked like bread. These edible products of the enset plant have to be stored for several weeks in order to ferment, and can be stored for several years. Bulla is made by dehydrating the juice collected during the decortication of the stem and pseudostem. The main difference between kocho and bulla is in the fibre content. Bulla consists mainly of refined carbohydrates with a very low fibre content and, depending on the duration of fermentation, is less sour than kocho. Because one enset tree produces less bulla than kocho, bulla is more expensive in the markets. The preferred use of bulla is as a complementary food, and as a special food given to mothers after delivery, mainly prepared in the form of porridge. The nutrition department of the Attat Hospital in the project area successfully uses bulla as a staple food, combined with other protein, fat and micro-nutrient rich foods, in the therapy of severely
2 Enset is also called false banana and is a banana-like plant.

18
malnourished children. The remaining part of the stem is called amicho. It can be cooked for direct consumption. It is also used as a starter for fermentation. The fibre from the leaf sheaths is used to make twine, ropes, sieves, and cleaning items. The leaves are used for roofs, for covering material in lining silos for the enset dough stores, as moisture protective wrapping material for kocho, bulla, cheese, or butter, and as animal feed. Prestige of enset In general, the food products of enset are regarded as low-prestige food in Ethiopia, especially by tribes who do not grow enset, whereas in urban milieux kocho has become a food considered a prerequisite for eating kitfo (= raw or roasted minced meat, a dish traditional to the Gurage region) in the best restaurants, which do not cater simply for migrants from enset-growing areas.
2.4.3 Information about the Gurage
Geographical data The Gurage live south of Addis Ababa in the highlands between Lake Ziway and the Omo and Awasha rivers. They live in villages which are organised around homesteads surrounded by dense plantations of enset, which is their single most important staple food. Enset and cattle are the two economic pillars of the Gurage economy (Nida, 1996). The main type of enset is Ensete ventricosum. The process of urbanisation is lower among the Gurage and other enset zones compared to other parts of the country (OPHCC, 1984). Work distribution in enset production The production and processing of enset requires both male and female labour. Most of the male labour takes place in the early stages: cloning, planting and transplanting of the plants. This work is mainly done from October until March. Men can also be involved in cutting down the plants for harvesting, and digging the pits in which the products are stored. The long maturation cycle means that once enset plants have been transplanted they can be left to grow with little care for several years. The main female labour input is harvesting and, especially, processing the enset. Harvesting in Gurage takes place after the rains from October until January. In addition, women are responsible for nurturing the plants by giving them manure from the house where the animals are kept overnight, and for weeding. This division of labour enables men to migrate to towns in order to work for several months of a year (Pankhurst, 1996). Sale of enset In enset-growing areas the income generated by the sale of enset is small, and mainly earned by women, because they are the ones who harvest and process the enset. Women are also the ones who spend this money. In contrast, men harvest mainly tef and maize. Consequently, men take the major role in decision-making, both over the crops and over the income they generate. As tef and maize have a greater market value, this means that men have greater economic strength in areas where these crops are grown (Sandford & Kassa, 1996). Social stratification A lot of the work undertaken by men and women appears to be done in co-operatives. One example is the livestock management, with grazing duties shared among a number of homesteads on successive days, when one household supervises 75 to 160 cattle a day. Livestock can also be loaned amongst families according to need (McCabe, 1996). Families who lack cattle of their own borrow animals in order to utilise its milk and dung (this system is called wochia). This co-operative division of labour also takes place for other work. In the area which was studied the villagers take

19
turns in observing and chasing away wild animals, such as monkeys, to prevent these animals from destroying the gardens of their homes. For special occasions, such as preparing mats for a specific holiday, or harvesting enset, women form small working groups. To prepare the mats, they gather in one of the houses of a group member and work on the mat together. After they have finished they go to the next house. Similarly, for harvesting and processing the enset plants, they work in turn in each group members household. Usually lunch is prepared by the women who profit from the activities on that particular day. Some form of payment can be offered if those contributing their labour are poorer, and the group members do not work for those particular households. Similar working groups exist for the men in respect of their home gardens. These kind of groups have a special name, debo. Another type of co-operative exists called eder, comparable to an insurance. The members contribute a small amount of money every month. Money is paid to members in the event of a death, so that the family can pay for the funeral, which is a very important event in this society, and lasts for several days. The funeral costs a lot of money, because the family has to entertain the guests who come to mourn with them and to pay their last respects. Many families would not have immediately access to such a sum. It is also clear from the literature that the market system is an important component of the overall economic system, as is the seasonal and sometimes longer migration of men to seek waged employment outside of Gurage land (McCabe, 1996). Dietary-related information The mono-culture areas with enset as staple food have been described as a culture with a monotonous staple diet, which is rich only in carbohydrates, and low in protein and fat (with each contributing less than 3% to the total energy content, depending on the water content). Besrat et al. (1979) observed that the fermentation process increases the essential amino acid content of kocho. Methionine and isoleucine are the limiting amino acids in kocho, whereas it was found to be relatively high in lysine. It seems obvious that such low level protein, if unsupplemented from other sources, is inadequate to meet the minimum protein requirement. Both enset products, kocho and bulla, contain nearly no thiamine, riboflavin, vitamin A or C, but contain some calcium and a quite high content of iron. The iron content might be high partly through the fermentation in the soil since some soil types are very rich in iron. Because of its poor nutritional content and fermented taste, the main product of enset (kocho) is seldom consumed on its own, except during periods of extreme famine, or by poor households who do not have the means to vary their diet. Kocho is often consumed with cabbage, beans and maize, and on special occasions with meat, cheese and egg. The most vulnerable group are suspected to be young children from 6 months to 3 years of age, because their diets are often highly deficient in respect of the supply of calories and most nutrients, iron and ascorbic acid being an exception (Agren & Gibson, 1986).
2.4.4 Information about the project area3
Geographical location and village sizes The village of Mamede (altitude 1766-2019 m above sea level) is located 8 km east of the town, of Wolkite. It is bordered in the south and south-east by the Wabe rive, in the west and north by the
3 This data mainly compromises the following: a collection of single, open interviews with the women before the final survey was conducted, and a focus group discussion with the men (both done in a neighbouring village of Mamede Tatessa), plus two previous preliminary report of a socio-economic survey and a study on waste management, conducted in our study area by Abraham Assefa (1999-2000) and Jürgen Bierwirth (2000).

20
village Tatessa and in the east by the Ketebare river. The approximate population size in the village is 3265 and the number of households 384. The total land area is estimated to be about 800 h. The village of Luke (including Eba) is at an altitude of 1800-1833 m above sea level. It is 35 km south-west of Wolkite. In the south and south-west it is bordered by the Gibe river, in the west by the Wabe river and in the east and south-east by the village Germbo. The approximate population size in the village is 4840 and the number of households 605. The total land area is estimated to be about 800 h. The farmers in both villages settled primarily along land of red soil type. Red soil is seen as very suitable for the growth of enset and other crops like coffee, chat, citrus fruits, etc. Agricultural food production The main staple crop is the enset grown in the back yard of the houses. Enset plantations are inter-cropped with mainly maize and cabbage during the rainy season. Small amounts of legumes, especially kidney beans and taro, are planted close to the house. Plantations of chat, coffee, hope, fruits (mango, oranges, lemon or banana) are an important source of cash income. Additional fields with annual crops (tef or niger seed) are ploughed and cultivated only by a few families. The main constraints mentioned by the farmers to expanding the production of annual crops have been the heavy black vertisols surrounding the villages, the lack of animal power (oxen) due to the high prevalence of disease (tick born diseases, trypanosomiasis) and wild animals which live in nearby forests (monkey, ape, warthog, wild pig). Though land is not limited, the farmers mention it as a scarce resource. Family land holdings in Mamede range between 1/8 to 2 ha and in Luke from 1/24 to 1 ha. June, July and August (rainy season) are the months with the highest risk of food shortage. General work distribution among family members The division of labour for the cultivation of enset is described in detail in the previous chapter (1.3.3). Further responsibilities of the men are land preparation, seeding and harvesting of cash crops other than enset, growing fruit trees, and collecting grass for the cattle, as well as constructing houses. Women do the work inside the house (cleaning, preparation of food and coffee for the coffee ceremony, taking care of the young children and making handicrafts for the market). Additional women’s work outside the house is fetching water, collecting firewood, and washing clothes. Children are involved in the work of taking care of young siblings (especially the girls, who carry younger brothers or sisters on their backs) weeding, or collecting firewood. Girls from 5 years onwards carry small pots on their backs for water collection. Sometimes boys also collect water. Their responsibility is also to mow grass for the cattle for the night time. Both boys and girls collect dung as a fertiliser. At about the age of 10 years boys start to take care of the cattle during the day. Income-generating activities Selling, or being small merchants through buying and selling in the market, is an important part of daily life, especially that of the women. A division also exists between men and women as to the type of products which can be sold in the markets. Women mainly sell enset products, milk and milk products (butter and cheese) as well as vegetables (such as Ethiopian kale), fruits, processed foods (like injera) or handicrafts, charcoal and firewood. The quantity of products a mother sells at anyone time is rather small, and therefore the amount of money she will earn if she is successful in selling everything is rather limited. However this seems to be part of the Gurage culture. When the mothers were asked for ideas as to how they would like to improve their situation through their own

21
abilities, most of them responded that they would like to become small-scale traders. Men prefer to sell cattle, chat, coffee, and eucalyptus trees. Children, especially boys of 9 years and above, start with small-scale trading or providing small services, e.g., cleaning shoes. For this, they are sent to a nearby town (e.g., Wolkite) and, as they grow older, to bigger towns or the capital, Addis Ababa. Older girls are sometimes sent to other places as house-servants. Other job possibilities seem to be less important and less attractive to the people. Shack (1963) states that hunters, smiths, tanners and woodworkers generally have a low social status in the Gurage area, though some male and female fuga (potters) have an important function in the religious system. Men and women from poorer families work as daily employees for other, richer farmers, or in working groups as described above. A few are also involved in the informal sector (digger, carpenter, etc.), or formal sector (kebele [district] administration, church or mosque administration). Responsibilities in the use of money Both men and women have the right to control the money they earn. On the other hand, women, in general, carry the responsibility of earning enough money to buy all the additional foodstuffs which cannot be harvested from their own gardens, or at times when their own harvest does not satisfy the needs of the family. This can be food like sugar, salt, or oil, which are not home produced, or even staple food during times of food shortage. This gives the woman a heavy burden, not only to work for the family in and around the house, but also to provide daily food through her own labour by earning the money she needs to buy additional foods for the whole family. Men mainly contribute to non-foodstuffs for the family like clothes and dishes, and take care of the structural condition of the house. Difficulties for women Women discuss their problems and their life situation during the preparation of coffee ceremonies, or when they go together to collect firewood, wash clothes or fetch water. But when asked if they also plan further steps or changes for their future, some answered that they do not have time to plan anything because their work load is already heavy enough, especially if they have young children to care for. It is also difficult to think and talk too loudly about new ideas because of their husbands. Any ideas and changes the men must agree to and support, otherwise the women cannot do anything. That is why one women observed that it may be better not think about the possibility of change in the near future. Religious and social events Relatives, neighbours and friends not only meet for work co-operation, but also for coffee ceremonies, performed separately for men and women. Coffee ceremonies among women are occasions for women to meet and to exchange their daily needs and problems. Chat ceremonies are conducted especially by Muslim men. The chat is often grown in the home gardens. Regular, daily chat ceremonies can cause social and economic problems within the families, because the drug may reduce the motivation and work capacity of the men. In addition, the appetite is decreased. Therefore these men might not recognise the necessity for their women (especially if pregnant or lactating), and their children to receive a sufficient quantity and quality of food. The question is, to what extent these habits lead families into poverty, or hinder them in acting to retrieve their poverty; or does the poverty lead to such habits? Men mentioned that they took part in the chat ceremonies because they were resigned to their situation of poverty.

22
Further occasions on which a large group of people meet, are weddings and funerals, or religious meetings in the churches or mosques. People who follow one of the two dominant religious groups (the Ethiopian Orthodox or the Muslim faith), have special events which are connected to special food habits. The most important holiday for the Gurage is the Meskal holiday (for the Orthodox) and Areba (for the Muslim) in September. The common dishes for this occasion are meat prepared as kitfo with butter and pepper, kocho, cheese and cabbage, and, for the Orthodox people, locally prepared beer (tela). For the Orthodox, Easter is an other important event, when large amounts of meat are consumed (if the families can afford it) served with a dish prepared from beans, wheat, and barley. On New Year (in the European calendar, September 11th) a special dish, prepared from amicho and consumed with butter, pepper, spices and sour milk, is cooked. Both the Orthodox and the Muslims have fasting days. For the Ethiopian Orthodox it is prohibited during fasting times to consume any type of animal foods (meat, milk and milk products, or eggs). Fasting seasons are on the Wednesdays and Fridays of each week, during the 56 days before Easter (February to March), 35 days in June, 16 days in August, 43 days in November and December, and 30 days in September (only for the Priests). The people are restricted to food like taro, cabbage and legumes. The Muslims have a one month fast (Ramadan), where they are not allowed to eat and drink during the day but can eat any food items during night. Food habits during pregnancy, after delivery and lactation There are no special food items which are recommended during pregnancy, but there are some traditional rules for food a women should avoid during pregnancy. These are milk (in general, milk is seen as a food for the husband and the children, not for the women), white cheese, vegetables like potato (because the foetus might get unclean) or egg (because the baby might become too big for an uncomplicated delivery). Another problem is that women have to continue with their heavy work load during pregnancy. After delivery, special care is taken of the mother and the new-born child. The mother has a time for resting, when she does not need to do her regular work, but stays in the house with her infant. In addition, special food, like porridge made mainly from bulla, meat, egg, cheese, chicken, honey, or cabbage is prepared for her for about 1 month, depending on what the families can afford. Later on during lactation there seem to be no special rules or food restrictions. Breast-feeding habits Traditionally, colostrum (the first yellowish milk coming from the breast) is not given, because of the colour, and the idea that it has been in the breast for a long time during pregnancy, and therefore could be harmful to the baby. Butter, if people can afford it, or water, or tea with sugar are given to the child instead as pre-lacteal food. Women who are more educated, or delivered in a clinic, might refrain from these traditional customs. Some educated women, in contrast, might think water with sugar is good, because it should give strength to the child. First complementary foods are in general fluids (tea, water, milk), which might be given just a few weeks after birth. Thin porridge, in combination with other food, or by itself, is often the first complementary food, given at around 4 months. Family food often starts at a later stage (after one year). The total breast-feeding time can last for 2 or 3 years, or even longer. One important reason for the cessation of breast-feeding is that the mother becomes pregnant again.

23
Health related data In the study area the most prevalent health problems in children and mothers were identified in the following order: malaria, diarrhoea, cough, fever and intestinal parasites (ICIPE, 1998); some of these diseases, like malaria and worm infestations, can increase the prevalence of anaemia. Septicaemia ranks highest among children as a reported cause of death, followed by pneumonia, neonatal deaths and malaria, in a nearby hospital (Attat hospital, 1999). Malaria, the common cold, diarrhoea and gonorrhoea were mentioned as the main problem diseases in the villages Mamede and Luke. Household facilities The houses (tukuls) in the whole area are built from locally made materials like wood and the products of the enset plant. The walls are plastered with mud. The main cooking facilities are special cooking places in the middle of the houses where wood collected from nearby forests is used for heating. The time needed for collecting firewood can vary from 1/2 to 3 h in Mamede, and 1 to 4 h in Luke. Animals are kept in the house with the owner over night. Toilets are not common yet, except in a small number of families in Mamede, where the Bio-village project introduced and supported the building of a toilet in their home gardens. House waste and sewage is mainly disposed of on the plants in the home gardens. Electrically powered items (such as radios) seemed to be rare, but could be found in some families, especially if one of the family members was working in a town or in Addis. Infrastructure Mamede has two water delivery stations, which are found in the middle of the sub-village Yeja sefer. The access is reduced for households situated on the outskirts of the village, which have persistent water problems during the dry season. Some of the sub-villages collect their water from privately dug wells during the rainy season. During the dry season from November to May water scarcity in Mamede can become severe. Luke has one big water delivery station, which can fulfil the needs of the whole village. The water is pumped by a diesel-oil generator, which has to be paid for by the villagers. However, the long travelling distances for the inhabitants of the sub-village Eba lead them to use swamps and rivers for their permanent water source. Water can become scarce during the dry season. Both villages have a primary school at one end of the village, which is still several kms journey for the children living at the other end of the village. Therefore children are often sent to school at an older age (e.g. 10 years) so that they can manage the walking distance. Girls are allowed to attend school too. But if they are needed in the family they have to finish their education earlier, e.g. if somebody in the family is ill, then the girls have to take care of them. The data (1993/94-1997/98) from Mamede elementary school shows that 32% of the registered school children were females. In Mamede there is a small surgery attached to the Wolkite Health Centre. Close to Luke there is a newly-built clinic. For more complicated diseases the villagers can reach the Attat Hospital on foot within several hours. Both villages can be reached by an all-weather road, except that about the last 2 kms of the road to Mamede are not finished yet, and the road to Luke needs urgent repair. Most men and women in Mamede walk to the markets in Wolkite, whereas Luke has its own market together with the next village. The closest bigger market can be reached only by walking more than 15 km.

24
2.5 Design of the study The main purpose of this study was to establish baseline information on the health and nutritional status of young children and their mothers in the two villages of Mamede and Luke, and to ascertain risk factors leading to malnutrition among young children, with special emphasis on the family background, breast-feeding and dietary habits. The study was done in co-operation with the following institutes: EHNRI (Ethiopian Health and Nutrition Institute), ICIPE (International Center for Insect Physiology and Ecology) and the University of Hohenheim (Institute of Biological Chemistry and Nutrition). During the field work the Wolkite Clinic and Attat Hospital made health staff available for measuring weight and height of the women and children, and for undertaking a health check on the children. Data collection took place through interviews, anthropometric measurements and health observation of children below 5 years and their mothers. All the small children with their mothers or carers in both villages, who voluntary participated in nutritional and health assessment were included in the survey. In case of the structured interviews households with at least one child between 8 months and 5 years were randomly selected. Further approaches, like focus group discussion with men and open interviews with women from the next village, were used for data collection. After the data collection, several families with severely malnourished children in Luke were interviewed to establish possible reasons for the child’s extreme low nutritional status in this particular family situation, and to offer the families transport and support for the rehabilitation of the child in the Attat Hospital.
2.6 Study objectives • To assess the nutritional and health status of young children and their mothers • To determine the nutrient intake, dietary and breast-feeding habits of the study population • To establish recommendations on how to improve the health and nutritional situation of the
population concerned based on the study findings • To prepare an intervention programme
25
3 Methods
3.1 Study population The target was to reach all the children below 5 years, and their mothers or carers, to undertake a nutritional and health assessment in the two villages Mamede and Luke, which the Bio-village project has concentrated on. For this purpose lists of all households with children below 5 years were prepared by the chairman of each village. For more detailed information households with children between 8 months and 5 years were selected. The youngest child in the family which had already started to accept complementary food was chosen as the index child in the questionnaire. Originally, it was planned to include an additional village for comparison. Because of increasingly heavy rains it was impossible to reach the village which was chosen for comparison.
3.2 Sample size and coverage of the study area During the survey 143 women were interviewed in Mamede and 153 women in Luke. In total, 296 interviews were completed, with a respondent rate of 100%. One questionnaire had to be completely excluded from the analysis, because a women brought her neighbours’ child for measurement instead of her own. In Mamede, if the mothers were not at home the first time, they were asked to come the following day to the central location, where the anthropometric measurement took place. In Luke, these households were left out of the interviews, and neighbouring households were interviewed instead. In Mamede, nearly all the women with a child in the age range concerned were asked to take part in the interviews, due to a smaller population size. In Luke, a proportional number of households in each sub-village were randomly selected for the interviews to complete the total number of 150 households. The remaining mothers were invited to take part in the anthropometric and health assessment with their children.
Not all the women with their children where the interviews were done could come for anthropometric measurement; in some cases, if the children refused to be measured, only the weight could be taken. Therefore, the completed anthropometric and health data of the interviewed women and their index children represented only 90% in Mamede and 91% in Luke. In some households the grandmother was interviewed, in situations where the mother had moved away or died (anthropometric data from the grandmother were not taken). If the mother could not come for anthropometric measurement, the children were sent with the husband, relatives or neighbours. Common reasons were that the mother was ill, or had just delivered before the time of the survey and was not leaving the house yet. Only very few other reasons were given for the absence of women for measurement.
In both villages all the women on the prepared lists with children below 5 years were invited to take part in health and anthropometric assessment. Women who were not on the list often appeared on another day in another sub-village for measurement. Due to the fact that the survey was combined with a health check of the children, the majority of women were highly motivated to take part in the health and anthropometric assessment. This was especially the case in Luke. In total, the anthropometric data of 133 women and 207 children in Mamede, and 254 women and 413 children in Luke, were collected.

26
Table 9: Results of interview and respondent rate
Number of Household number
Planned households for the interviews Altogether 300 MAMEDE / LUKE 150 each Households which took part fully or partly in the survey MAMEDE 149 LUKE 292 Altogether 441 Households actually interviewed and analysed Mamede 143 LUKE 152 Altogether 296 Households with complete anthropometric assessment of mothers and index child and completed questionnaires
MAMEDE 128 LUKE 139 Altogether 267 Households with complete anthropometric assessment of the index child and completed questionnaires
MAMEDE 138 LUKE 146 Altogether 284 Number of women and children with complete anthropometric and health assessment
MAMEDE Women Children
133 196
LUKE Women Children
254 413
Altogether Women Children
387 609

27
3.3 Survey schedule The time schedule of the survey and additional activities was as follows: Table 10: Time schedule of the survey and additional activities.
Time Activity 27. April Arrival from Germany 2.5. – 11.5. Preparation time in Addis Ababa, visit of the first review team,
Discussion about study proposal with Mr. Samson, EHNRI in Addis Ababa 15. 5. – 9.6. • Open interviews with women in the next village to Mamede (Tatessa)
• Focus group discussion with men (Tatessa) • Pre-testing of the questionnaire • Contacts with Wolkite Health Center and Attat Hospital • Observation of the activities in the nutrition department at Attat Hospital • Search for additional interviewers
12.6. – 29.6. Training of the interviewers and pre-testing of the questionnaire 21. – 29.6. and 17.7.
Conducting the survey in Mamede, concluding with distribution of medicine.
5.7. – 14.7. Conducting the survey in Luke, concluding with distribution of medicine. 15.7 - 18.8. Beginning of data entry
Interviews conducted with a selected number of families with severely malnourished children in Luke and transport to the nutrition department at Attat hospital if family agreeable. Discussion of study results with Mr. Samson, EHNRI in Addis Ababa
23.8. Departure from Ethiopia

28
3.4 Methods of data collection Table 11 gives an overview of the study variables, indicators, corresponding methods and study population. Table 11: Variables, indicators with the corresponding method, and study population
Variable Indicator Method Study group
Nutritional status BMI Anthropometric measurement
W
WFH, HFA, WFA Anthropometric measurement
C
Health status Obvious or reported disease on the examination day
Observation of health personnel, questioning of mother
C
Dietary intake Frequency of consuming grains, legumes, vegetables, fruits and animal products
Food frequency questionnaire
C
Food intake of the previous day 24 h-recall W, C Food habits Food taboos or use of special foods during
pregnancy, lactation, first days of a new-born, illness
PI W
Breast-feeding habits Initiation of breast-feeding, pre-lacteal feeding, use of colostrum, duration of exclusive breast-feeding, complementary feeding, total duration of breast-feeding including all the above variations
PI, questionnaire C
Childcare Work load of men and women PI, FGD M + W Seasonal food availability
Seasonal calendar FGD M
Economic situation (agricultural production, livestock property)
PI, FGD, questionnaire M + W
Income sources PI, FGD, questionnaire M + W Decision-making over income PI, FGD M + W Village situation Population, road, electricity, water supply Literature, observation Explanations: PI = personal open interviews with different women of Tatessa village FGD = Focus group discussion with men in Tatessa village Questionnaire = standardised questionnaire used for conducting the survey M = men, W = women, C= children At the beginning of the study period, open interviews (or personal interviews) with women in Tatessa, next village to Mamede, were conducted in order to obtain an overview of possible causes related to malnutrition in the study area. The women were asked about food habits and food taboos during pregnancy, after delivery, and during lactation, or associated with special religious or social events. Emphasis was put on breast-feeding habits, like the use or discharging of colostrum, pre-lacteal feeding, duration of exclusive breast-feeding, timing and type of complementary feeding. Questions on the types of agricultural products grown in the home gardens and possession of livestock were raised. Additionally, information was requested about labour distribution among men, women and children, sources of income, decision making over income, and social networks. At the end, the women were asked to report about their perspective on and ideas for plans which could improve their actual situation.

29
At the same time a focus group discussion with men was undertaken in Tatessa by one male staff of ICIPE. In a joint discussion a seasonal calendar on the growth of the main important agricultural products, the labour demand according to men and women, and weather conditions, was worked out. Similar questions were raised about labour distribution among men, women and children, sources of income, decision-making over income, and social networks to compare with the answers of the women. This information was necessary to modify and finalise the questionnaire. The questionnaire was adapted from the example given in “Guidelines for Nutrition Baseline Surveys in Communities” (Gross et al., 1997) and entered into the computer programme “NutriSurvey”, a computer programme written at the University of Hohenheim (Dr. Erhardt) to prepare a suitable questionnaire, enter the data and evaluate the results. To see in detail the topics which were raised in the questionnaire. A food frequency questionnaire is designed to obtain qualitative, descriptive information about usual food consumption patterns. The general aim is to assess the frequency with which certain food items or groups are consumed during a specific time period (daily, weekly, monthly, yearly). The questionnaire consists of two components, a list of foods or food groups and a set of frequency-of-use response categories (Gibson, 1993). A food frequency questionnaire of important, nutritious food groups (grains, legumes, vegetable, tuber, fruits, milk products) was added into the questionnaire to see on how many days these foods were given to the index child in the past week. The enset products were not included because it was assumed that they are eaten every day. In the 24-hour recall the respondent is asked to recall the exact food intake during the previous 24 hours or the preceding day. Detailed descriptions of all foods and beverages consumed, including cooking method or recipes, are recorded. Quantities of food consumed are usually estimated in household measures. The information can be used to characterise the mean intake of a group, but is not suitable for assessing usual food intakes of individuals. The success of the 24-h recall depends on the subject’s memory, the ability of the respondent to convey accurate estimates of portion sizes consumed, the degree of motivation of the respondent, and the persistence of the interviewer (Acheson et al., 1980). One single 24-h recall was collected for every index child and the mother (if other carers were interviewed the 24-h recall was only requested for the child). One very important limiting factor is that day-to-day variations, and especially seasonal variations, cannot be taken into account from a single 24-h recall. Therefore the results presented only the rainy season (between June and August), when stocks are assumed to be low and the next harvest season is still some time off. This time can probably be considered as the time of highest risk for an unbalanced diet and food shortage. To help a mother remember everything which had been eaten, she was asked systematically to recall all beverages and food items taken at any time during the previous day as follows: before breakfast, for breakfast, between breakfast and lunch, for lunch, between lunch and dinner, for dinner and before bed. Portion sizes were noted in household measurements such as tea glasses, coffee cups, water glasses, teaspoons, tablespoons, ladles or in pieces measured by the size of the hand (kocho) or naming the size which can be bought (bread). For the transformation of household measurements and centimetres into grams, the portion sizes were weighed with a digital household dietary scale (Ovelys Electronic kitchen scale, Tefal max. 3 kg, precision 0-1 kg: d = 1 g and 1-3 kg: d = 5 g). An other important source of error which might occur is that the 24-h recalls might not always be complete. This might be true particularly for older children who are able to walk around, and who

30
might receive food from other people outside the house, or if the mother was absent part of the previous day. Information from the 24-h protocols was entered and analysed with “NutriSurvey”, which has a special part for calculating caloric and certain nutrient intakes. The food items mentioned in the recall, and available in the “Food composition table for use in Ethiopia” Part III and IV (EHNRI, 1997), were added to the German food composition table. For foods not available in the Ethiopian tables, the foods in the German food table (Bundeslebensmittelschlüssel) were used. If available, the cooked dishes from the Gurage area, which were measured as a whole, were preferred. Otherwise the recipe, which was also requested in the sheet of the 24-h recall, was entered. The analysis was restricted to energy, and the nutrients protein, fat, carbohydrates, fibre, vitamin A, thiamine, riboflavin, vitamin C, calcium, and iron, because these are the nutrients measured and included in both Ethiopian food composition tables. After the survey 17 households in Luke where children were identified as severely malnourished (marasmic children or children with kwashiorkor) during the anthropometric assessment, were visited again (due to transport problems because of increasingly heavy rains the same help could not be offered to the families in Mamede). These families were asked some general no-standardised questions, which can be seen in the appendix section. Some of the questions overlapped with the standardised questionnaire, because not all households had been interviewed during the first survey period. Other questions were included in order to collect in-depth information on topics which the first questionnaire had pointed out to be relevant to a child to becoming malnourished, but for which the questionnaire did not deliver enough details. The income-generating activities of the parents and children, agricultural production, and livestock property were requested in more detail, as it seemed that some activities had been only partly mentioned during the first interview. Further topics covered the actual and previous health problems of individual household members, participation in working groups, childcare aspects, and the history of illness of the malnourished child. An important question was about parents’ awareness of the severity of the condition of the child and the duration of the illnesses. After the interview the family was offered transport and support to attend the nutrition department of the Attat hospital for rehabilitation. Most of the families agreed (9 households). However the children of four of the families could not be accepted into the hospital nutrition department at that time because of space limitation. Four families refused to go to the nutrition department at the Attat Hospital.
3.5 Health assessment (“point prevalence” of underlying diseases) The health assessment of children below 5 years was performed using a “point prevalence” method. Usually in surveys the mother is asked retrospectively if the child has suffered from certain diseases during the previous one or two weeks before the assessment. By contrast, in our study, the health status of the children under 5 was assessed and recorded during the anthropometric measurement as a “point prevalence” of underlying diseases, only recording the health status on that particular day. In Mamede this was done by the medical staff of the Wolkite Health Center, whereas in Luke the health assessment was performed by medical personnel from the Attat Hospital. The main purpose was to observe the principal diseases in the two villages, and especially to offer treatment, or give necessary advice for the prevention of common diseases.

31
3.6 Anthropometric assessment It was often difficult for the women to know either their own or their husbands’ exact age. Therefore the age of the parents is only a rough estimate. To assess the age of the children, the mothers were asked to bring the children’s vaccination and growth cards to the central place where the anthropometric measurements were performed. Many of the women either had no card, or it was not available. In such situations the mother was helped to pinpoint the exact date of birth of her child: first she was asked for the age in years, then the month in which it was born, or about special events or holidays around the time of the birth. If the mother could not establish the exact date of birth, she was asked, finally, if the child was born at the beginning, the middle, or end of the month. Even so, in some cases, the day of birth might still be inaccurate, and also the month. Therefore the anthropometric data might only be accurate for WFH, but not for WFA and HFA. The weight measurement was done with a solar scale, which was used for the mothers and children. If children were very young, or could not stand, they were measured together with an adult person. The weight of the individual child was calculated by subtracting the mother’s weight. Shoes, socks and clothing such as coats or sheets were removed from both mother and child. The remaining clothing they were wearing during measurement were ignored in the calculations. Weight was recorded to the nearest 200g. The weighing scale was calibrated every day before starting the weight measurements. The heights of the women, and children above 85 cm, were measured with a height board, and the lengths of children below 85 cm with an Infantometer. The heights and lengths were assessed by means of locally-made wooden measuring boards with flexible headboards. Height and length were measured to the nearest mm. For logistic reasons the women and children were measured throughout the whole day in a central place whilst the interviews were taking place from about 10 a.m. to 4 p.m. in the houses of the individual families.
3.7 Survey teams and interviewer training The pilot-phase and the supervision of the survey was conducted by two people from Addis and Germany (nutritionist) respectively. Two additional staff from ICIPE helped with interviews, or provided support during the anthropometric measurement. An additional 4 people from Wolkite with a knowledge of English and experience in public health interviewed the mothers and sent them afterwards to the place where anthropometric measurements were done. One medically trained person was assigned to perform health checks. Most of the team members spoke the language used in the local villages. Further people from the villages helped to find the houses and to do the anthropometric measurement. During the training of the interviewers the questionnaire was introduced and all sections of the questionnaire were explained in such a way as to take account of individual levels of understanding, and the information that it was hoped each question would produce. Afterwards the interviewers tested the questionnaire at home, and did some further training on two afternoons in Tatessa.

32
3.8 Statistical analysis The statistical analysis was performed with SPSS 10.0.7 for windows. The results are presented in the form of percentage units, mean values and standard deviations. For statistical differences of measurement values, the variable was tested for normal distribution by using the Kolmogorov-Smirnov test (normal distribution, if significance p > 0.05). If the variable was normally distributed, the T-test for independent sample values was used; otherwise the Mann-Whitney-U-test was taken for calculations. For variables following a frequency distribution the Chi2-test was applied. A difference was defined as significant if the n-value was < 0.05.

33
4 Results of the index children4
4.1 Household characteristics
4.1.1 Head of the household
As seen in Table 12, 73% of the husbands in Mamede lived permanently with the family, which is about 10% less than in Luke (85%). Table 12: Duration of the parent’s stay in the household.
MAMEDE LUKE Stay in the household Father Mother Father Mother Permanently [%] 73,4 95,8 84,9 98,7 > 6 months [%] 4,9 0,7 0,7 0 < 6 months [%] 8,4 0 2,6 0 Moved away [%] 9,1 2,1 4,6 1,3 Died [%] 4,2 1,4 7,2 0 Head of the household [%] 73,4 22,4 84,9 13,8 The percentage of husbands who had already died was higher in Luke (7%) than in Mamede (4%). More husbands in Mamede spent part of their time in another place (13% Mamede, 3% Luke) or permanently moved away (9% Mamede, 5% Luke) than in Luke. Reasons for fathers residing elsewhere, either within or outside the village, are job opportunities outside the village, marriage with another woman or divorce. In both villages a very high percentage of mothers lived permanently in the household (95% in Mamede, 97% in Luke). Only in very few of the interviewed households was the mother not permanently at home, or had died (see Table 12). In 5% of the households in Mamede, and 1% in Luke, the grandparents were the main carers of the child.
4.1.2 Age of the parents
The approximate age of the parents during the time of the survey and the approximate age of the mother on her first marriage are shown in Table 13. No major differences between the two villages were observed. Table 13: Approximate age of the parents and approximate age of the mother when she married the first time.
MAMEDE LUKE Age of Mean ± SD Range Mean ± SD Range Father [years] 37 ± 9 22 – 60 39 ± 9 25 – 65 Mother [years] 29 ± 6 18 – 45 30 ± 6 16 – 43 Mother at the first marriage [y] 18 ± 3 14 – 25 17 ± 2 14 – 24
4 In the following part, most of the data is shown separately for the two villages with the exception of some very important data which are compared to data available on regional or country level in the discussion. Therefore it is easier to determine the possible problems and causes of malnutrition of the two villages individually and to give adjusted recommendations for each village. The percentages given in the following tables and graphics apply for the total number of interviewed households, if no number is given. Otherwise the number of valid questionnaires or data for each child, which the data is related to, is written in brackets. Missing data are due to not knowing the answer or response by the mother, or incomplete data in the questionnaire.

34
The distribution of the interviewed mothers according to their approximate age is shown in Table 14. Table 14: Age distribution of the mothers during the time of the survey.
Age of the mother MAMEDE LUKE < 20 years [%] 4.2 1.3 20-29 years [%] 42.0 36.8 30-39 years [%] 31.5 42.8 40-43 years [%] 7.0 6.6 Age unknown [%] 15.4 12.5
4.1.3 Education level of the parents
The education level of the parents in both villages combined is presented in Table 15. Illiteracy was the most common for both mothers and fathers. Nearly twice as many mothers (74%) were illiterate as compared to their husbands (43%). The percentage of mothers who completed an increasing number of school grades decreased steadily. In comparison, the percentage of the men, who completed one of the grades 5 to 12 was 3.3 times higher than of the women. Data relating to the husbands is not quite complete, as some of the wives were not sure about their husband’s level of education. Table 15: Completed school years of the parents in Mamede and Luke.
School years Father Mother 0 (no schooling / illiterate) [%] 43,5 73,9 1 (reading and writing only) [%] 11,9 6,4 2 – 4 [%] 10,8 9,5 5 – 6 [%] 9,8 4,4 7 – 10 [%] 11,5 3,1 11 – 12 [%] 4,4 0,3 Education unknown [%] 8,1 2,4 The education level of the parents in each village is presented in Figure 3. The education level of both parents was higher in Mamede than in Luke. Overall, the fathers in Mamede had the highest education level, and the mothers in Luke the worst, with an illiteracy rate of 83%.
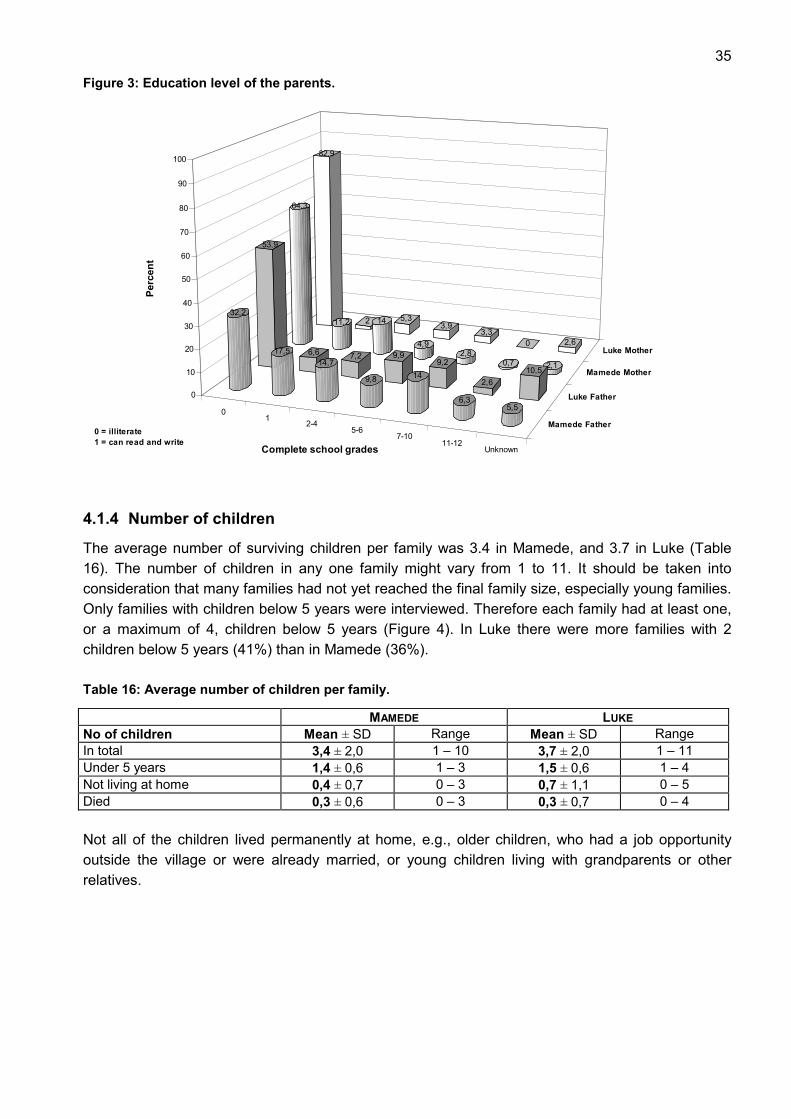
35
Figure 3: Education level of the parents.
01
2-45-6
7-1011-12
Unknown
Mamede Father
Luke Father
Mamede Mother
Luke Mother
82,9
2 5,33,9
3,30 2,6
64,3
11,2 14
4,92,8
0,7 2,1
53,9
6,6 7,2 9,99,2
2,610,5
32,2
17,514,7
9,8 14
6,35,5
0
10
20
30
40
50
60
70
80
90
100Pe
rcen
t
Complete school grades
0 = illiterate1 = can read and write
4.1.4 Number of children
The average number of surviving children per family was 3.4 in Mamede, and 3.7 in Luke (Table 16). The number of children in any one family might vary from 1 to 11. It should be taken into consideration that many families had not yet reached the final family size, especially young families. Only families with children below 5 years were interviewed. Therefore each family had at least one, or a maximum of 4, children below 5 years (Figure 4). In Luke there were more families with 2 children below 5 years (41%) than in Mamede (36%). Table 16: Average number of children per family.
MAMEDE LUKE No of children Mean ± SD Range Mean ± SD Range In total 3,4 ± 2,0 1 – 10 3,7 ± 2,0 1 – 11 Under 5 years 1,4 ± 0,6 1 – 3 1,5 ± 0,6 1 – 4 Not living at home 0,4 ± 0,7 0 – 3 0,7 ± 1,1 0 – 5 Died 0,3 ± 0,6 0 – 3 0,3 ± 0,7 0 – 4 Not all of the children lived permanently at home, e.g., older children, who had a job opportunity outside the village or were already married, or young children living with grandparents or other relatives.

36
Figure 4: Percentage of children alive (< 5 years) per family.
12
34
Mamede
Luke
52,6
40,8
3,9
0,7
60,1
35,7
4,2
0
0
10
20
30
40
50
60
70
80
90
100Pe
rcen
t of f
amili
es
Number of children
In 20% of the families in Mamede, and 23% in Luke, one or more children had already died at the time of the survey (Figure 5). Figure 5: Number of children per family who had already died.
01
23
4
Mamede
Luke
77,0
15,8
3,92,6
0,7
79,7
14,7
4,9
0,70
0
10
20
30
40
50
60
70
80
90
100
Perc
ent o
f fam
ilies
Number of children who had died

37
4.1.5 Religion of mothers
During the interview, only the religion of the mothers was asked (Table 17). The Muslim faith was the predominant religion in both villages (59% in Mamede and 55% in Luke). The remaining women mainly followed the Ethiopian Orthodox faith. Table 17: Religion of the mothers in Luke and Mamede.
Religion MAMEDE LUKE Muslim [%] 59,4 55,3 Ethiopian Orthodox [%] 39,2 44,1 Protestant [%] 0 0,7 Unascertained [%] 1,4 0
4.1.6 Number of pregnant and lactating mothers
Table 18 and Figure 6 give an overview of the percentage of women who came for anthropometric measurement, and were pregnant or lactating, or neither pregnant nor lactating. Table 18: Percentage of pregnant and lactating women.
Women All (n=287) MAMEDE (n=132) LUKE (n=143) Pregnant 3-6 months 7,3 5,1 9,5 7-9 months 7,3 8,7 6,1 Lactating 66,2 69,8 62,8 Not pregnant nor lactating 19,2 16,5 21,6 Only about one fifth of the women were neither pregnant nor lactating. Figure 6: Percentage of women who were lactating, pregnant or neither pregnant nor lactating.
LactatingPregnant
Not preg or lact
Mamede
Luke
62,8
15,6 21,6
69,8
13,816,5
0
10
20
30
40
50
60
70
80
90
100
Perc
ent o
f wom
en

38
4.1.7 Examination in a health institution during pregnancy
Three quarters of the women in Mamede replied that they had visited a health institution for examination during pregnancy, and about 10 percent less in Luke (64%). Table 19: Medical check-up during pregnancy.
Medical check-up MAMEDE (n=141) LUKE (n=148) No [%] 25,5 36,5 Yes [%] 73,8 63,5 Not known [%] 0,7 0

39
4.2 Economic characteristics
4.2.1 Income-generating activities of the family
The main occupation of the parents is the cultivation of their home gardens. Besides farming, additional money has to be earned for extra food and clothes. Family members who conducted any kind of income-generating activities are shown in Table 20 and Figure 7. Table 20: Income-generating activities of the parents and older children (on a daily and monthly basis).
MAMEDE LUKE Earning money Father Mother Children* Father Mother Children* No [%] 40,6 35,0 91,6 54,6 55,9 77,6 Daily income [%] 46,9 60,8 8,4 36,2 42,8 20,4 Monthly income [%] 5,6 1,4 0 0 Unascertained [%] 7,0 2,8 0 9,2 1,3 2,0 * One or more children per household. The majority of income-generating activities conducted in both villages were on a daily basis. None of the parents in Luke replied that they received a regular monthly income, whereas in Mamede a small percentage of fathers (6%) and mothers (1%) had monthly income on a regular basis (e.g. teachers). It is also common for older children to be involved in income- generating activities, or to be sent away to other places to perform activities such as polishing shoes, small-scale trading, or domestic servants. More children in Luke (20%) seemed to perform some kind of income-generating activity than in Mamede (8%). Figure 7: Percent of income-generating activities of the parents (on a daily and monthly basis).
55,9 42,8 01,3
35 60,8 1,42,8
54,6 36,2 0 9,2
40,6 46,8 5,6 7,0
0% 20% 40% 60% 80% 100%
Percent
Luke Mother
Mam Mother
Luke Father
Mam Father
No income Daily income Monthly income
Unascertained
In both villages the main income-generating activities for men and women were selling home-grown products from the home gardens, or small-scale trading through buying products, e.g., from neighbours, and selling them in the market (see Table 21).

40
Table 21: Income-producing activities of the parents.
MAMEDE LUKE Income-producing activities Father Mother Father Mother None [%] 40,5 35,0 54,6 51,3 Selling [%] 30,1 34,2 28,9 36,8 Trading [%] 14,0 11,9 2,0 2,0 Carpenter* [%] 2,1 0 4,6 0 Guard [%] 1,4 0 0 0 Government worker / NGO employee [%]
2,8 0,7 0 0
Craft worker, potter [%] 0 2,8 0 0,7 Preparation of local alcohol [%] 0 9,8 0 0 House servant [%] 0 0,7 0 0 Daily worker [%] 0,7 1,4 0 2,6 Other [%] 2,1 0,7 0,7 0 Unascertain [%] 6,3 2,8 9,2 1,3 * Blacksmith, well digger, woodcarver
4.2.2 Agricultural production
The families commonly grew their agricultural products behind the house. The cash crops, vegetables and fruits in the questionnaire were chosen according to the variety which was available in markets in this area during the time of the survey. Important cash crops in both villages were enset, maize, chat, coffee, and for the Ethiopian Orthodox families hope, for alcohol production (Figure 8). Tef and other crops such, as wheat, barley, or sorghum, which in other regions of Ethiopia are staple foods, were grown in less than 10% of the households, whereas maize was grown in most of the households. Ethiopian kale was the only vegetable which was found in nearly every home garden. Vegetables such as tubers, tomatoes, carrots, red beet, or pumpkin were only found in a small number of households (Figure 9). In Mamede, the main fruit grown was mango (76%), whereas it had little importance in Luke (2%). In general, most of the fruits were found in a slightly higher percentage in Mamede than in Luke, except for papaya.

41
Figure 8: Percent of households crowing cash crops
Ense
te
Mai
ze
Chat
Coffe
e
Hope
Teff
Legu
mes
2
Whe
at1
Mamede
Luke
77,6
96,1
5761,8
14,5
8,6
21,3
96,5
88,8
79,7
54,6
43,4
3,5
00
0
10
20
30
40
50
60
70
80
90
100
Perc
ent o
f hou
seho
lds
1 Plus barley, sorghum 2 Legumes are commonly grown during the rainy reason in this area. [This was not recorded by the women, because the name of the most common type (kidney bean) was missing as an example for legumes in the questionnaire]. Figure 9: Percent of households growing vegetables and fruits
Vege
tabl
eEt
hiop
. kale
Pepp
er
Tube
rs1
Tom
ato2
Sala
d3
Frui
ts
Man
go
Oran
ge
Bana
na
Papa
ya
Lem
on
Avoc
ado
Mamede
Luke
90,1
30,3
23,7
11,8
0 2
25,7
17,1 20,4
6 7,3
86
37,8
27,3
11,9
0,7
76,2
32,229,4
13,318,9
11,9
0
10
20
30
40
50
60
70
80
90
100
Perc
ent o
f hou
seho
lds
1 Potato, potato like-tubers 2 Plus carrot, red beet, pumpkin 3 Salad was included because the Bio-village project started to introduce salad to the farmers in Mamede.

42
The following table (Table 22) gives an overview of all agricultural products, whether they were sold, or used for personal consumption, or both. Enset, maize and Ethiopian kale were mainly cultivated for personal consumption, whereas the products coffee, chat and hope, as well as pepper and fruits, were used for both family consumption and as source of income. Table 22: Agricultural products in the home gardens
MAMEDE LUKE Agricultural products
No1 Own use2
Sale3 Both4 No1 Own use2
Sale3 Both4
Cash crops Enset [%] 3,5 94,4 0 2,1 22,4 76,9 0,7 0,0 Maize [%] 11,2 86,7 0 2,1 3,9 86,2 0,7 9,2 Legumes [%] 100 0 0 0 98,0 1,3 0,7 0 Tef [%] 96,5 0 1,4 2,1 91,4 1,3 0,7 6,6 Wheat5 [%] 100 0 0 0 98,7 1,3 0 0 Coffee [%] 45,4 38,5 0,7 15,4 38,2 30,9 1,3 29,6 Chat [%] 20,3 22,4 11,2 46,1 43 16,6 5,3 35,1 Hope [%] 56,6 10,5 14,0 18,9 85,5 8,6 2,0 3,9 Vegetables Ethiopian kale [%] 14,0 74,8 0 11,2 9,9 87,5 0 2,6 Salad [%] 99,3 0,7 0 0 100,0 0,0 0 0,0 Tubers6 [%] 72,7 25,2 0 2,1 76,3 11,2 0 12,5 Tomato7 [%] 88,1 7,0 0 4,9 88,2 2,6 0 9,2 Pepper [%] 62,2 28,0 0 9,8 69,7 15,8 0 14,5 Fruits Guava [%] 67,8 9,8 3,5 18,9 74,3 14,5 0 11,2 Lemon [%] 81,1 3,5 2,8 12,6 94,0 3,3 0,7 2,0 Mango [%] 23,8 16,1 8,4 51,7 98,0 0,7 0 1,3 Banana [%] 70,6 9,1 3,5 16,8 82,9 3,9 0,7 12,5 Papaya [%] 86,7 4,2 1,4 7,7 79,6 5,3 1,3 13,8 Avocado [%] 88,1 4,9 0 7,0 92,7 1,3 0,7 5,3 1 Was not grown in last season time 2 Mainly for own consumption 3 Mainly for sale 4 Equal for both, own consumption and sale 5 Plus barley, sorghum 6 Potato, potato like-tubers 7 Plus carrot, red beet, pumpkin
4.2.3 Livestock property
The livestock most often kept were cows, calves and chicken (Table 23). More detailed information will be given in the final report of the previously conducted socio-economic survey. Table 23: Livestock per household
MAMEDE LUKE Livestock No1 [%] Yes [%] Av±SD Range No1 [%] Yes [%] Av±SD Range Cow 30.1 69.9 1.3 ± 1.3 0 – 5 48.7 51.3 0.6 ± 0.7 0 – 4 Ox/bull 79.0 21.0 0.3 ± 0.7 0 – 3 86.8 13.2 0.2 ± 0.4 0 – 2 Calf 60.8 39.2 0.5 ± 0.8 0 – 4 61.8 38.2 0.5 ± 0.7 0 – 3 Donkey/horse/mule 93.7 6.3 0.07 ±0.3 0 – 2 99.3 0.7 0.01± 0.1 0 – 1 Goat 89.5 10.5 0.1 ± 0.4 0 – 2 84.2 15.8 0.2 ± 0.5 0 – 3 Chicken 42.7 57.3 1.2 ± 1.5 0 – 7 59.2 32.9 0.7 ± 1.1 0 – 7 1 Not owned

43
Table 24 shows the number of households reported to be producing animal products during the time of the survey, and whether they were sold, or used for personal consumption, or both. Table 24: Animal products per household
MAMEDE LUKE Animal products No1 Own2 Sale3 Both4 No1 Own2 Sale3 Both4 Milk [%] 79.0 17.5 1.4 2.1 88.8 8.6 0 2.6 Butter [%] 81.1 15.4 1.4 2.1 88.8 5.9 2.0 3.3 Cheese [%] 81.1 15.4 1.4 2.1 88.8 5.9 2.0 3.3 Eggs [%] 72.7 10.5 4.9 11.9 90.8 4.6 0.7 3.9 Honey [%] 88.8 4.9 2.1 4.2 90.8 5.9 0 3.3 1 Not available 2 Mainly for personal consumption 3 Mainly for sale 4 For both, personal consumption and sale equally

44
4.3 Social characteristics
4.3.1 Time needed and allocated responsibility for water collection
Table 25 shows the average estimated travel time needed for collecting water from the well. The total averages shown are for both Mamede and Luke, plus the sub-villages of each. Table 25: Time needed for water collection (in min).
AV time [min] Range AV time [min] Range Mamede (n=141) 45 2 – 180 Luke (n=152) 45 3 - 120 Yeguwarebe (n=12) 45 15 – 60 Piassa Sefer (n=39) 35 10 - 60 Yajet (n=45) 50 10 – 180 Sekora Sefer (n=26) 60 15 - 120 Mohor Sefer (n=6) 20 10 – 30 Hiber/Zwissa Sefer
(n=20) 45 5 - 120
Mehal Mamede (n=46)
45 2 – 90 Eba (n=31) 45 3 - 120
Yeja Sefer (n=18) 50 20 – 60 Eba Sheik (n=29) 55 10 - 120 Yesmamede (n=14) 65 15 – 180 Aman Gossiye (n=7) 25 3 - 30 The average estimated time for water collection of about 45 min in both villages seemed to be identical. The main differences appeared between the sub-villages, depending on ease of access to different wells. The range shows that even within the sub-villages there were big differences reported in the time needed for families to reach a well or other water source. In both villages the water collection was mainly the duty of the mother (Figure 10, multiple answers were possible) supported by the daughters and sons. Surprisingly, 5% of the women in Mamede reported that their husbands were also collecting water, which is rarely seen in Ethiopia. Figure 10: Household members responsible for water collection.
Mot
her
Daug
her
Son
Fath
er
Othe
r
Mamede
Luke
80,4
30,8
9,8
2,11,4
77,6
22,4
13,2
5,3
3,3
0
10
20
30
40
50
60
70
80
90
100
Perc
ent o
f hou
seho
lds

45
4.3.2 Support
The following graphics show possible means of support that the mother might receive from family members, relatives, neighbours or friends, when she needs to borrow money, or when she works outside the house, or is ill (multiple answers possible). Figure 11: Groups of people who support the mother on different occasions in Mamede.
Fam
ily m
embe
rs
Rela
tives
Neig
hbou
rs
Frie
nds
No s
uppo
rt
Borrow money
Mother not at home
Mother ill
69,9
35,7
46,9
4,92,8
52,4
18,9
30,8
3,5 5,6
13,3
40,6
34,3
21,7
5,60
10
20
30
40
50
60
70
80
90
100
Perc
ent o
f hou
seho
lds
Mamede
Figure 12: Groups of people who support the mother on different occasions in Luke.
Fam
ily m
embe
rs
Rela
tives
Neig
hbou
rs
Frie
nds
No s
uppo
rt
Borrow money
Mother not at home
Mother ill
68,4
12,5
43,4
2,00
61,8
52,0
28,3
1,30
30,9
25,0
36,8
9,9 11,8
0
10
20
30
40
50
60
70
80
90
100
Perc
ent o
f hou
seho
lds
Luke
0

46
The support of family members (older children, grandparents, or the father) was most important when the mother was ill, or when she had to leave the house for work in the fields, market, etc. In respect of supporting a mother who might be ill, or need to borrow money, the family seemed to consider it more important to have a good relationship with neighbours than with relatives, who might not live appropriately near.
4.3.3 Number of meals consumed by the mother and the index child
The following figure shows how many meals the mother reported for her and her index child in the 24-h recall (the 24-h recall only includes children = 8 months who were not exclusively breast-fed any more). Figure 13: Number of meals consumed by the mothers and their index children (24-h recall).
4 5
18
47
23
3
18
11
4
14
56
14
1
63
1
29
57
9
1
26
0 0
35
59
6
0
16
0
10
20
30
40
50
60
70
80
90
100
0 1 2 3 4 5 Snack*
Number of meals
Perc
ent o
f mot
hers
/chi
ldre
n
Child MamedeChild LukeMother MamedeMother Luke
* Cow's milk, roasted chick peas, fruits etc. were considered as snacks and not as a complete meal.
The majority of mothers and children had 3 meals per day. 2% of the children in Mamede and 14% in Luke had 4 meals per day, whereas 18% and 14% in Mamede and Luke, respectively, only consumed 2 meals per day. A larger group of mothers (29% in Mamede and 35% in Luke) only had 2 meals per day. More women and children had 1 or more snacks in addition to the meals. A few children, who were not exclusively breast-fed any more (4% in Mamede and 11% in Luke), only received breast milk, or a snack in addition to breast milk, on the day before the interview. If they received cow’s milk, roasted chick peas, or fruits, this was considered as a snack.

47
4.4 Anthropometry5
4.4.1 WFA, HFA and WFH of the index children
An overview of anthropometric data (weight-for-age [WFA], height-for-age [HFA], weight-for-height [WFH]), expressed as average z-score and percentage of the index children whose z-scores were below –2SD in total, and according to village and sex, is presented in Table 26 and Table 27. Table 26: Average z-scores for WFH, HFA, WFA for the total number of index children, and according to village, sex, and age.
WFH z-score HFA z-score WFA z-score All (n=283/278/284)* -1.3 ± 0,9 -2,4 ± 1,5 -2,4 ± 1,1 Villages MAMEDE (n=137/132/135) -1.4 ± 0,8 -2,7 ± 1,3 -2,6 ± 1,0 LUKE (n=146/146/149) -1,1 ± 10,9 -2,3 ± 1,6 -2,3 ± 1,1 Sex Male (n=146/143/147) -1.3 ± 0,8 -2,5 ± 1,5 -2,4 ± 1,0 Female (n=137/135/137 -1.3 ± 0,9 -2,5 ± 1,5 -2,4 ± 1,1 Age [months] 8 to 11,9 (n=28/23/23) -1,3 ± 0,9 -1,7 ± 1,9 -2,3 ± 1,5 12 to 23,9 (n=76/76/78) -1,5 ± 0,9 -2,3 ± 1,3 -2,5 ± 1,1 24 to 35,9 (n=82/82/(3) -1,3 ± 0,8 -2,5 ± 1,5 -2,6 ± 1,1 36 to 47,9 (n=66/66/67) -1,0 ± 0,8 -2,8 ± 1,3 -2,3 ± 1,0 48 to 59,9 (n=29/29/31) -1,0 ± 0,9 -2,8 ± 1,5 -2,4 ± 1,0 * Explanation of how to read the numbers: 283 children could be included in calculation of the average WFH z-score, 278 for the average HFA z-score and 284 for the WFA z-score. Table 27: Percentage of children with z-scores below –2SD for WFH, HFA, WFA for the total number of index children, and according to village, sex, and age.
All data in % Wasting (WFH) Stunting (HFA) Underweight (WFA)
All (n=283/278/284)* 20,1 63,7 66,5 Villages MAMEDE (n=137/132/135) 24,1 70,5 74,8 LUKE (n=146/146/149) 16,4 57,5 59,1 Sex Male (n=146/143/147) 17,8 66,4 66,7 Female (n=137/135/137 22,6 60,7 66,4 Age [months] 8 to 11,9 (n=28/23/23) 25,0 34,8 52,2 12 to 23,9 (n=76/76/78) 28,9 63,2 69,2 24 to 35,9 (n=82/82/(3) 19,5 61,0 66,3 36 to 47,9 (n=66/66/67) 12,1 72,7 67,2 48 to 59,9 (n=29/29/31) 13,8 72,4 67,7 * Explanation of how to read the numbers: out of 283 children 20.1% were wasted, out of 278 children 63.7 were stunted and out of 284 children 566.5% were underweight. The study demonstrated that for all three indicators (WFH, WFA, HFA) the anthropometric data of the index children reflected a better nutritional situation in Luke than in Mamede (Table 26). The children of Mamede appeared worse for all three indicators than the children from Luke. It seemed
5 These data are described in more detail in a later chapter, where data relating to additional children are available. These data only reflect the index children and may slightly vary from the other anthropometric analyses of all children the measured, due to the different age distribution of the index children.

48
that a higher percentage of the girls fell into the category of wasted (z-score WFH < -2SD), and a higher percentage of the boys into the category of stunted (z-score HFA < -2SD). As seen in Table 26 and Table 27, the average z-scores, as well as the percentage of children with a z-scores below –2SD, indicate that the younger children between 8 months and 2 years were more at risk of acute malnutrition (wasting), whereas the extent of chronic malnutrition (stunting) increased with age, and was more frequently observed in the older children (3 and 4 years old). 2 children of the index children were observed to have signs of kwashiorkor, one in Mamede and one in Luke.
4.4.2 BMI, weight and height of the non-pregnant mothers of the index children who were interviewed
Table 28 summarises the average body mass index (BMI), weight and height of the non-pregnant mothers of the index children; it shows both the total averages, and the individual averages for each village. Table 28: Average BMI, weight and height of non-pregnant mothers interviewed: overall total and individual village totals.
Total (n=272) MAMEDE (n=130) LUKE (n=142) AV ± SD Range AV ± SD Range AV ± SD Range BMI [kg/m2] 18.6 ± 1.7 13.0 – 24.5 18.4 ± 1.8 13.0 – 24.5 18.8 ± 1.6 13.5 – 22.1Weight [kg] 46.0 ± 5,4 33 – 68 45.0 ± 5.7 33 – 68 46.9 ± 4.9 33 – 56 Height [cm] 157.0 ± 6.3 141 – 186 156.2 ± 6.3 141 - 170 157.7 ± 6,4 141 – 186
4.5 Health status (point prevalence)6 The most common diseases among the index children, which were observed by medical personnel and reported by the parents on the day of medical check-up, are listed in Table 29. Table 29: Visible and reported diseases of the index children, noted on the day of the health check.
Diseases Total (n=291) Villages MAMEDE (n=142 LUKE (n=149) VISIBLE DISEASES Respiratory infection [%] 3.4 7.0 0 Ear infection [%] 2.1 2.1 2.0 Eye infection [%] 9.7 9.2 10.1 Scabies [%] 11.3 12.7 10.1 Burn, wound [%] 3.4 7.0 0 REPORTED DISEASES Worms [%] 10.0 3.5 16.1 Diarrhoea [%] 4.1 7.0 1.3 Vomiting [%] 0.3 0 0.7 Fever [%] 1.0 0.7 1.3
6 These data are described in more detail in a later chapter, where data relating to additional children is available. These data only reflect the index children.

49
4.6 24-h recall
4.6.1 Energy distribution of macro-nutrients, and nutrient density of the children
Energy derived from carbohydrates, fat and protein, expressed as the percentage of the total energy intake of the total number of children, and according to village, age and breast-feeding status, is shown in Table 30 and Figure 14. Protein contributed in nearly equally amounts to the total energy intake of the different child groups. Fat contributed too little to the total energy intake for all the children, compared to the recommended ranges. On average, the diets contained a higher percentage of fat in Mamede than in Luke. With increasing age the diets decreased in fat intake, whereas the opposite was found to be the case for carbohydrates. Table 30: Energy derived from carbohydrates, fat and protein, expressed as the percentage of the children’s total energy intake.
Protein [%] Fat [%] Carbohydrates [%]
Av ± SD Av ± SD Av ± SD Total (n=281) 11 ± 5 13 ± 13 77 ± 15 Villages MAMEDE (n=138) 10 ± 5 16 ± 12 74 ± 14 LUKE (n=143) 11 ± 5 9 ± 13 80 ± 16 Age < 1 year (n=11) 9 ± 5 28 ± 20 63 ± 22 1 year (n=73) 11 ± 5 18 ± 19 71 ± 22 2 years (n=82) 12 ± 6 10 ± 8 78 ± 11 3-4 years (n=96) 10 ± 3 9 ± 7 81 ± 8 Breast-fed Yes (n=128) 11 ± 6 16 ± 17 72 ± 20 No (n=151) 10 ± 3 9 ± 7 80 ± 8 Breast-fed children according to age
< 1 year (n=11) 9 ± 5 28 ± 20 63 ± 22 1 year (n=61) 11 ± 5 19 ± 19 70 ± 23 2 years (n=38) 12 ± 9 10 ± 9 78 ± 15 3-4 years (n=9) 11 ± 1 11 ± 9 78 ± 9 Not breast-fed children according to age
1 year (n=12) 11 ± 3 12 ± 11 78 ± 12 2 years (n=43) 11 ± 4 10 ± 6 79 ± 8 3 years (n=56) 10 ± 3 9 ± 7 81 ± 7 4 years (n=30) 10 ± 3 8 ± 9 81 ± 8 Age MAMEDE < 2 years (n=39) 9 ± 5 24 ± 16 67 ± 18 2 years (n=42) 12 ± 6 13 ± 9 76 ± 12 3-4 years (n=45) 10 ± 3 12 ± 9 77 ± 10 Age LUKE < 2 years (n=45) 12 ± 5 16 ± 21 73 ± 25 2 years (n=40) 12 ± 7 7 ± 5 81 ± 10 3-4 years (n=51) 11 ± 3 6 ± 3 84 ± 4 Differences among the different child groups are marked in bold print.

50
Figure 14: Energy derived from carbohydrates, fat and protein expressed as the percentage of the total energy intake: compared (index children) Mamede and Luke.
Protein10%
Fat16%
Carbohydrates74%
Mamede
Carbohydrates80%
Fat9%
Protein11% Luke
The average nutrient density of the children’s diet is listed for macro-nutrients in Table 31, and for micro-nutrients in Table 32. Table 31: Average nutrient density of macro-nutrients among the children.
Nutrients Protein [g] Fat [g] Carbohydrates [g]
Dietary fibre [g]
Recommended nutrient density
25-30 g 16-39 g 140-190 g 8-20 g
All (n=281) 26 ± 11 14 ± 15 190 ± 38 20 ± 9 Villages MAMEDE (n=138) 25 ± 12 18 ± 14 183 ± 35 20 ± 9 LUKE (n=143) 27 ± 10 11 ± 15 197 ± 40 21 ± 10 Age < 1 year (n=11) 22 ± 11 32 ± 22 153 ± 56 9 ± 9 1 year (n=73) 27 ± 13 21 ± 22 176 ± 54 14 ± 11 2 years (n=82) 28 ± 13 11 ± 9 192 ± 32 22 ± 8 3-4 years (n=96) 24 ± 6 11 ± 8 201 ± 20 24 ± 5 Age MAMEDE < 2 years (n=39) 23 ± 11 27 ± 17 164 ± 44 12 ± 9 2 years (n=42) 29 ± 16 15 ± 10 187 ± 30 21 ± 7 3-4 years (n=45) 24 ± 7 14 ± 11 193 ± 25 24 ± 5 Age LUKE < 2 years (n=45) 29 ± 13 18 ± 25 181 ± 61 16 ± 12 2 years (n=40) 28 ± 10 8 ± 5 199 ±33 23 ± 9 3-4 years (n=51) 25 ± 6 7 ± 3 208 ± 11 24 ± 6 Values below the recommended range are marked in bold print, values above the recommended range in italics. The age groups below 2 years are written in smaller letters, because they are not included in this recommendation, but are included to demonstrate the differences among the age groups. As shown in Table 31, the diets of the children contained a high density of carbohydrates, a low density of fat, and a protein density within the recommended range. The actual quality of the protein was not taken into consideration in this comparison. There were no big variations in protein between Mamede and Luke, or within the different age groups, whereas the fat content of the diets seemed to be lower in Luke and decreased with the increasing age of the children. In general, the diets included a high density of dietary fibre. Looking at the nutrient density of micro-nutrients (Table 32) the diets seemed to be sufficient for vitamin A (retinol equivalent = RE), riboflavin, calcium and iron, whereas a low nutrient density of thiamine and vitamin C was found. The density of most micro-nutrients in the food increased with age, with the exception of thiamine (which decreased) and vitamin C (where no trend was obvious). The vitamin A density in the diets of children below 1 year was the lowest. But these children are, in

51
general, still breast-fed and therefore receive their necessary vitamin A intake through a combination of breast-feeding and complementary foods. Table 32: Average nutrient density of micro-nutrients among the children.
Nutrients Vitamin A (RE)
Thiamine Riboflavin Vitamin C Calcium Iron
Nutrient density 350-500 µg 0,5-0,8 mg 0,6-0,9mg 25-30 mg 250-400 mg 11 mg Total (n=281) 1477 ± 2999 0,2 ± 0,2 2,1 ± 1,3 11 ± 22 1407 ± 1057 48 ± 35 Villages MAMEDE (n=138) 1783 ± 2207 0,2 ± 0,2 1,7 ± 1,0 13 ± 30 1133 ± 774 48 ± 20 LUKE (n=143) 1182 ± 3586 0,2 ± 0,2 2,5 ± 1,5 9 ± 8 1672 ± 1216 49 ± 45 Age < 1 year (n=11) 195 ± 176 0,4 ± 0,2 1,3 ± 1,1 8 ± 9 708 ±760 23 ± 19 1 years (n=73) 807 ± 1659 0,3 ± 0,2 1,9 ± 1,8 11 ± 20 1219 ± 1435 37 ± 26 2 years (n=82) 1404 ± 1857 0,2 ± 0,2 2,2 ± 1,4 14 ± 31 1526 ± 1044 57 ± 55 3-4 years (n=96) 2182 ± 4407 0,1 ± 0,1 2,3 ± 0,8 9 ± 15 1570 ± 692 52 ± 15 Values below the recommended range are marked in bold print, values above the recommended range in italics. The age groups below 2 years are written in smaller letters, because they are not included in this recommendation, but are included to demonstrate the differences among the age groups.
4.6.2 Actual nutrient intake of the non breast-fed children
Table 33 and Table 34 give an overview over the actual water, energy, macro-nutrient and micro-nutrient intake of the non breast-fed children, and the water and energy intake of breast-fed children. Table 33: Actual, average water, energy and macro-nutrient intake of the non breast-fed children, and water and energy intake of the breast-fed children.
Nutrients Water* [ml] (food + bev)
Energy [kcal]
Protein [g] Fat [g] Carbohy-drates [g]
Dietary fibre [g]
NON BREAST-FED CHILDREN
1 year (n=12) Average intake 514 ± 238 652 ± 315 17 ± 10 8 ± 9 127 ± 62 14 ± 8 Requirement 900 22-27 31-41 120-170 2 years (n=43) Average intake 630 ± 267 633 ± 254 17 ± 8 8 ± 6 123 ± 51 15 ± 7 Requirement 1020 25-30 18-41 140-190 3 years (n=56) Average intake 632 ± 216 682 ± 236 16 ± 6 7 ± 6 137 ± 49 16 ± 6 Requirement 1145 27-33 19-44 150-205 4 years (n=30) Average intake 689 ± 163 739 ± 260 18 ± 7 7 ± 9 150 ± 55 18 ± 7 Requirement 1200 29-35 20-47 160-215 BREAST-FED CHILDREN#
1 year (n=61) Average intake 259 ± 185 331 ± 228 2 years (n=38) Average intake 365 ± 231 447 ± 267 3 years (n=7) Average intake 584 ± 217 663 ± 272 * This number includes the beverages and the water content of the food. The actual beverage intake is lower. Values below the recommended range are marked in bold print, values above the recommended range in italics. # The additional water, energy and macro-nutrient intake of breast milk was not measured.

52
The water intake through food and beverages was slightly higher in the older children than in the younger ones. The average beverage intake (not including breast milk) for all children was about 190 ml per day. The energy intake among the non breast-fed children increased slightly with age, due to increasing carbohydrate intake but did not increase in proportion to the increasing energy requirement. Table 34: Actual, average micro-nutrient intake of the non breast-fed children.
Nutrients Vitamin A (RE) [µg]
Thiamine [mg]
Riboflavin [mg]
Vitamin C [mg]
Calcium [mg]
Iron [mg]
NON BREAST-FED CHILDREN
1 year (n=12) Average intake 383 ± 478 0,1 ± 0,2 1,4 ± 0,9 4 ± 2 977 ± 658 32 ± 18 Requirement 400 0,5 0.8 20 400 13 % of requirement 96 27 175 22 244 246 2 years (n=43) Average intake 921 ± 1029 0,2 ± 0,2 1,4 ± 0,9 13 ± 25 947 ± 664 33 ± 14 Requirement 400 0,5 0.8 20 400 13 % of requirement 230 30 173 65 237 251 3 years (n=56) Average intake 1272 ± 2254 0,1 ± 0,1 1,5 ± 0,6 5 ± 8 991 ± 496 36 ± 15 Requirement 400 0,7 400 % of requirement 318 14 146 24 248 254 4 years (n=30) Average intake 1280 ± 2416 0,1 ± 0,04 1,8 ± 0,7 7 ± 10 1233 ± 533 38 ± 16 Requirement 400 0,7 450 % of requirement 320 10 176 34 274 271 Values below the recommended range are marked in bold print, values above the recommended range in italics. The dietary intake of the non breast-fed children seemed to be high in vitamin A, riboflavin, calcium, and iron, whereas it was lacking a satisfactory content of thiamine and vitamin C. The high intake of vitamin A and riboflavin might be limited to the rainy season when predominantly Ethiopian kale is consumed.

53
4.6.3 Energy distribution of macro-nutrients and nutrient density of the mothers
Energy derived from carbohydrates, fat and protein, expressed as the percentage of the total energy intake of all the women, and according to village, pregnancy and lactation is shown in Table 35. The percentage of total energy intake representing protein was similar in all the women. Fat contributed too little to the total energy intake for all the women, compared to the recommended ranges for women of child bearing age. A significant difference in fat intake was found between the women in Mamede (11% ) and Luke (7%). In Luke, the diet contained on average less fat, which was compensated for by a higher intake of carbohydrates. Table 35: Energy derived from carbohydrates, fat and protein expressed as the percentage of the total energy intake among the mothers.
Protein Fat Carbohydrates Recommendation 10-12 20-30 55-70 Total (n=290) 10 ± 3 9 ± 6 81 ± 7 Villages MAMEDE (n=138) 10 ± 3 11 ± 7 79 ± 8 LUKE (n=152) 10 ± 3 7 ± 5 83 ± 6 Pregnant or lactating Not pregnant or lactating (n=54)
10 ± 3 9 ± 7 81 ± 7
Pregnant (n=42) 10 ± 3 9 ± 5 81 ± 7 Lactating (n=190) 10 ± 3 9 ± 7 81 ± 8 BMI (of non-pregnant women) <18.5 (n=111) 9 ± 3 9 ± 5 82 ± 6 =18.5 (n=118) 10 ± 3 9 ± 6 81 ± 7 Values below the recommended range are marked in bold print, values above the recommended range in italics.
A similar picture to the above can be seen in Table 36, where the nutrient density is described. The protein intake was at the lower limit of the recommended value (the protein quality was not taken into consideration). For pregnant and lactating women the protein recommendation is higher. Therefore protein was insufficient for these mothers. The fat density of all the diets was too low, especially in respect of pregnant and lactating women. The carbohydrate and dietary fibre density were found to be above the recommended values. Table 36: Average nutrient density of macro-nutrients among the mothers.
Nutrients Protein [g] Fat [g] Carbohydrates [g]
Dietary fibre [g]
Nutrient density 25-30 g 16-39 g 140-190 g 8-20 g Total (n=290) 25 ± 7 10 ± 7 201 ± 19 23 ± 5 Villages MAMEDE (n=138) 24 ± 7 13 ± 8 196 ± 21 23 ± 6 LUKE (n=152) 25 ± 7 7 ± 6 206 ± 15 24 ± 5 Pregnant or lactating Not pregnant or lactating (n=54)
25 ± 8 11 ± 8 200 ± 18 24 ± 6
Pregnant (n=42) 25 ± 7 10 ± 6 202 ± 18 24 ± 5 Lactating (n=190) 24 ± 6 10 ± 8 201 ± 19 24 ± 5 BMI (without pregnant women) <18.5 (n=111) 24 ± 6 10 ± 6 203 ± 16 24 ± 5 =18.5 (n=118) 25 ± 6 10 ± 7 202 ± 17 24 ± 6

54
Values below the recommended range are marked in bold print, values above the recommended range in italics. Looking at the nutrient density of micro-nutrients, Table 37 the diets seemed to be sufficient in vitamin A (RE), riboflavin, calcium and iron, even considering that the need is increased during pregnancy and lactation, whereas a low nutrient density of thiamine and vitamin C was found. No big differences were found between pregnant, lactating, non-pregnant, or non-lactating women. The density of most micro-nutrients in the food differed between Mamede and Luke, except for thiamine. Table 37: Average nutrient density of micro-nutrients among the children.
Nutrients Vitamin A (RE)
Thiamine Riboflavin Vitamin C Calcium Iron
Nutrient density 350-500 µg 0,5-0,8 mg 0,6-0,9mg 25-30 mg 250-400 mg 11 mg All (n=290) 1613 ± 2856 0,1 ± 0,1 2,2 ± 0,7 6 ± 4 1526 ± 621 52 ± 15 Villages MAMEDE (n=138) 1989 ± 1969 0,1 ± 0,1 1,9 ± 0,7 4 ± 4 1318 ± 544 56 ± 14 LUKE (n=152) 1271 ± 3442 0,1 ± 0,1 2,5 ± 0,7 8 ± 4 1715 ± 628 49 ± 14 Pregnant or lactating Not pregnant or lactating (n=54)
1845 ± 3751 0,1 ± 0,1 2,2 ± 0,8 6 ± 5 1540 ±635 54 ± 15
Pregnant (n=42) 1383 ± 1762 0,1 ± 0,1 2,2 ± 0,8 6 ± 4 1551 ± 622 53 ± 14 Lactating (n=190) 1627 ± 2790 0,1 ± 0,1 2,2 ± 0,7 6 ± 4 1526 ± 620 52 ± 15 BMI (without pregnant women)
<18.5 (n=111) 1553 ± 2858 0,1 ± 0,1 2,2 ± 0,7 6 ± 5 1508 ± 553 52 ± 15 =18.5 (n=118) 1753 ± 3293 0,1 ± 0,1 2,3 ± 0,8 6 ± 4 1603 ± 659 53 ± 14 Values below the recommended range are marked in bold print, values above the recommended range are marked in italics.
4.6.4 Actual nutrient intake of the mothers
Table 38 and Table 39 give an overview of the actual water, energy, macro-nutrient and micro-nutrient intake of the women. The water intake through beverages and food was slightly higher for pregnant and lactating women, and slightly higher in Mamede than in Luke. On average the mothers consumed 820 ml in beverages per person, 895 ml in Mamede and 752 ml in Luke. The energy intake of the women did not increase during pregnancy and lactation. Table 38: Actual average water, energy and macro-nutrient intake of the mothers
Nutrients Water* [ml] (food + bev)
Energy [kcal]
Protein [g] Fat [g] Carbohy-drates [g]
Dietary fibre [g]
Not pregnant or lactating (n=54)
Average intake 1423 ± 397 1273 ± 457 31 ± 13 14 ± 14 256 ± 98 29 ± 10 Requirement 1900 40 53-75 255-350 Pregnant (n=42) Average intake 1463 ± 403 1334 ± 465 33 ± 12 13 ± 10 271 ± 101 32 ± 11 Requirement 2000 47 Lactating (n=190) Average intake 1534 ± 620 1337 ± 517 32 ± 14 15 ± 16 267 ± 101 31 ± 11 Requirement 2400 60 Villages MAMEDE (n=138) 1581 ± 676 1378 ± 510 34 ± 16 19 ± 16 268 ± 100 31 ± 12 LUKE (n=152) 1429 ± 402 1272 ± 482 30 ± 10 11 ±13 262 ±101 30 ± 11 * This number includes beverages and the water content of the food. The actual beverage intake is lower.

55
Values below the recommended range are marked in bold print, values above the recommended range in italics. The overall dietary intake of the women seemed to be high in vitamin A, riboflavin, calcium, and iron during the season when the survey was conducted, which resulted in a satisfactory intake for pregnant and lactating women, whereas it was lacking in thiamine and vitamin C. Table 39: Actual, average micro-nutrient intake of the mothers.
Nutrients Vitamin A (RE) [µg]
Thiamine [mg]
Riboflavin [mg]
Vitamin C [mg]
Calcium [mg]
Iron [mg]
Not pregnant or lactating (n=54)
Average intake 1906 ± 2737 0,2 ± 0,2 2,7 ± 1,1 8 ± 6 1849 ± 810 67 ± 28 Requirement 500 0.9 1.3 30 400-500 48 Pregnant (n=42) Average intake 1819 ± 2451 0,2 ± 0,1 3,0 ± 1,2 8 ± 5 2015 ± 897 71 ± 31 Requirement 600 1.0 1.5 50 1000-1200 76 Lactating (n=190) Average intake 1319 ± 2451 0,2 ± 0,1 2,8 ± 1,2 8 ± 6 1950 ± 917 67 ± 30 Requirement 600 1.1 1.7 50 1000-1200 26 Villages MAMEDE (n=138) 2377 ± 2682 0,2 ± 0,2 2,6 ± 1,2 5 ± 6 1760 ± 894 76 ± 33 LUKE (n=152) 1353 ± 2863 0,1 ± 0,1 3,0 ± 1,1 9 ± 6 2089 ± 871 60 ±25 Values below the recommended range are marked in bold print, values above the recommended range in italics.

56
4.7 Food consumption pattern of the index child The following 5 graphics present all the foods asked about in the list included in the food frequency questionnaire7, in relation to the percentage of households where the children received the food items often (3-7 times per week), seldom (1-2 times per week), or had not received them at all during the week prior to the interview. More than 50% of the index children had not received many of these foods from their mothers at all in the previous seven days, with few exceptions. Figure 15: Percent of children who received different types of grains one or more days (grey) or not at all (white) during the 7 days prior to the survey.
7,9
2
7,9
1,4
14
10,5
9,2
5,3
6,6
14,5
8,4
0,7
22,4
3,5
16,8
86,8
100
91,4
100
77,6
90,2
99,3
63,6
86,0
74,1
0 10 20 30 40 50 60 70 80 90 100
Maize
Sorghum
Tef
Barley
Wheat
Maize
Sorghum
Tef
Barley
Wheat
Percent of children
Often (3-7)Seldom (1-2)None
Mamede
Luke
7 The lists do not include the enset products kocho, amicho and bulla, because it is assumed that these staple foods were given regularly.

57
Figure 16: Percent of children who received different types of legumes one or more days (grey) or not at all (white) during the 7 days prior to the survey.
13,1
2
7,7
5,6
5,6
0,7
5,3
8,4
10,5
7
81,6
97,2
100
100
83,9
93,9
87,4
97,9
0,7
1,4
0 10 20 30 40 50 60 70 80 90 100
Shimbra
Ater
Miser
Bakela
Shimbra
Ater
Miser
Bakela
Percent of children
Often (3-7)Seldom (1-2)None
Mamede
Luke
Figure 17: Percent of children who received different types of vegetable one or more days (grey) or not at all (white) during the 7 days prior to the survey.
0
0
0
0
73,6
1,4
0,7
78,3
0,7
0,7
0,7
0,7
5,3
5,6
92,8
99,3
99,3
99,3
99,3
21,1
97,9
100
100
95,8
100
16,1
1,3
0,7
3,5
5,9
0 10 20 30 40 50 60 70 80 90 100
Potato
Pumpkin
Red beet
Tomato
Carrot
Ethiop. kale
Potato
Pumpkin
Red beet
Tomato
Carrot
Ethiop. kale
Percent of children
Often (3-7)Seldom (1-2)None
Mamede
Luke

58
Figure 18: Percent of children who received different types of fruit one or more days (grey) or not at all (white) during the 7 days prior to the survey.
3,3
2,8
4,2
0,7
27,2
0,7
5,9
0,7
8,4
0
32,9
100
100
99,3
90,8
100
99,3
100
99,3
95,8
97,2
87,4
99,3
96,5
39,9
0,7
0,7
0,7
1,4
2,1
2,8
0 10 20 30 40 50 60 70 80 90 100
Wild fruits
Guava
Orange
Banana
Avocado
Papaya
Mango
Wild fruits
Guava
Orange
Banana
Avocado
Papaya
Mango
Percent of children
Often (3-7)Seldom (1-2)None
Mamede
Luke
Figure 19: Percent of children who received different animal products one or more days (grey) or not at all (white) during the 7 days prior to the survey.
1,3
0,7
2,7
7,2
6,5
9,1
3,5
4,3
7
4,3
16,4
21,1
5,3
26,1
11,2
7
15,5
4,9
94,1
96,1
80,9
71,7
88,2
64,8
85,3
88,7
77,5
90,8
4,6
3,3
0 10 20 30 40 50 60 70 80 90 100
Meat
Eggs
Butter
Cheese
Milk
Meat
Eggs
Butter
Cheese
Milk
Percent of children
Often (3-7)Seldom (1-2)None
Mamede
Luke
In Mamede, more than 50% of the children received one of the different grain types, kale and mangoes on one or more days during the previous seven days. In Luke, only kale was given to more than 50% of the children. Although kidney beans (adengwarrye) were not a listed extra in the food frequency questionnaire, they were mentioned to be given to 0.9% of the children in Mamede and 7.3% of the children in Luke during the previous week.

59
Ethiopian kale was the most important food in the diets of the children apart from the products of enset. The majority of children in both villages received it on an average of 6-7 days a week prior to the survey (Table 40). In Mamede, mangoes (60%), tef (36%), roasted chick peas (16%), barley (14%), butter (11%), milk (9%) were given to a much smaller number of children (percentage of children given in brackets) on about 3 to 4 days per week. In Luke the same was found for cheese (28%), roasted chick peas (18%), maize (13%) and milk (12%). The other food items were given on average 2 or less times per week to a limited number of children. Table 40: List of most foods given, the percentage of children who received them, and the number of days they received them on average during the week prior to the survey.
Foods MAMEDE LUKE % of children1 Av no of days2 % of children1 Av no of days2 Wheat 26 2 22 2 Barley 14 4 0 0 Tef 36 3 9 2 Maize 10 2 13 3 Miser 13 2 0 0 Shimbra 16 3 18 4 Ethiopian kale 84 6 79 6 Mango 60 3 0 0 Banana 13 2 9 2 Milk 9 3 12 4 Cheese 23 2 28 3 Butter 11 3 19 2 Eggs 15 2 4 1 Meat 35 2 6 2 1 Percent of children who received this type of food on several days during the last week prior to the interview. 2 Average number of days the children received this food type. Figure 20 shows the percent of children, divided into age groups (below 2 years, 2 years and 3-4 years old), who received different types of food on several days during the week prior to the survey. Wheat and barley in the form of porridge, milk and egg seemed to be more often prepared for very small children as a complementary food, whereas more children above 2 years received legumes, kale, cheese, butter and meat.

60
Figure 20: Percent of children, according to age, who received different types of food on several days during the week prior to the survey.
32,3
16,1 17,2
10,8
21,5
57
37,6
19,4
11,8 10,812,9
8,6
24,1
2,4
31,3
8,4
43,4
91,6
44,6
4,8
37,3
20,5
9,6
26,8
12,2
1
16,3 15,3
33,7
94,9
27,6
8,2
29,6
16,3
6,1
22,4
0
10
20
30
40
50
60
70
80
90
100
Wheat
Barley Tef
Maize
Legu
mes
Ethiop
.kale
Fruit
Milk
Chees
eButt
er EggMea
t
< 2 years2 years3+4 years

61
4.8 Infant and child feeding practices among the index children
4.8.1 Initiation of breast-feeding and pre-lacteal feeding
The following table and graphics show how many children received colostrum within the first 24h after birth and pre-lacteal feeding, the types of pre-lacteal foods / fluids, and the time when the mother first started to breast-feed the new-born child. Table 41: Information about pre-lacteal feeding, initiation of breast-feeding and the use of colostrum within the first 24h after birth.
All Villages MAMEDE LUKE Use of pre-lacteal food/fluids (n=295/143/152)
Yes [%] 19 20.3 17.8 No [%] 80,7 79.0 82.2 Don’t know [%] 0,3 0.7 0 Type of pre-lacteal food/fluids (n=57/31/26)
Plain water [%] 70,2 32,3 96.2 Water with sugar [%] 5,3 9,7 0 Butter [%] 17,5 48,4 0 Other [%] 5,3 6,5 3.8 Don’t know [%] 1,8 3,2 0 Initiation of breast-feeding (n=294/143/151)
Immediately after birth (< 1 h) [%] 69.7 60.1 78.8 During the first 24 h [%] 27.9 36.4 19.9 1 to 3 days after birth [%] 0.7 1.4 0 More than 3 days after birth [%] 1.0 0.7 1.3 Did not breast-feed at al [%] 0.3 0.7 0 Don't know [%] 0.3 0.7 0 Colostrum given (n=283/140) Yes [%] 54.6 46.4 67.1 No [%] 41.0 52.9 32.9 Don’t know [%] 0,4 0.7 0 The percentage of women who discharged colostrum directly after birht or gave pre-lacteal foods/fluids was higher in Mamede than in Luke. Water and sugar were the pre-lacteal foods/fluids mainly used. Most of the women either started to breast-feed during the first hour, or within the first 24 h after the birth.

62
Figure 21: Percentage of women who offered pre-lacteal feeding.
No
Yes
Mamede
Luke
82,8
18,8
79
20,3
0
10
20
30
40
50
60
70
80
90
100
Perc
ent o
f wom
en
Pre-lacteal feeding
Figure 22: Percentage of women who offered colostrum within the first 24h after birth.
Yes
No
Mamede
Luke
67,1
32,946,4 52,9
0
10
20
30
40
50
60
70
80
90
100
Perc
ent o
f wom
en
Offering colostrum

63
Figure 23: Percentage of women who initiated breast-feeding at different stages after birth.
Imm
edia
tely
Durin
g fir
st 2
4 h
1 to
3 d
ays
late
r
> 3
days
late
r
Did
not b
reas
t-f.
Mamede
Luke
78,8
19,9
01,3
0
60,1
36,4
1,40,7
0,7
0
10
20
30
40
50
60
70
80
90
100
Perc
ent
The women who reported immediately starting to breast-feed after the birth were more likely to give colostrum, and not pre-lacteal feeding. This difference was significant. Women who fed their infants colostrum were less inclined to offer pre-lacteal feeding; whereas those who did not give their infants colostrum were more inclined to offer pre-lacteal feeding. However these differences were not significant.
4.8.2 Duration of exclusive breast-feeding and age for termination of breast-feeding of the index children
As shown in Table 42, the average duration of exclusive breast-feeding (including women who did not offer colostrum) was significantly higher in Luke than in Mamede, whereas the average duration of the entire time of breast-feeding was the same in both villages. Table 42: Average duration of exclusive breast-feeding, and age for termination of breast-feeding of the index children (in months).
Total Villages MAMEDE LUKE Duration of exclusive breast-feeding (n=293/142/151)
4.3 ± 2.7 3.8 ± 2.3 4.7 ± 3.1
Average age for termination of breast-feeding (n=155/71/85)
25 ± 9 25 ± 9 25 ± 9
On average, 47% of the index children were breast-fed as well as receiving complementary foods at the time of interview, 50% in Mamede and 45% in Luke, respectively. None of the index children was exclusively breast-fed any more at the time of the survey.
4.8.3 Complementary feeding
The first foods and fluids given to the children after the time of exclusive breast-feeding can be seen in Figure 24. Most mothers started with tea and water. Complementary foods especially

64
prepared for young children were mainly thin porridge prepared from bulla, barley or sorghum, diluted or pure cow’s milk, butter and other foods such as whey, white bread, potatoes, egg or beso. Fruits, as well as commercial complementary food, seemed to be given more frequently in Mamede. Figure 24: Types of complementary food offered to young children.
Tea/
wate
rTh
in p
orrid
geDi
lute
d co
w m
ilkUn
dilu
ted
cow
milk
Butte
r
Frui
ts
Com
mer
cial
f.
Othe
r
Fam
ily fo
od
Mamede
Luke
81
29,5
23,822,4
34
6,1
1,4
25,2
0,7
82,3
48,9
34
25,5
19,9 22,7
5
48,2
0,7
0
10
20
30
40
50
60
70
80
90
100
Perc
ent
In both villages, on average, the mothers changed from complementary food to family food at 13,5 months (Table 43). At this time the child had adapted to accepting the family types of food, especially kocho. Table 43: Average time when complementary food was replaced by family food.
MAMEDE (n=142) LUKE (n=149) Average ± SD 13,5 ± 7,5 13,5 ± 7,5 Range 0 – 36 0 – 36
4.8.4 Bottle-feeding8
Twice as many mothers in Mamede (40%) as compared to Luke (20%) responded that they used a bottle to feed their child for a certain period of time (Table 44). This does not mean that the child received commercial breast-milk substitutes. Table 44: Percentage of mothers who used a bottle to feed the child.
Introduction of the bottle MAMEDE LUKE No 60,1 78,9 Yes 39,9 19,7 8 The term bottle-feeding, as used in this survey, does not necessarily mean that a breast-milk substitute is given but that a bottle is used to feed the infant any type of beverages (e.g. tea, water, cow’s milk).

65
4.9 Eating habits of the mother during the postnatal period It is common that women are allowed to rest with their new-born child for a certain period of time. Family members, neighbours and relatives take special care of the mother by providing extra prepared food for the mother, and taking over her responsibilities, such as collecting water, and other household and field activities. 96% of the women in both villages enjoyed this privilege of special care after delivery. As shown in Table 45, the period during which this special food was given lasted, on average, for about 4-5 weeks in both villages. The mothers most probably received such food on individual, special days within those weeks. The actual lying-in period lasted for nearly twice as long, and was about the same length in both villages (7.0 and 7.7 weeks, respectively). Table 45: Duration of time when the mother receives special food after delivery, and length of lying-in period.
MAMEDE LUKE Time period when mother received special food (n=140/152)
Average ± SD [weeks] 4,5 ± 2,3 4,8 ± 2,5 Range [weeks] 0 – 8 0 – 12 Average duration of lying-in period (n=139/151) Average ± SD [weeks] 7,0 ± 1,7 7,7 ± 1,8 Range [weeks] 0 – 12 0 – 16 The special types of food offered to the women during this period are shown in Figure 25. Most of the women received porridge prepared from bulla, and animal products like cheese, butter and meat. The main type of vegetable offered was Ethiopian kale. Fruits were rarely consumed after delivery, especially in Luke. The category “other food types” included mainly eggs, honey, lentils and injera.
Porri
dge
Chee
se
Butte
r
Mea
t
Ethi
op. K
ale
Frui
ts
Soup
Othe
r
No s
pec.
food
Mamede
Luke
92,1
84,290,8
84,2
54,6
1,3 1,3
10,5
3,9
92,9 92,287,9 89,4
50,4
11,39,9
40,4
2,1
0
10
20
30
40
50
60
70
80
90
100
Perc
ent
Figure 25: Special food which is prepared for the women after delivery.

66
5 Results relating to all of the children (below 5 years)
5.1 Anthropometry
5.1.1 WFA, HFA and WFH of all the children measured
An overview of anthropometric data, expressed as average z-score and percentage of the index children whose z-scores were below –2SD, relating to all the children (below 5 years), and according to village and sex, is presented in Table 46 and Table 47. Table 46: Average z-scores for WFH, HFA, WFA for the total number of children and according to village, sex, and age.
WFH z-score HFA z-score WFA z-score Total (n=575/552/588)* -1.1 ± 0,9 -2,2 ± 1,4 -2,2 ± 1,1 Villages MAMEDE (n=190/183/192) -1.3 ± 0,9 -2,7 ± 1,4 -2,6 ± 1,1 LUKE (n=385/369/396) -1,0 ± 0,9 -2,0 ± 1,4 -2,0 ± 1,1 Sex Male (n=294/281/301) -1.2 ± 0,9 -2,3 ± 1,4 -2,2 ± 1,1 Female (n=281/271/287) -1.1 ± 0,9 -2,2 ± 1,4 -2,1 ± 1,2 Age [months] 1 to 7 (n=27/27/54) -0,9 ± 1,0 -1,2 ± 0,9 -1,4 ± 1,2 8 to 11 (n=55/55/83) -1,0 ± 1,1 -1,9 ± 1,4 -2,2 ± 1,4 12 to 23 (n=109/110/114) -1,5 ± 0,9 -2,2 ± 1,5 -2,4 ± 1,1 24 to 35 (n=130/130/130) -1,3 ± 0,9 -2,3 ± 1,4 -2,4 ± 1,1 36 to 47 (n=135/135/137) -0,9 ± 0,8 -2,2 ± 1,4 -2,0 ± 1,1 48 to 59 (n=122/122/124) -1,0 ± 0,9 -2,6 ± 1,4 -2,2 ± 1,0 = 60 (n=34/34/35) -1,1 ± 0,5 -2,5 ± 1,2 -2,2 ± 0,7 * Explanation of how to read the numbers: 575 children were able to be included in the calculation of the average WFH z-score, 552 for the average HFA z-score and 588 for the WFA z-score. Table 47: Percentage of children with z-scores below –2SD for WFH, HFA, WFA for the total number of index children and according to village, sex, and age.
All data in % Wasting (WFH) Stunting (HFA) Underweight (WFA)
Total (n=575/552/588)* 17,7 58,0 56,8 Villages MAMEDE (n=190/183/192) 22,1 71,0 72,9 LUKE (n=385/369/396) 15,6 51,5 49,0 Sex Male (n=294/281/301) 19,7 61,2 59,5 Female (n=281/271/287) 15,7 54,6 54,0 Age [months] 1 to 7 (n=27/27/54) 14.8 14.8 29,9 8 to 11 (n=55/55/83) 17,9 39,3 51,7 12 to 23 (n=109/110/114) 29,4 60,9 64,0 24 to 35 (n=130/130/130) 20,0 58,5 61,5 36 to 47 (n=135/135/137) 12,6 59,3 51,8 48 to 59 (n=122/122/124) 11,5 67,2 63,7 = 60 (n=34/34/35) 0 67,6 60,0 * Explanation of how to read the numbers: out of 575 children 20.1% were wasted, out of 552 children 63.7 were stunted and out of 588 children 566.5% were underweight.

67
The data show a difference between the two villages Mamede and Luke. The children from Mamede appeared worse off for all three indicators than the children from Luke. The girls seemed to be better off than the boys according to all anthropometric indicators. The younger children between 1 and 2 years of age were more at risk of acute malnutrition (wasting), whereas the extent of chronic malnutrition (stunting) increased with age and was more frequently observed among older children (3, 4 or above 5 years). Children below 8 months seemed to be less affected by malnutrition so far.
5.1.2 Severely malnourished children
The following table shows the percentage of children with z-scores below –3 SD for WFH. Of all the children below 5 years, 1.9% had a z-scores below –3 SD for WFH. Table 48: Percentage of children with z-scores below –3 SD and -3 = SD-score < -2 SD for WFH.
WFH [%] SD score < -3 SD -3 = SD-score < -2 SD Total (n=575) 1.9 (n=11) 15.8 Villages MAMEDE (n=190) 3.7 (n=7) 18.4 LUKE (n=385) 1.0 (n=4) 14.5 Sex Male (n=294) 3.1 (n=9) 16.7 Female (n=281) 0.7 (n=2) 14.9 Age [months] 1 to 11 (n=55) 3.6 (n=2) 12.7 12 to 23 (n=109) 6.6 (n=5) 24.8 24 to 35 (n=130) 1.5 (n=2) 18.5 36 to 47 (n=135) 0 (n=0) 12.6 48 to 59 (n=122) 0.8 (n=1) 10.7 Table 49 shows the number of children observed to be suffering from kwashiorkor. Table 49: Percentage of observed kwashiorkor among the children.
Total (n=653) Villages MAMEDE (n=211) LUKE (n=441) Kwashiorkor [%] 1,4 (n=8) 1,9 (n=4) 1,1 (n=4) The following table shows the percentage of children with z-scores below –3 SD for WFA and HFA. Table 50: Percentage of children with z-scores below –3 SD and -3 = SD-score < -2 SD for WFA and HFA.
SD score < -3 SD -3 = SD-score < -2 SD WFA [%] (n=588) 24 (n=143) 33 HFA [%] (n=586) 31 (n=180) 28
5.1.3 BMI, weight and height of the non-pregnant mothers interviewed
The average body mass index (BMI), weight and height of the non-pregnant mothers interviewed, according to the villages, is summarised in Table 28. The BMI of the mothers, as compared between the two villages, reflected the same trend as was revealed by the anthropometric data of the children. The average BMI of the women in Mamede was slightly below the WHO cut-off-point

68
(< 18.5), whereas it was above in Luke. The women in Luke were, on average, slightly heavier and slightly taller than in Mamede. But these differences were not significant. Table 51: Average BMI, weight and height of the non-pregnant women interviewed: total and according to village.
Total (n=334) MAMEDE (n=114) LUKE (n=220) AV ± SD Range AV ± SD Range AV ± SD Range BMI [kg/m2] 18.7 ± 1.7 13.0 – 24.5 18.4 ± 1.8 13.0 – 24.5 18.8 ± 1.6 13.5 – 23.8Weight [kg] 46.0 ± 5,3 33 – 68 45.0 ± 5.6 33 – 68 46.5 ± 5.0 33 – 57 Height [cm] 156.9 ± 6.0 141 – 173 156.1 ± 6.3 141 - 170 157.3 ± 5.8 141 – 173 Nearly half of the women had a BMI below 18.5. The percent of moderately and severely malnourished women was about the same in both villages, whereas the proportion of mildly malnourished women was much in Mamede than in Luke. Table 52: Percent of malnourished women.
Total (n=334) Villages PERCENT [%] WITH BMI [kg/m2] MAMEDE (n=114) LUKE (n=220) 18.5–24.5 53.0 44.7 57.3 < 18.5 (underweight) 47.0 55.3 42.7 DIFFERENT CATEGORIES OF UNDERWEIGHT
17.0–18.4 (mildly underweight) 32.3 39.5 28.6 16.0–16,9 (moderately underweight) 8.7 8.8 8.6 < 16.0 (severely underweight) 6.0 7.0 5.5
5.2 Health status (point prevalence) of all the children (below 5 years) The most common diseases amongst children, which were observed by medical personnel and reported by the parents on the day of medical check-up, are listed in Table 53. Table 53: Visible and reported diseases of the children, noted on the day of the health check.
Diseases Total (n=653) Villages MAMEDE (n=211) LUKE (n=441) VISIBLE DISEASES Respiratory infections [%] 2,0 5,7 0,2 Ear infection [%] 2,1 2,4 2,0 Eye infection [%] 8,4 7,1 9,0 Scabies [%] 10,1 12,3 9,0 Burn, wound [%] 2,1 5,7 0,5 REPORTED DISEASES Worms [%] 13,9 3,8 18,8 Diarrhoea [%] 2,9 7,1 0,9 Vomiting [%] 0.3 1.0 0.7 Fever [%] 1.6 0.5 2.2

69
5.3 Duration of exclusive breast-feeding9 and age for termination of breast-feeding As seen in Table 54, the average duration of exclusive breast-feeding was slightly higher in Luke than in Mamede, whereas the average duration of the entire time of breast-feeding was about the same. Table 54: Average duration of exclusive breast-feeding and entire breast-feeding of the index children (in months).
Total Villages Duration of breast-feeding [months] MAMEDE LUKE Exclusive breast-feeding (402/190/151)
4.1 ± 2.5 3.6 ± 2.2 4.5 ± 2.7
Entire breast-feeding (n=236/111/85) 24 ± 8 25 ± 9 24 ± 8 3.4% (14 out of 416) of the children were exclusively breast-fed, and 43,5% of the children were breast-fed overall (182 out of 418), 44% in Mamede and 43% in Luke, during the time of the survey. The following figures show the percentage of children who were exclusively breast-fed at a certain age (Figure 26), and the age for termination of breast-feeding (Figure 27). The figures include all the children who were not exclusively breast-fed or ceased to be breast-fed during the period of the survey. Figure 26: Duration of exclusive breast-feeding [in months].
0
10
20
30
40
50
60
70
80
90
100
0 1 2 3 4 5 6 7 8 9 10 11 12 13 14 15Months
Perc
ent o
f chi
ldre
n be
ing
brea
st fe
d
MamedeLuke
9 Exclusive breast-feeding in this survey means that the child receives no other food or fluids (water, tea) besides breast milk, excluding medicine or vitamin drops. If mothers discharged the first milk after birth, or gave pre-lacteal feeding, but afterwards continued to give only breast milk, this was also counted as exclusive breast-feeding.

70
Figure 27: Age for termination of breast-feeding compared to the age when complementary food was introduced [in months].
0
10
20
30
40
50
60
70
80
90
100
0 2 4 6 8 10 12 14 16 18 20 22 24 26 28 30 32 34 36 38 40Months
Perc
ent o
f chi
ldre
n
Total duration of breast feeding, Mamede Total duration of breast feeding, LukeAge of introducing complementary feeding, Mamede Age of introducing complementary feeding, Luke
71
6 Discussion
The first graphic in the introduction (Figure 1) includes the care-giving behaviours in respect of both mother and child, as underlying factors of a child’s nutritional status. According to WHO (WHO/NUT 1998) “care” refers to all of the behaviours performed by caregivers that result in improved food and nutrient intake, health, and the cognitive and psycho-social development of the child. These behaviours can be grouped into some major categories:
• Care for women, such as providing increased food intake during pregnancy and lactation • Breast-feeding and complementary food practices • Food preparation and food storage behaviours • Hygiene practices • Home health practices, including diagnosis of illness and health-seeking behaviours • Psycho-social stimulation of children and support for their development
Most of these factors are relevant to this study and, therefore, are discussed in the following chapters.
6.1 Household characteristics Mother’s education and care Certain factors from the family environment, e.g., number of small children, education and occupation of the parents, are discussed as potential risk factors in the development of malnutrition as well as diseases. The following table compares the education level of the parents, and the number of young children in this survey, with the second National Rural Nutritional Survey (CSA, 1993). Table 55: Parents’ education level and number of children below 5 years in Mamede and Luke (Gurage rural area), compared to country average (CSA, 1993).
Ethiopia (1993) Gurage rural area (2000)
Percentage of mothers with no formal education 91.9% 82% Percentage of mothers with three or more children under five years
7.7% 4.4%
Percentage of fathers with no formal education 64.1% 47% Overall, the education of the parents in the two villages Mamede and Luke (Gurage rural area) points to a more favourable situation in these two villages compared to the level in the country as a whole. Smith et al (2000) estimated that women’s education contributed 43% to the underlying-determinant variables in reducing child malnutrition between the years 1970-95. Khin-Maung et al (1994) and El Samani et al (1989) both state that a low educational level in a mother was associated with an increased risk in a child of suffering from diarrhoea. Therefore a higher educational level in mothers, especially improved knowledge about health and nutrition aspects, is often included as a target in village development programmes. The number of children per family below 5 years seemed to be lower in the two villages than in the country as a whole. If a woman has to take care of three or more children (below 5 years), the children between 1-3 years are often most at risk of malnutrition, because the total breast-feeding time might have been reduced, due to the mother’s new pregnancy. In such situations, the high energy and nutrient-dense breast-milk is often replaced by low density complementary food. In addition, the attention the mother offers to the child through breast-feeding is suddenly reduced.

72
The mother might concentrate more on the new-born child, while the second youngest child is still too young to take care of itself.
6.2 Economic characteristics Income-generating activities The main occupation and income source of the parents, in general, was the cultivation of their home gardens for their own consumption and for sale. The responsibility for earning money is divided among men and women, as already described in chapter one. Therefore, there is a need for both the mothers and fathers to carry out some kind of additional activity to earn money. Most families, even the poorest, are also members of co-operatives like “eder”. For this they contribute a small amount of money every month. The answers to the questionnaire do not adequately reflect what kind of income-producing activities the parents conduct, especially in Luke (see Table 20, Figure 7), where more than half of the mothers responded that either they or their husband had not earned money during the past 3 months. Possible reasons for that could be the illness of the father or the mother, the mother’s recent delivery, or the concealment of their income-producing activities, hoping to profit from the project if their economic situation seems to be poor. On questioning the families of the malnourished children in Luke it was found, after asking a second or third time, that many of these women did handcraft work, such as making ropes for others, or worked as daily labourers in co-operatives, like debo, or in the gardens or households of other, richer people; the same for the men, most of whom worked as daily labourers, or had done so previously. The later interviews also made it obvious that there were some underlying problems, so that not enough money could be earned for the family needs. Some of the fathers had a persistent health problem which made it impossible for them to work full-time for the family and in the family’s home garden. In other families the father had already died, or had married a second woman. Another problem was the frequent consumption of chat, which obviously reduced the men’s interest in taking care of the family and the home garden. In these cases the income responsibilities and the work in the home gardens increased the burden on the mothers. Most of the money earned by the parents was on a daily basis and not based on a regularly, monthly salary. This might be an important insecurity factor for the families, especially in times when food in their home gardens is scarce. Agricultural production Although the families mainly depended on their own agricultural production, vegetables other than Ethiopian kale, maize and legumes (kidney beans or chick peas) were rarely grown. Vegetables such as tubers, tomatoes, carrots, or red beet were found in the markets in this area, but were only found in a small number of households (see Figure 9). A few households in Luke grew pumpkin. The growing of a variety of fruits was also limited. 34% of the households did not grow any fruit at all, 16% in Mamede and 53% in Luke. In Mamede the fruit mainly grown was mango (76% of the households), which was nearly absent in Luke (2%). Mangoes are an important contributor to vitamin A and C intake. However, if fruits were grown, it seemed that they were rather seen as a source of cash income which could be sold in the market, than as nutritious food of high value for the family’s diet. This is also reflected in the 24 h-recalls and the food frequency questionnaire, where fruits were rarely consumed, especially in Luke. Most of the families, especially the poor, mainly depend on their own food production. The low variety of vegetables and fruits, and limited availability of legumes, combined with the scarcity of animal products, leads to a monotonous diet.

73
Animals and animal products The number of animals owned (mainly cattle) demonstrates the wealth and property status of the families. The data in the two tables on the possession of animals and availability of animal products (see Table 23 and Table 24) have to be interpreted with caution. In the open-ended interviews conducted later, it seemed that the mothers did not always give an accurate number for livestock, but a rather lower number. In comparing the households reported as owing chickens, with those in which eggs were reported to be available, it seems that most of the chickens found in the two villages do not lay eggs! This has to be a matter of some doubt. However the prevalence of trypanosomiasis among cattle has become an increasing problem in the past years. The sleeping sickness leads to an increased number of deaths among the cattle, to reduced animal draught power (oxen), which is necessary to plough land, and to a reduction in the fertility rate and milk production of cows. The reduction of cattle also influences the cultivation of enset as cattle dung is needed as fertiliser. It was reported that the people of Luke were wealthier in former times, compared to Mamede, before this sleeping sickness amongst the cattle became an animal health problem, because their main economic supports were, and are, enset and cattle.
6.3 Social characteristics Women in this society have a lot of tasks and heavy work to conduct within the family. One important component, the daily collection of water (Figure 10), was included in the questionnaire. Another important women’s activity was going to the market to sell home-produced goods or to trade with products bought from neighbours, etc. Women who are out of the house for half a day, or from morning to evening, have to leave their young children in the care of older children, neighbours or relatives, who might not provide optimal care. This is an important aspect in terms of childcare. Another important cause of a child’s malnutrition was if the mother was not main carer of the child. The grandparents were often too old to be aware of the child’s needs, or the other carers did not properly care for the child, because it was not their own.
6.4 Anthropometric results Anthropometry provides an important indicator of children’s and women’s nutritional status. The results relating to children below 5 years (see Table 47 and Table 48) in comparison with the preliminary results of a recent national survey in Ethiopia are given in Table 56. Table 56: Anthropometric data of the children in this survey and in rural areas on country-wide level (CSA, 2000).
Rural areas in Ethiopia (2000)
Gurage rural area (2000)
Weight for Age [WFA] < –2SD 48.6 56.8 Height for Age [HFA] < –2SD 52.3 58.0 Weight for Height [WFH] < –2SD 11.3 17.7 Weight for Height [WFH] < –3SD (severely wasted)
1.5 1.9
For all nutritional indices the data of this survey demonstrated a higher percentage of malnourished children. Considering WFH, the proportion of children who were moderately wasted was higher than on a national level, but the percentage of extremely wasted children was about the same. In emergency situations, the present anthropometric data in the study area would be considered as

74
critical, especially in Mamede, where the situation seemed to be worse than in Luke (Table 46 and Table 47). The data reflects the pre-harvest season, a time with an increased food deficit, which especially influences the under 5 year old children. A survey conducted among subsistence farmers in an enset growing area (Sidamo area) measured the anthropometric situation of children and adults throughout the year (Branca et al, 1993). The authors found a small, but not significant difference in the average WFH z-score between the pre- and post-harvest season. The largest loss for WFH was found in the group of poor children which had a higher WHF than average in the initial phase. However, there was a continuous downward trend in the mean z-score of HFA over the 13 months of the study period. Poor children who already had a low WFH had the lowest height velocity of all groups. These children did not grow at all within 6 months, whereas the other children gained some height during the same period. These results would underline the findings partly observed among twins in this survey. One girl twin pair, e.g., had a WFH of –1.5 and –1.7, HFA of –2.4 and –4.2, WFA –2.5 and –3.5, respectively. Considering WFH the second twin child would be considered slightly, but not seriously worse than the first, whereas the WFA and especially HFA indices showed big differences (the twins were four and a half years old; one was about 800 g lighter and nearly 8 cm shorter). The authors of the Sidamo survey concluded that poor children whose WFH was already low did not further become wasted, but stunted, eventually regaining the body proportions, but on a lower level of HFA. A z-score below –3SD for WFH seems to select only the very severely undernourished children and might be not an appropriate indicator for very stunted children, who have the height of a much smaller child, but should have different body proportions. The problem of stunting among children increased with the age, which might indicate continuous food and health problems of the past years leading to a continuous deterioration in HFA. In contrast, wasting preferably affected the one and 2 year old children.
A survey conducted in the same area as the present survey (EHNRI, 1997/98) found a prevalence for undernutrition (WFA) of 62.3% among the women (BMI < 18.5), which was higher than in the present survey (47%). The average BMI differed between the pre- and post-harvest season markedly (17.4 and 17.7, respectively). According to the rural survey, conducted in Sidamo area, the women had the highest weight during the month of December (end of the post-harvest season) and a minimum, with 1.3 kg lower, in June (end of the pre-harvest season).
6.5 Health aspects Health status of the children The UNICEF model in the introduction (Figure 1) shows that health and nutritional status are closely linked. Diseases are one of the immediate causes of malnutrition. In all developing countries, the reduction of malnutrition among children between 1970-95 was partly achieved (19%) through an improvement of the health environment (Smith et al, 2000). According to the National Rural Nutritional Survey (CSA, 1993) the most common illnesses among children below 5 years in the previous 2 weeks were diarrhoea, fever, cough, vomiting and other illnesses. In this study, during a point prevalence assessment of childhood diseases, scabies and self-reported worm infections (without stool examination) ranked highest with about 10%, followed by eye infections (mainly trachoma 8%, Table 53). The data would have been different, too, if the previous 14 days had been considered. Therefore diseases ranked highest which last for a long period if untreated, such as scabies, worms and eye infections. They are easily transferred among the family members. Diseases like respiratory infections, diarrhoea and burns/wounds were more

75
often observed in Mamede than in Luke. Malaria was not yet a major problem during the survey period. Scabies, worm infestations and trachoma are all related to hygiene behaviour. Trachoma was also seen in many older people, who started to become blind if an operation was not done in time. It could easily be avoided through proper hygiene (washing the face) which is also related to the availability of clean water, especially during the dry season. To reduce the infestation of worms, proper toilet facilities (which were introduced by ICIPE to a few farmers in Mamede, but not in Luke yet) and the use of shoes (to prevent hookworms) would be necessary. Further, the mother’s awareness of how to prevent these diseases is very important; it should become an education topic in the nearby health posts and clinics. It was interesting to observe that some of the malnourished children who were around 2 years old were not able to stand without help nor to walk. Examination of pregnant women in a health institution Confidence in health institutions as well as regular health education are an important factor for changes in the village health situation. One of the outcomes can be seen in the number of women using the health facilities for examination during pregnancy. In Mamede, 74% of the mothers responded that they had visited a health institution during pregnancy, and 64% in Luke.
6.6 Food intake
6.6.1 Food consumption patterns
The food frequency questionnaire shows some of the feeding patterns of, and food types given to, the small children the week prior to the survey (Chapter 4.7). This method, as well as the 24-h recall, is strongly limited to the present seasonal availability of products in the home gardens, and most probably it reflects the most difficult time of the year, when stocks are low, and the next harvest season is not reached yet. Overall, the food frequency questionnaire shows a low variety of different food types given to the children. The only food besides the products of enset which was given to most of the children almost every day was Ethiopian kale. Vegetables other than Ethiopian kale were very rarely mentioned and rarely grown. A similar trend was observed in respect of fruits. Fruits seemed to have little value in Luke (cultivation and consumption), although all the listed fruits were available in the markets in the area during the survey period. In Mamede, mango was the main fruit given to the children, reflecting its current harvest time. Other fruits, like banana, were also rarely given in Mamede. Potatoes or other tubers apart from amicho, as well as wild fruits, could make a contribution to the variety of food, but were neglected, or low in quantity, in the children’s diets. Milk products are rarely available on a regular basis for individual families. Cows only give milk during the times when they feed a calf. Milk products like cheese and butter are available in the markets at all times of the year. Milk was mainly given to very small children as a complementary food, before they start to receive family food. The frequency of giving eggs and meat to children was also very low.
Foods which are mainly bought in the market were more frequently given to children in Mamede. Mamede children received wheat, barley and tef twice as often, and legumes bought in the market more often, than in Luke. This may be explained by the fact that the inhabitants of Mamede live closer to the town, and that in some cases more money might be available with which to buy such foods at this time of year. Foods which were found in the home gardens, such as maize, chick peas

76
(shimbra) and kidney beans (adengwarrye), were mentioned slightly more often in Luke. Another explanation might be that the survey was conducted first in Mamede, and then in Luke, and the first harvest had just started during the study period; therefore these foods were already being consumed by a few families in Luke.
6.6.2 Food intake the previous day
Energy intake The energy intake was low for both women and non breast-fed children (Table 33 and Table 38). On average, the children reached from 60% to 72% of their recommended intake, depending on the age of the child. Energy intake did not proportionally increase with age. All the women, on average, had an energy intake which was too low (67% for women neither pregnant nor lactating, 67% for pregnant women and 56% for lactating women). Although energy intake was slightly higher among lactating women, the increase was not enough to cover the additional energy needed for breast-feeding. The energy deficit mainly resulted from a too low fat intake, and was connected to the number of meals, which was reported to be as little as two, or even less, per day for some women and children (see Figure 13). These women often did not reach their required energy need, whereas women who had three and more meals, and additional snacks in between, reached a sufficient energy intake. The low energy density of the food (mainly consisting of kale and kocho) and a low intake of fat increased this problem. For children this can be a major problem because their stomach capacity is limited (200 ml per meal). Low energy-dense but bulky food can satisfy them very quickly without providing the necessary energy and micro-nutrient intake. This applies to porridge (containing water and cereals or bulla), which is given as a complementary food in the study area, if it is not enriched with high energy-dense food components, such as butter, vegetable oil or oil seeds, or avocado. The low increasing energy intake with age among the children might also result from the fact that mothers might be out of the house for part of the time, and might not know what kind of food, and how often, was given to the children by other carers or was taken by the children themselves. However as food intake is an underlying factor in malnutrition (see Figure 1), this chronic energy imbalance might be reflected in the increasing rate of chronic malnutrition (stunting) among older children as compared to the younger children, as well as in the high number of women who were underweight (BMI < 18.5 of the not-regnant women), which was 47%. Carbohydrate intake Carbohydrates were the major source of energy in both mothers’ and children’s diets. For the non breast-fed children, as well as for the mothers, the actual carbohydrate intake was satisfactory (Table 33, Table 38). Carbohydrates contributed about 77% to the total energy intake of the children. For the women the percentage of carbohydrates was even higher (81%); this is above the recommended range of 55-75%. The same was true for the nutrient density of carbohydrates in the diets (Table 30, Table 31,Table 35, Table 36). The density of dietary fibre was also high. King & Burgess (1998) give a recommendation of 30 g per adult person per day. The women, on average, reached about this level. A high proportion of fibre in the diet is positive and important for the digestion and the functioning of the intestine. But if a diet is high in special types of fibre it may also reduce the absorption of iron and other minerals. The phytates, e.g., in maize, beans, whole wheat flour or sorghum, can inhibit the uptake and utilisation of calcium, iron and zinc in the food, if they are excessively consumed (FAO/WHO, 1996).

77
The intake of mono- and oligo-saccharides was nearly negligible (on average 1g per day). Sweets or biscuits were not common. Sugar was used in tea, but rarely in coffee. Tea was not very often consumed. Protein intake As regards the contribution that the nutrient density and proportion of protein makes to the total energy intake, the children and women were borderline to, or within, the recommended range (Table 30, Table 31,Table 35, Table 36). These recommended ranges are not applicable to pregnant and lactating women, because they have increased requirements (see chapter 1.1.6). The actual protein intake was far below the recommended protein intake for the children as well as for the mothers (Table 33, Table 38). Most of the protein was of plant origin. A small contribution of protein of animal origin from time to time is considered as a positive contribution for human nutrition, because this protein has a higher bioavailability and a higher amino acid score in the essential amino acids which are needed by the human body. Besides this, foods of animal origin contribute to the vitamin A, iron, folic acid and vitamin B12 intake. Plant protein, if mainly consumed in a very monotonous diet, can lack some essential proteins. Additionally, kocho is known to be very low in protein and to lack the essential amino acids methionine and isoleucine (Besrat et al, 1979). Therefore the diet needs to be combined with protein-rich food of high protein value. An important contribution could come from legumes and maize, especially when animal foods are scarce. Nuts such as peanuts, or seeds such as sunflower seeds or linseeds, could also positively contribute to the diet in this respect, and at the same time would increase the energy and fat intake. Fat intake The fat intake in the diets was very low and far below the requirements for the nutrient density (Table 31, Table 36), percent of total energy derived from fat (Table 30, Table 35), and actual nutrient intake (Table 33, Table 38). The percent of energy derived from fat was highest amongst children below 2 years (20%), but far below the recommendation for this age group. Considering that breast milk provides between 50-60% energy in the form of fat, care needs to be taken to prevent dietary fat intake from falling too rapidly, or below the required levels, during the weaning period. Therefore it is recommended that during complementary feeding the fat component should provide 30-40% of the energy intake, and similar levels of essential fatty acids as are found in breast milk from appropriate foods, until at least two years of age (FAO/WHO, 1994). Coletta and Baartholmey (1994) clearly state that babies need fat not only for concentrated food energy as a source of growth, but also for normal development of the brain and nervous system. The fat contribution to energy intake in the diets of the older children drastically decreased to 13% and 7% in Mamede and Luke, respectively. This was probably during the period when the children mainly received family food, and no special children’s food was prepared which contained cow’s milk. The low fat intake might be one important nutritional factor which influences the high prevalence of malnutrition among children. The children who were still breast-fed at the time of the survey had an additional good source of fat through the breast milk, and a higher nutrient density than the one calculated from food protocols alone. It is recommended that women of reproductive age obtain at least 20% of their energy from fat consumption. Only about half, or even less, of this was achieved by the women in Mamede (11%) and Luke (7%). Even pregnant or lactating women did not have a higher fat intake, although this would have been preferable in order to achieve their additional energy needs. It is almost inevitable that pregnant women should have a decreased fat, as well as protein and micro-nutrient intake, because tradition restricts them from drinking milk, or eating butter, cheese, meat or eggs, in order to avoid the birth complications which might result from big babies.

78
It also has to be considered that dietary fat is the source of essential amino acids, and that a certain amount of fat (considered in the recommendations) needs to be consumed to guarantee the necessary intake of essential amino acids. Further, fat is important for the absorption of the fat-soluble vitamins A, D, E and K, as well as the carotinoids such as provitamin A from plant sources. Energy and macro-nutrient intake of the mothers in comparison with a survey conducted in Sidama A longitudinal study followed up the dietary intake of women for one year in a village in Southern Ethiopia, where enset is also the main staple food (Taffesse et al, 1999). The results of the food protocols in the months June/July from that area, compared with this survey, are demonstrated in Table 57. Table 57: Energy and macro-nutrient intake, as well as energy distribution among macro-nutrients, in two regions where enset is the staple food.
Sidama area (June/July 1986)
Gurage rural area (June/July 2000)
Energy intake [kcal] 1694 ± 543 1320 ± 503 Protein intake [g] 29.5 ± 10.7 32 ± 13 Fat intake [g] 15.0 ± 9.5 15 ± 16 Carbohydrates intake [g] 335 ± 106 264 ± 100 Energy percentage for protein [%] 6 ± 2 10 ± 3 Energy percentage for fat [%] 7 ± 5 9 ± 7 Energy percentage for carbohydrates [%] 87 ± 6 81 ± 7 The total energy intake, reported in the Sidama area during the months of June and July, was similar to the average available energy intake supply per capita per day between 1988 and 1990 (1699 kcal, FAO/WHO 1994). For the Gurage women in our survey, the average energy intake was calculated as about 1320 kcal per day. The energy intake is strongly influenced by the quite high percentage of women who had 2 or even less meals per day. The number of meals per day may reflect the poverty level of a family and/or the level of activity undertaken by the mother outside the house. It is not common to eat outside the house (e.g., at the market place). In both surveys the fat and protein intakes of the women were comparable, whereas the carbohydrate intake was calculated as lower in this survey.
In the survey conducted in Sidama, significant differences in energy and macro-nutrient intake were found, which were highest in the post-harvest season (especially in December) and lowest in the pre-harvest (especially in July). Enset provided the highest proportion of energy during the months June/July, whilst cereals (probably corn) were predominantly consumed in September/October. The contribution of other food groups calculated as contributing to the mean energy intake was for tubers 2.0%, legumes and nuts 3.7%, milk and butter 1.5%, meat and poultry 0.4%. The first two groups did not reach more than 7%, and the other two groups more than 2%, of the total intake. In conclusion, the survey demonstrated a chronic deficiency in fat and protein intake, not only during the most difficult time of the year, as in this survey, but during all the seasons of the year, which might also be the case in the Gurage rural areas. Micro-nutrients with satisfactory intake The diets of both mothers and children seemed to be high in iron, vitamin A and riboflavin (Table 34, Table 39, etc.). According to the Ethiopian food table kocho, and the dishes prepared from kale, are extremely high in iron. In addition, kale is high in vitamin A and riboflavin. Children below 1 year

79
were an exception. Their nutrient density for vitamin A was below the recommended range. As they are still breast-fed, they probably receive enough vitamin A through breast milk (if the mother has sufficient vitamin A stores in the liver). The low fat intake might drastically reduce the actual vitamin A availability for the body. Due to the high iron intake there might be still enough to compensate for the low iron availability from a mainly plant based diet, with low vitamin C intake, and possible constraining factors such as phytates, which reduce the iron availability. Further, it might also cover iron loss from diseases such as malaria, or blood loss caused by worm infestation and the menstrual cycle. However the high vitamin A and riboflavin intake might be limited to this seasonal period when kale is available. This might change to when predominantly maize and legumes are consumed which contain less riboflavin and vitamin A. Micro-nutrients with an unsatisfactory intake Although Ethiopian kale is rich in vitamin C, most of the vitamin seems to be lost through lengthy processing and cooking (as seen in the Ethiopian food table). Due to a rather low fruit intake the vitamin C intake remained low (below 50% of the recommendations) in the diets of both women and children, except for those who were eating mango (Table 34, Table 39, etc.). In contrast to the results of this survey Agren & Gibson (1986) report a high vitamin C intake in enset cultivating areas (because they might have differently considered the cooking loses of kale). Vitamin C is critical during infections generally (because the requirement is increased), during intestinal tract infections (because the absorption is inhibited), and when carbohydrate intake is high (because carbohydrates have the same cell receptor as vitamin C and may compete with vitamin C, Biesalski, 1996). All three factors apply to the situation in these two villages, which increases the vitamin C need. Vitamin C is also one of the protective factors against cancer, and increases the absorption of iron from plant foods. Marginal vitamin C deficiency might increase susceptibility to infectious diseases. The main source of vitamin C for the women and children could be fruits, including wild fruits, which could be available to some extent throughout the year. Thiamine (vitamin B1) was the second micro-nutrient which was far below the recommended range for both women and children. Thiamine is one important cofactor of enzymes in the carbohydrate, fat or protein metabolism. Therefore a deficit in any one of these vitamins can affect the entire metabolism. Rich sources of thiamine are poultry, fish, liver in particular, legumes, milk and eggs, which were rarely consumed by the majority of people. Unrefined cereals, which are also a good source of vitamin B1, are only consumed on special occasions and not as a staple food.

80
6.7 Breast-feeding and complementary feeding practices Duration of breast-feeding In its Policy Statements the American Academy of Pediatrics (1997) states that human milk is uniquely superior for infant feeding and is species-specific. All substitute feeding options differ markedly from it. Epidemiological research showed that human milk and the breast-feeding of infants provide advantages with regard to general health, growth, and development, while significantly decreasing risk for a large number of acute and chronic diseases. Fortunately, the breast-feeding rate among the women in the two villages Mamede and Luke was high. The majority of mothers started to breast-feed within the first 24 h, unless there was a special reason that made it necessary to start later. The mothers also continued to breast-feed for a long time (see Figure 27). Breast-feeding does not only provide nutrients and immuno-active substances for the child, but further benefits that cannot yet be measured (UNICEF, 1999a): a natural opportunity to communicate love at the very beginning of a child’s life. So far it has not been clear up to what age the child is still depending on the antibodies of the breast milk, or when it is fully immuno-competent. It is therefore of positive benefit that breast-feeding is continued as long as possible, and protection through the anti-infection properties of breast milk is maintained. Breast milk can also still contribute as an important source of energy, fat, high quality protein and micro-nutrients, especially when the quality of available complementary food is low (Academy of Educational Development, 1999). This is expressed in the UNICEF (1993a) recommendation that breast-feeding should be continued well into the second year of life and for longer if possible. The average breast-feeding time of about 24 months was very similar to that revealed in the data for the country as a whole (25.3 months). Initiation of breast-feeding and pre-lacteal feeding During the first few days after a baby is born, the breast produces a small amount of yellowish milk, the colostrum. Colostrum is rich in antibodies, white cells, and growth factors. It exactly fulfils the needs of a new born for the first few feeds, protecting the child against infections, and preparing the gut to digest and absorb mature human milk. In many cultures, as well as in the project area, it is traditionally believed that the first milk to come from the breast is unhygienic (“dirty”) and therefore harmful to the baby, because of the traditional belief that this milk has been in the breast for a long time, due to its yellowish colour. In Luke significantly more women (67%) reported giving colostrum immediately after birth, as compared to Mamede (46%). In Ethiopia it is common to give pre-lacteal feeding before starting to breast-feed. On average, 66% of the women in Ethiopia gave pre-lacteal feeding, commonly butter or warm water (CSA, 1993). The number of women who reported offering pre-lacteal feeds was comparably low in Mamede and Luke (about 20%). During the interviews in Tatessa, some women explained that women from educated families, or women who received advice from the clinic, would not offer pre-lacteal feeding, but breast milk alone. Traditionally, rich people would give butter in preference. Some educated people would also give water with sugar, because this should “strengthen the child” and “build up” its body. These statements might demonstrate different opinions about pre-lacteal feeding habits. In fact, children are normally born with enough water and nutrient reserves for the first 2 or 3 days until the breast produces milk in higher quantities (King & Burgess, 1998). Pre-lacteal feeds might rather harm the immature gut of the child, especially if they are contaminated. Therefore health workers usually encourage women to offer colostrum immediately after birth and discourage them from giving pre-lacteal feeds.

81
Exclusive breast-feeding Although the majority of infants in Africa, Asia and Latin America are breast-fed, exclusive breast-feeding for the recommended period of 6 months is rare. Many women start to give additional fluids or foods as soon as a few weeks after birth (IRH, 1997). In contrast, UNICEF proclaims that breast milk is the perfect food for a baby’s first six months of life, which no manufactured product can equal (UNICCEF, 1999a). This is now the common recommendation, superseding the previous one recommending exclusive breast-feeding for 4 to 6 months. It has been proven that, even in environments with a hot and dry climate, infants do not need anything in addition to breast milk during the first 6 months of life (Sachdev et al, 1991). Not even in infants who were small for their gestational age was there a growth advantage when they received complementary food in addition to breast milk between 4 and 6 months of age (Dewey et al, 1999). In Ethiopia, the national average duration of exclusive breast-feeding was calculated as 7.1 months, ranging from 3.7 month in North Omo, to 12.1 months in North Gonder and Tigray (CSA, 1993). New figures mention that 83.8% of the women exclusively breast-fed below 4 months, 70.8% up to 5 months and 56.3% up to 9 months (CSA, 2000). The percentages were much lower in the study area, with 59.7% of the women exclusively breast-feeding their infants below 4 months, 32.7% from 4-5 months and 3.5% from 6-9 months. The women in Luke, on average, exclusively breast-fed for about one month longer than in Mamede (4.5 months and 3.6 months, respectively). Limiting factors for exclusively breast-feeding for 6 months include time constrains, and the fear of mothers that they might not produce enough breast-milk, and therefore the child might need additional fluids or foods. A possible connection between the poor nutritional status of mothers and the quality and quantity of breast milk has been an important point of discussion in the literature. Perez-Escamilla et al (1995) report a lower milk fat content in thin women, but this could be compensated for by the infants, who were allowed to nurse on demand, consuming a higher volume of milk. A study compared the lactose and protein levels of both privileged and underprivileged Ethiopian mothers at different stages of lactation with those of Swedish women (Lönnerdal et al, 1976). From the results the authors conclude that there is no evidence that undernutrition has any pronounced effects on the quality of breast milk in respect of lactose and protein. The bulk of evidence suggests that breast milk production is relatively well buffered against the malnutrition of the mother, and that adverse effects are unlikely unless the mother is both thin and in a negative energy balance (i.e. losing weight) (Brown & Dewey, 1992). Another limiting factor might be the low fluid intake of the mothers (in total about 820 ml, with about 500 ml as coffee) in the study area. This might reduce the amount of available breast milk during lactation. However it has to be considered that these are the same conditions under which complementary foods are most likely to be contaminated and of poor nutritional quality. This can be clearly seen in the results of the 24 h-recalls of the mothers and children (e.g., Table 30, Table 35). In such cases, health institutions and aid organisations are recommended to focus on the maternal dietary or micro-nutrient supplementation, because this is likely to be a more efficient, and less risky, strategy to prevent deficiencies in both mother and infant, than the use of complementary feeding below 6 months (WHO/NUT, 1998). The habit of giving fluids to the children, such as tea, water or cow’s milk, before 4 months, as practised by quite a high number of women (47% in Mamede and 34% in Luke) does not increase the energy intake, but effects and displaces the breast milk intake (WHO/NUT, 1998) if given regularly. The additional fluid intake in young infants might rather be considered as a risk factor for infections, due to food-born pathogens. A case-control study of infant mortality in Brazil showed that infants who received water, tea, or juice in addition to breast milk were at increased risk of diarrhoeal death. Each additional feed with these fluids substantially increased the risk of death (WHO, 1991).

82
Complementary feeding It was also observed in the interviews that beyond 6 months some women still continued giving mainly fluids (not including cow’s milk) in addition to breast-feeding, although by now the children would need energy-rich complementary food instead. UNICEF (1993a) recommends that until the age of 9 to 10 months, infants should be breast-fed before other adequate complementary food are given in order to fulfil the additional energy and nutrient needs. Complementary foods mainly mentioned were tea and water, thin porridge (prepared from water and cereals or bulla), cow’s milk, butter (mainly in Luke) and fruits (mainly in Mamede). If the porridge could be enriched with protein-rich foods such as lentils, and fat-rich foods such as butter, oil, oil seeds or avocado, and available vegetables, this would greatly increase the nutritional value of the complementary food. It is advantageous that children seem to receive complementary food for about 13 months before they change to family food. This might be because of the hard consistency and the sour taste of kocho. In addition to the benefits of regular breast-feeding, the frequency of complementary feeding is more important for young children than for adults. The number of meals might depend on what the family can afford, but also on how often, and for how long, the mother goes out of the house, and whether she prepared anything which other family members offer the children in her absence.
Altogether, the topic of complementary feeding is very complex. The amount of breast milk consumed at different stages of weaning, the frequency of breast-feeding, the energy and nutrient density of the foods given, the frequency of feeding, the variety of foods offered, snack food in between, feeding practices, hygiene aspects of food preparation, and poor appetite during illness are all factors that play an important role. Bottle-feeding One undesirable habit is the practice of bottle-feeding. Women, who probably want to appear modern, tend to be more likely to use the bottle. The percent of women who fed their infants with bottles, either containing commercially-produced milk, or other liquids (tea, water, cow’s milk etc.), was significantly higher in Mamede (40%) than in Luke (20%). This might be due to the proximity of Mamede to Wolkite.

83
6.8 Comparison between the two villages Significant differences between Mamede and Luke:
In Luke, significantly more fathers stayed permanently at home than in Mamede (85% and 73%, respectively). Therefore households headed by females were more predominant in Mamede.
In Mamede, a higher percentage of fathers (45%) and mothers (22%) had had a formal education compared to Luke (29% and 12.5%, respectively). Significantly, more fathers in both villages combined (37%) had had a formal education compared to the mothers (17%).
In Mamede, more mothers reported that they themselves (61%) and their husbands (47%) were conducting income-producing activities, mainly on a daily earning basis, than in Luke (43% and 36% respectively). Additionally, there was a small number of fathers (6%) and mothers (1%) earning a regular monthly income, whereas in Luke non of the parents did so. Significantly more of the mothers in both villages combined (52%) seemed to earn money compared to their husbands (44%).
In Luke, significantly more families had children who earned money themselves than in Mamede (20% and 8%, respectively).
In Mamede, significantly more families were growing enset, the cash crops chat and hope, the fruits mangoes, banana and lemon in their home gardens. In Luke only maize was found more frequently in the home gardens.
Additionally, the families in Mamede more often reported raising cows, calves and keeping donkeys (only very few families had donkeys). Also more families were found in Mamede to have milk and eggs available at the time of the survey. (It is not sure if this is actually the case because of the unknown percentage of wrong answers that were given to this question.)
In Mamede, significantly more children were examined with an acute respiratory infection, diarrhoea, burn / wound or vomiting than in Luke.
The nutrient density of fat was significantly higher in Mamede and the carbohydrate density higher in Luke in respect of the mothers’ and the children’s diet. A comparison of vitamin C density showed a higher level for children in Mamede (due to higher mango intake); however the vitamin C density for women was higher in Luke.
In Mamede, more children had received grains (barley and tef), fruits, eggs and meat the previous week (source: food frequency questionnaire). There was no food group that was significantly more often given to children in Luke.
In Mamede, the mothers more often mentioned thin porridge and fruits as complementary food for children; in Luke they more often mentioned butter.
In Mamede, more mothers reported that they received cheese and fruits as special food during the postnatal period.
In Luke, the mothers, on average, exclusively breast-fed their children for longer. The difference was nearly one month. Further, the children more often received colostrum within the first 24h after birth (67% and 46%) and less often used the bottle (21% and 40%).
The mothers in Luke rested for a slightly longer period after birth than in Mamede (7.7 weeks and 7.0 weeks, respectively).

84
No significant differences were found between the interviewed families in Mamede and Luke for the:
Total number of children per family
Average number of children below 5 years per family
Average number of children not living at home per family
Average number of children who had already died per family
Number of pregnant or lactating mothers per village
Percentage of women who visited a health institution during pregnancy per village
Average age of the parents per village
Average age of the mother on her first marriage per village
Religions of the mothers in both villages
Percent of mothers who visited a health facility during pregnancy per village
Average time needed for water collection per village
Persons responsible for water collection in both villages
Percentage of women who gave pre-lacteal food or fluids to their new born child per village
Total average breast-feeding time per village
Average time when complementary food was exchanged for family food per village
Average period the mother received special attention after birth per village
Average BMI of the mothers per village
The families in Mamede seemed to profit from the closer proximity to the town of Wolkite in terms of education, occupation and the availability of products which are more easily found in Wolkite such as wheat (for porridge or white bread), tef, barley and certain types of legumes. Therefore these products were more frequently mentioned in the food frequency questionnaire or as complementary food for the children. In addition, there seemed to be more money available to the families in Mamede than in Luke to be able to buy, e.g., these additional foods. One particular income possibility in Mamede might be the chat and hope (which is used to prepare local alcohol) which was more frequently produced in Mamede, and also easier to sell in Wolkite to obtain some cash income. A limiting factor could be that mothers in Mamede invest more time in going to the markets in Wolkite, which might increase their cash income and economic situation, but reduces the time for the care of young children. In terms of nutrition fruits seemed to have a higher value in Mamede, partly as cash income but also as child food and as special food after delivery. However fruit intake would need improving in both villages. A similar picture emerged for energy and fat density. This was low in both villages, but comparably higher in Mamede than in Luke. Milk and milk products seemed to be available and used in both villages.
In two aspects the situation in Luke was better than in Mamede. Acute illnesses were revealed on examination less often in Luke. Furthermore, some breast-feeding habits were also comparably better in Luke. The period of exclusive breast-feeding was about 1 month longer, a higher percent

85
of women gave colostrum within the first 24h after birth, and a lower percent of women used the bottle to feed their children in Luke compared to Mamede.
In conclusion, a greater cash availability, location nearer to a town, and a higher food intake does not alone necessarily lead to a better nutritional status of children as seen in Mamede and Luke. Another explanation could be that several years ago Luke was the wealthier village but the situation worsened because of disease among the cattle, whereas the people in Mamede might still be on an upward trend in terms of improving their situation. The inaccurate data of the date of birth of the children might be an other limiting factor which has to be kept in mind when interpreting the anthropometric data of the two villages.

86
7 Recommendations
7.1 Recommendations for the Bio-village project
7.1.1 Promotion of agricultural and household activities
Promoting the cultivation of a higher variety of cereals, fruit, vegetables and legumes to guarantee a bigger variation in the diet. This would improve the protein and micro-nutrient intake as well. In order to avoid intestinal infections of any type, green leafy vegetables which need to be cooked should be recommended in preference to leafy vegetables such as salads which are consumed raw.
Promoting the cultivation of special seeds and nuts like linseed, sunflower seed, sesame or groundnuts.
Promoting preservation methods such as drying of fruits to guarantee the availability of fruits for the whole year.
Promoting access to clean water throughout the year. It would be desirable for all women to have a shorter walking distance to obtain clean water. This would reduce their work load and give space for other important activities such as childcare. Proximity to water is an important prerequisite for improved hygiene behaviour.
Promoting alternative cooking facilities. Modification of the cooking site arrangements could cause firewood to burn more efficiently. This would make it easier to convince families to prepare a higher number of meals for the children per day.
Promotion of income-generating activities for women. The ideas and special interests of the women could be identified and collected through focus group discussions with the women. A system of small loans, and help in the transport of necessary raw materials and market produce, would help the women put these into practice.
7.1.2 Nutrition and health education programmes
Special training for community health workers (CHW) who can afterwards conduct monthly courses for women to broaden their nutritional knowledge. The training should begin with a special workshop, and be continued through collaboration with the Attat hospital, which runs a nutrition department. Further, CHWs should be accepted within the community and be familiar with traditional practices, which need to be discussed and integrated into the programme as far as possible. Afterwards they should conduct meetings on nutritional topics in their villages, supported by the Bio-village project.
Parents of severely malnourished children should be offered the opportunity to stay in the nutrition department of the Attat hospital. During the rehabilitation of the child the carers receive special teaching on how to prevent the malnutrition of siblings.
Health education for women in co-operation with the nearby health institutions of Mamede and Luke. Health care personnel (from the Wolkite Health Center and the Clinic in Luke) may be the most reliable persons for village people as a source of information on health and child-rearing topics.

87
Promotion of health and nutrition education in the primary schools of Mamede and Luke. Support to teachers could be given through health personnel, in terms of health, and through Bio-village staff in terms of nutrition. Teachers from the surrounding schools should also be invited to the planned workshop.
7.2 Special topics of health and nutritional education In order to make well-considered decisions about dietary and child rearing-issues the families, and especially the mothers, require information on the following topics:
7.2.1 Childcare
Emphasising the importance of proper child care
7.2.2 Health education
The following health topics are limited to the outcomes of this study:
Practising good hygiene and proper food handling: � Washing hands for caregivers and children before preparing and eating food � Serving children food in clean cups and bowls � Serving foods immediately after preparation � Encouraging mothers to avoid feeding bottles
Household and personal hygiene � To reduce the proneness to trachoma and scabies � To reduce the susceptibility to diarrhoea and infections � To break the cycle of infestation with intestinal parasites
Home treatment for � Trachoma in the initial stage � Scabies � Diarrhoea (e.g., cereal based ORS) � Respiratory infections, fever, etc.
Visual signs of proper growth
Recognition of early signs of severe malnutrition
7.2.3 Breast-feeding
It is desirable that the following breast-feeding habits are not only limited to a small group of women who already practise them within the communities, but that the knowledge of such habits reaches all the women, and that they are encouraged to practise them.
Initiation of breast-feeding immediately after birth.
Promoting the use of colostrum immediately after birth.
Discouraging to give pre-lacteal feeding.
Encouraging mothers to exclusively breast-feed the infants for 6 months without giving any fluids (water, tea or cow’s milk) or foods (porridge, butter) to the child between feeds.
Encouragement to continue with frequent, on-demand breast-feeding, including night breast-feeding, when complementary feeding has started.

88
Encouragement to continue breast-feeding well into the second year of life, and for longer if possible.
7.2.4 Complementary feeding
Improving complementary feeding requires a combination of strategies. Important aspects related to the results of this survey are listed below:
Introducing complementary foods beginning after 6 months of age.
Increasing food quantity as the child gets older, while maintaining frequent breast-feeding.
Increasing feeding frequency as the child grows older, using a combination of meals and snacks: � 6-8 month old infants: 2-3 times per day � 9-11 month old infants: 3-4 times per day � 12 - 24 month old children: 4-5 times per day.
Gradually increasing food consistency and variety as the infant gets older, adapting the diet to the infant’s requirements and abilities:
� Energy-dense combinations of soft foods for 6 to 11-month-olds � Introducing “finger foods” (snacks that can be eaten by children alone) beginning around
8 months of age � When making the transition to the family diet (at about 12 months) the family food should
still be enriched with energy- and fat-dense foods.
Practice of active feeding: � Feeding infants directly and assisting older children when they feed themselves � Feeding slowly and patiently and minimising distractions during meals � Offering favourite foods and encouraging children to eat when they lose interest or have
depressed appetites � Talking to children during feeding.
Diversifying the diet to improve quality and micro-nutrient intake through: � Regularly using vegetables and fruits in season � Increasing energy density through fat-rich foods such as seeds (linseed, sunflower seed,
sesame), nuts (groundnuts), oil, or butter � Improving protein quality by adding legumes, nuts and increasing the variety of plant
sources of protein � Including milk and milk products, meat, poultry, or eggs, if available.
Practice of frequent and active feeding during and after illness: � During illness, it is important to increase fluid intake by more frequent breast-feeding, and
patiently encouraging children to eat their favourite foods � After illness, it is important to breast-feed and give foods more often than usual and to
encourage the children to eat more food at each sitting.
Offering more fluids to older and non breast-fed children.
7.2.5 Promotion of the mothers’ nutritional status
To counteract the often disadvantaged position of women in poor societies, the whole family should be aware that the life quality and nutritional status of the mother strongly influences the health and nutritional status of her young children in every aspect, such as childcare, as well as the development of the foetus, and breast-feeding the infant. In this respect the following topics are of interest:

89
Awareness within the whole family, including husbands, grandparents, etc., that a pregnant and lactating woman has an increased energy and nutrient demand. Not only an increased food intake is necessary, but also an increased quality of food. This is not only important for the women, but the first step in promoting the nutritional status of the child.
Discouraging traditional customs which require women to avoid certain foods, such as several animal products, during pregnancy.
Importance of an increased fluid intake, especially if the women are lactating, not only in the form of coffee, but preferably through water or tea. Fruits such as oranges or mangoes can also increase the water intake and support the micro-nutrient intake, especially of vitamin C and vitamin A (mangoes).
Awareness that pregnant women need to reduce their workload.
Supporting the traditional custom of lying-in period (childbed) and special food offerings to the mothers during the postnatal period.
7.2.6 General dietary habits for the whole family
This study has focused on mothers and young children, but it has to be assumed that the above-described dietary patterns apply to all family members. Therefore a general improvement as to the following issues would be desirable:
Awareness that vegetables and fruits are not only a good source of income, but even more important for personal family nutrition. The nutritional value of low prestige foods such as vegetables and fruit should be made widely known. The consumption of mangoes, oranges, lemons, papaya and guava can compensate for the vitamin C deficit.
Recognising the value of wild fruits and green leaves, not just as foods for poor people only, and encouraging the collection and use of these foods in the diet, especially when other foods are scarce.
Encouraging the combination of kocho with cereals and legumes to improve the protein intake, especially when animal products are scarce.
Use of seeds and nuts, such as linseed, sunflower seed, sesame and groundnuts, in addition to oil and butter, is important, especially in the children’s diet. The use of seeds and nuts would improve the fat intake, not only in terms of energy intake, but also the quality of fat and the micro-nutrient intake. They are also easy to store for a certain period of time.
7.3 Topics for further research The following topics, with special focus on the nutritional status, are suggested for further research:
Seasonal variation in food intake and its influence on nutritional status.
Preparation of accepted and modified recipes as complementary and family food.
Do income-generating projects reduce childcare activities ?
Co-fermentation possibilities of kocho in combination with different types of grain, such as barley, (Zwedie, 1999) which are accepted, affordable and increase the protein and nutrient value of kocho.

90
Biochemical analyses of micro-nutrient intake in children under 5 years to evaluate the micro-nutrient availability ,e.g., of vitamin A and iron, and to assess micro-nutrient deficiency e.g. in vitamin C and thiamine.
Extension of the Ethiopian food tables to include additional micro-nutrients to the ones already available.

91
8 Summary
Purpose of the study The main purpose of this study was to establish baseline information on the health and nutritional status of young children (below 5 years) and their mothers in the two villages, Mamede and Luke, of the Bio-Village project area. To ascertain risk factors leading to malnutrition among young children, with special emphasis on family background, breast-feeding and dietary habits, was another important objective. Based on the study results, recommendations were established on how to improve the health and nutritional situation of the population concerned as a basis for future activities. Co-operating institutes The study was performed in co-operation with the International Center for Insect Physiology and Ecology (ICIPE), the Ethiopian Health and Nutrition Research Institute (EHNRI) and the Institute of Biological Chemistry and Nutrition, University of Hohenheim. During the survey period the Wolkite Clinic and the Attat Hospital made health staff available for measuring the anthropometric data of the women and children, and for undertaking a health check of the children concerned. Methods Data collection took place through interviews, anthropometric measurements and health observation of children below 5 years and their mothers in the two villages Mamede and Luke during the months of June and July 2000. About 150 mothers or carers of the index child (defined as the youngest child, who was at least 8 months old and no longer exclusively breast-fed) were interviewed in each village. All of them were invited to take part in anthropometric measurements and in a health check of their children below the age of 5 years. If a child suffered from a common and easily treatable disease (e.g. infections of the skin, eyes, ears, and respiratory or gastrointestinal tract) appropriate medical treatment was immediately applied in the community. After data collection special attention was paid to families with severely malnourished children in Luke. Families who agreed to bring their child for admission to the nutrition department of Attat hospital were offered transport and the admission fee free of charge. Due to heavy rains the same service could not be offered to severely malnourished children in Mamede. Main study outcomes
1. ANTHROPOMETRIC DATA On applying the severity index for malnutrition based on the prevalence of wasting (WHO, 1995), the nutritional situation among the children below 5 years has to be classified as “serious” and “critical” in Luke, and “critical” in Mamede. The anthropometric data of the children in both villages are show in the following table:
Table 1: Anthropometric data of the children in Mamede and Luke (Gurage rural area) compared to data countrywide (CSA, 2000).
Rural areas in Ethiopia (2000)
Gurage rural area (2000)
Weight for age < –2SD 48.6 56.8 Height for age < –2SD [%] 52.3 58.0 Weight for height < –2SD [%] 11.3 17.7 Weight for height < –3SD [%] 1.5 1.9

92
The data of this survey show a much higher percentage of children who were moderately wasted (17.7%) as compared to rural areas in Ethiopia as a whole (11.3%), but a comparable percentage of children who were severely wasted (1.9% and 1.5% respectively). The percentages for stunting and underweight were also higher than on a countrywide level. In Mamede more children were wasted, stunted or underweight (index < -2SD) than in Luke.
The average Body Mass Index, weight and height of women in the study is shown in table 2:
Table 2: Average BMI, weight, height, and the percent of underweight of non-pregnant mothers (n=334).
BMI 18.7 kg/m2 Weight 46 kg Height 156.9 cm BMI < 18.5 47% Comprising: Mildly underweight (BMI 17.0 – 18.4) 32% Moderately underweight (BMI 16.0 – 16.9) 9% Severely underweight (BMI < 16.0) 6%
Some years ago, a study conducted in the same area (EHNRI, 1997/98) found a higher prevalence of underweight women (62.3% with a BMI < 18.5). The average BMI among adults (men and women) varied between 17.7 kg/m2 in the post-harvest season and 17.4 kg/m2 in the pre-harvest season.
1. FAMILY BACKGROUND The family structures were similar in both villages. On average 3.6 children were alive and 0.3 children per family had already died. The Muslim faith was the major religion (58%), followed by membership of the Ethiopian Orthodox church (42%). 15% of the mothers in both villages were found to be pregnant and 66% were lactating during the study period. Differences between the villages were found in education levels and economic situations. In Mamede, a higher percentage of mothers (23%, versus 13% in Luke) and fathers (45%, versus 30% in Luke) had experienced formal education. There was also a big gap in education levels between women and men. The highest illiteracy rate was found among women in Luke. In Mamede a higher percentage of parents seemed to conduct income-generating activities (52% men and 62% women in Mamede, as compared to 36% men and 43% women in Luke). In Mamede, a higher percentage of husbands did not permanently live at home. They seemed to take the opportunity to work outside the village at least part-time. The main income-generating activities were the selling of home-produced products or small-scale trading.
2. AGRICULTURAL AND ANIMAL PRODUCTION Farmers in both villages are mainly engaged in subsistence farming. In Mamede, more families were found who planted enset (97% in Mamede versus 78% in Luke), chat (80% versus 57%), mangoes (76% versus 2%), hope (43% versus 15%), bananas (29% versus 17%) and lemons (19% versus 6%). In Luke, more households were growing maize (96% versus 89% in Mamede). Coffee, chat, hope and fruit were predominantly grown for sale. Neither village grew much variety of vegetables. The majority of families reported keeping cows (70% in Mamede versus 51% in Luke), having calves from time to time, and raising chickens (57% versus 33%). Other animals such as oxen,

93
donkeys, mules, or goats were kept by a smaller number of families. Milk was only available when the cow was feeding a calve.
3. SOCIAL CHARACTERISTICS Working co-operatives, e.g., to harvest the enset, called “debo” and a kind of insurance system called “eder” were common in the two villages. There also seemed to be a network among neighbouring women and relatives to support each other when one mother is not at home, is ill or after delivery, or needs to borrow money; they also meet for coffee ceremonies. The heaviest work and most time-consuming activities of mothers were the collection of water, work in the home gardens, such as harvesting enset, and going to the markets. In Mamede, the most time-consuming task was the trip to the Wolkite market. On these days women were less able to breast-feed, or to prepare food for their young children. Older siblings or neighbours took care of the children during that time.
4. DIETARY INTAKE As shown in table 3 the diets demonstrated a very low fat content and high carbohydrate contribution to the total energy intake analysed from the 24-h recall of the women and children. The diets reached just about the lower level of the recommended protein requirement (bearing in mind that this does not apply either to children below two years, or to pregnant or lactating women, who should all have a higher protein and fat intake), but were far below the recommended percentage for fat, and therefore above the recommendation for carbohydrate.
Table 3: Energy derived from carbohydrates, fat and protein, expressed as the percentage of the total energy intake among children <5years and women.
Percent (%) of total energy intake Protein Fat Carbohydrate Recommended intake in % of the total energy intake*
10-12 20-30 55-70
Children <5y 11 ± 5 13 ± 13 77 ± 15 Women 10 ± 3 9 ± 6 81 ± 7
* Children below 2 years of age have a higher recommendation for fat (30-40% of the total energy intake), also pregnant and lactating women.
The percentage of protein in the diets was about the same for children and women. The differences appeared mainly in the contribution fat made to the total energy intake. The energy derived from fat was significantly higher in Mamede than in Luke, and higher in the younger (below two years) than in the 3 to 4-year-old children. Similar results were found when considering the nutrient density for protein, fat and carbohydrates. As well as a high carbohydrate density, the fibre density was also high. The total energy and macro-nutrient intakes of non breast-fed children and mothers were insufficient in energy, fat and protein, whereas the carbohydrate intake was within the recommended range. Protein was mainly consumed in the form of plant proteins. The staple food, kocho, prepared from enset, is very low in protein. In comparison to the results of this study, a longitudinal study about the food intake of women during the months of June and July in an enset growing area found a considerably higher energy and carbohydrate intake, but a lower protein and fat contribution to the total energy intake (6% protein, 7% fat; Taffesse et al, 1999). Concerning the analysed micro-nutrients, the diets seemed to be sufficient in iron, vitamin A, riboflavin and calcium, but were lacking thiamine and vitamin C.

94
The results of the food frequency questionnaires relating to the children showed a quite monotonous diet, mainly and regularly consisting of the enset products kocho and amicho and Ethiopian kale. Products from wheat and barley (mainly prepared as porridge, with water) and milk were given more to small children (below 2 years), whereas the older ones more often received legumes (mainly kidney beans), meat and cheese. Despite the fact that quite a variety of fruits was available during the study period (bananas, mangoes, papaya, guava, oranges, lemons), only mangoes were given, largely to the children of Mamede (60% in the previous week). Other fruits and vegetables were rarely offered. The diets in Mamede included a greater variety of products than in Luke.
1. BREAST-FEEDING HABITS AND COMPLEMENTARY FEEDING The breast-feeding habits in the two villages differed markedly in comparison to national surveys .
Table 4: Various data on breast-feeding habits in Mamede and Luke (Gurage rural areas, 2000) compared to the National Rural Nutrition Survey (CSA, 1993* and CSA, 2000# )
Gurage rural area (2000)
Countrywide average
Duration of exclusive breast-feeding [months]
4.1 ± 2.5 7.1*
Duration of breast-feeding [months] 24 ± 8 25.3* Time when complementary food was replaced by family food [months]
13.5 ± 7.5
Percent of women who started breast-feeding directly after the birth [%] within the first 24h [%]
70 28
Percent of children who received colostrum [%]
55
Percent of children who were given pre-lacteal feeding [%]
19 66.2*
Percent of women who used a bottle to feed their children [%]
30 13.8% < 4 mo# 20.1% 4-5 mo# 14.7% 6-9 mo#
The duration of exclusive breast-feeding up to 4.1 months was low compared to the average duration of 7.1 months in Ethiopia (CSA, 1993). New national data (CSA, 2000) report that 83.8% of the women exclusively breast-fed their infants up to 4 months, 70.8% up to 5 months and 56.3% up to 9 months, whereas the figures were 59.7%, 32.7%, 3.5%, respectively, in this study. On the other hand, traditional habits of offering pre-lacteal feeding were mentioned less often in this survey. On a countrywide level, the use of a bottle to feed the child was reported to rise from 14%, amongst children under 4 months, to 20% amongst children between 4 and 5 months, falling again to below 10% thereafter amongst children who were one year and older. Compared to these national data the percentage of women who used the bottle was, at 30%, much higher in the Bio-village project area (it has to be assumed that using feeding bottles is lower in rural areas, such as Mamede and Luke, as compared to urban areas, such as Wolkite). With regard to breast-feeding, the situation was better in Luke: the duration of exclusive breast-feeding was significantly longer (4.5 months in Luke versus 3.6 months in Mamede). Furthermore, the number of women who gave colostrum within the first 24h after birth was

95
significantly higher (67% versus 46%) and significantly less women used a bottle to feed the children (20% versus 40%).
The women in both villages most often mentioned that they used tea or water (82%) and diluted cow’s milk (52%) for complementary feeding. The other most frequently given foods were porridge mainly prepared from bulla (39%), butter (27%) and fruits (14%). In Mamede, the mothers significantly more often mentioned offering thin porridge and fruits as complementary food for their children; in Luke they added more butter to infant foods.
1. MOTHERS DURING PREGNANCY AND IN THE POSTNATAL PERIOD In Mamede 74% and in Luke 64% of the women reported having visited a health institution for examination during pregnancy. It seemed that mothers in both villages did not reduce their workload during pregnancy. In addition, they followed some traditional food restrictions, such as avoiding milk, white cheese, vegetables of the potato variety, and eggs, during pregnancy. In contrast, after delivery most of the women (96%) received special attention and food during the postnatal period such as porridge (93%, mainly prepared from bulla), butter (89%), cheese (88%), and meat (87%). Ethiopian kale was mentioned by 53% and fruits by 6%. Again, fruits, and also cheese, were significantly more often reported in Mamede than in Luke. The average lying-in period (childbed) lasted for about 7.5 weeks.
2. HEALTH DATA OF THE CHILDREN The health assessment was performed by applying a point prevalence method. Therefore long term diseases such as worm infections (14%), scabies (10%) and trachoma (8%) were among the most frequently visible and reported diseases. Acute illnesses such as respiratory infections, diarrhoea, burns, wounds and vomiting significantly more often were manifested on medical examination in Mamede than in Luke.

96
3. COMPARISON BETWEEN THE TWO VILLAGES Table 5 summarises the differences examined between the two villages.
Table 5: Comparison of important results between Mamede and Luke. If the symbols ? ? are used the difference was significant.
MAMEDE LUKE 1. Anthropometry ? better nutritional status of the
children < 5 years on average slightly higher BMI among
the mothers 2. Family background ? more mothers and fathers with formal
education
more husbands worked part-time outside the village
? more husbands who permanently stayed at home
? more income-generating activities amongst mothers and fathers
? more families where children earned money
3. Agricultural and animal production
? more households growing enset, chat, hope, mangoes, bananas and lemons
? more households growing maize
? more households raising cows, calves and donkeys
? more households where milk and eggs were available
5. Dietary intake ? higher fat contribution to total energy intake in the diets of mothers and
children
? higher carbohydrate contribution to total energy intake in the diets of
mothers and children ? higher fat density in the diets ? higher carbohydrate density in the
diets ? more children received grains (barley,
tef), fruits (mainly mangoes), eggs and meat the previous week
6. Breast-feeding and complementary feeding
average time of exclusive breast-feeding (3.6 months)
? longer average time of exclusive breast-feeding (4.5 months)
? more women offering colostrum within the first 24h after birth
? less women used the bottle to feed the infant
slightly less use of pre-lacteal feeding 7. Health data ? more children suffering from
respiratory infections, diarrhoea, burns wounds or vomiting

97
Conclusion The nutritional situation of the children in both villages, Mamede and Luke, indicates an insufficient status, which was worse for nearly all indicators when compared to national surveys. The anthropometric results for the young children were probably strongly influenced by the pre-harvest season time, when food deficits are common, and by rough estimations of the date of birth. Concerning the diets, the fat intakes of the children, and of women of child-bearing age, were, in particular, much too low. An important point of action for the Bio-village project is nutritional education, with an emphasis on increasing the fat, protein, thiamine and vitamins C content in the diets of both mothers and children, and especially on increasing the energy intake of the children. In addition to this, practical advice on how to increase the variety of vegetables, fruits or oil seeds in their home gardens, combined with improved storage facilities, should be offered to the families. Breast-feeding practices which should be encouraged are: breast-feeding immediately after the birth without discharging colostrum and increasing the duration of exclusive breast-feeding. Those to be discouraged are: pre-lacteal feeding and the use of bottles. Health education on how to improve hygiene behaviour and thus to reduce the prevalence of scabies, trachoma and worm infestations is very important too. Provision of more wells to reduce the time and workload of women in the collection of water, and to guarantee safe water throughout the year, would be further desirable activities. Besides access to adult literacy classes, the women need more income-generating possibilities. There are working (debo) and financial (eder) co-operatives, as well as networks among neighbours to help each other by lending money on certain occasions, such as times of illness, childbirth, and wedding and funeral ceremonies. These activities could be strengthened and extended within the Bio-village project areas. They could also be the base for improving and supporting the women’s situation within new and ongoing project activities. Although the economic and dietary situation seemed to be better in Mamede than in Luke, other important factors, like a higher prevalence of acute illnesses, less desirable breast-feeding habits and more single parent households, may have negatively influenced the nutritional status of children in Mamede. A further factor could be an increased lack of childcare, because mothers in Mamede invested more time in going to the markets in Wolkite to improve their economic situation. The results suggest that a better economic situation and closer proximity to a town does not necessarily lead to a better nutritional status among children. Other factors, such as childcare, should be more intensively considered in a future survey.

98
9 References
Academy of Educational Development (1999). Recommended Feeding and Dietary Practices to improve infant and maternal nutrition. Linkages-Improving Nutrition and Reproductive Health.
ACC/SCN (1992). Second Report on the World Nutrition Situation. Vol. I: Global and Regional Results. Geneva: ACC/SCN.
ACC/Sub-committee on Nutrition (2000). Assessment of nutritional status in emergency-affected populations. Geneva: RNIS-supplement.
Acheson KJ, Campbell IT, Edholm OG, Miller DS, Stock MJ (1980). The measurement of food and energy intake in man – an evaluation of some techniques. Am J Clin Nutr 33:1147-1154.
Agren G, Gibson R (1986). Food consumption table for use in Ethiopia I. CNU Report No. 16. Addis Ababa: ENI-SIDA.
American Academy of Pediatrics (1997). Breastfeeding and the Use of Human Milk (RE9729). Policy Statements Volume 100, No. 6:1035-1039.
Annual report of the Attat Hospital (1998). Gurage Zone, Wolkite, Ethiopia. Bailey K, de Onis M, Blössner M (1998). Protein-energy malnutrition. In: Murray CJL, Lopez AD
eds. Malnutrition and the burden of disease: the global epidemiology of protein-energy malnutrition, anaemia and vitamin deficiencies. Vol. 8. The Global Burden of Disease and Injury Series. Cambridge: MA: Harvard University Press.
Besrat A, Mehansho H, Bezuneh T (1979). Effect of varietal difference and fermentation on protein quantity and quality of ensete. Nutr Rep Internl 20:245-250.
Biesalski H-K (1996). Vitamine – Aktiver Gesundheitsschutz; Bedarf, Mangel, Risiko. Stuttgart: Thieme Hippokrates Enke.
Branca F, Pastore G, Demissie T, Ferro-Luzzi A (1993). The nutritional impact of seasonality in children and adults of rural Ethiopia. Eur J Clin Nutr 47:840-850.
Briend A (1990). Is diarrhoea a major cause of malnutrition among the under-fives in developing countries? A review of available evidence. Eur J Clin Nutr 44:611-628.
Brown KH, Dewey KG (1992). Relationship between maternal nutritional status and milk energy output of women in developing countries. In: Picciano MF, Lönnerdal B, eds. Mechanisms regulating lactation and infant nutrient utilisation. New York: Wiley-Liss Inc: 77-95.
Central Statistical Authority, the Transitional Government of Ethiopia (1993). Report on the National Nutritional Survey, Core Module, March 1992. Addis Ababa: Statistical Bulletin 113.
Central Statistical Authority, Marco International Inc. (2000). Ethiopian Demographic and Health Survey 2000. Addis Ababa, Calverton, Maryland: Preliminary Report.
Coletta FA, Baartholmey SJ (1994). The 1994 Dietary Guidelines for Infants. Pediatr Basics. 69:1. Dewey KG, Cohen RJ, Brown KH, Rivera LL (1999). Age of introduction of complementary foods
and growth of term, low-birth-weight, breast-fed infants: a randomized intervention study in Honduras. Am J Clin Nutr 69:679-686.
El Samani FZ, Willet WC, Ware JH (1989). Predictors of simple diarrhoea in children under 5 years – A study of a Sudanese rural community. SC. SCT. Med. Vol. 9:1065-1070.
Erhardt Juergen. Nutrisurvey (a nutritional computer programme). http://www.nutrisurvey.de/ EHNRI. Annual Report 1997/98. Addis Ababa: Ethiopian Health and Nutrition Research Institute. FAO (1970). Requirements of Ascorbic Acid, Vitamin D, Vitamin B12, Folate and Iron. Rome:
Report of Joint FAO/WHO Report Group. FAO (1988a). Requirements of Vitamin A, Iron, Folate and Vitamin B12. Report of a Joint
FAO/WHO Expert Consultation, Geneva, 1985. Rome: FAO Food and Nutrition Series 23. FAO (1988b). Traditional Food Plants. Rome: FAO Food and Nutrition Paper 42.

99
FAO (1994). Fats and oils in human nutrition – Report of a joint expert consultation. FAO Food and Nutrient Paper. Rome: Food and Agricultural Organization of the United Nations, World Health Organization.
FAO (1998). Preparation and use of food-based dietary guidelines. Geneva: Report of a Joint FAO/WHO Consultation.
Garrow JS, James WPT (1993). Human Nutrition and Dietetics. Edinburgh, London, Madrid, Melbourne, New York, Tokyo: Churchill Livingstone.
Gibson, RS (1993). Nutritional Assessment – A Laboratory Manual. New York, Oxford: Oxford University Press.
Gomez F, Galvan RR, Cravioto Munoz J, Chavez R, Vazquez L (1956). Mortality in second and third degree malnutrition. J Trop Pediatr 2:77-83.
Grantham-McGregor SM, Powell CA, Walker SP, Himes JH (1991). Nutritional supplementation, psychosocial stimulation, and mental development of stunted children: the Jamaican study. Lancet 338:1-5.
Gross R, Kielmann A, Keerte R, Schoeneberger H, Schultink W (1997). Guidelines for Nutrition Surveys in Communities. Jakarta: GTZ.
FAO/WHO (1994). Fats and oils in human nutrition. Report of a joint expert consultation. FAO Food and Nutrient Paper 57. Rome: Food and Agricultural Organization of the United Nations, World Health Organization.
FAO/WHO (1996). Preparation and use of food-based dietary guidlines. Report of a joint FAO/WHO consultation, Nicosia, Cyprus. Nutrition Programme WHO Geneva. Geneva: Food and Agricultural Organization of the United Nations, World Health Organization.
Hamer J (1987). Human Development: Participation and Change among the Sadama of Ethiopia. Tuscaloosa: University of Alabama Press.
Hendrickse RG (1991). Protein-energy malnutrition. In: Hendrickse RG, eds. Paediatrics in the Tropics. London: Blackwell Scientific Publication: 119-131.
Huffnagel HP (1961). Agriculture in Ethiopia. Rome: Food and Agricultural Organization of the United Nations.
IRH (1997). Breastfeeding and Child spacing – Country Profiles. Institute of Reproductive Health. ICIPE, ESTC, PPI, SNNPRS (1998). Glossian Paellidipes Suppression: a model project in southern
nations, nationalities, and peoples regional state of Ethiopia 1995-1997. Addis Ababa. James WP and Schofield EC (1990). Human energy requirements: a manual for planners and
nutritionists. Oxford: Published for FAO by Oxford University Press. Kebebew F (1999). HIV/AIDS and children in Ethiopia. In: Ethiopian Public Health Association.
Addis Ababa: Public Health meeting. Khin-Maung U, Myo-Khin, Nyunt-Wai, Nyi-Win-Hman,Thein-Thein-Myint, Butler TC (1994). Risk
factors for persistent diarrhoea and malnutrition in Myanmar children I: Socio-anthropological risk factors. J Trop Pediatr 40:41-48.
King FS, Burgess A. (1998). Nutrition for Developing Countries. Oxford: Oxford Medical Publications.
Lönnerdal B, Forsum E, Gebre-Medhin M, Hambraeus L (1976). Breast milk composition in Ethiopian and Swedish mothers. II. Lactose, nitrogen, and protein contents. Am J Clin Nutr 29:1134-1141.
Martorell R, Rivera J, Kaplowitz H, Politt E (1992). Long-term consequences of growth retardation during early childhood. In: Hernandez M, Argente J, eds. Human Growth: Basic and clinical aspects. Amsterdam: Elevier Science Publishers B.V.

100
McCabe JT (1996). The ecological and cultural significance of livestock in the enset agricultural complex. In: Abate T, Hiebsch C, Brandt SA, Gebremariam S, eds. Enset-based sustainable agriculture in Ethiopia. Addis Ababa: Institute of agricultural research.
MOH (1985). Report on the Rural Health Survey 1982/83 Vol.1. Statistical Bulletin No. 47. Addis Ababa: Ministry of Health.
Nida W (1996). The Gurage perception of enset. In: Abate T, Hiebsch C, Brandt SA, Gebremariam S, eds. Enset-based sustainable agriculture in Ethiopia. Addis Ababa: Institute of agricultural research.
NRNS (1992) Report on the National Rural Nutritional Survey, Core Module. Addis Ababa: Statistical Bulletin 113.
OPHCC (1984). Population and housing census preliminary report. Addis Ababa: Office of the Population and Housing Census Commission.
Pankhurst A (1996). Social consequences of enset production. In: Abate T, Hiebsch C, Brandt SA, Gebremariam S, eds. Enset-based sustainable agriculture in Ethiopia. Addis Ababa: Institute of agricultural research.
Perez-Escamilla R et al. (1995). Maternal anthropometric status and lactation performance in low-income Honduran population: evidence for the role of infants. Am J Clin Nutr 61:528-534.
Politt E, Gorman KS, Engle PL, Martorell R, Rivera J (1993). Early supplementary feeding and cognition. Monographs of the Society for Research in Child Development 58:1-99.
Reddy V (1991). Body mass index and mortality rates. Nutrition News, 12. Hyderabad: National Institute of Nutrition.
Sachdev HPS, Krishna J, Puri RK, Satyanayana L, Kumar S (1991). Water supplementation in exclusively breastfed infants during summer in the tropics. Lancet 337:929-933.
Sandford J, Kassa H (1996). The effect of gender on resource contribution, decision making and influence: a comparison between enset and maize. In: Abate T, Hiebsch C, Brandt SA, Gebremariam S, eds. Enset-based sustainable agriculture in Ethiopia. Addis Ababa: Institute of agricultural research.
Scherbaum V (1996). Kwashiorkor: a severe form of protein-energy malnutrition in Nejo Clinic, West Wollega, Ethiopia. Hohenheim: PhD thesis University of Hohenheim.
Shack (1963). Some aspects of ecology and social structure in the enset complex in south-west Ethiopia. J Royal Anthropol Inst 93:72-79.
Smeds S (1955). The Ensete planting culture of Eastern Sidamo, Ethiopia. Acta Geogr Helsinki 13:1-39.
Smith LC, Haddad L (2000). Explaining child malnutrition in developing countries. A cross-country analysis. International Food Policy Research Institute. Research Report 111.
Spurr GB, Barac-Nieto M, Maksud MG (1977). Productivity and maximal oxygen consumption in sugar-cane cutters. Am J Clin Nutr 30:316-321.
Tabeb, HN (1992). Prevalence of Nutritional Anaemia in Women and Children of Childbearing Age Groups in Ethiopia. Addis Ababa: Ethiopian Nutrition Institute.
Taffesse S, Grazia M, Girma W (1999). Maternal energy and macronutrient insecurity in an ensete-corn staple village of Southern Ethiopia. Ethiop J Health Dev 13:285-90.
UNICEF (1993). Children and Women in Ethiopia. A situation report. Addis Ababa: United Nations Children’s Fund.
UNICEF (1993a). Breastfeeding. Facts of life. United Nations Children’s Fund. UNICEF (1998). The state of the world’s children 1998. Oxford University Press, Oxford. UNICEF (1999). Annual Report 1999. http://www.unicef.org/ar99/ UNICEF (1999a). Breastfeeding: Foundation for a healthy future. UNICEF/92-0384/Lemoyne. UNICEF (2000). The state of the world’s children 2000. Oxford University Press, Oxford.

101
Victora CG, Fuchs SC, Flores A, Fonseca W, Kirkwood BR (1994). Risk factors for pneumonia in a Brazilian metropolitan area. Pediatr 93:977-985.
Waterlow JC (1972). Classification and definition of protein calorie malnutrition. Brit med J 3:566-569.
Wellcome Trust Working Party (1970). Classification of infantile malnutrition. Lancet 2:302-303. Westerphal E (1975). Agricultural systems in Ethiopia. Agric Res Pap 826. Joint pub of College of
Agric, Haile Sellassie I University, Ethiopia and Agriculture University Wageningen, the Netherlands, Centre for Agricultural Publication and Documentation, Wageningen.
WHO (1985). Energy and Protein Requirements. Report of a Joint FAO/WHO/UNU Expert Consultation. Geneva: WHO Technical Report Series 724.
WHO (1991). Breast-feeding and the use of water and teas. Division of Child Health and Development. Geneva: World Health Organization.
WHO (1995). Breast-feeding and the use of water and teas. Geneva: Division of Child Health and Development Update No. 9. Geneva: World Health Organization.
WHO (1998). Complementary Feeding of young children in developing countries: a review of current scientific knowledge. WHO/NUT/98.1.
WHO (1999). Management of severe malnutrition: a manual for physicians and other senior health workers. Geneva: World Health Organization.
WHO (2000) Working Group on the Growth Reference Protocol, WHO Task Force on Methods for the Natural Regulation of Fertility. Growth patterns of breastfed infants in seven countries. Acta Paed 89:215-222.
WHO/NHD/00.1 and WHO/CAH/00.6 (2000). Complementary feeding – Family foods for breastfed children. Geneva: Department of Nutrition for Health and Development, WHO.
Zewdie S (1999). Co-fermentation of kocho with barley for an improved injera. Ethiopia. In: Ethiopian Public Health Assiciation. Addis Ababa: Public Health meeting.

Nutrition Baseline Survey in the Bio-village Project page 1 Survey team: |__| HH-No.: |__|__|__|
9 Appendix AP Anthropometry Mother: (start with the mother, when possible) Name
Age [years] ............. years
Pregnant
If pregnant, which month ? .............. No of months
Lactating
Weight ................... kg
Height .................... cm
Goitre
TB
Children (Start with the oldest child below 5 years and end with the youngest child)
SN ............ SN ............ SN ............ SN ............ Name
Name
Name
Name
Weight (kg) kg kg kg kg
Height (cm) cm cm cm cm
Oedema
If oedema, where are they ?
Bitot spots
ARI (cough, running nose, soar throat)
Epiglottis (cultural taboo)
Otitis media (ear infection)
Vomitting
Diarrhoea (> 3 watery stools/day)
Eye infection
Scrabis (skin disease)
Burn, fracture, wound
Fever
Worms
Number of times the child has been weight
Number of times the child has been vaccinated

Nutrition Baseline Survey in the Bio-village Project page 2 Survey team: |__| HH-No.: |__|__|__|
Nutrition Baseline Survey 2000 Household No. |__|__|__| Interviewer |__| A] Rahel
B] Dawit C] Adanech D] Fetlework
E] Tsige F] Yenenesh 7] 8]
Date of the survey (Day, month, year; e.g. 19/05/00)
___/___/___
Village |__| 1] Mamede
2] Luke 3] 4]
5] 6] 7] 8]
Part of village |__| Are all forms completed ? |__| 1] Yes
2] Refusal 3] Not at home 7] Other
The questionnaire shall be addressed to one mother in the household with at least one child below 5 years. If there is more than one mother, the index mother should be randomly selected.

Nutrition Baseline Survey in the Bio-village Project page 3 Survey team: |__| HH-No.: |__|__|__|
A Household Please begin to fill in the table with the family of the index mother starting with the head of the family (father or mother) followed by all children of the index mother. Please also write down and mark, if any of the family members have already died and for children at which age. Then fill in the empty columns for all the other family members. A B C E F G H I
SN Name Family status
Age Education Earning money
Occupation Stay in the HH
1 2 3 4 5 6 7 8 9 10 11 12 13 14
C E F G Family status Age Education Earning money
during the last 3 months Please mark the head of the household F = Father M = Mother S = Son D = Daughter
Age in years 88] Don’t know 99] No answer
0] None (can not read and write) 1] Adult literacy programme participation Number of school years completed 99] No answer
0] Earns no money 1] Daily income 2] Monthly income (regularly) 9] No answer
H I
Occupation of the father for earning money
(during the last 3 months)
Occupation of the mother for earning money
(during the last 3 months)
Duration of months of the person living the HH per year
Occupation besides farming 0] None 1] Selling (e.g. chat) 2] Merchant / trader 3] Carpenter / black smith/ well digger/ sculpture 4] Guard 5] Herder 6] Transporter 7] Government worker 8] Worker in an NGO 77] Other (specify) 99] No answer
Occupation besides farming 10] None 11] Selling 12] Small merchant 13] Preparation of local alcohol 14] Craft worker / potter 15] Daily worker 16] Waiter / cook 17] House servant 18] Government worker 77] Other (specify) 99] No answer
0] Moved away 1] Stays in the HH less than half a year (<6 months) 2] Stays in the HH more than half a year (> 6 months) 3] Stays permanently in the HH 4] Died 99] No answer

Nutrition Baseline Survey in the Bio-village Project page 4 Survey team: |__| HH-No.: |__|__|__|
B Characteristics of all children below 5 years Copy the names of all children below 5 years from the beginning of the questionnaire
A B D E F Name Growth and
Immunization chart
Date of birth Duration of exclusively BF
(months)
Duration of BF in total
(months/years) 1 2 3 4
B D E F
Growth and immunization chart
Date of birth Duration of exclusively BF
Duration of BF in total
Please ask the mother to show you the charts. 0] No chart 1] Yes, but mother didn’t show 2] Yes, mother showed 9] No answer
Copy the date of birth from the growth chart, if possible (day/month/year). Use local seasonal calendar if necessary; if the day is not known, try to ask whether the child was born at the beginning, the middle, or the end of the month. Mark with *, if the birth date is only estimated.
Time in months from birth on when the child receives nothing besides breast milk on a regular basis. 77] Still exclusively breast feeding
Time in months (or years) during which the child receives breast milk including exclusively breast feeding and complementary feeding. 77] Still breast feeding
C Characteristics of the index child Please take the youngest present child above 8 mo of age which is not exclusively breast fed. All further questions are addressed to this child.
Name of the child: ...................................................... How many hours after birth did you start with breast feeding ? 0] Did not breast feed at all
1] Immediately (after 1 hour or less than 1 hour) 2] During the first 24 hours 3] 1 to 3 days after birth 4] More than 3 days after birth
7] Other ...................................... 8] Don’t know 9] No answer
Did you offer pre-lacteal fluids (e.g. water, water with sugar) or food (e.g. butter) before introduction of breast feeding?
0] No 1] Yes 8] Don’t know 9] No answer
What kind of pre-lacteal fluids or foods did you offer before breast feeding?
0] Nothing 7] Other ........................... 1] Plain water 8] Don’t know 2] Water with sugar 9] No answer 3] Butter Did your child receive the first milk which comes from the breast
(use the local name for colostum: engora) ? 0] No
1] Yes 8] Don't know 9] No answer

Nutrition Baseline Survey in the Bio-village Project page 5 Survey team: |__| HH-No.: |__|__|__|
What type of special child food did you start to give to your child after the time of exclusively breast
feeding ? 0] Immediately family food 8] Other..................... 1] Commercial foods 9] No answer 2] Diluted cow milk 3] Pure cow milk 4] Butter 5] Thin porridge from bulla,
sorghum or other
6] Tea / water 7] Fruits How many months / years after birth did you start to give family food
regularly to your child ? _______ mo
0] Did not start yet 88] Don't know 99] No answer
Did you ever introduce bottle feeding for this child ? 0] No
1] Yes 9] No answer
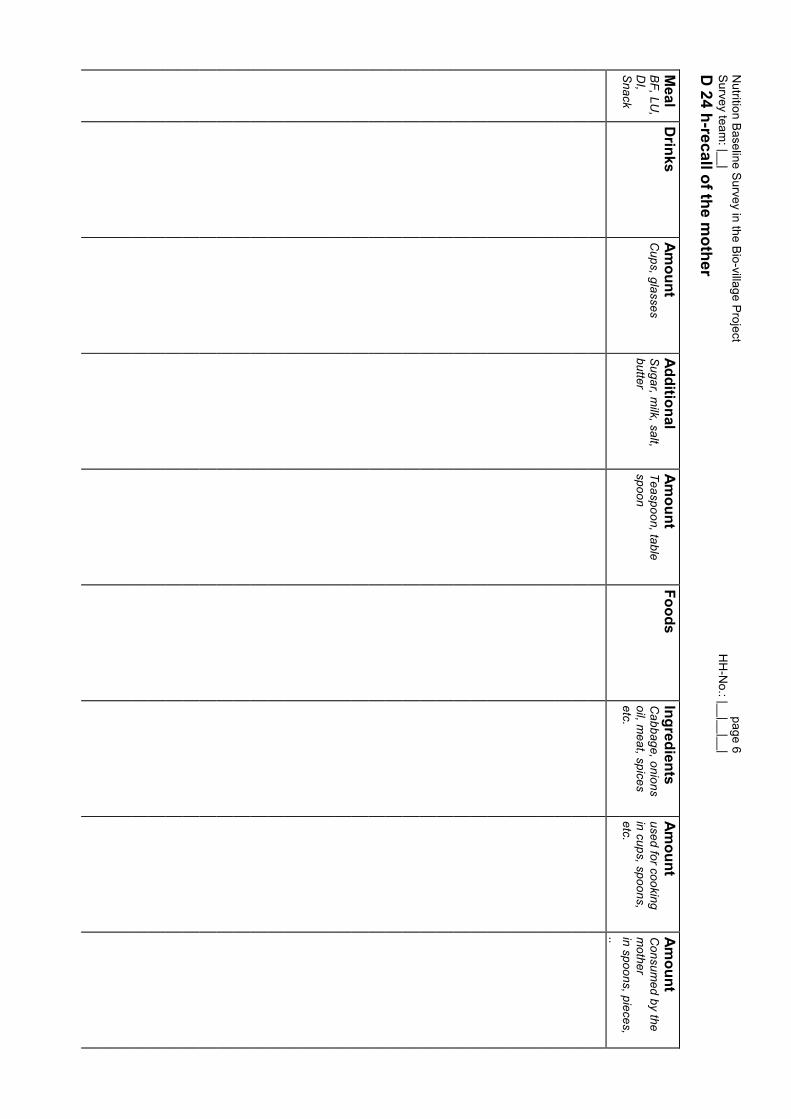
Nutrition Baseline Survey in the Bio-village Project
page 6
Survey team: |__|
H
H-N
o.: |__|__|__| D
24 h-recall of the mother
Meal
BF, LU,
DI,
Snack
Drinks
Amount
Cups, glasses
Additional Sugar, m
ilk, salt, butter
Amount
Teaspoon, table spoon
Foods Ingredients C
abbage, onions oil, m
eat, spices etc.
Amount
used for cooking in cups, spoons, etc.
Amount
Consum
ed by the m
other in spoons, pieces, ..

Nutrition Baseline Survey in the Bio-village Project
page 7
Survey team: |__|
H
H-N
o.: |__|__|__| 24 h-recall of the child M
eal BF, LU
, D
I, Snack
Drinks
Amount
Cups, glasses
Additional Sugar, m
ilk, salt, butter
Amount
Teaspoon, table spoon
Foods Ingredients C
abbage, onions oil, m
eat, spices etc.
Amount
used for cooking in cups, spoons, etc.
Amount
Consum
ed by the m
other in spoons, pieces, ..

Nutrition Baseline Survey in the Bio-village Project page 8 Survey team: |__| HH-No.: |__|__|__|
E Food consumption pattern of the index child Did your child receive any of the following foods during the last seven days ?
If yes, how often ? Foods given No Yes If yes, how many
times in the last 7 days ?
Any foods made from TIRATERIE e.g. SINDIE, GEBS, TEFF, MASHILLA, BEKOLLO
Any food made from AZRETE (BAKELA, MISER, ATER, OCHOLENIE)
Any foods made from ATAKELTE like GOMEN, CARROT, TIMATIM, KEYSIR, DUBA
Any food made from DINISCH, BOYE, GODERE Any FIRAFIRIE (MANGO, PAPAYA, AVOCADO, MUZ,
BIRTIKUAN, ZEYETUNE)
Any YEDUR FIRIE (e.g. GEZA, DOKMA) WOTETNA YEWOTET TEWATSEO (AYIB, KIBIE) ENKULAL SIGA (from KEBT, FIYEL, DORO) F Mother To which religious community do you (the mother) belong to ? 1] Muslim
2] Orthodox 3] Protestant 4] Catholic 5] Traditional believe
7] Other .......................... 9] No answer
How old were you, when you married ? Age _________ 88] Don’t know
99] No answer
Did you go to a health service for a check up during your last pregnancy ? 0] No
1] Yes 9] No answer
Did you have a special feeding ceremony the weeks after birth ? 0] No
1] Yes 9] No answer
If yes, how many weeks did you receive special food ? Time __________ 0] No special food
99] No answer
What kind of special food did you receive ? |__| 0] No special food 1] Porridge made
from ......................... 8] Other
................................
2] Soup prepared from .............................
9] Don’t know
3] AYIB 10] No answer 4] KIBIE 5] GOMEN 6] SIGA 7] FIRAFIRIE If yes, how many weeks did you rest and stay inside the house ? Time _____________ 0] No time for rest
99] No answer

Nutrition Baseline Survey in the Bio-village Project page 9 Survey team: |__| HH-No.: |__|__|__|
Who is normally responsible for collecting water ? 1] Mother 7] Other 2] Father 9] No answer 3] Female children 4] Male children 5] Male and female
children
How much time does it take to collect water per day ? (time in minutes or hours)
Time ______________
88] Don’t know 99] No answer
Do you receive support and who gives you support, When you are ill 0] No When you need to borrow money 1] From family members When you need to go away from your house
(e.g. collecting water, going to the market) 2] From relatives
3] From neighbours Other .............................. 4] From friends 7] From others .....................
9] No answer G Agricultural production How large is your farming area (wedero; zing) ? Length __________
Width __________Measurement __________
0] No farming area 88] Don’t know 99] No answer
Did you cultivate the following crops during the last harvest season, if yes for own consumption or for
sale? Crops No Mainly
own use Mainly sale
Own use + sale
No answer
ENSETE BEKOLO TIRATIRIE (BAKELA, MISER, ATER) TEFF SINDIE/ GEBS/ MASHILLA BUNA CHAT GESHO Other .............................. Did you cultivate the following vegetables during the last harvest season, if yes for own consumption
or for sale? Vegetable / leaves No Mainly
own use Mainly sale
Own use + sale
No answer
GOMEN SELATA DINISCH, BOYE, GODERE TIMATIM, CARROT, KEYSIR, DUBA BERBERIE Other ..............................

Nutrition Baseline Survey in the Bio-village Project page 10 Survey team: |__| HH-No.: |__|__|__|
Do you grow the following fruits, if yes for own consumption or for sale? Fruits No Mainly
own use Mainly sale
Own use + sale
No answer
BIRTUKAN LOMI MANGO MUZ PAPAYA AVOCADO Other .............................. Do you raise the following livestock ? If yes, for own consumption or for sale ? Animal species No Mainly
own use Mainly sale
Own use + sale
No answer
Numb. of animals
LAM WOYFEN / BERIE TIJA AHYA / BEKLO / FERES FIYEL DORO Do you have or produce the following products regularly, if yes for own consumption or for sale? Animal products No Mainly
own use Mainly sale
Own use + sale
No answer
WOTET KIBIE AYIB MAR Other .............................. Would you take part in a similar survey like this one ? 0] No
1] Yes 3] Only if (give reason) ............................................................................
Are you interested in a discussion on the findings of this survey ? 0] No
1] Yes 3] Eventually