head total-return investing: an enduring solution for low ... · 3 the benefits of a total-return...
TRANSCRIPT

Vanguard Research September 2014
Head
Vanguard Research January 2016
■■ Investment portfolios generally have two forms of return. A natural yield that is paid out in the form of dividends and interest and a capital return that comes from growth of the assets over time. Many retirees focus on the natural yield, or income return, as the foundation for what they have available to spend, which has become particularly challenging in recent years with yields for most traditional investments at historically low levels.
■■ As a result, retirees and other income sensitive investors may be tempted to reallocate to higher-yielding investments, such as non-traditional bonds (high yield, emerging market, or strategic bond funds), property investments (both public and private market), and equity-income strategies. This can increase the portfolio’s risk profile and may not be in the investor’s long-term best interest.
■■ Constructing a portfolio based on total return, as opposed to only its income, has several advantages, including maintaining diversification (factor exposures) and control over the size and timing of withdrawals, as opposed to the income portion being driven solely by the portfolio’s natural yield. This allows the portfolio to be more tax-efficient and can increase the portfolio’s longevity.
Total-return investing: An enduring solution for low yields
Todd Schlanger CFA, Colleen Jaconetti CPA CFP, Peter Westaway PhD, Ankul Daga CFA

2
Building an investment portfolio for retirement income
Vanguard has four core investment principles that underline our investment philosophy and form the basis for which we construct investment portfolios. First, create clear, appropriate investment goals. Second, develop a suitable asset allocation using broadly diversified funds. Third, minimise investment costs, and fourth, maintain perspective and long-term discipline. These principles apply both for an investor accumulating assets and for those in the drawdown phase of their life-cycle.
For many retirement investors, a target spending rate of 4% has traditionally been used as a baseline for developing a sustainable level of retirement income.1 We will use 4% as a spending target example for the purposes of this paper, although in practice every investor will have their own unique spending needs in retirement.
When it comes to building an investment portfolio for investors in the drawdown phase of their investment life cycle, there are generally two approaches: the income-focused approach and the total-return approach. With an income-focused approach, the investor constructs a portfolio with a natural yield (dividends + interest) consistent with their spending objective so their asset allocation and diversification decisions are driven primarily by the natural yield of the investments they select rather than the investor’s time horizon, risk tolerance and financial goals. The diversification, costs, and asset allocation of this portfolio may vary over time depending on market conditions. With a total-return approach, the investor constructs a portfolio based on a holistic view of the portfolio, matching the asset allocation to their risk-return profile, uses diversified investments, minimises costs, and remains disciplined with the implementation of the strategy over time.
1 A 4% initial spending target is a reasonable starting point for investors with a broadly diversified portfolio (see Bruno, Jaconetti, and Zilbering, 2012).
0
1
2
5
4
3
6
7%
Portfolio A
Tota
l ret
urn
Portfolio B
Income return
Figure 1: Total-return mix examples
Source: Vanguard. Illustration only. Does not represent returns of an actual portfolio
Capital return
Box A: An introduction to total-return investing
Investment portfolios generally have two forms of return. A natural yield that is paid out in the form of dividends and interest and a capital return that comes from growth of the assets over time. Together, these two returns combine to form the portfolio’s total return, and depending on the yield on assets in the portfolio, anywhere from all or none of the portfolio’s total return can be derived from its natural yield. To illustrate this point, in Figure 1, we show two portfolios. Portfolio A earned a 4% income return and 2% capital return. Portfolio B earned an income return of 2% and a capital return of 4%. Both portfolios, however, earned the same total return of 6% and have the same amount of assets available to be spent. Yet, an income-focused investor is likely to find the portfolio with higher income return (portfolio A) more appealing. This simple example illustrates the importance of considering both forms of return when analysing investment portfolios.

3
The benefits of a total-return approach to investing
For investors who are in the asset-accumulation stage of their life-cycle, it should be natural to think in terms of total-return investing. During the accumulation phase, all income received into the portfolio in the form of dividends paid on equities or coupons paid on bonds should be immediately (and ideally automatically) paid back into the underlying funds in order to maximise long-term returns.
However, for many investors, the decision of when to retire includes achieving a “savings target” which is an approximate target portfolio balance that the investor believes will allow them to support their needs in retirement. Many investors spend a majority of their careers focused on this target; so once retired, it can be difficult for investors to spend an amount from their portfolio that would result in their portfolio balance dropping below the target – in other words, spend from their principal. Understandably, the result is that many retirees gravitate towards an income-focused approach without realising the possible implications.
To start with, income-focused and total return approaches are similar – that is, under each method, investors spend some or all of the income or natural yield generated by their portfolio. But when an investor needs to spend an additional amount from their portfolio, the approaches diverge. This additional spending can be achieved either by overweighting income-producing assets or by spending from the other piece of the total return, capital appreciation.
By focusing on the total return earned by the portfolio rather than its individual components – a total return approach provides several advantages compared with an income-focused method, such as:
• Maintains a portfolio’s diversification (factor exposures);• Allows more control over the size and timing of
portfolio withdrawals;• Allows the portfolio to be more tax-efficient;• Increases the portfolio’s longevity
Let’s consider each of these benefits in more detail.
Maintains portfolio diversification (or factor exposure)Diversification can be a powerful strategy for managing the risk of return volatility, allowing investors to establish portfolios with risk profiles that are consistent with their goals and preferences. Although every portfolio is subject to market risk, idiosyncratic risks are largely avoidable. Investors can potentially diversify away firm-, sector-, and style-specific risks by investing in funds that seek to track broad-market indices. Country specific risks (such as concentration, sector overweights, and the local interest rate environment) can also be diversified by adding exposure to non-UK equities and bonds and moving closer to a fully market proportional portfolio by following a total-return approach relative to income-focused that could result in a less diversified portfolio.
Allows more control over the size and timing of portfolio withdrawalsWith an income-focused approach, a retiree’s annual spending is dictated by the portfolio’s natural yield so the retiree has limited control over their annual spending amounts. On the other hand, investors following a total-return approach have more control over the size and timing of portfolio withdrawals relative to the income-focused approach because these investors are willing to spend from capital appreciation in the years where the yield on their portfolio falls below their required spending amount. Total-return investing also allows for a greater ability to implement flexible spending strategies by adjusting spending in proportion to the growth of their overall portfolio rather than by focusing on the income that it is yielding. The more investors can tolerate some short-term fluctuations in their spending, the more likely they are to achieve their longer-term investing goals. Investors can also fund their retirement income needs by selling assets that are overweight relative to their strategic asset allocation, decreasing the number (and cost) of actual rebalancing events.
Allows portfolio to be more tax-efficient For investors with taxable assets, one of the most significant costs when investing can be taxes incurred when an investor earns interest, dividends, or capital gains (taxes are not currently due on assets held in tax-advantaged accounts for these items).

4
When it comes to total-return versus an income- focused approach, taxes are likely to be an important consideration, particularly for a high net worth investor. Under current UK tax law for an additional rate tax payer, for example, dividends and interest are taxed at 37.5% relative to capital gains at 28% and there is an annual tax free capital gains allowance of £11,100.2 All else equal, the more favourable tax treatment for capital gains relative to dividends and interest means there are likely to be higher after-tax returns for an investor following a total-return approach.
Increases the portfolio’s longevityAs a direct result of minimising the impact of taxes and maintaining more control over when and how much is withdrawn from the portfolio, investors can increase the length of time that the portfolio is able to meet their spending needs. Therefore, by minimising taxes and maintaining control over spending, the longevity of the portfolio increases and risk of running out of money decreases.
The appeal and challenges of income-focused investing
Traditionally, many investors have used an income-focused approach to meet their retirement income needs. Some of this has to do with the portfolio imposing discipline on withdrawals and the
administrative convenience. Since the income-focused investor is only using the portfolios natural yield, the portfolio determines both the amount and timing of withdrawals. Additionally, the ease of implementation means that there is no need to develop a spending strategy. The preference for an income-focused approach is also rooted in a belief that by spending only the portfolio’s natural yield, investors will preserve capital and stand a smaller chance of running out of money in retirement. We have discussed this point in more detail later on in this paper, under the dividend-paying equities section.
The challenge for an income-focused investor is that yields on traditional bond and balanced portfolios have fallen over the past 25 years, as shown in Figure 2. In today’s environment, the yields on the global bond markets and globally diversified 60% equity / 40% bond portfolio hover around 2%. For an income-focused investor, using the portfolio’s natural yield as a guide for how much to spend would have a shortfall of around 50% relative to a 4% spending goal. This spending gap can be resolved either by overweighting income-producing assets or by spending from the other piece of the total return, capital appreciation. Choosing to close the gap by over-weighting higher-income producing assets involves risks that may have the opposite of the intended consequence, that is, instead of preserving capital, they could be putting it at jeopardy.
2 Going forward, if current proposals for the April 2016 tax year are adopted, capital gains would continue to have a potential tax advantage relative to dividends. Along with the dividend tax free allowance of £5,000 being discussed (less than half the £11,100 for capital gains), tax rates on dividends for additional rate payers would increase to 38.1%.
Yie
ld
0
2
4
6
10
12%
Global bonds 60% global developed market equity / 40% global bond
8
1990 1993 1996 1999 2012 2015
4% spending target
Figure 2: Low yields on traditional investments present a challenge for income-focused investors
Past performance is not a reliable indicator of future results.Notes: Global bonds represented by the Barclays Global Aggregate Index and global equities represented by the MSCI World Index. Data runs to 30 September 2015.
Source: Vanguard calculations, using data from Macrobond.

5
The risks of reaching for higher yield
Although investors can use various ways to try and increase the income return or natural yield from their portfolios, this section focuses on three segments of the market with attractive yields in today’s environment, as shown in Figure 3.
• Non-traditional bonds, such as high yield, emerging market, and strategic bond funds.
• Property investments (both public and private market)
• Income oriented equity strategies (funded from bonds and/or equities)
Overweighting the above asset classes would improve the natural yield of the portfolio and help resolve the spending gap arising due to the secular decline in bond yields, however, careful evaluation reveals unintended risks.
Allocating to non-traditional bondsHigh yield, emerging market, and strategic bond funds can offer attractive yields when compared to more traditional investment-grade bonds, as shown in Figures 2 and 3. These yields offer potential compensation for the additional risks involved. In the case of high yield bonds, their sub-investment grade ratings indicate a higher probability of default. For bonds issued by emerging market governments and corporations, investors face other non-traditional forms of risk, such as risks stemming from a less developed political system and fluctuations in emerging market currencies (Philips and et al., 2013). Strategic bond funds are run by active managers who have a duel mandate of offering an attractive yield (by investing in assets such as high yield and emerging market bonds)
and timing interest rates through duration strategies (see text Box B for more information on the difficulty of timing interest rates). Typically, hedged global bonds, which are predominantly investment grade and government bonds, tend to show a low correlation to global equities. Considering the higher risk involved, non-traditional bonds tend to behave more like equities, as demonstrated by their much higher correlation with global equities than hedged global investment-grade bonds, as shown in Figure 4. Therefore, non-traditional bonds do not diversify the same way as traditional bonds and allocating to them could be considered comparable to changing the asset allocation (equity/bond mix) of the portfolio.
Yie
ld
0
8
4
16
20%
Global high yield EM bonds UK equity income UK property £ Strategic bond
12
20052004 2006 2007 2008 2009 2010 2011 2012 2013 2014 2015
4% spending target
Figure 3: Yields for riskier market segments have been attractive
Past performance is not a reliable indicator of future results.Notes: Period covers 1 January 2004 to 30 September 2015. UK equity income defined as the FTSE 350 High Yield Index, Global REITs are defined as the FTSE World REIT Index, UK property is defined as the IPD Index, global high yield is defined as the Barclays Global High Yield Index, EM bonds are defined as the Barclays Hard Currency Index, £ strategic bond is defined as the median return from the Morningstar Database. All returns are in sterling terms with income reinvested.
Source: Vanguard calculations, using data from Thomson Reuters Datastream, Macrobond, Barclays Capital and Morningstar, Inc.
Figure 4: Non-traditional bonds have higher correlation with equities than bonds, 1995 to 30 September 2015
Notes: Period covers 1 January 2004 to 30 September 2015 for global high yield and emerging market bonds, global equities, and global bonds (hedged). *Strategic bonds cover the 10 years ending September 30, 2015. Global high yield is defined as the Barclays Global High Index and emerging market bonds are defined as the Barclays USD EM Aggregate Index. Global equities are defined as the MSCI ACWI IMI Index, and global bonds (hedged) are represented by the Barclays Global Aggregate Index (hedged). Strategic bonds are defined as the fund representing the median 10-year return from the Morningstar Database.
Sources: Vanguard calculations, using data from Macrobond, Barclays Live, and Morningstar, Inc.
70%
50
3020100
40
60
Global high yield bonds
Emerging market bonds
Strategic bonds*
Global equities Global bonds (hedged)

6
Box B: Strategic bond funds and duration timing strategies
Aside from offering an attractive yield, many strategic bond funds have an objective of making changes to portfolio duration in anticipation of movements in interest rates and bond yields. In response to record low interest rates brought on by the global financial crisis, many of these funds had shortened duration in anticipation of rising interest rates over the coming years, however, over the course of 2014 yields unexpectedly declined (by 123 basis points for a 10-year Gilt) and this lead to a subsequent rally in long-term bonds. Unfortunately, investors in strategic bonds were short-duration and underperformed traditional bond market segments, as shown in Figure 5. For example, the median duration of a strategic bond in 2014 was 3.7 years (relative to 6.2 years in September 2007) and returned 5.8%, relative to 6.4 years and 7.9% for the Global Aggregate. Sterling Gilts, which were perceived as especially risky going into 2014 given their longer duration of 9.5 years in a rising interest rate environment, delivered a total return of 14.6%
Strategic bonds responded to the 2014 duration miss by lengthening their maturities over the course of the year and the median duration stood at 4.5 years as of 30 September 2015. Whether or not their duration positioning going forward is successful is unknown. However, what we do know is that timing movements in interest rates is notoriously difficult to do and especially in today’s environment, with unprecedented action by central banks such as quantitative easing. We also know that the costs associated with getting these duration calls wrong can be high.
Increasing exposure to property investmentsFigure 6 outlines the two most common forms of property investment. For investors who desire exposure to commercial real estate in a diversified, low cost, liquid, and transparent manner, Real Estate Investment Trusts (REITs) can provide an effective long-term proxy for the asset class (Phillips, 2011). However, in the short-term REITs are equities and will tend to perform accordingly. Around 2%3 of global broad market equities are invested in REIT shares, so most investors have some exposure to property already and the decision often centres on whether or not to overweight the equity sector. Since this paper is highlighting the potential risks associated with chasing yield, many of the points made in the next sections around high income equities would also apply to an overweight to REIT shares, since rules governing REITs stipulate that they pay out a high portion of their income as dividends, which results in a high dividend yield.
0246
16%
12108
14
Figure 5: Durations and total returns for bond segments in 2014
Note: Durations are for the median monthly duration in 2014 and annualised return of the median fund.2015 in GBP.
Source: Vanguard calculations, based on data from Barclays Live and Morningstar, Inc.
Return (%)
£ Stra
tegic
bon
ds
Global
corp
orat
es
Global
aggr
egat
e
Global
treas
uries
Sterlin
g gil
ts
Duration (years)
REIT sharesDirect property funds
Form of investment Purchase shares or comingled funds
Invest in comingled fund or partnership
Idiosyncratic risk More systematic High – subject to manager skill
Costs/time/ resources
Low High
Liquidity High Subject to limitations
Transparency High, consistent with equities
Low
Valuation frequency Daily (real time) Annual appraisal
Source: Vanguard.
Figure 6: UK property implementation options
Another way to invest in the property market that is popular in the UK is through direct property funds that manage physical commercial properties. While the yield on these portfolios can be attractive (as shown in Figure 3) and reported correlations to traditional asset classes can appear low (suggesting a diversification benefit), there are a number of other considerations and unconventional risks to consider. Unlike traditional investments (such as equities and bonds) that have publicly available indices that can be invested in wholly, no practical method of commercial property ownership
3 According to the MSCI AC World Index 2.2% if the index was invested in REIT shares as of 30 September 2015.

7
-60
-20
0
20
40
60
100%
80
Cum
ulat
ive
36
-mon
th r
etur
n
201120092007200520032000 2013 2015
-40
UK property Global bonds (hedged) Global equities
Figure 7: UK commercial property drawdown risk is more comparable to equities
Notes: UK property is defined as the IPD Index, global equity is represented by MSCI ACWI IMI Index; global bonds (hedged) are represented by the hedged Barclays Global Aggregate Index. Data runs to 30 September 2015.Source: Vanguard calculations, using data from Morningstar, Inc.
offers pure systematic exposure to the entire asset class. As a result, investors in private property pools must employ an active manager to select a sample of properties to hold. This means that the skill level of the manager is an important element to the portfolios success.
Over long periods4, the volatility of the IPD Commercial Property Index is around 3.7%, not much more than the 2.9% of hedged investment-grade global bonds, and markedly lower than the 15.4% of global equities. This leads many investors to feel as though commercial property can be used as a substitute for bonds in a balanced portfolio. However, commercial properties are subject to appraisal-based valuation, meaning their values are not known in real time. Common practice is to appraise the properties on an annual basis, leading to distorted risk metrics (volatility and correlation) with traditional asset classes that make them appear more favourable.
The smoothing effect of appraisal-based valuation can be seen in Figure 7 relative to both equities and bonds which are valued more frequently . You can also see how the drawdown and subsequent recovery during the global financial crisis lagged the public equity markets by around one year, and eventually fell further.5 Therefore, the 33% drawdown figure for UK property in the global financial crisis (shown in Figure 14 later), would likely have been higher, had the properties been valued in real time. This leads us to believe that drawdown risk may be a more accurate gauge of commercial property risk than volatility.
4 According to the indices in Figure 7 dating back to 1 January 1995.5 Drawdown risk is important even for a long-term investor as it can impact behaviour, causing an investor to change strategy in a way that reduces returns relative to what would
have been achieved otherwise.
A final consideration for UK property investment is the high costs associated with managing these pools, both in terms of the transaction costs needed to buy and sell properties and the ongoing charges such as expense ratios, which average 150 basis points, and high bid-ask spreads applied by some funds. It is also common for these funds to hold a significant cash position as a liquidity buffer, which can lead to a return drag. These factors tend to lead property funds to significantly underperforming the UK IPD Index that is often used as a benchmark for this asset class, as shown in Figure 8. In addition to this reported underperformance, investors may also need to accept front- and back-end loads (or entry and exit fees).
0%
-1
-2
-5
-4
-3
-61 year 3 year 5 year 10 year
Med
ian
exce
ss r
etur
n
-4.7%-4.5%
-3.8%
-3.0%
Figure 8: UK property funds tend to underperform significantly
Past performance is not a reliable indicator of future results.Notes: Median UK property fund excess return is relative to the IPD Index. Data runs to period ending 30 September 2015.Source: Vanguard calculations, using data from Morningstar, Inc.

8
0
400
600
800
1,000
£1,200
201020001990
200
UK equity income UK equities Global bonds
Figure 9: Income equities are not bonds: December 1997 – 30 September 2015
Past performance is not a reliable indicator of future results.Notes: Global equity market is represented by the total return of the FTSE All-Share Index; global bonds are represented by the total return of the Barclays Global Aggregate Index hedged; UK equity income is represented by the total return of the FTSE 350 High Income Index. Source: Vanguard calculations, using data from Macrobond.
Due to the high costs and idiosyncratic risks associated with managing property funds, it is often said that larger property funds tend to perform better because managers can construct a more diversified portfolio, lowering idiosyncratic risk. Larger size could also allow managers to be more nimble and take advantage of market opportunities. To test these claims, we analysed the largest ten commercial property funds available for sale in the UK. Each of these funds managed over £1billion as of 30 September 2015, and their total assets reflected 88% of the total pooled assets. We found that nine out of the ten funds underperformed over the past ten years, and the median excess return of the top ten funds was -2.9%. This was slightly better than the median of all funds shown in Figure 8, but they still earned less than half of the total return reflected by their benchmark IPD Index over the same period of 5.7%.
Increasing exposure to dividend-paying equitiesTwo general approaches are often advocated for using equities to provide income. The first approach would have investors shift some or all of their bond allocation into dividend-paying shares that provide a higher yield than bonds. Our concern with this approach is simply that equities are not bonds. Figure 9 shows the cumulative total returns for broad market and dividend-paying shares versus that of broadly diversified fixed income indexed to £100 going back to 1990. Clearly, for an investor who views fixed income as not just providing income but also diversification, dividend-paying shares were much more volatile.
The second rationale for investing in higher dividend-paying equities is that it is perceived that this subset of equities outperforms relative to other equities. But there is no good reason why a firm that is paying higher dividends should generate greater overall returns. This is because, at a fundamental level, the decision to pay, or not to pay, a dividend is a capital budgeting decision. If a company believes it can reinvest its cash in projects with positive net present value, it should do so, putting the cash to work to increase shareholder value. Otherwise, it might be in the company’s best interest to buy back some of its shares, thereby increasing the value of the remaining shares. In general, the total returns should not be positively or negatively affected by the actual payout. This is demonstrated in Figure 10, which shows the return associated with income and capital for all of the shares contained in the FTSE All-Share Index bucketed by the shares yield into four quartiles, ranging from the highest to lowest. Across the yield quartiles, the average returns were more similar than different, particularly for the top three quartiles, over the 25+ year period ending 30 September 2015.
10
8
6
4
2
0
12%
Quartile 1Highest
Quartile 4Lowest
Quartile 2 Quartile 3
Figure 10: Dividend payments are a capital budgeting decision
Notes: Data runs from 1 January 1990 to 30 September 2015.Source: Vanguard calculations, using data from Thomson Reuters Datastream.
Income return Capital return
9
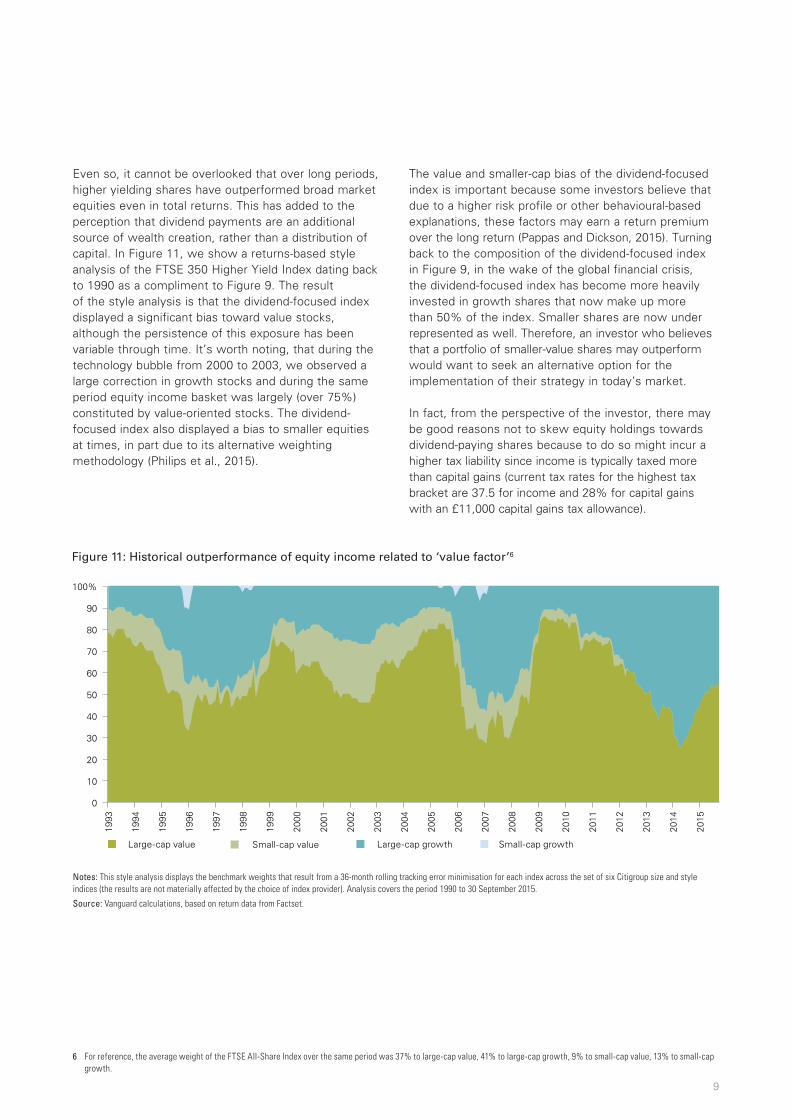
Figure 11: Historical outperformance of equity income related to ‘value factor’6
Notes: This style analysis displays the benchmark weights that result from a 36-month rolling tracking error minimisation for each index across the set of six Citigroup size and style indices (the results are not materially affected by the choice of index provider). Analysis covers the period 1990 to 30 September 2015.
Source: Vanguard calculations, based on return data from Factset.
100%
90
80
70
60
50
40
30
20
10
1993
1994
1995
1996
1997
1998
1999
2000
2001
2002
2003
2004
2005
2006
2007
2008
2009
2010
2011
2012
2013
2014
2015
0
Large-cap value Large-cap growthSmall-cap value Small-cap growth
6 For reference, the average weight of the FTSE All-Share Index over the same period was 37% to large-cap value, 41% to large-cap growth, 9% to small-cap value, 13% to small-cap growth.
Even so, it cannot be overlooked that over long periods, higher yielding shares have outperformed broad market equities even in total returns. This has added to the perception that dividend payments are an additional source of wealth creation, rather than a distribution of capital. In Figure 11, we show a returns-based style analysis of the FTSE 350 Higher Yield Index dating back to 1990 as a compliment to Figure 9. The result of the style analysis is that the dividend-focused index displayed a significant bias toward value stocks, although the persistence of this exposure has been variable through time. It’s worth noting, that during the technology bubble from 2000 to 2003, we observed a large correction in growth stocks and during the same period equity income basket was largely (over 75%) constituted by value-oriented stocks. The dividend-focused index also displayed a bias to smaller equities at times, in part due to its alternative weighting methodology (Philips et al., 2015).
The value and smaller-cap bias of the dividend-focused index is important because some investors believe that due to a higher risk profile or other behavioural-based explanations, these factors may earn a return premium over the long return (Pappas and Dickson, 2015). Turning back to the composition of the dividend-focused index in Figure 9, in the wake of the global financial crisis, the dividend-focused index has become more heavily invested in growth shares that now make up more than 50% of the index. Smaller shares are now under represented as well. Therefore, an investor who believes that a portfolio of smaller-value shares may outperform would want to seek an alternative option for the implementation of their strategy in today’s market.
In fact, from the perspective of the investor, there may be good reasons not to skew equity holdings towards dividend-paying shares because to do so might incur a higher tax liability since income is typically taxed more than capital gains (current tax rates for the highest tax bracket are 37.5 for income and 28% for capital gains with an £11,000 capital gains tax allowance).

10
10
0
20
30
50%
10%
32%
45%
40
Global stockindex fund
FTSE UK all shareindex unit trust
FTSE UK equityincome index fund
Figure 13: Concentration in top-ten holdings of three Vanguard index funds
Notes: Data as of 30 September 2015. Source: Vanguard.
Another commonly held view among equity income investors arises from a widespread belief that by spending only the portfolio’s natural yield and holding onto the fund units, investors will preserve their capital and reduce their chances of running out of money in retirement. We test this logic in Figure 12 by examining two portfolios with account balances of £100,000 and 1,000 fund units valued at £100 each. Both portfolios have had capital appreciation of £4,000, but Portfolio A pays a dividend of 4% (or £4,000), which the investor subsequently spends, ending up with an account balance of £100,000. Portfolio B has not paid a dividend, so in order to generate the same level of income as Portfolio A (£4,000), the investor would need to sell roughly 38 fund units. While it is understandable that by selling fund units an investor might feel as though they are depleting their capital, it is important to consider that the ending account balances of both portfolios are the same, despite the difference in fund units.
A final consideration for equity income investors is concentration risk. Prior Vanguard research (Westaway et al., 2013) has demonstrated the benefits of diversifying outside the UK within equities and bonds. One of the advantages of this is a reduction in concentration risk. We illustrate this risk in Figure 13 by showing the proportion of three Vanguard index funds invested in their
Equity Portfolio A
Beginning balance £100,000
Price £100
Units 1,000
Capital appreciation (4%) £4,000
Updated price £104
Interim balance £104,000
Dividend7 4%
Capital withdrawal8 0%
Account withdrawal (dividend) -£4,000
Account withdrawal (capital withdrawal) 0
Ending balance £100,000
Price £100
Units 1,000
Equity Portfolio B
Beginning balance £100,000
Price £100
Units 1,000
Capital appreciation (4%) £4,000
Updated price £104
Interim balance £104,000
Dividend7 0%
Capital withdrawal8 4%
Account withdrawal (dividend) 0
Account withdrawal (capital withdrawal) -£4,000
Ending balance £100,000
Price £104
Units 962
Source: Vanguard.
Figure 12: Account balances matter more than fund units
top ten holdings. The broadest global market index fund has a relatively small percentage in the top ten holdings of 10%. Concentration increases more than three times to 32% with the broad market UK index fund and even further to 45% with the UK equity income index fund. This also trickles down to sector biases, as dividend-focused portfolios tend to systematically underweight technology and financial shares and overweight consumer staples.
Higher yielding assets tend to increase drawdown risk
A clear way to illustrate the possible unintended consequences associated with allocating to higher yielding assets given the low yields on traditional
7 This return results in a reduction of price.8 Withdrawal from capital results in lower shares.

11
Income-focused strategyImpact on portfolio (relative to a broadly diversified market-cap weighted portfolio as the sub-asset class level)
Non-traditional bonds, such as high yield, emerging market and strategic bonds
Increase portfolio, volatility and drawdown risk. Strategic bonds also introduce active manager risk and can lead to opportunity cost.
Property investments (both public and private market) In public market, increase volatility and drawdown risk. In private market, less transparent, active manager and concentration risk, high cost and illiquid.
Income oriented equity strategies (funded from bonds) Increase volatility and drawdown risk, tend to be sector concentrated. Dividends do not create wealth in a way equivalent to interest payments.
Income oriented equity strategies (funded from equities)
Increase portfolio’s concentration, change factor exposure, increase potential for drawdown.
Source: Vanguard.
-60
20
10
0
-37%
-10
-20
-30
-40
-50
30%
Global
equit
ies
UK equit
y
Global
REITs
UK equit
y inc
ome
UK prop
erty
Global
high y
ield
EM bo
nds
£ Stra
tegic
bond
Global
aggr
egate
Global
treas
ury
Sterlin
g gilts
Figure 14: Cumulative total returns during the global financial crisis, 12 October 2007 to 9 March 2009.
Notes: Global equities are defined as the MSCI ACWI Index, UK equities are defined as the FTSE All-Share Index, UK equity income is defined as the FTSE 350 High Yield Index, commodities are defined as the S&P GSCI Index, global high yield is defined as the Barclays Global High Yield Index, EM bonds are defined as the Barclays Hard Currency Index, global REITs are represented by the Global Property Research World 250 REIT Index, UK property is represented by the CBRE UK Commercial Property Index, £ strategic bond is defined as the median return from the Morningstar Database from October 2007 to 28 February 2009, global corporate bonds are defined as the Barclays Global Corporate Index (hedged to GBP), global aggregate is defined as the Barclays Global Aggregate Index (hedged to GBP), global treasury bonds are defined as the Barclays Global Treasury Index (hedged to GBP), and gilts are defined as the Barclays Gilt Index. All returns are in sterling terms with income reinvested.Sources: Vanguard calculations based on data from Barclays, Macrobond, and Morningstar, Inc.
-47%
-33%-29%
-14%-11%
10%14%
18%
-45%
-56%
Figure 15: Summary of impacts on a portfolio from income-focused strategies
9 According to Vanguard calculations using cash flow data over the 5 years ending 31 August 2015, from Morningstar, £20.2 billion has gone into non-traditional bond strategies, £9.4 billion has gone into property investments, and $17.8 billion has gone into equity income strategies.
portfolios is to look back to a recent period of market stress, the global financial crisis, shown in Figure 14, when global and UK equities declined by -37% and -45%, respectively. There are three important takeaways from the figure. First, non-traditional bond segments (high yield, emerging market, and strategic bond funds), property investments (both public and private), and equity income strategies all suffered considerable losses. Second, it is notable that traditional investment-grade bonds that
contained government securities (global aggregate, global treasury and gilts) provided significant diversification and counter balancing over this period, delivering positive double digit returns. Third, given the significant cash flows that have gone into the three higher yielding categories since the global financial crisis9, it is possible that today investors are exposed to greater risk of drawdown, that is, collapse in capital value, than they were in the global financial crisis.

12
Total return outlook for a globally diversified portfolio
In Figure 16, we display the ten year real (inflation adjusted) return outlook for a traditional 60% equity / 40% bond portfolio that is globally diversified, as of 30 September 2015, from the Vanguard Capital Markets Model® (VCMM).10
A traditional 60% equity / 40% bond portfolio is highly diversified and has minimal credit, factor, duration, sector, and country specific risks. We show the outlook in a distribution to treat the future with the humility it deserves and recognise a large range of outcomes from negative 2.1% to positive 10.9%. The central tendency of this outlook is an annual return of 4.4%, down 60 basis points from long-term historical experience, however, nearly twice the real return that has been achieved since 2000.
For a total-return investor, the median real return from the outlook was slightly more than the 4% spending figure often targeted by retirement investors. In this scenario, and based on these assumptions, that means an investor could withdraw roughly 4% each year and maintain the real value of their portfolio through time. In other words, the capital value of the portfolio would not only be maintained, but would grow with inflation so that it would not lose its purchasing power. Since the portfolio has a natural yield of roughly 2%, the remaining income would be funded by harvesting capital appreciation.
10 VCMM is a proprietary financial simulation tool developed and maintained by Vanguard’s Investment Strategy Group. The VCMM uses a statistical analysis of historical data for interest rates, inflation, and other risk factors for global equities, fixed income, and commodity markets to generate forward-looking distributions of expected long-term returns. The asset-return distributions shown in this paper are drawn from 10,000 VCMM simulations based on market data and other information available as of 30 September 2015.
Median5th 25th 75th 95thHistory
1926–2014History
2000–2014
Percentiles
10
8
6
4
2
0
-2
-4
12%
-2.1%
1.7%
4.4%
7.0%
10.9%
5.0%
2.3%
Figure 16: Real (inflation adjusted) total return outlook for a traditional balanced portfolio, as of 30 September 2015.
Notes: Forecast displays the 5th/25th/75th/95th percentile range of 10,000 simulations from VCMM for projected real returns for balanced portfolios in GBP as of September 2014. The equity portfolio is 25% UK equity and 75% global ex-UK equity. The bond portfolio is 35% UK bonds and 65% global ex-UK bonds. For ex-UK bonds, hedging commences in 1955. Prior to 1955, no hedging/currency conversion is used because 3-month bill yields are unavailable, and the exchange rate between USD and GBP was fixed; thus, there is no forward rate to calculate. GBP/USD exchange rate calculated using history of fixed rate changes until 1957, when time series becomes available within Datastream.Source: Vanguard calculations, using data from Thomson Reuters Datastream, Barclays Live, Federal Reserve, Bank of England, Office for National Statistics, Moody’s Analytics Databuffet, OECD.
Conclusion
This paper explains why the total-return approach to investing has a number of benefits compared to an income-focused approach for any investor wishing to meet spending objectives as effectively as possible.
The current low-yield environment is leading many investors to focus on only one piece of their portfolio’s total return, namely, the income return. This focus may be encouraging investors to consider strategies such as reallocating to non-traditional bonds, property investments, and equity income strategies. Investors may adopt one or more of these strategies in the belief that they will be rewarded with a more certain level of income or less risk. Unfortunately, there may be a number of unintended consequences when moving away from a broadly diversified portfolio.
Concentrating on higher yielding sectors results in a less diversified portfolio, higher levels of risk, decreased tax-efficiency (for taxable investors), and/or an increased chance of falling short of long-term financial goals. On the other hand, as we discussed in this paper, a total-return approach potentially offers a number of portfolio benefits, including maintaining diversification, enhancing the portfolio’s tax-efficiency, allowing more focus on the size of the overall portfolio, and increasing the portfolio’s longevity.

13
References
Brinson, Gary P., L. Randolph Hood, and Gilbert L. Beebower, 1986. Determinants of Portfolio Performance. Financial Analysts Journal 42(4): 39–48
Brinson, Gary P., Brian D. Singer, and Gilbert L. Beebower, 1991. Determinants of Portfolio Performance II: An Update. Financial Analysts Journal 47(3):40–48
Bruno, Maria A., Colleen M. Jaconetti, and Yan Zilbering, 2012. Revisiting the ‘4% Spending Rule.’ Valley Forge, Pa.: The Vanguard Group.
Davis, Joseph, and Aliaga-Díaz, Roger, 2012. Vanguard’s Economic and Investment Outlook. Valley Forge, Pa.: The Vanguard Group.
Davis, Joseph, Roger Aliaga-Díaz, Donald G. Bennyhoff, Andrew J. Patterson, and Yan Zilbering, 2012. Deficits, the Fed, and Rising Interest Rates: Implications and Considerations for Bond Investors. Valley Forge, Pa.: The Vanguard Group.
Devaney, Steven, and Roberto Martinez Diaz, 2010. Transaction based indices for the UK commercial property market: exploration and evaluation using IPD data. University of Aberdeen and Investment Property Databank.
Donaldson, Scott J., and Frank Ambrosio, 2007. Portfolio Construction for Taxable Investors. Valley Forge, Pa.: The Vanguard Group.
Ibbotson, Roger G., and Paul D. Kaplan, 2000. Does Asset Allocation Policy Explain 40, 90 or 100 Percent of Performance? Financial Analysts Journal 56(1):26–33.
Jaconetti, Colleen J., and Mario A. Bruno, 2008. Spending from a Portfolio: Implications of Withdrawal Order for Taxable Investors. Valley Forge, Pa.: The Vanguard Group.
Pappas, Scott N., and Joel M. Dickson, 2015. Factor-based investing. Valley Forge, Pa.: The Vanguard Group.
Westaway, Peter, and Charles Thomas, 2013. Bond investing in a rising rate environment. Vanguard Asset Management, London.
Considerations for global equities: A UK investors perspective. Vanguard Asset Management, London.
Philips, Christopher B., David J. Walker, and Yan Zilbering, 2011. REITs: Effective exposure to commercial real estate? Valley Forge, Pa.: The Vanguard Group.
Philips, Christopher B., and Francis M. Kinniry Jr., 2012. The Theory and Implications of Expanding Traditional Portfolios. Valley Forge, Pa.: The Vanguard Group.
Philips, Christopher B., David J. Walker, and Francis M. Kinniry Jr., 2012. Dynamic Correlations: The Implications for Portfolio Construction. Valley Forge, Pa.: The Vanguard Group.
Philips, Christopher B., Donald G. Bennyhoff, Francis M. Kinniry Jr., Todd Schlanger, and Paul Chin, 2015. An evolution of smart beta and other rules-based active strategies. Valley Forge, Pa.: The Vanguard Group.
Philips, Christopher B., 2012. Worth the risk? The appeal and challenges of high-yield bonds. Valley Forge, Pa.: The Vanguard Group.
Philips, Christopher B., Joanne Yoon, Michael A. DiJoseph, Ravi G. Tolani, Scott J. Donaldson, and Todd Schlanger. Emerging market bonds— Beyond the headlines. Valley Forge, Pa.: The Vanguard Group.
Thomas, Charles and Peter Westaway, 2013. Why own bonds when yields are low? Vanguard. (Forthcoming).
Vanguard Group, The, 2003. Sources of Portfolio Performance: The Enduring Importance of Asset Allocation. Valley Forge, Pa.: The Vanguard Group.
Wallick, Daniel W., Neeraj Bhatia, Andrew S Clarke, and Raphael A. Stern, 2011. Shopping for Alpha: You Get What You Don’t Pay For. Valley Forge, Pa.: The Vanguard Group.
Westaway, Peter, Todd Schlanger, Christopher B. Philips, and Charles Thomas, 2013. Considerations for global equities: A UK investor’s perspective. Vanguard Asset Management, London.

14
Appendix: Implementation of a total-return approach to provide regular income
The following schematic shows how to implement a total-return approach to spending. You would first establish a spending account and meet spending needs through non-portfolio cash flows, such as pensions, annuities, and trust payments. Next, an investor would use the natural yield on the portfolio (interest and
dividends) to meet spending needs. If additional assets are needed, an investor would then sell assets and use capital gains to make up the gap between non-portfolio cash flows, natural yields and the targeted spending rate. To minimise transaction costs and taxes, best practices would be to sell overweight assets relative to their strategic asset allocation and therefore limit the number of future rebalancing events.
Portfolio natural yield:• Interest and dividends
The spending gap:• Capital gains
Non-portfolio cash flows:• State pension• Employer pension• Annuity payments• Trust
Spending account

15

VAM-2016-01-14-3253
Connect with Vanguard® > global.vanguard.com
Important information
This document is directed at professional investors in the UK only, and should not be distributed to or relied upon by retail investors. It is for educational purposes only and is not a recommendation or solicitation to buy or sell investments
The information on this document does not constitute legal, tax, or investment advice. You must not, therefore, rely on the content of this document when making any investment decisions.
The value of investments, and the income from them, may fall or rise and investors may get back less than they invested.
Vanguard Investment Series plc has been authorised by the Central Bank of Ireland as a UCITS and has been registered for public distribution in certain EU countries. Prospective investors are referred to the Funds’ prospectus for further information. Prospective investors are also urged to consult their own professional advisers on the implications of making an investment in, and holding or disposing shares of the Funds and the receipt of distributions with respect to such shares under the law of the countries in which they are liable to taxation.
The Manager of Vanguard Investment Series plc is Vanguard Group (Ireland) Limited. Vanguard Asset Management, Limited is a distributor of Vanguard Investment Series plc.
The Authorised Corporate Director for Vanguard Investment Funds ICVC is Vanguard Investments UK, Limited. Vanguard Asset Management, Limited is a distributor of Vanguard Investment Funds ICVC.
The Manager of Vanguard FTSE U.K. All Share Index Unit Trust (‘Trust’) is Vanguard Investments UK, Limited. Vanguard Asset Management, Limited is a distributor of Vanguard FTSE U.K. All Share Index Unit Trust.
For further information on the funds’ investment policy, please refer to the Key Investor Information Document (“KIID”).The KIID and the Prospectus for this fund is available in local languages from Vanguard via our website https://global.vanguard.com/.The Key Investor Information Document (“KIID”) and the Prospectus for Vanguard FTSE U.K. All Share Index Unit Trust is available in English, on request, via [email protected] or telephone 0800 032 3731.
Issued by Vanguard Asset Management, Limited which is authorised and regulated in the UK by the Financial Conduct Authority.
© 2016 Vanguard Asset Management, Limited. All rights reserved.