he experience on investor behavior
TRANSCRIPT

THE EFFECTS OF EXPERIENCEON INVESTOR BEHAVIOR
Evidence from India’s IPO Lotteries
Santosh AnagolWharton
Vimal BalasubramaniamOxford
Tarun RamadoraiOxford and CEPR
November 2015

Motivation
I Standard economic models predict negligible role for personalexperience in future decision making.
I Especially in high public information environments (e.g., stockmarket).
I Newer models explore implications of personal experience:I Reinforcement learning - Roth and Erev (1995).
I Reference dependent risk-attitudes - Koszegi and Rabin (2007).
I Empirical literature suggests personal experience is important:I Long-term: Experiences of Great Depression lowers risk-taking -
Malmendier and Nagel (2007).I Short-term: Portfolio experiences correlate with future decisions -
Barber and Odean (2013).
I Challenge: Personal experiences are endogenous with observedchanges in behaviour.
I Changing skill, beliefs, preferences, rational learning.
Anagol et. al. (2015) 2/19

This Paper
I New research design to estimate experience effects.I Randomized variation in portfolio experiences from Initial Public
Offering (IPO) lottery outcomes.I IPO lottery method could be applied to many other contexts.
Countries: Brazil, China, Germany, Hong Kong, Singapore, Sweden, Taiwan; U.S.
brokerages (TD Ameritrade, Fidelity).
I New facts on how experiences cause changes in investmentbehavior.
I Very high level of detail allows precise estimates of heterogeneouseffects; better understanding of mechanisms:
I Across stocks: Spillover effects to rest of portfolio (“within portfoliocontagion").
I Strength of the experimental approach, greater confidence as domain ofeffects widens.
I Across (1.5 MM) investors: Effects significant even with smalltreatments for large/experienced investor portfolios.
Anagol et. al. (2015) 3/19

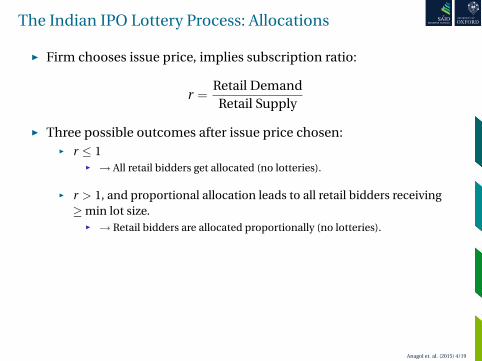
The Indian IPO Lottery Process: Allocations
I Firm chooses issue price, implies subscription ratio:
r =Retail DemandRetail Supply
I Three possible outcomes after issue price chosen:I r ≤ 1
I → All retail bidders get allocated (no lotteries).
I r > 1, and proportional allocation leads to all retail bidders receiving≥min lot size.
I → Retail bidders are allocated proportionally (no lotteries).
I r >> 1 and proportional allocation leads to retail bidder receiving <min lot size
I → Lotteries used so that winners get min lot size, losers get nothing.I Analysis focuses solely on this relatively common case.I Mean subscription rate in our 54 IPO sample is 12.
Anagol et. al. (2015) 4/19
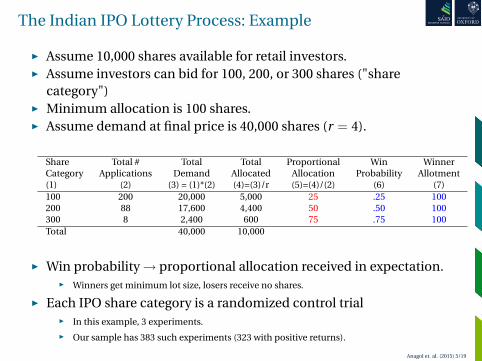
The Indian IPO Lottery Process: Example
I Assume 10,000 shares available for retail investors.I Assume investors can bid for 100, 200, or 300 shares ("share
category")I Minimum allocation is 100 shares.I Assume demand at final price is 40,000 shares (r = 4).
Share Total # Total Total Proportional Win WinnerCategory Applications Demand Allocated Allocation Probability Allotment(1) (2) (3) = (1)*(2) (4)=(3)/r (5)=(4)/(2) (6) (7)100 200 20,000 5,000 25 .25 100200 88 17,600 4,400 50 .50 100300 8 2,400 600 75 .75 100Total 40,000 10,000
I Win probability→ proportional allocation received in expectation.I Winners get minimum lot size, losers receive no shares.
I Each IPO share category is a randomized control trialI In this example, 3 experiments.
I Our sample has 383 such experiments (323 with positive returns).
Anagol et. al. (2015) 5/19
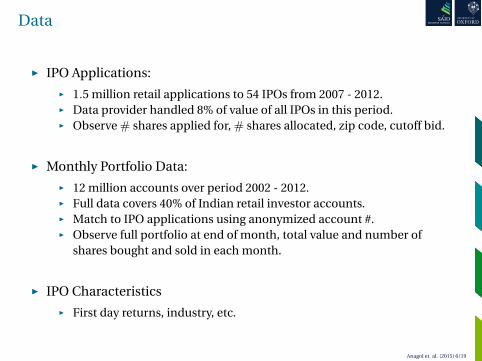
Data
I IPO Applications:
I 1.5 million retail applications to 54 IPOs from 2007 - 2012.I Data provider handled 8% of value of all IPOs in this period.I Observe# shares applied for,# shares allocated, zip code, cutoff bid.
I Monthly Portfolio Data:
I 12 million accounts over period 2002 - 2012.I Full data covers 40% of Indian retail investor accounts.I Match to IPO applications using anonymized account #.I Observe full portfolio at end of month, total value and number of
shares bought and sold in each month.
I IPO Characteristics
I First day returns, industry, etc.
Anagol et. al. (2015) 6/19
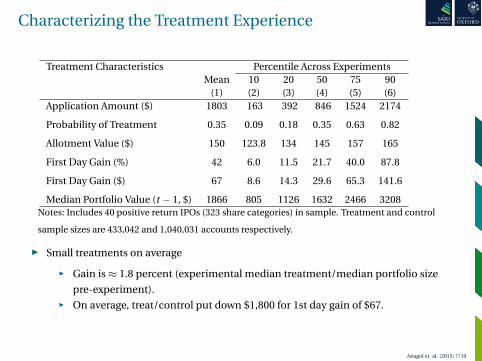
Characterizing the Treatment Experience
Treatment Characteristics Percentile Across ExperimentsMean 10 20 50 75 90
(1) (2) (3) (4) (5) (6)Application Amount ($) 1803 163 392 846 1524 2174
Probability of Treatment 0.35 0.09 0.18 0.35 0.63 0.82
Allotment Value ($) 150 123.8 134 145 157 165
First Day Gain (%) 42 6.0 11.5 21.7 40.0 87.8
First Day Gain ($) 67 8.6 14.3 29.6 65.3 141.6
Median Portfolio Value (t − 1, $) 1866 805 1126 1632 2466 3208Notes: Includes 40 positive return IPOs (323 share categories) in sample. Treatment and control
sample sizes are 433,042 and 1,040,031 accounts respectively.
I Small treatments on average
I Gain is≈ 1.8 percent (experimental median treatment/median portfolio size
pre-experiment).I On average, treat/control put down $1,800 for 1st day gain of $67.
Anagol et. al. (2015) 7/19
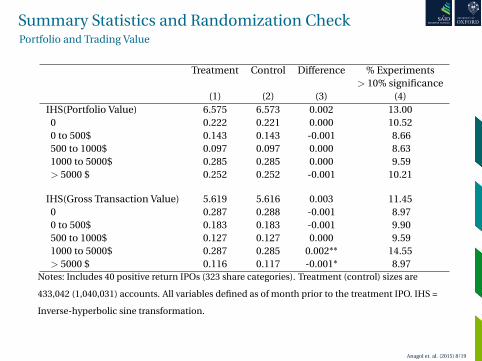
Summary Statistics and Randomization CheckPortfolio and Trading Value
Treatment Control Difference % Experiments> 10% significance
(1) (2) (3) (4)IHS(Portfolio Value) 6.575 6.573 0.002 13.00
0 0.222 0.221 0.000 10.520 to 500$ 0.143 0.143 -0.001 8.66500 to 1000$ 0.097 0.097 0.000 8.631000 to 5000$ 0.285 0.285 0.000 9.59> 5000 $ 0.252 0.252 -0.001 10.21
IHS(Gross Transaction Value) 5.619 5.616 0.003 11.450 0.287 0.288 -0.001 8.970 to 500$ 0.183 0.183 -0.001 9.90500 to 1000$ 0.127 0.127 0.000 9.591000 to 5000$ 0.287 0.285 0.002** 14.55> 5000 $ 0.116 0.117 -0.001* 8.97
Notes: Includes 40 positive return IPOs (323 share categories). Treatment (control) sizes are
433,042 (1,040,031) accounts. All variables defined as of month prior to the treatment IPO. IHS =
Inverse-hyperbolic sine transformation.
Anagol et. al. (2015) 8/19

Estimating Treatment Effects
I Compare treatment and control accounts in the 6 months prior toand following treatment.
I Cross-sectional regression in each event-time period:
yij = β0 + β1Tij + ηj + εij .
I yij is outcome variable of interest for investor i in share category j.I Tij = treatment dummy, ηj IPO share category fixed effect.
I Specification only uses randomized variation within experiment.
I β1 = weighted average of experiment treatment effects (Angrist 1998).
I Expect β1 = 0 for months before treatment (placebo test).
I All outcomes we will see exclude IPO treatment stock.
Anagol et. al. (2015) 9/19

Effect on Probability of Applying for IPOsPlacebo Test: Six Months Prior to Treatment
Month Relative to Treatment IPO-6 -5 -4 -3 -2 -1
Treatment Effect 0.0006 0.0018** 0.0003 0.0005 -0.0009 -0.0001(0.0008) (0.0009) (0.0012) (0.0008) (0.0006) (0.0010)
Control Mean: [0.2034] [0.3108] [0.2043] [0.2172] [0.3324] [0.3786]
Notes: Dependent variable = 1 if account applied for IPO in our data or was allotted IPO not in
our data in month. Observations = 1,473,073; # Share Categories = 323; # IPOs = 40. Sample
includes only positive return IPOs.
I No strong relationship between treatment and probability ofapplying to IPOs prior to treatment.
I Holds for all outcomes we study (see paper for details).
Anagol et. al. (2015) 10/19
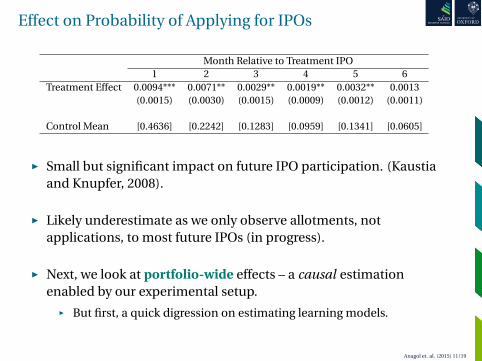
Effect on Probability of Applying for IPOs
Month Relative to Treatment IPO1 2 3 4 5 6
Treatment Effect 0.0094*** 0.0071** 0.0029** 0.0019** 0.0032** 0.0013(0.0015) (0.0030) (0.0015) (0.0009) (0.0012) (0.0011)
Control Mean [0.4636] [0.2242] [0.1283] [0.0959] [0.1341] [0.0605]
I Small but significant impact on future IPO participation. (Kaustiaand Knupfer, 2008).
I Likely underestimate as we only observe allotments, notapplications, to most future IPOs (in progress).
I Next, we look at portfolio-wide effects – a causal estimationenabled by our experimental setup.
I But first, a quick digression on estimating learning models.
Anagol et. al. (2015) 11/19

Treatment Effects at Share Category Level
I Green (diagonal): Experience effects largely concentrated on diagonal
(win-stay?).I Red (upper-right): Control group more likely to apply for large amounts of
shares - strategic learning about probabilities (lose-switch).I Red (lower-left): Losers who applied for a lot of shares switch to fewer
(lose-switch).
Anagol et. al. (2015) 12/19

Effect on Portfolio Weight in Treatment IPO Sector
Months After IPO Treatment1 2 3 4 5 6
Panel A: Dummy(Hold Stock in IPO Sector)Treatment Effect 0.0006 0.0010 0.0013 0.0018 0.0015 0.0016
(0.0014) (0.0013) (0.0013) (0.0014) (0.0015) (0.0011)
Control Mean [0.3662] [0.3966] [0.3946] [0.4038] [0.4109] [0.4063]
Panel B: Portfolio Weight IPO SectorTreatment Effect 0.0001 0.0005** 0.0008*** 0.0009** 0.0008*** 0.0006***
(0.0004) (0.0003) (0.0003) (0.0004) (0.0003) (0.0002)
Control Mean [0.0708] [0.0822] [0.0811] [0.0823] [0.0851] [0.0808]
Notes: Sector definitions based on 42 sector NIC code. Observations = 1,473,073; # Share Categories = 323; # IPOs = 40. Treatment IPO
sectoral breakdown: 54% manufacturing, 31% services, 7% technology and 4% other. Dependent variable excludes treatment IPO stock.
I Small but significant effect on portfolio weight in IPO sector(extrapolation, Greenwood et al., 2015).
Anagol et. al. (2015) 13/19

Effect on Gross Trading Value in Non-IPO Stocks
Months After IPO Treatment1 2 3 4 5 6
Treatment Effect 0.0746*** 0.0742*** 0.0447*** 0.0333*** 0.0345*** 0.0345***(0.0121) (0.0082) (0.0118) (0.0083) (0.0089) (0.0066)
Control Mean [1.5832] [0.9868] [0.3052] [0.2147] [0.4525] [0.2522]Notes: Dependent variable = IHS(buy value + sell value in month) and excludes the treatment IPO
stock. Observations = 1,473,073; # Share Categories = 323; # IPOs = 40. Sample includes only
positive return IPOs.
I Treatment group trades substantially more in non-IPO stocks:I 7.5% more in two months after treatment.I 3.5% more trades six months out.
I Portfolio re-balancing?I Small treatment size, 6 months of trading.I Find negative effect on trading for IPOs w/ negative returns (more
later).
I Implications:I Cross-security, within portfolio experience effects important.
Anagol et. al. (2015) 14/19
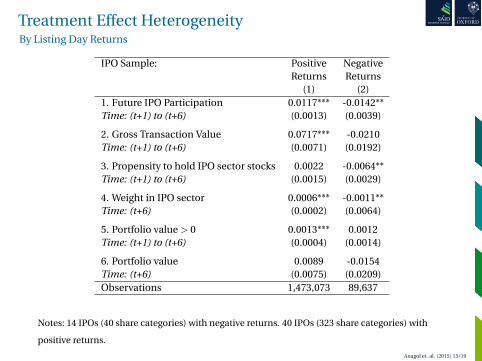
Treatment Effect HeterogeneityBy Listing Day Returns
IPO Sample: Positive NegativeReturns Returns
(1) (2)1. Future IPO Participation 0.0117*** -0.0142**Time: (t+1) to (t+6) (0.0013) (0.0039)
2. Gross Transaction Value 0.0717*** -0.0210Time: (t+1) to (t+6) (0.0071) (0.0192)
3. Propensity to hold IPO sector stocks 0.0022 -0.0064**Time: (t+1) to (t+6) (0.0015) (0.0029)
4. Weight in IPO sector 0.0006*** -0.0011**Time: (t+6) (0.0002) (0.0064)
5. Portfolio value > 0 0.0013*** 0.0012Time: (t+1) to (t+6) (0.0004) (0.0014)
6. Portfolio value 0.0089 -0.0154Time: (t+6) (0.0075) (0.0209)Observations 1,473,073 89,637
Notes: 14 IPOs (40 share categories) with negative returns. 40 IPOs (323 share categories) with
positive returns.
Anagol et. al. (2015) 15/19

Treatment Effect Heterogeneity by Portfolio ValueProbability of Applying to Future IPO
I Sample split into deciles based portfolio value in month before IPO
I Estimate separate treatment effects for each decile
I IPO application treatment effect similar for portfolio values forportfolio values 0 to 5,000 dollars (1st 8 deciles).
I Significant positive effects even for highest decile.Anagol et. al. (2015) 16/19

Treatment Effect Heterogeneity by Portfolio ValueIHS(Gross Trading Value)
I Effect declines with portfolio value.
I Significant effects even for highest decile.
Anagol et. al. (2015) 17/19

Treatment Effect Heterogeneity by Account AgeProbability of Applying to Future IPO
I Bigger effects for new accounts, no major pattern in olderaccounts.
I Similar results for other outcomes. Age in the market attenuateseffects, but not completely (List, 2011).
Anagol et. al. (2015) 18/19
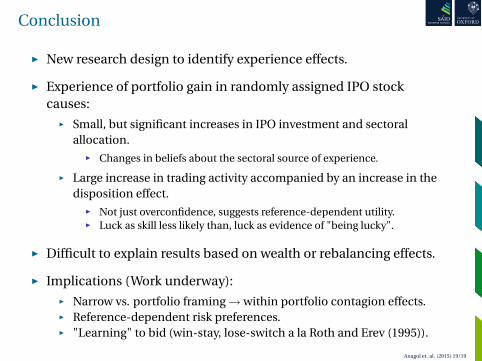
Conclusion
I New research design to identify experience effects.
I Experience of portfolio gain in randomly assigned IPO stockcauses:
I Small, but significant increases in IPO investment and sectoralallocation.
I Changes in beliefs about the sectoral source of experience.
I Large increase in trading activity accompanied by an increase in thedisposition effect.
I Not just overconfidence, suggests reference-dependent utility.I Luck as skill less likely than, luck as evidence of "being lucky".
I Difficult to explain results based on wealth or rebalancing effects.
I Implications (Work underway):I Narrow vs. portfolio framing→within portfolio contagion effects.I Reference-dependent risk preferences.I "Learning" to bid (win-stay, lose-switch a la Roth and Erev (1995)).
Anagol et. al. (2015) 19/19