he effectiveness of the multi-spatial scale approach to ... · figure 19 the effectiveness of the...
TRANSCRIPT
Figure 19
THE EFFECTIVENESS OF THE MULTI-SPATIAL SCALE APPROACH TO FOREST
MANAGEMENT: A CASE STUDY OF
TASMANIAN BATS
Lisa Cawthen B.Sc. (Hons) (2007), University of Tasmania
A thesis submitted in fulfilment of the requirements for the degree of Doctor of Philosophy
University of Tasmania
Cooperative Research Centre for Forestry
March 2014
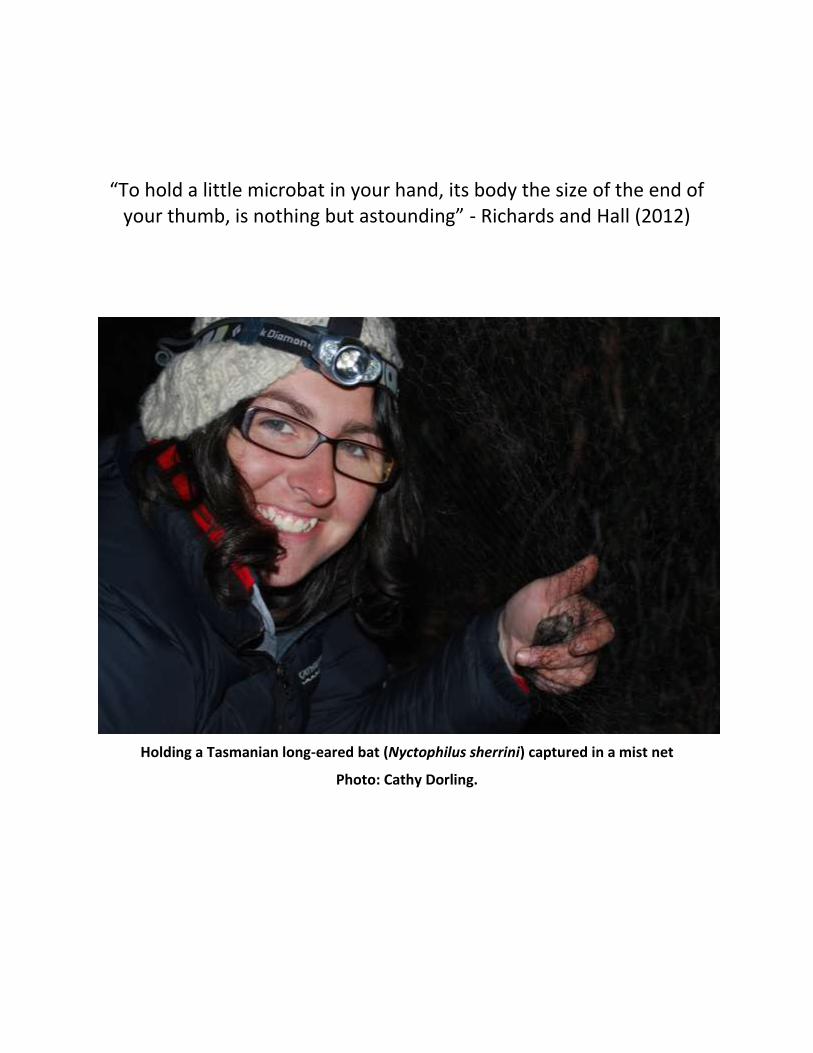
“To hold a little microbat in your hand, its body the size of the end of your thumb, is nothing but astounding” - Richards and Hall (2012)
Holding a Tasmanian long-eared bat (Nyctophilus sherrini) captured in a mist net
Photo: Cathy Dorling.
Declarations by the author
i
DECLARATIONS BY THE AUTHOR Declaration of Originality
This thesis contains no material which has been accepted for a degree or diploma by the University or any other institution, except by way of background information and duly acknowledged in the thesis, and to the best of my knowledge and belief no material previously published or written by another person except where due acknowledgement is made in the text of the thesis, nor does the thesis contain any material that infringes copyright.
Signed:
Lisa Cawthen
Date: March 2014
Authority of Access
The publisher of the paper comprising Chapter 3 holds the copyright for that content, and access to the material should be sought from the respective journals. The remaining non published content of the thesis may be made available for loan and limited copying and communication in accordance with the Copyright Act 1968.
Signed:
Lisa Cawthen
Date: March 2014
Statement of Ethical Conduct
The research associated with this thesis abides by the international and Australia codes on animal experimentation. Animal ethics permits were obtained from the University of Tasmania Animal Ethics Committee for all aspects of the project where experiments involved live animals (Permit: A10640).
Signed:
Lisa Cawthen
Date: March 2014
Author statement and contributions
ii
STATEMENT OF CO-AUTHORSHIP AND THESIS
CONTRIBUTIONS This thesis comprises a series of manuscripts (chapters) prepared for publication. For the purpose of this thesis, manuscript abstracts have been removed and references collated.
The following people and organizations contributed to the manuscripts prepared as part of this thesis:
Lisa Cawthen University of Tasmania & CRC Forestry, Tasmania, Australia
Stewart Nicol University of Tasmania, Tasmania, Tasmania, Australia
Sarah Munks University of Tasmania, CRC Forestry & Forest Practices Authority, Tasmania,
Australia
Bradley Law NSW Forest Services, New South Wales, Australia
Susan Jones University of Tasmania, Tasmania, Australia
Tamara Kabat Western Australia, Australia
Published papers forming part of this thesis:
Cawthen, L (2013) White-striped freetail bats in Tasmania: resident, vagrant or climate change migrant?
Australian Mammalogy 35 (2), 251-254 (Chapter 3).
Published papers that include data collected as part of this thesis but are not included in this thesis:
Parnaby, H and Cawthen, L. (2013) Tasmanian Long-eared Bat, Nyctophilus sherrini (in) S. Van Dyck, I.
Gynther & A. Baker (eds), Field Companion to The Mammals of Australia. Reed New Holland: Sydney. p.
148.
Hull, C.L., and Cawthen, L. (2013) Bat fatalities at two wind farms in Tasmania, Australia: bat
characteristics, and spatial and temporal patterns. New Zealand Journal of Zoology 40 (1), 5-15.

Author statement and contributions
iii
Author roles
The candidate contributed ideas, designed and undertook the majority of all fieldwork, conducted the
analyses and wrote the manuscripts.
Stewart Nicol, Sarah Munks and Bradley Law contributed ideas and edited the manuscripts.
Susan Jones and Tamara Kabat contributed ideas, data collected from previous work and edited chapter
4.
We the undersigned agree with the above stated, “proportion of work undertaken” for each of the
above chapters contributing to this thesis:
Stewart Nicol Anthony Koutoulis
(Primary Supervisor) (Head of School)
Date: March 2014 Date: March 2014

Acknowledgements
iv
ACKNOWLEDGEMENTS
Many individuals and organisations contributed to the compilation of this thesis.
Supervisors
From introducing me to tree hollows and bats to the final days of writing this thesis, my supervisors
Sarah Munks and Stewart Nicol and my unofficial supervisor Bradley Law provided invaluable guidance,
support and knowledge. Thanks also to Hamish McCallum for providing guidance and support in the
early stages of my PhD.
Bat researchers
The success of this thesis was underpinned by the many people who passed on to me their knowledge
and experiences with bats. Thank you to: Markus Utench and family for their teaching me mist netting
techniques; Robert Bender and the Victorian Field Naturalists for hosting me and teaching me bat
handling techniques; Chris Corben for sharing his expertise on bat calls and analysis; Anna McConville
for her bat tracking and exit counting skills; and Tamara Kabat, Masato Inada, Robert Taylor and Terry
Reardon for their knowledge of Tasmanian bats.
Contributors of financial support
This thesis would not have been possible without funding from the following organisations financial
contribution to field related costs: the Winifred Violet Scott Trust, the Cooperative Research Centre for
Forestry, the Mohammed Bin Zayed Species Conservation Trust, the Holsworth Wildlife Research
Endowement, the Tasmanian Forest Practices Authority, the Wildlife Preservation Society of Australia,
the Norman Wettenhall Foundation, Idea Wild, The Ecological Society of Australia, the Royal Zoological
Society of New South Wales, Norske skog, the M.A. Ingram trust and Bat Conservation International.
I was funded by an Australian Postgraduate Award, a Cooperative Research Centre for Forestry top-up
scholarship and Bookend trust scholar grant.

Acknowledgements
v
Contributors of in-kind support
Valuable in-kind support through the use of equipment was provided by the Tasmanian Forest Practices
Authority, Forestry Tasmania, SEMF, The University of Tasmania’s School of Geography and
Environmental Studies and Markus Utench. Access to bat specimens for data collection was provided by
the Tasmanian Forest Practices Authority, The Tasmanian Museum and Art Gallery and the Queen
Victoria Museum and Art Gallery. A special thank you to Lesley Kurek, Mayfair veterinary clinic and
Bonorong Wildlife Sanctuary for allowing me to collect data from bats in care.
Contributors of spatial data
Thank you to the Tasmanian Forest Practices Authority, Forestry Tasmania, the Department of Primary
Industries and Water and the Forest Practices Authority for the use of spatial data.
Manuscript reviewers
Thank you to Greg Richards, Monika Rhodes, Ross Goldingay, Martin Schultz and Harry Parnaby for
reviewing manuscripts that are included in this thesis.
Land managers
Thank you to various land managers in facilitating access to their land. These included Forestry Tasmania
and the staff at the Derwent and Mersey Offices, Norske skog, Gunns, the Tasmanian Land Conservancy,
The Tasmanian Parks and Wildlife Service, Stoney head military range, Peter Downie, Kingsborough
council, the Wellington Park trust, Hobart City Council and local residents of Fern Tree.
Field assistants
Data collection would not have been possible without the individuals who volunteered their time and
experience to assist in all aspects of field work including bat capture and reference call collection, bat
call surveys, radio-telemetry and habitat assessments. Thank you Antony Mould, Julie Dandy, Nora
Hoger, Jos Kramer, Kaely Kreger, Petrina Alcock, Allison Jaggard, Nell Hillard, Bron Fancourt, Jocelyn
Goon, Fedra Aisa, Janika Chambers, Henry West, Rachael Harris, Bindi Browning, Jane Taylor, Katherine
Taylor, Brandon Woods, Paolo Zintu, Cathy Dorling, Stephen Kolomyjec, Jodie Hodgetts, Nick Merrit
Smith, Coline Muller, Rachael Harris, Kim Skogfold, Lim Ren, Rachelle Herrin, Lina Ospina, James
Bracken, Anna Johnstone, David James, Lene Hemmingsen, Holly , Kathy Gruber, Paul Brooks, Susan
Doust, Owen Daniel, Tammy McGowan, Pearse Buchanon, Sharon Roch, Lim Ren, Dee Leggett, Danielle
Madden and Bec Barron.
Abstract
vi
ABSTRACT
Sustainable forest management is increasingly being recognised as a key component of
biodiversity conservation, as much of the world’s terrestrial biodiversity is dependent on
forests. Understanding the effectiveness of approaches to forest management and how they
are implemented in on-ground in practice is crucial for the ongoing improvement of forest
management strategies for biodiversity conservation. This is especially so in Tasmania’s dry
Eucalypt forests where a range of land management practices, such as timber harvesting, have
altered the type, amount and spatial arrangement of mature forest available to fauna. Using
Tasmania’s hollow-roosting bats as a case study, the overall aim of this thesis is to gather
information that can be used to assess the effectiveness of a multi-spatial scale approach to
forest management, as applied on the ground in Tasmania. In particular this thesis aims to
determine how effectively retained forest habitat provides suitable habitat for hollow-using
bats, facilitates recolonisation of harvested areas and thus maintains bat populations in timber
production landscapes.
Effectiveness monitoring for biodiversity conservation can be hampered by a lack of basic
information on the species studied, as was the case in Tasmania. In order to understand the
effectiveness of forest management strategies I first had to develop an accurate method for
identifying bat calls recorded during bat call surveys. Bat call surveys were used to assess the
spatial and temporal variation in bat activity, species richness and assemblages across and
between landscapes. I then had to establish baseline data on the basic life history and activity
patterns of Tasmanian bats to understand how temporal variation in bat activity is related to
changes in the timing and patterns of reproduction. The findings of these studies fill a
significant gap in our understanding of Tasmania’s bats. Notably, the discovery of the white-
striped freetail bat in Tasmania during these studies highlights the importance of collecting
such data and monitoring bat communities. Importantly the information derived from these
Abstract
vii
studies provided the necessary information for using radio-telemetry and bat call surveys to
investigate the effectiveness of forest management strategies for bats.
The main findings of this thesis were that no single forest retention measure was preferred by
all bats or catered for all their habitat requirements (e.g. food, shelter and breeding sites).This
is because species and individuals varied in their habitat requirements. Such differences are
likely underpinned by variations in their social, physiological and ecological needs. The
effectiveness of different forest retention measures for bats also varied between landscapes. In
landscapes where mature forest was rare or lost, small patches (<1ha) and large strips (50ha)
were used more extensively by bats than in landscapes where mature forest was more
abundant. Not all species formed maternal colonies in such patches and strips, instead
preferring large patches (>350ha) to breed. All species, however, did show a preference for
roost areas, though not always roost sites, in parts of the landscape with the highest availability
of hollow-bearing trees.
The findings of this thesis indicate that Tasmania’s current forest management strategies are
effective at providing suitable habitat for bats, facilitating recolonisation of harvested areas and
maintaining bat species in the landscape. They also support the multi-spatial scale approach to
forest management as applied on the ground in Tasmania as a viable and effective way of
conserving bats in Tasmania’s timber production forests. A ‘one-size-fits-all approach’ is
unlikely to cater for the habitat requirements of all bats. These findings have important
implications for the continued improvement of forest management strategies in human-
modified landscapes and demonstrate that native forest management can be an important part
of any biodiversity conservation strategy, provided that habitat is retained into the future at a
variety of spatial scales and taking into consideration the broader landscape.

Table of contents
viii
TABLE OF CONTENTS DECLARATIONS BY THE AUTHOR .................................................................................................. I
STATEMENT OF CO-AUTHORSHIP AND THESIS CONTRIBUTIONS .................................................. II
ACKNOWLEDGEMENTS .............................................................................................................. IV
ABSTRACT ................................................................................................................................. VI
TABLE OF CONTENTS ................................................................................................................ VIII
CHAPTER 1: GENERAL INTRODUCTION ......................................................................................... 1
Biodiversity in changing forest landscapes.................................................................................... 2
Conserving forest biodiversity: a multi-spatial scale approach ...................................................... 3
Using bats to monitor the effectiveness of forest management strategies .................................... 5
Research context: Tasmanian forest management strategies ........................................................ 6
Tasmania’s bat community ........................................................................................................ 11
RESEARCH OBJECTIVES AND THESIS STRUCTURE ......................................................................... 14
CHAPTER 2: THE EFFECTIVENESS OF DIFFERENT APPROACHES FOR THE DEVELOPMENT OF A BAT CALL IDENTIFICATION KEY FOR USE IN AUTOMATED SOFTWARE: A TASMANIAN CASE STUDY ..... 16
Introduction .............................................................................................................................. 17
Methods .................................................................................................................................... 20
Results ...................................................................................................................................... 25
Discussion ................................................................................................................................. 30
Management implications ......................................................................................................... 39
CHAPTER 3: WHITE-STRIPED FREETAIL BAT IN TASMANIA: RESIDENT, VAGRANT OR CLIMATE CHANGE MIGRANT? ................................................................................................................... 40
Introduction .............................................................................................................................. 41
Methods .................................................................................................................................... 41
Results ...................................................................................................................................... 42
Discussion ................................................................................................................................. 44
Conclusion ................................................................................................................................. 47
CHAPTER 4: THE REPRODUCTIVE AND ACTIVITY CYCLE OF TASMANIAN BATS: IMPLICATIONS FOR BAT MONITORING ..................................................................................................................... 49
Introduction .............................................................................................................................. 50
Methods .................................................................................................................................... 52
Table of contents
ix
Results ...................................................................................................................................... 56
Discussion ................................................................................................................................. 60
Implications for bat monitoring .................................................................................................. 65
CHAPTER 5: THE IMPORTANCE OF MATURE FOREST IN BAT ROOST SITE SELECTION IN TWO CONTRASTING TIMBER PRODUCTION LANDSCAPES .................................................................... 67
Introduction .............................................................................................................................. 68
Methods .................................................................................................................................... 70
Results ...................................................................................................................................... 79
Discussion ................................................................................................................................. 90
Management implications ......................................................................................................... 94
CHAPTER 6: BAT ACTIVITY, SPECIES ASSEMBLAGES AND RICHNESS IN TIMBER PRODUCTION LANDSCAPES: HOW EFFECTIVE ARE FOREST RETENTION MEASURES? ......................................... 96
Introduction .............................................................................................................................. 97
Methods .................................................................................................................................. 100
Results .................................................................................................................................... 110
Discussion ............................................................................................................................... 119
Management considerations .................................................................................................... 124
CHAPTER 7: GENERAL DISCUSSION ........................................................................................... 126
Introduction ............................................................................................................................ 127
Synthesis of Key Findings ......................................................................................................... 128
Are Tasmania’s forest management strategies effective for conserving fauna? ......................... 133
Considerations for improvement of forest management strategies ........................................... 135
Final remarks ........................................................................................................................... 136
APPENDICES ............................................................................................................................ 137
Appendix 1. Examples of Tasmanian bat reference call sonograms recorded using Anabats ...... 138
Appendix 2. AnaScheme bat call identification key ................................................................... 143
Appendix 3. Anti-predation strategies in Tasmania’s hollow-using bats .................................... 145
Introduction ............................................................................................................................ 145
Materials and Methods ............................................................................................................ 147
Results .................................................................................................................................... 147
Discussion ............................................................................................................................... 148
REFERENCES ............................................................................................................................ 152
1
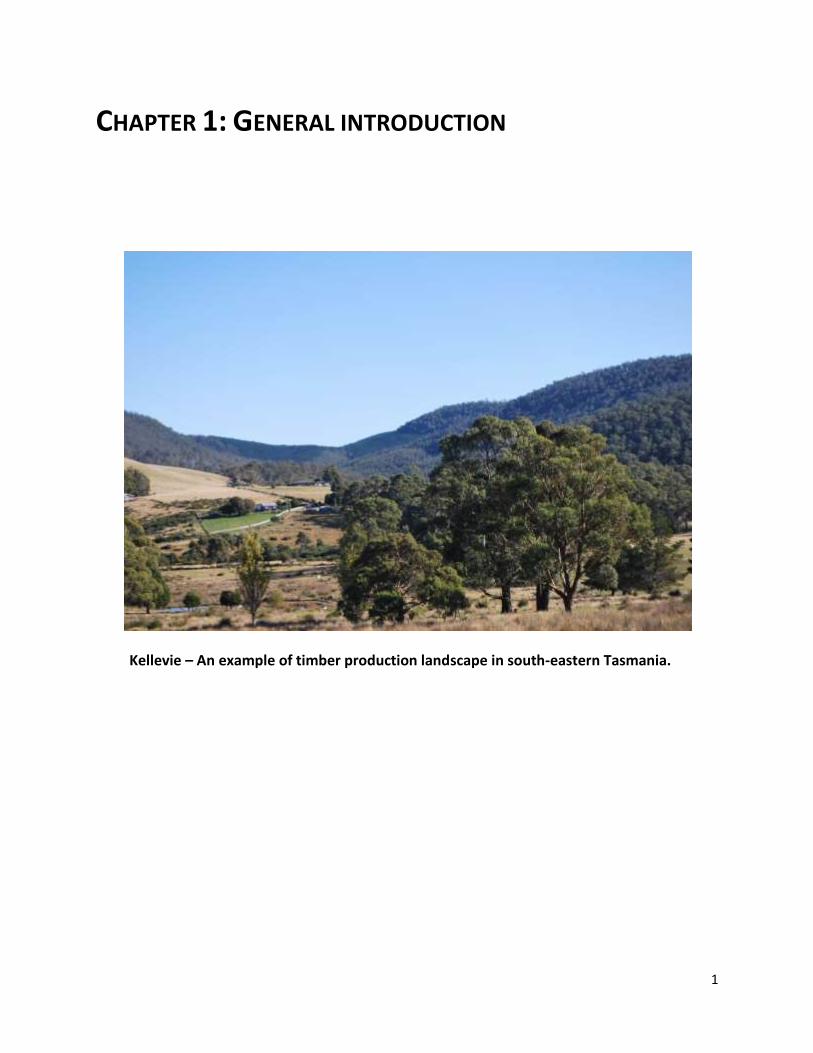
CHAPTER 1: GENERAL INTRODUCTION
Kellevie – An example of timber production landscape in south-eastern Tasmania.
Chapter 1: General introduction
2
BIODIVERSITY IN CHANGING FOREST LANDSCAPES
The maintenance of biodiversity is crucial for ecosystem functionality, and its loss has dire
consequences for the stability, productivity and sustainability of natural resources (Foley et al.
2005; Hooper et al. 2005; Loreau et al. 2001). One of the major threats to the world’s
biodiversity is the loss and modification of forest habitat, as forests support approximately 65
percent of known terrestrial biodiversity (World Commission on Forests and Sustainable
Development 1999). Over the last century, forests have been cleared, modified and fragmented
at an unprecedented rate as a result of the rapid expansion of urban, agricultural and pastoral
areas, conversion of native forests to plantation and increases in timber harvesting to meet the
growing needs of the human population (Foley et al. 2005). This has resulted in the decline and
loss of many species, contributing to what has been described as a 21st century catastrophic
extinction crisis (Novacek & Cleland 2001).
The mechanisms leading to the loss of fauna diversity are complex (Turner 1996). In the short
term, many species can persist and take advantage of newly created habitat in areas where
forest has been lost, modified or fragmented (e.g. Azevedo-Ramos et al. 2006). Some species,
however, particularly those with restricted distributions, can go extinct immediately if the
entire extent of habitat on which they depend is lost (Kuussaari et al. 2009).
For those species that do persist, reduced dispersal ability, increased predation risk and
competition, reduced availability of foraging, breeding and shelter sites and increases in the
number of invasive species, diseases and parasite can have medium to long-term effects on
populations(Ford et al. 2001; Kuussaari et al. 2009). These include altered sex ratios (Martin &
Handasyde 2007) and social systems (Banks et al. 2007; Banks et al. 2005), increased mortality
rates (Keyser et al. 1998), genetic isolation effects (Stephens et al. 2012b) and reduced
breeding success (Burke & Nol 1998; Robinson et al. 1995). Such effects put species at risk of
latent decline and extinction in the medium to long-term.
Chapter 1: General introduction
3
The loss of species sensitive to forest loss, modification and fragmentation can result in changes
to forest community composition towards species that are more tolerant of forest loss and
fragmentation (Barlow et al. 2006; Castelletta et al. 2005). Though only a few species may be
lost as a result of disturbance to forest habitat, their loss can have a domino effect on the
persistence of remaining flora and fauna. This is because many species play an important role in
the persistence of other species and the functioning of forest ecosystems (e.g. insectivores,
pollinators and seed dispersers) (Jones et al. 2009). These are the same ecosystems upon which
humans depend upon for their needs. Therefore though biodiversity conservation is often
considered to be detrimental to the utilisation of forests for human needs, it is in fact essential
as biodiversity plays an important part in maintaining healthy stable forest ecosystems and
regeneration post-disturbance(Burton et al. 1992). The challenge is how to achieve a balance
between forest utilisation for human needs and biodiversity conservation.
CONSERVING FOREST BIODIVERSITY: A MULTI-SPATIAL SCALE APPROACH
It is well recognised that protected areas alone will not conserve the world’s biodiversity. This is
because a large proportion of the world’s forests are unprotected and important habitat for
many species occurs outside of protected areas. Protected areas are also not necessarily
managed for their biodiversity benefits nor will they necessarily be protected indefinitely (FAO
2010; Lindenmayer et al. 2012; Mascia & Pailler 2011; Munks et al. 2009). Sustainable forest
management in multi-use landscapes outside of protected areas (the matrix) is therefore
promoted as a key component of any biodiversity conservation strategy (Lindenmayer et al.
2000; Saunders et al. 1993).
Many forest management agencies recognise this and incorporate measures for the
conservation of biodiversity into forest management strategies (Munks et al. 2009; Polasky et
al. 2005; Sergio & Pedrini 2007). In many cases however, there is little information on the
habitat requirements of species to inform the development of such strategies. As a
consequence, these strategies are often based on approaches used in other regions or accepted
Chapter 1: General introduction
4
sustainable forest management principles developed using ecological theory (Lindenmayer et
al. 2006; Schulte et al. 2006).
The multi-spatial scale approach (also known as the matrix management approach) is often
used by forest management agencies to guide the development of forest management
strategies (Lindenmayer & Franklin 2002; Schulte et al. 2006). This approach aims to maintain
forest habitat across a range of spatial scales in formal reserves and off-reserve areas guided by
a series of principles supported by ecological theory (Lindenmayer et al. 2006). These principles
aim to achieve biodiversity conservation through the maintenance of forest stand structural
complexity, landscape heterogeneity and connectivity, integrity of aquatic ecosystems and an
understanding of natural disturbance regimes to guide human disturbance regimes
(Lindenmayer et al. 2006). This is generally achieved by developing forest management
strategies that retain forest habitat at multiple spatial scales and configurations ranging from an
individual tree, small patch and large strip to large patches in and surrounding disturbed areas
(Munks et al. 2009; Whitford & Stone 2004).
Lindenmayer and Franklin (2002) identify four reasons why this multi-spatial scale approach is
desirable: forest-dependent species occur at a range of spatial scales and have different spatial
requirements; species may respond to a range of environment factors that impact at different
spatial scales; there is interdependence between different scales (i.e. the influence of landscape
context); and a multi-scaled approach is more likely to provide a heterogeneous landscape that
is important for many species. Another advantage of this approach is that in the absence of
empirical information on the habitat requirements of fauna, retaining forest habitat at multiple
spatial scales across a landscape “spreads the risk “ by increasing the likelihood of a strategy or
strategies being effective if a single strategy is not (Lindenmayer et al. 2006). The effectiveness
of the multi-spatial scale approach in achieving biodiversity conservation is however poorly
understood (Felton et al. 2010; Munks et al. 2009). Such research is an important part
Chapter 1: General introduction
5
ofadaptive forest management, a principle that underpins many forest management systems
around the world (Lindenmayer & Franklin 2002).
USING BATS TO MONITOR THE EFFECTIVENESS OF FOREST MANAGEMENT STRATEGIES
Jones et al. (2009) promotes bats as good bioindicators. This is because they exhibit taxonomic
stability, population trends can be monitored, short- and long-term effects on populations can
be measured and they are distributed widely around the world. Bats provide several ecosystem
services (e.g. pollination and insect control) and so changes in their activity and abundance can
also reflect the health of plant populations and insect communities (Duchamp et al. 2010; Jones
et al. 2009; Kunz et al. 2011).
Bats are likely to be good indicators of the effectiveness of forest management strategies
because most species depend on forests for foraging, socialising, mating, breeding or roosting
habitat (Lacki et al. 2007). A range of studies have demonstrated that bats respond to forest
loss, modification and fragmentation through changes in species richness, community
structure, activity and roost site selection (Barclay & Kurta 2007). For example, changes to
forest structure (i.e. the conversion of mature forest to regrowth) can have profound impacts
on the ability of bats to manoeuvre and forage in regrowth forests resulting in reduced bat
activity (Jung et al. 2012). Similarly a decline in the availability of hollow-bearing trees in the
landscape is considered to have a detrimental influence on bat populations because of the
dependence of many species on this resource for roost and breeding sites (Barclay & Kurta
2007), though no studies have clearly demonstrated this. Given these responses by bats, it is
likely that bats will respond to mitigation measures such as the retention of forest patches in
areas where forest has been lost, modified and fragmented.
The response of bats to forest management strategies is likely to vary between species. Species
exhibit marked variation in their habitat use patterns depending on their traits such as wing
morphology and echolocation call structure. Collectively such traits are referred to as
Chapter 1: General introduction
6
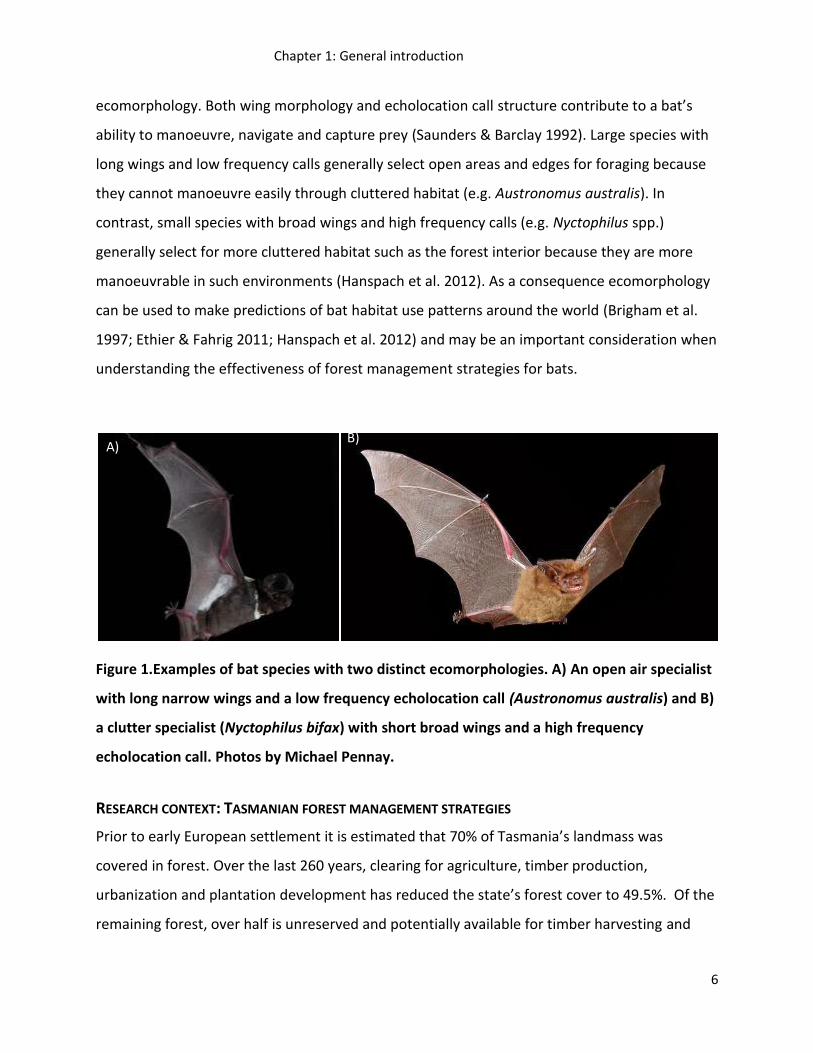
ecomorphology. Both wing morphology and echolocation call structure contribute to a bat’s
ability to manoeuvre, navigate and capture prey (Saunders & Barclay 1992). Large species with
long wings and low frequency calls generally select open areas and edges for foraging because
they cannot manoeuvre easily through cluttered habitat (e.g. Austronomus australis). In
contrast, small species with broad wings and high frequency calls (e.g. Nyctophilus spp.)
generally select for more cluttered habitat such as the forest interior because they are more
manoeuvrable in such environments (Hanspach et al. 2012). As a consequence ecomorphology
can be used to make predictions of bat habitat use patterns around the world (Brigham et al.
1997; Ethier & Fahrig 2011; Hanspach et al. 2012) and may be an important consideration when
understanding the effectiveness of forest management strategies for bats.
Figure 1.Examples of bat species with two distinct ecomorphologies. A) An open air specialist
with long narrow wings and a low frequency echolocation call (Austronomus australis) and B)
a clutter specialist (Nyctophilus bifax) with short broad wings and a high frequency
echolocation call. Photos by Michael Pennay.
RESEARCH CONTEXT: TASMANIAN FOREST MANAGEMENT STRATEGIES
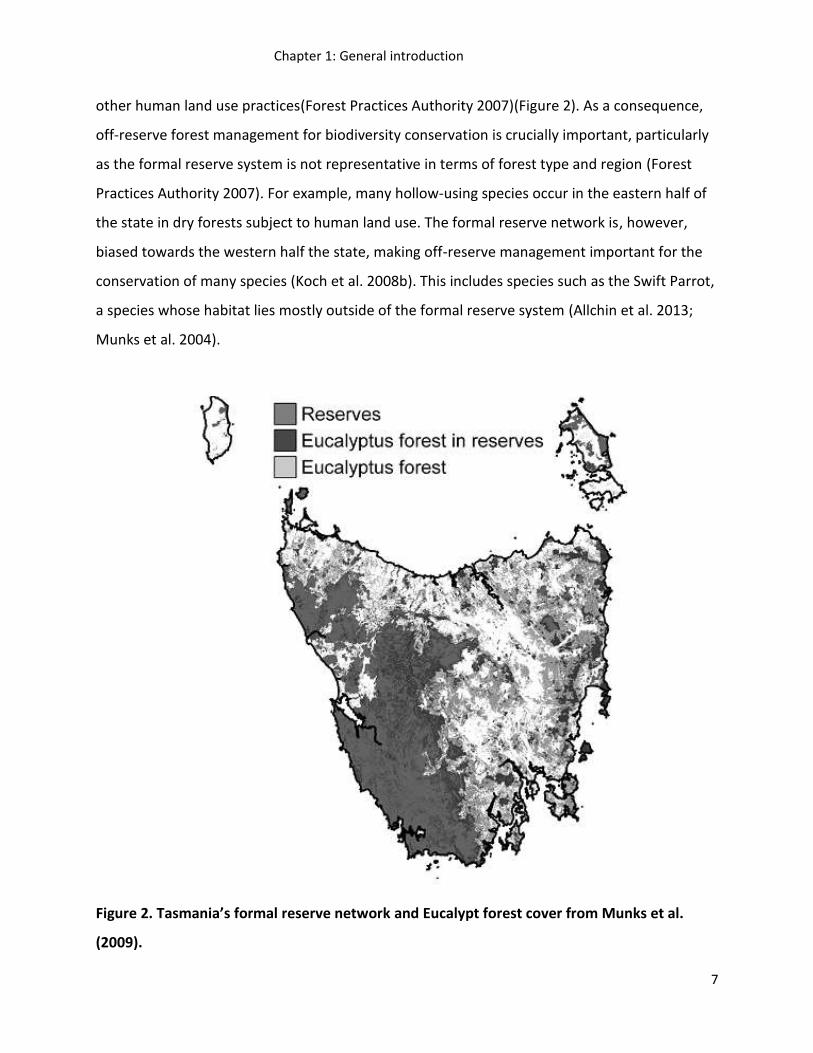
Prior to early European settlement it is estimated that 70% of Tasmania’s landmass was
covered in forest. Over the last 260 years, clearing for agriculture, timber production,
urbanization and plantation development has reduced the state’s forest cover to 49.5%. Of the
remaining forest, over half is unreserved and potentially available for timber harvesting and
A) B)
Chapter 1: General introduction
7
other human land use practices(Forest Practices Authority 2007)(Figure 2). As a consequence,
off-reserve forest management for biodiversity conservation is crucially important, particularly
as the formal reserve system is not representative in terms of forest type and region (Forest
Practices Authority 2007). For example, many hollow-using species occur in the eastern half of
the state in dry forests subject to human land use. The formal reserve network is, however,
biased towards the western half the state, making off-reserve management important for the
conservation of many species (Koch et al. 2008b). This includes species such as the Swift Parrot,
a species whose habitat lies mostly outside of the formal reserve system (Allchin et al. 2013;
Munks et al. 2004).
Figure 2. Tasmania’s formal reserve network and Eucalypt forest cover from Munks et al.
(2009).
Chapter 1: General introduction
8
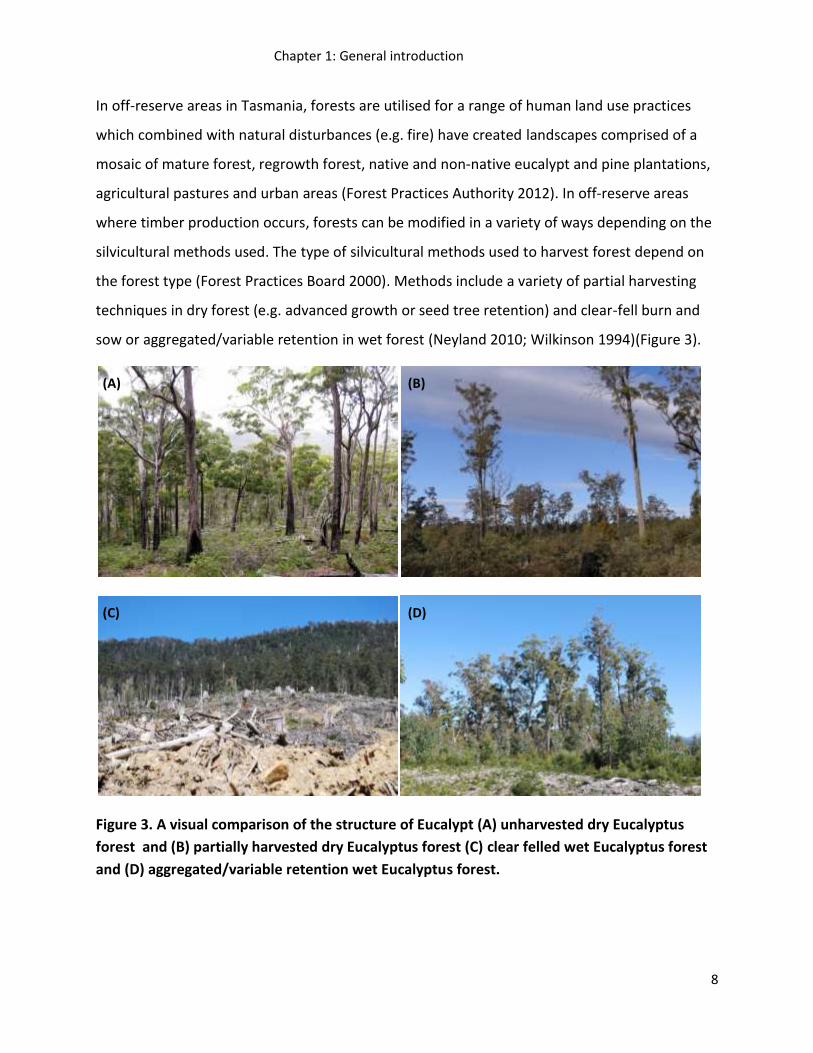
In off-reserve areas in Tasmania, forests are utilised for a range of human land use practices
which combined with natural disturbances (e.g. fire) have created landscapes comprised of a
mosaic of mature forest, regrowth forest, native and non-native eucalypt and pine plantations,
agricultural pastures and urban areas (Forest Practices Authority 2012). In off-reserve areas
where timber production occurs, forests can be modified in a variety of ways depending on the
silvicultural methods used. The type of silvicultural methods used to harvest forest depend on
the forest type (Forest Practices Board 2000). Methods include a variety of partial harvesting
techniques in dry forest (e.g. advanced growth or seed tree retention) and clear-fell burn and
sow or aggregated/variable retention in wet forest (Neyland 2010; Wilkinson 1994)(Figure 3).
Figure 3. A visual comparison of the structure of Eucalypt (A) unharvested dry Eucalyptus
forest and (B) partially harvested dry Eucalyptus forest (C) clear felled wet Eucalyptus forest
and (D) aggregated/variable retention wet Eucalyptus forest.
(A) (B)
(C) (D)
Chapter 1: General introduction
9
Forest management strategies in off-reserve areas are delivered via the Tasmanian Forest
Practices System (Forest Practices Board 2000; Munks et al. 2009). Through this system which is
guided by the multi-spatial scale approach to forest management, habitat is retained on private
and public forest at a range of spatial scales and configurations ranging from large patches and
strips (e.g. informal reserves, visual landscape reserves, cultural heritage reserves, threatened
species reserves, wildlife habitat strips) to small patches forest (e.g. wildlife habitat clumps) and
narrow strips (e.g. streamside and roadside reserves)(Taylor 1991). Individual trees are also
sometimes retained as part of a particular silvicultural method (i.e. partial harvest).
There are, however, gaps in our understanding of the effectiveness of these forest retention
measures for fauna. Broad scale research has demonstrated that retaining forest habitat in
timber production landscapes can maintain species diversity and richness (Flynn et al. 2011a;
Wardlaw et al. 2012), though not necessarily species assemblages (Flynn et al. 2011a). Similar
findings have been demonstrated when examining the effectiveness of specific forest retention
measures such as wildlife habitat strips (Grove & Yaxley 2005; Grove; MacDonald et al. 2005;
MacDonald et al. 2002). Finer-scale studies have demonstrated that though forest retention
measures are used by some species as foraging, commuting and shelter habitat they are not
necessarily used by all species similarly over time and space (Baker et al. 2009; Cawthen &
Munks 2011; Cawthen et al. 2012; Haseler & Taylor 1993; Koch et al. 2009a; Koch et al. 2009b;
Law & Law 2011; Lefort & Grove 2009; Stephens et al. 2012a; Wapstra & Taylor 1998). This is
not surprising given the differences in the habitat requirements, range and dispersal abilities of
different species. To make informed strategic decisions relating to forest management,
managers need to understand which forest retention measures best meet the habitat
requirements of different species and how much forest needs to be retained to maintain
species in the landscape, for the short and long-term.
Chapter 1: General introduction
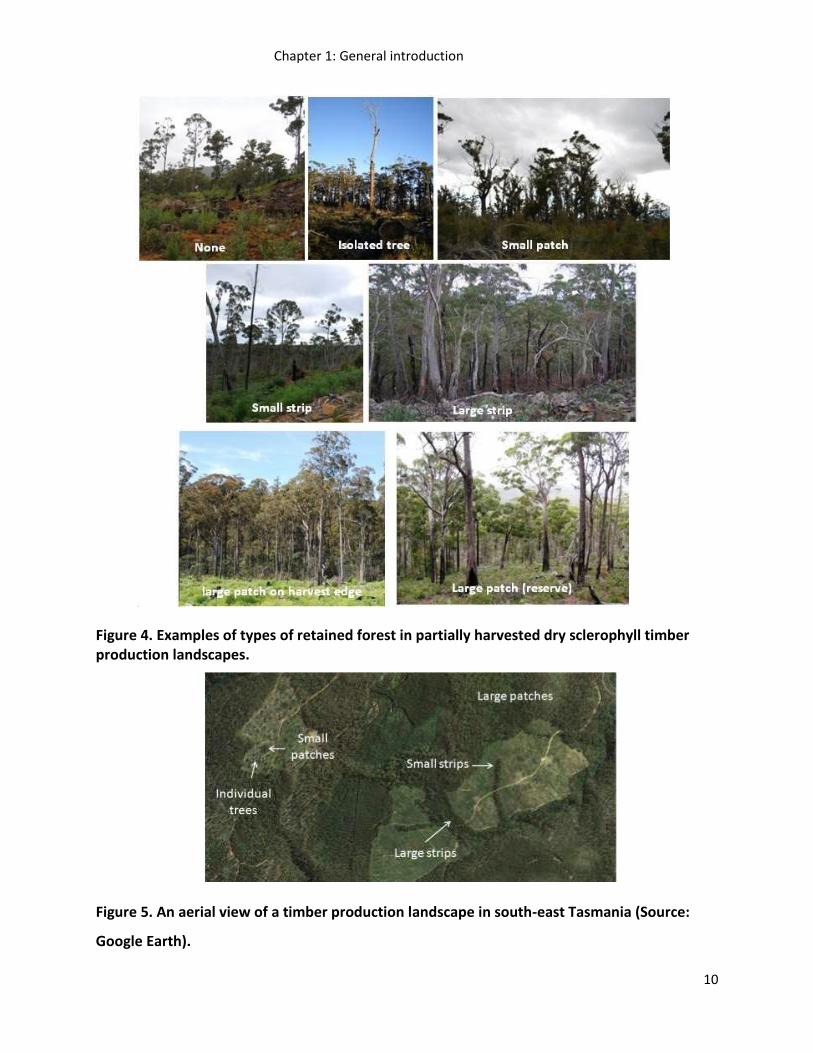
10
Figure 4. Examples of types of retained forest in partially harvested dry sclerophyll timber production landscapes.
Figure 5. An aerial view of a timber production landscape in south-east Tasmania (Source:
Google Earth).
C
Chapter 1: General introduction
11
TASMANIA’S BAT COMMUNITY
Tasmania’s bat community consists of species entirely dependent on hollow-bearing trees for
roost and breeding sites in forested areas (Koch et al. 2008b). Eight of Australia’s 67 micro-bat
species are resident to Tasmania. This includes one bat species that is endemic to Tasmania, the
Tasmanian long-eared bat. Vagrant mega-bats also arrive in Tasmania periodically (Figure 6)
and it is possible that other bat species that are vagrant have gone undetected. Compared to
mainland Australia, Tasmania has a low diversity of bats - all are micro-bats, from a single family
(Vespertilionidae), are insectivorous and use tree hollows (Churchill 2009; Driessen et al. 2011).
Tasmanian bats do, however, vary in their ecomorphology and as a consequence are likely to
vary in their response to different forest retention measures (Table 1). Prior to the
implementation of Tasmania’s current forest management strategies, Taylor and Savva (1988)
concluded that if large areas of Tasmania’s forest were converted to regrowth forest, there
would be a severe shortage of roosts and bat populations would probably decline. This was
because their preliminary work indicated that although bats were found foraging in regrowth
forest, none roosted there, instead selecting roosts in the mature forest surrounding the
harvested area.
Information on the life history and ecology of Tasmanian bats is needed to inform the collection
and interpretation of data required to answer questions about the effectiveness of forest
management strategies. Such information is, however, limited because there have been few
systematic studies on Tasmanian bats. For example, it was only recently discovered that
Tasmania has an endemic bat species - the Tasmanian long-eared bat (Nyctophilus sherrini)
(Churchill 2009; Parnaby 2009). This species was believed to be the Gould’s long-eared bat
(Nyctophilus gouldii) and later to be the greater long-eared bat (Nyctophilus timoriensis) until a
review by Parnaby (2009) determined that it was a unique species. Other studies have focused
on Tasmanian bat distribution and natural history (Inada 2010; O'Neill 1983; Schulz &
Kristensen 1996; Taylor et al. 1987; Taylor & O'Neill 1985), reproduction (Kincade 1999), roost
use (Taylor & Savva 1988; Woinarski 1986), flight behaviour (O'Neill & Taylor 1986), diet (O'Neill
Chapter 1: General introduction
12
& Taylor 1989), activity patterns (Inada 2006, 2010; Taylor & Savva 1990) , echolocation calls
(Fueser 1997; Inada 2006, 2010; Rhodes 1996) and thermal energetics (Dixon & Rose 2003), but
these studies have all been limited in scope and have had small sample sizes.
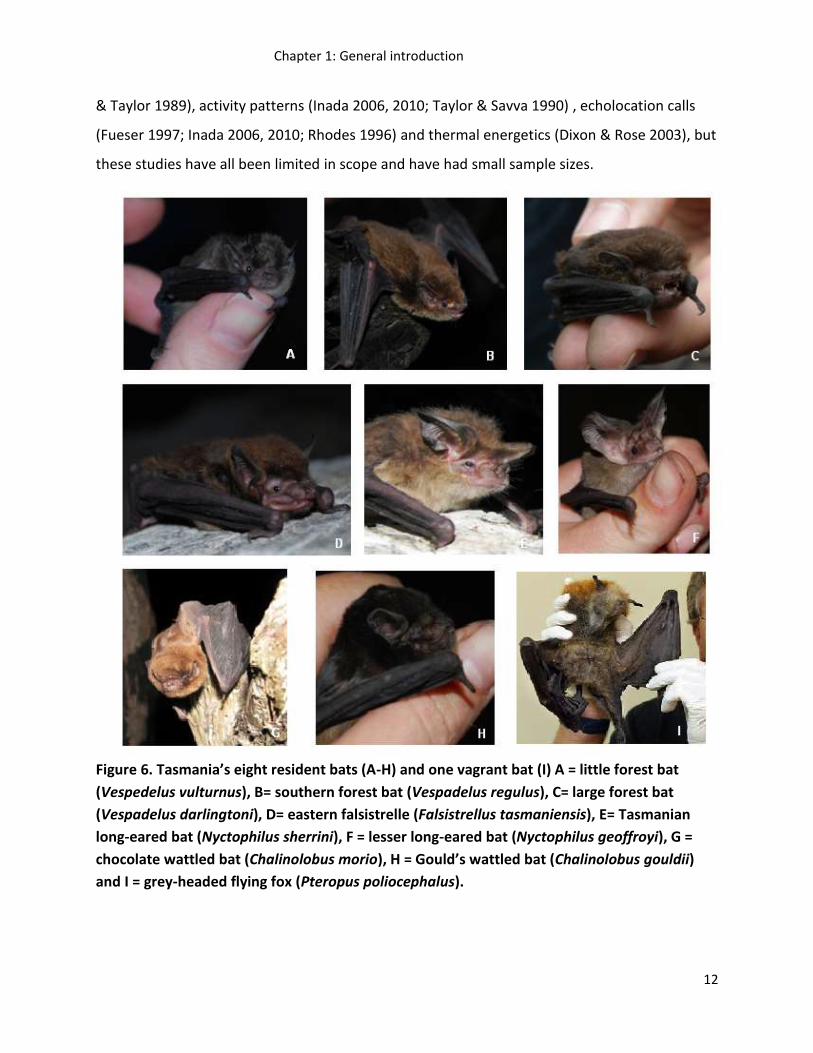
Figure 6. Tasmania’s eight resident bats (A-H) and one vagrant bat (I) A = little forest bat
(Vespedelus vulturnus), B= southern forest bat (Vespadelus regulus), C= large forest bat
(Vespadelus darlingtoni), D= eastern falsistrelle (Falsistrellus tasmaniensis), E= Tasmanian
long-eared bat (Nyctophilus sherrini), F = lesser long-eared bat (Nyctophilus geoffroyi), G =
chocolate wattled bat (Chalinolobus morio), H = Gould’s wattled bat (Chalinolobus gouldii)
and I = grey-headed flying fox (Pteropus poliocephalus).
Chapter 1: General introduction
13
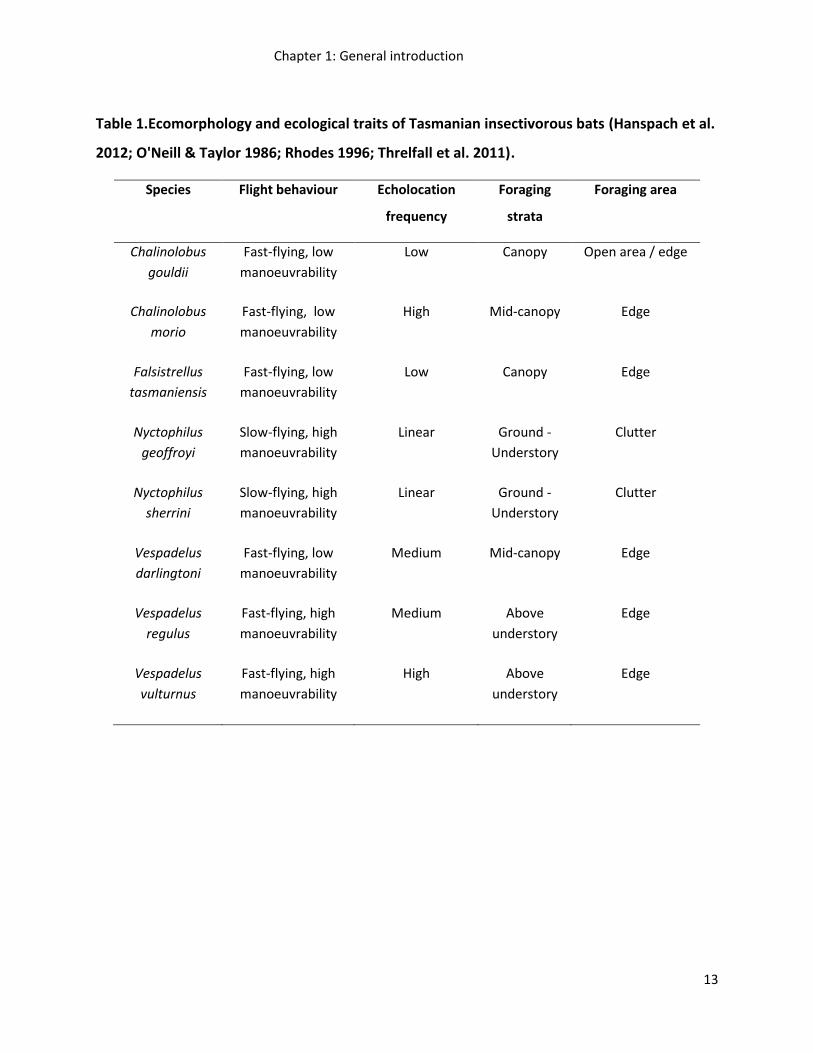
Table 1.Ecomorphology and ecological traits of Tasmanian insectivorous bats (Hanspach et al.
2012; O'Neill & Taylor 1986; Rhodes 1996; Threlfall et al. 2011).
Species Flight behaviour Echolocation
frequency
Foraging
strata
Foraging area
Chalinolobus
gouldii
Fast-flying, low
manoeuvrability
Low Canopy Open area / edge
Chalinolobus
morio
Fast-flying, low
manoeuvrability
High Mid-canopy Edge
Falsistrellus
tasmaniensis
Fast-flying, low
manoeuvrability
Low Canopy Edge
Nyctophilus
geoffroyi
Slow-flying, high
manoeuvrability
Linear Ground -
Understory
Clutter
Nyctophilus
sherrini
Slow-flying, high
manoeuvrability
Linear Ground -
Understory
Clutter
Vespadelus
darlingtoni
Fast-flying, low
manoeuvrability
Medium Mid-canopy Edge
Vespadelus
regulus
Fast-flying, high
manoeuvrability
Medium Above
understory
Edge
Vespadelus
vulturnus
Fast-flying, high
manoeuvrability
High Above
understory
Edge
Research objectives and thesis structure
14
RESEARCH OBJECTIVES AND THESIS STRUCTURE
The overall aim of this thesis is to assess the effectiveness of the multi-scale approach to forest
management at providing suitable habitat for bats, enabling recolonisation of harvested areas
by bats and maintaining Tasmanian bats in timber production landscapes.
This thesis is structured into a series of chapters written in the form of scientific manuscripts
aimed at collectively addressing this overall aim.
Chapter 2 describes the development of an effective approach for identifying bat call
sequences collected during bat call surveys. This chapter includes descriptions of the variation
in Tasmanian bat echolocation calls, compares different approaches to bat call sequence
identification and provides a quantitative assessment of the effectiveness of the bat call
identification approach used in the collection of data for chapters 3, 5 and 6.
Chapter 3 presents and discusses the first evidence of a new bat species record for Tasmania,
the bat call sequences of the white-striped freetail bat, recorded during data collection for
chapters 5 and 6. These findings showcase the power of bat call surveys and the effectiveness
of the approach for bat call identification described in chapter 2 for detecting new bat species.
Chapter 4 examines the annual reproductive and activity cycles of Tasmanian bats and
discusses how these cycles vary compared to lower latitude bat populations. The findings of this
chapter inform the development and interpretation of results in chapters 5 and 6.
Research objectives and thesis structure
15
Chapter 5 investigates differences in roost site selection and behaviour of three Tasmanian bat
species during the breeding season in two timber production landscapes. The aim of this
chapter is to investigate how differences in the type, amount and spatial arrangement of
mature forest influences the extent of bat roost use in retained forest patches in timber
production landscapes.
Chapter 6 investigates bat activity, species assemblages and species richness in different types
of retained forest patches in timber production landscapes. The aim of this chapter is to
determine the importance of different types of retained forest patches for bats and how this
varies temporally and spatially in timber production landscapes.
Chapter 7 synthesises the main findings of this thesis and discusses how they have contributed
to expanding our knowledge of Tasmanian bats and evaluating the effectiveness of the multi-
scale approach to forest management for bats. By collectively examining the main findings of
chapters 5 and 6 this chapter finishes with recommendations for forest management.
Appendices provide additional information on Tasmanian bats prepared during the
development of this thesis.
16
CHAPTER 2: THE EFFECTIVENESS OF DIFFERENT
APPROACHES FOR THE DEVELOPMENT OF A BAT CALL
IDENTIFICATION KEY FOR USE IN AUTOMATED
SOFTWARE: A TASMANIAN CASE STUDY
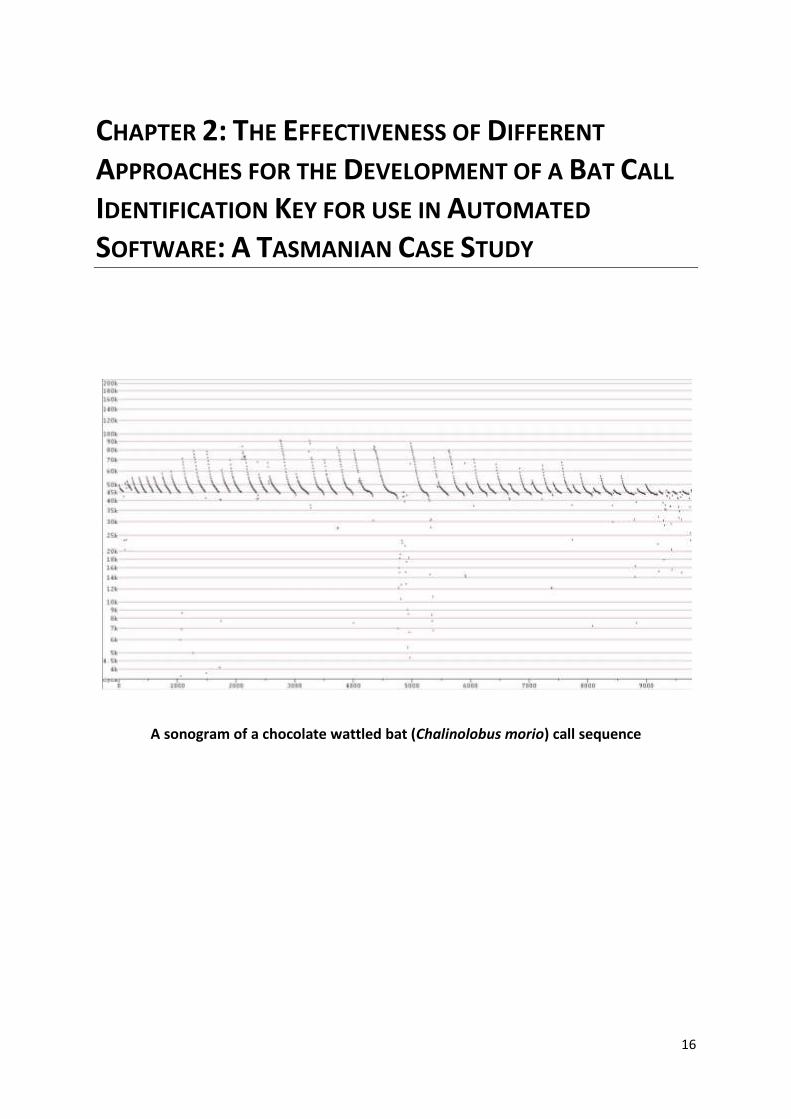
A sonogram of a chocolate wattled bat (Chalinolobus morio) call sequence
Chapter 2: Bat call identification
17
INTRODUCTION
Insectivorous bats use echolocation calls to create a three-dimensional acoustic image for
detecting prey and navigating throughout their environment. Bat echolocation calls vary
between species, leading to their recording as a method to identify bat species assemblages,
richness and activity patterns around the world (Kalcounis et al. 1999; Law et al. 1998;
Wickramasinghe et al. 2003). Such survey methods are particularly useful in areas where
species cannot be effectively detected through capture methods alone (e.g. species adapted
to flying in open spaces - Duffy et al. 2000; Mills et al. 1996), where capture methods are
not practical (e.g. wind farm monitoring at height- Johnson et al. 2004) or for long-term
monitoring (e.g. species declines - Brooks 2011). One of the greatest challenges of
undertaking bat call surveys is determining the most accurate and efficient approach to bat
call identification.
The two most commonly used approaches to bat call identification are manual identification
(O'Farrell et al. 1999) and statistical identification using multivariate statistics and machine
learning algorithms (Britzke et al. 2011). Manual identification enables subjective bat call
identification based on the users’ experience, but it is time consuming when dealing with
large data sets, users cannot calculate a probability of accurate identification and
identifications from different observers may not be directly comparable within or between
studies (Parsons & Szewczac 2009). In contrast, statistical identification does not rely on the
users’ prior experience, it is faster, and users can calculate a probability of identification
enabling direct comparisons between users (Adams et al. 2010). Both approaches do,
however, require a bat reference call library to make identifications of unknown calls
(Parsons & Szewczac 2009).
Various studies have compared the success of different approaches to bat call identification
in an effort to inform users of the most accurate and efficient approach. These studies have
primarily focused on comparing statistical techniques (e.g. Armitage & Ober 2011; Biscardi
et al. 2004; Britzke et al. 2011; Gannon et al. 2004; Preatoni et al. 2005; Redgwell et al.
2009), for example, comparing multivariate statistical techniques such as discriminant
Chapter 2: Bat call identification
18
function analysis with relatively modern approaches to classification problems such as
machine learning techniques (Parsons & Szewczac 2009). These studies have found that
machine learning techniques, such as neural networks, outperform the traditional
approaches such as discriminant function analysis in most (e.g. Armitage & Ober 2011;
Britzke et al. 2011), but not all cases (Preatoni et al. 2005). Statistical techniques such as
random forests have also shown great promise as an alternative approach to neural
networks, but few studies have reported on the accuracy of this approach (Armitage & Ober
2011).
Despite advances in statistical techniques for the identification of bat calls, there are several
limitations of currently used approaches, such as negating a large proportion of the
associated bat reference call library in an effort to avoid pseudo replication (Parsons &
Jones 2000), a lack of ‘species-groups/complexes’ or ‘unknown/unidentified call’ categories
to minimise the likelihood of misidentification of poor quality calls, complicated outputs
(Adams et al. 2010) and an inability to quantify bat call parameters that describe call shape,
which is an important parameter in manual identification using sonograms (O'Farrell et al.
1999).
A third and relatively new approach which overcomes many of the limitations of using
manual identification and statistical techniques is using specialised computer software
programs for bat call identification. Automated acoustical identification programs use either
a pre-defined bat call classification key (AnaScheme: Adams et al. 2010) or use inbuilt
classification algorithms to identify bat calls (SonoBat 2012; SoundID 2012; Wildlife
acoustics Inc. 2013). Only one study has compared acoustical identification programs
Sonobat and Song Scope with statistical techniques at correctly identifying the calls of five
bat species from North America. Both programs were outperformed by the statistical
technique ENN (Evolutionary Neural Network) by 35% and 25% respectively in relation to
overall correct classification rates. Song scope did, however, perform as well as ENN for
some species (Mirzaei et al. 2011). Despite this study, automated acoustical identification
programs have several advantages over manual and statistical approaches, such as the
ability to process large data sets, to use an entire reference call library encompassing the full
Chapter 2: Bat call identification
19
range of bat calls, identify poor quality ‘fragmented’ call sequences as unknowns, identify
bat calls that overlap between species to a species group (also known as a complex) and to
provide a measurable degree of accuracy independent of the users prior knowledge (Adams
et al. 2010).
AnaScheme is an automated bat call identification software program (Gibson & Lumsden
2003) that has shown a great deal of promise in terms of accuracy and efficiency (Adams et
al. 2010; Hanspach et al. 2012; Law & Law 2011; Lumsden & Bennett 2005; Threlfall et al.
2012b). AnaScheme has been developed using the Anabat bat recording system and has the
ability to measure a range of bat call parameters that describe both call frequency and
shape (Adams et al. 2010). However, because it uses pre-defined classification keys rather
than inbuilt classification algorithms, more studies are required to develop methods for
classifying calls and building identification keys. Research is also required to optimise how
programs accurately and efficiently identify bat calls at a continental (e.g. Walters et al.
2012) and/or regional scale (e.g. Adams et al. 2010). Continental scale bat call identification
techniques are new and allow objective, consistent and comparable species identifications
across regions (e.g. Walters et al. 2012). In contrast, regional based keys make a trade-off
between improved identification rates by taking into consideration different species
assemblages present in a given region and the ability to readily compare the results of
studies from different regions, where different keys will often yield different species’
detectability.
The island of Tasmania, 240 kilometres off the south-eastern coast of mainland Australia is
home to eight of Australia’s 67 echolocating bat species - the lesser long-eared bat
(Nyctophilus geoffroyi), Gould’s wattled bat (Chalinolobus gouldi), chocolate wattled bat
(Chalinolobus morio), eastern falsistrelle ( Falsistrellus tasmaniensis), little forest bat
(Vespadelus vulturnus), southern forest bat (Vespadelus regulus), large forest bat
(Vespadelus darlingtoni) and the endemic Tasmanian long-eared bat (Nyctophilus sherrini).
Management issues potentially threatening Tasmania’s bats such as habitat loss, wind farms
and disease require monitoring bat populations, although there are no existing monitoring
programs (Driessen et al. 2011) except carcass monitoring at wind farms(Hull & Cawthen
Chapter 2: Bat call identification
20
2013). This may be in part a result of the difficulty in surveying bats through bat capture
techniques alone. Bat call surveys are a potentially an efficient and accurate method for
surveying Tasmania’s bats. Several studies have described Tasmanian bat calls (Fueser 1997;
Inada 2006, 2010; Rhodes 1996) and two bat call identification keys have been developed at
an island and regional scale, but both keys excluded species not captured and had small
sample sizes (Inada 2010; Law & Law 2011).
The overall aim of this study was to develop an accurate and efficient approach for
identification of Tasmanian bat calls for monitoring bats for management and conservation
projects. This was achieved through: (1) understanding the interspecific variation in
Tasmanian bat calls, (2) comparing the correct identification rates of three statistical
techniques at identifying bat call sequences, (3) using the most appropriate statistical
technique to create a bat call identification key for manual and AnaScheme identification
and (4) using an independent set of calls not included in key development to evaluate the
accuracy of AnaScheme as a tool for bat call identification.
METHODS
Data collection
Between October 2009 and March 2012 Tasmania’s eight bat species were captured using
harp traps (2 bank, Faunatech, AUS) and mist nets (Ecotone, PL) set in gaps and along forest
trails and outside known roosts in eucalypt forests and woodlands throughout 17 locations
in Tasmania, ranging from the north-west to south-east. Harp traps were set in the late
afternoon and checked after sunset, and before sunrise the following day. Mist nets were
set at sunset and checked every 10 minutes for up to four hours after sunset. Upon capture
all bats were identified to species using field guides (Churchill 2009; Taylor et al. 1987).
Animals were weighed, sexed, aged and reproductive condition assessed following the
methods outlined in Churchill (2009).
Bat call sequences, as described in Figure 7 and illustrated in Appendix 3, were recorded
using Anabat SD1-2s and Anabat IIs connected to zero crossings analysis interface modules
Chapter 2: Bat call identification
21
(ZCAIM) (Titley Electronics, Australia). A ‘bat call’ was defined as an individual pulse of
sound produced by a bat and a ‘bat call sequence’ was defined as a series of calls produced
by a bat contained with a 15 second Anabat file (Adams et al. 2010).
To maximise the intra-specific variation in the reference call library, calls were collected in a
variety of situations and, but where logistically possible, calls were recorded in open spaces
such as small forest clearings and roadside edges where all bats ( including clutter tolerant
bats ) had been observed flying. This approach provided two main advantages. Firstly, by
recording calls in open spaces with a forest edge, a variety of different call types were
recorded as the bats navigated in the open and closed areas of vegetation (e.g. clutter and
open space calls). Secondly, this approach allowed us to extend the visual identification of
bats in flight, enabling a larger number of bat reference calls to be recorded. The majority of
calls were recorded from bats released from the hand post-capture and to a lesser extent
upon release from rehabilitation and as individuals emerged from known roosts. Call
sequences were recorded directly to a compact flash memory card in a time-date file and
then downloaded onto a laptop for analysis. A small proportion of bat call sequences were
used from bat call collections during previous work, which were recorded using Anabat IIs
attached to ZCAIMS (Inada 2006, 2010; Law & Law 2010).
Bat call analysis
Bat call sequence files were initially processed by AnaScheme software (Gibson and
Lumsden 2003) to extract call parameters (Table 2). AnaScheme reads bat call sequence
files from Anabat bat detectors, displaying the sequences on a time-frequency graph
(sonogram), fitting a model to the calls and allowing the user to extract parameters that
describe the numerical features of the call for selected call models within the bat call
sequence (Adams et al. 2010) (Figure 7). Not all reference calls recorded were included in
analysis, as when bats emerge from roosts and are released post-capture they generally
produced a steep ‘release/stress/excitement’ call of short duration and high bandwidth
(Figure 7). Such calls were not characteristic of the calls produced by free-flying bats and
were therefore omitted from the bat reference call library. Weak calls with poor call feature
Chapter 2: Bat call identification
22
representation, calls with poor model fit (R2<0.9) to the data points, feeding buzzes, social
calls, calls known to be made by other species and noise mistakenly modelled as calls were
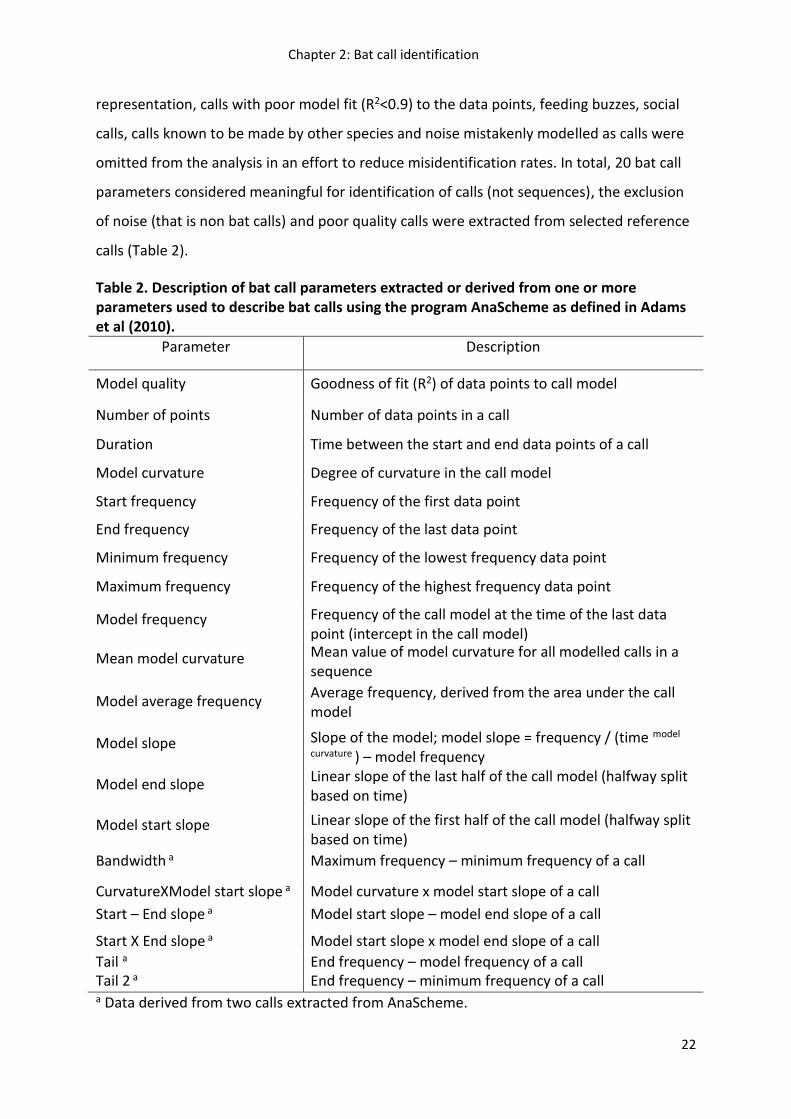
omitted from the analysis in an effort to reduce misidentification rates. In total, 20 bat call
parameters considered meaningful for identification of calls (not sequences), the exclusion
of noise (that is non bat calls) and poor quality calls were extracted from selected reference
calls (Table 2).
Table 2. Description of bat call parameters extracted or derived from one or more parameters used to describe bat calls using the program AnaScheme as defined in Adams et al (2010).
Parameter Description
Model quality Goodness of fit (R2) of data points to call model
Number of points Number of data points in a call
Duration Time between the start and end data points of a call
Model curvature Degree of curvature in the call model
Start frequency Frequency of the first data point
End frequency Frequency of the last data point
Minimum frequency Frequency of the lowest frequency data point
Maximum frequency Frequency of the highest frequency data point
Model frequency Frequency of the call model at the time of the last data point (intercept in the call model)
Mean model curvature Mean value of model curvature for all modelled calls in a sequence
Model average frequency Average frequency, derived from the area under the call model
Model slope Slope of the model; model slope = frequency / (time model
curvature ) – model frequency
Model end slope Linear slope of the last half of the call model (halfway split based on time)
Model start slope Linear slope of the first half of the call model (halfway split based on time)
Bandwidth a Maximum frequency – minimum frequency of a call
CurvatureXModel start slope a Model curvature x model start slope of a call
Start – End slope a Model start slope – model end slope of a call
Start X End slope a Model start slope x model end slope of a call
Tail a End frequency – model frequency of a call Tail 2 a End frequency – minimum frequency of a call a Data derived from two calls extracted from AnaScheme.
Chapter 2: Bat call identification
23
Three statistical techniques: discriminant function analysis, classification tree and random
forests were compared to assess accuracy (bat call sequence misidentification) and
detection (correction identification) ability of each approach and for later comparison with
AnaScheme. Traditionally, discriminant function analysis has been used to identify bat calls
and determine what bat call parameters are important for species identification (i.e.
Parsons 1997), but more recently, classification trees (Adams et al. 2010) and random
forests analysis (Armitage & Ober 2011) have been used. All three techniques vary in
output, assumptions and ability to handle multi-species datasets, as detailed below.
Discriminant function analysis generates a linear combination of variables that maximises
the probability of correctly assigning observations (i.e. bat calls ) to their pre-determined
groups (i.e. species) (Quinn & Keough 2002). This approach, however, has several
limitations: it may not be appropriate for suites of groups (i.e. species) using large data sets
(Gannon et al. 2004), assumes data is normally distributed, and is not able to handle highly
correlated variables resulting in the exclusion of some bat call parameters that may be
useful for identification (e.g. Armitage & Ober 2011). Alternative approaches such as
classification tree and random forests may be more appropriate for multi-species datasets
and correlated bat call parameters.
Classification trees and random forests are tree-based statistical techniques that use a non-
parametric approach for conducting classification analyses by recursive partitioning. Unlike
discriminant function analysis, they are very efficient at selecting from large numbers of
predictor variables (Lunetta et al. 2004). Classification trees create a tree by recursively
partitioning the observations (i.e. bat calls) into subgroups based on categorical responses
(i.e. species). At each node of the tree, the explanatory variable (i.e. bat call parameter)
giving the most homogenous sub-groups (i.e. species) is selected. In this study, classification
trees were constructed using the ‘rpart’ package in R (De'ath & Fabricius 2000). Initially a
large tree was constructed to include all bat calls and cross-validation using the “1-SE rule”
to determine the optimal tree size (Maindonald & Braun 2007).
Chapter 2: Bat call identification
24
Random forests, an extension of classification tree analysis, is a machine learning technique
that uses multiple classification trees to increase classification accuracy and stability, reduce
the effects of bias and correlation among variables compared to classification trees (Cutler
et al. 2007). Random forests grows multiple trees on a bootstrap sample of the observations
(i.e. bat calls) and randomly selects potential predictors to determine the best split at each
node on each tree. Those observations left out of the analysis (OOB) are used to estimate
prediction error. Importantly, because each tree is grown from a different bootstrap sample,
there is a different set of OOBs for each tree. The correct classification for each observation
(i.e. bat call) is determined by the class with the most votes. Random Forests is also useful
for measuring variable importance, as it provides an objective method of measuring variable
importance (Cutler et al. 2007). For the purpose of this study, variable importance was
measured by calculating importance scores using the mean decrease in accuracy measure
for each parameter (Lunetta et al. 2004). The mean decrease in accuracy measure calculates
the average decrease in prediction accuracies in the OOB portions of the data from the
permuting values of the variables. The larger the mean decrease in accuracy value, the more
important the variable. Although this technique does not produce a tree or model of any
kind, it is useful to determine variable importance when little is known about variable
interactions (Lunetta et al. 2004), so may be well suited for bat calls. All statistical
techniques were performed in the statistical program R using the ‘MASS’, ‘mvpart’ and
‘rpart’ packages (R Development Core Team 2006).
The development of a bat call identification key
A bat call identification key was developed following the methodology outlined in Adams et
al.(2010), which involved creating sub-sets of bat reference calls by manually selecting
species calls that overlapped in model frequency. For each sub-set of bat reference calls, a
bat call identification key was created using classification tree analysis as described
previously. The results from random forests were used to assist in variable selection (Figure
9). The classification tree was pruned at a node when >90% of calls were assigned to a
single species. If <90% of calls were assigned to one or more species, a species complex was
formed. The final bat call identification key was constructed using Python programming
Chapter 2: Bat call identification
25
(ActivePython V2.2.1-222) by combining the bat call classification trees for each frequency-
based sub-set of the reference call library. Additional classification trees were included in
the key to exclude poor quality calls and noise (Appendix 2).
The following conditions were set in AnaScheme for testing the bat call identification key:
call identifications were only made if model quality > 0.9, more than 50% of calls in a
sequence were identified to the same species, at least 3 calls in total had to be identified to
the same species. A sequence that could not be identified to species, using the species
identification data for each call and the above conditions was classified as unknown. Further
information on AnaScheme is available in Adams et al. (2010).
The accuracy and detection ability of the key was tested using reference call sequences not
included in the development of the bat call identification key by running the initial key in
AnaScheme and calculating the proportion of call sequences correctly identified (detection)
and misidentified (accuracy). The results of this first test were used to refine the key to
decrease misidentifications and where possible increase correct identifications. The refined
key was then re-tested on the original test set and a set of calls of free-flying bats that were
manually identified.
RESULTS
A total of 12,004 high quality bat calls from 537 call sequences were recorded from 446
individual bats. Sample sizes varied markedly, ranging from 147 to 3916 calls and 8 to 153
sequences per species (Table 3). Variation in the number of bat calls recorded resulted from
a combination of low capture rates for several species (i.e. C. gouldii, F. tasmaniensis and N.
sherrini) and post-release flight behaviour of circling around the area of release, which
enabled a higher proportion of calls to be recorded per sequence (i.e. C. morio). Sonograms
of bat reference calls are in Appendix 1.
Chapter 2: Bat call identification
26
An exploratory examination of the reference call collection showed extensive overlap in bat
call parameters that described call frequency and shape, such as model frequency and
model end slope. This was particularly evident for the two Nyctophilus spp., and for the
three Vespadelus spp. and C. morio (Figure 2; Table 4). Although the two Nyctophilus spp.
exhibited the broadest range of bat call frequencies they were easily distinguishable as a
genus from all other species using the call parameter model end slope. Model end slope and
other parameters describing call shape could not readily distinguish all the calls of C. morio
and the three Vepsadelus spp. C. gouldii and F. tasmaniensis could be readily distinguished
using the call parameters model frequency and model end slope.
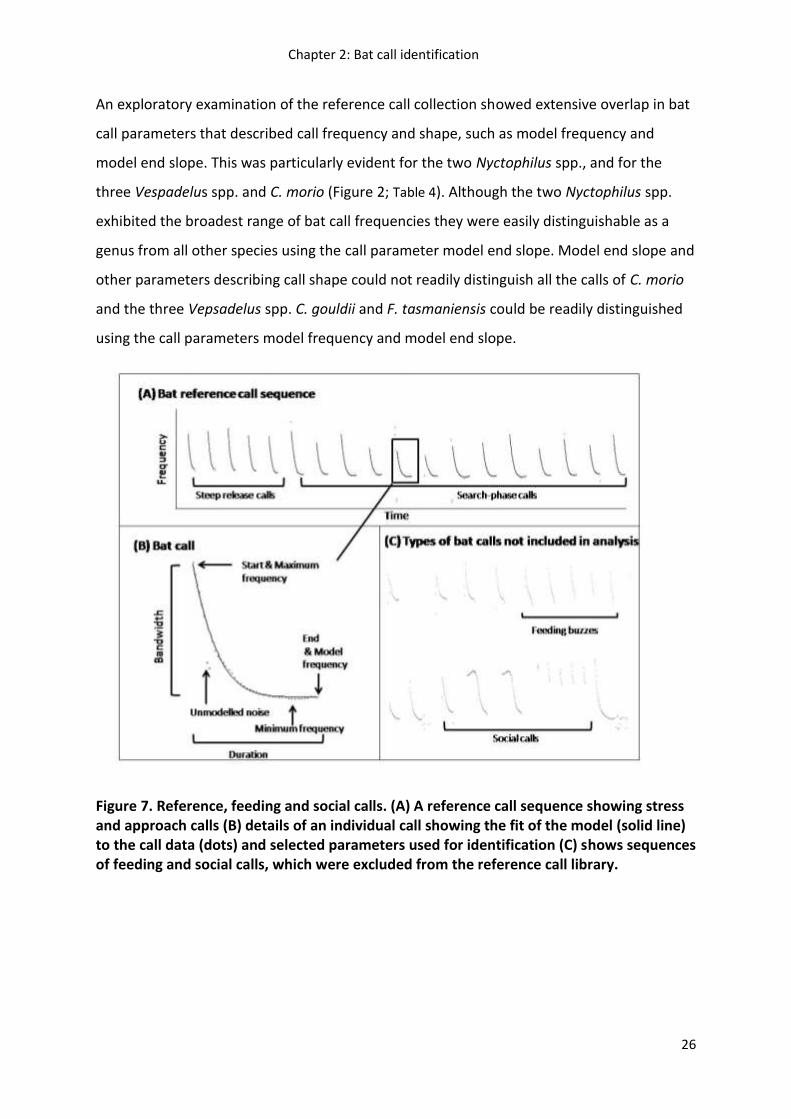
Figure 7. Reference, feeding and social calls. (A) A reference call sequence showing stress and approach calls (B) details of an individual call showing the fit of the model (solid line) to the call data (dots) and selected parameters used for identification (C) shows sequences of feeding and social calls, which were excluded from the reference call library.
Chapter 2: Bat call identification
27
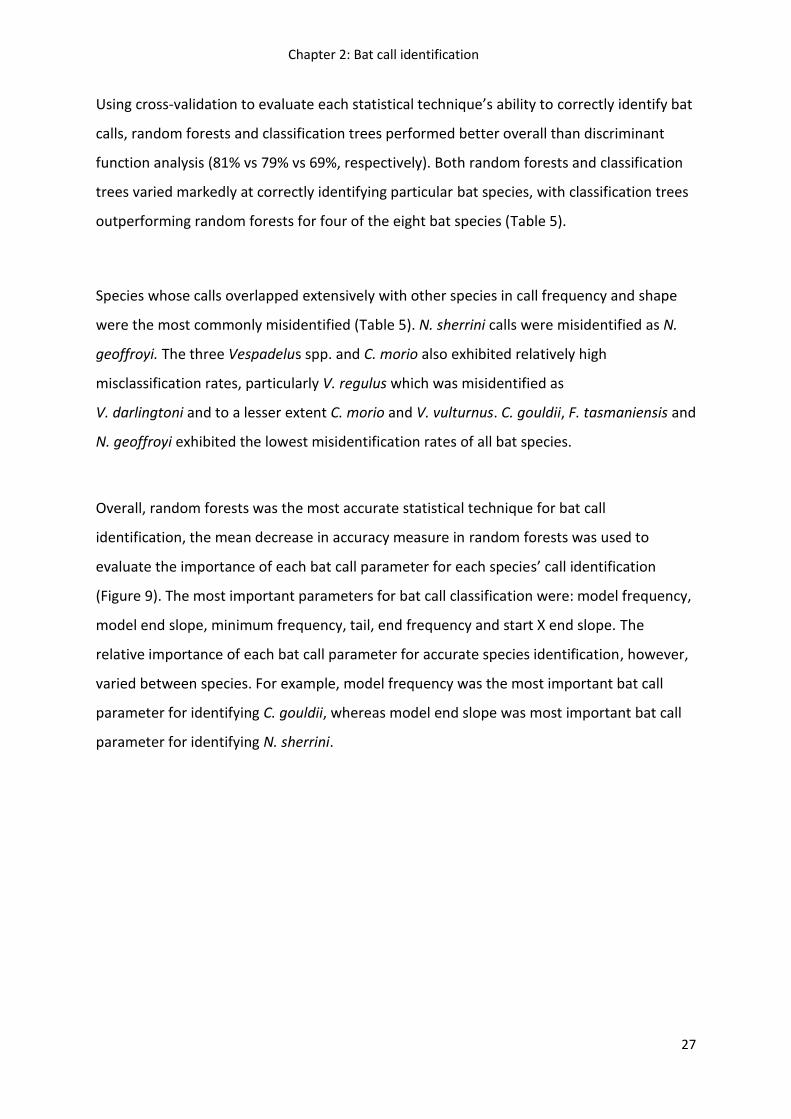
Using cross-validation to evaluate each statistical technique’s ability to correctly identify bat
calls, random forests and classification trees performed better overall than discriminant
function analysis (81% vs 79% vs 69%, respectively). Both random forests and classification
trees varied markedly at correctly identifying particular bat species, with classification trees
outperforming random forests for four of the eight bat species (Table 5).
Species whose calls overlapped extensively with other species in call frequency and shape
were the most commonly misidentified (Table 5). N. sherrini calls were misidentified as N.
geoffroyi. The three Vespadelus spp. and C. morio also exhibited relatively high
misclassification rates, particularly V. regulus which was misidentified as
V. darlingtoni and to a lesser extent C. morio and V. vulturnus. C. gouldii, F. tasmaniensis and
N. geoffroyi exhibited the lowest misidentification rates of all bat species.
Overall, random forests was the most accurate statistical technique for bat call
identification, the mean decrease in accuracy measure in random forests was used to
evaluate the importance of each bat call parameter for each species’ call identification
(Figure 9). The most important parameters for bat call classification were: model frequency,
model end slope, minimum frequency, tail, end frequency and start X end slope. The
relative importance of each bat call parameter for accurate species identification, however,
varied between species. For example, model frequency was the most important bat call
parameter for identifying C. gouldii, whereas model end slope was most important bat call
parameter for identifying N. sherrini.
Chapter 2: Bat call identification
28
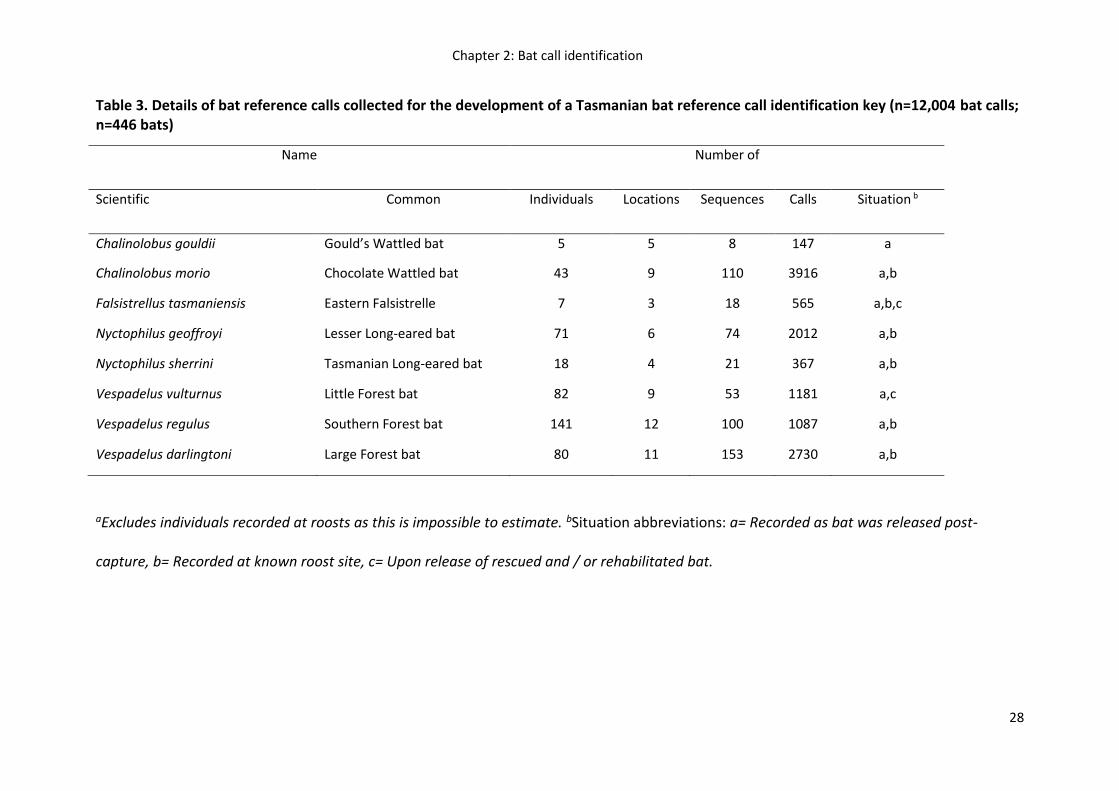
Table 3. Details of bat reference calls collected for the development of a Tasmanian bat reference call identification key (n=12,004 bat calls; n=446 bats)
aExcludes individuals recorded at roosts as this is impossible to estimate. bSituation abbreviations: a= Recorded as bat was released post-
capture, b= Recorded at known roost site, c= Upon release of rescued and / or rehabilitated bat.
Name Number of
Scientific Common Individuals Locations Sequences Calls Situation b
Chalinolobus gouldii Gould’s Wattled bat 5 5 8 147 a
Chalinolobus morio Chocolate Wattled bat 43 9 110 3916 a,b
Falsistrellus tasmaniensis Eastern Falsistrelle 7 3 18 565 a,b,c
Nyctophilus geoffroyi Lesser Long-eared bat 71 6 74 2012 a,b
Nyctophilus sherrini Tasmanian Long-eared bat 18 4 21 367 a,b
Vespadelus vulturnus Little Forest bat 82 9 53 1181 a,c
Vespadelus regulus Southern Forest bat 141 12 100 1087 a,b
Vespadelus darlingtoni Large Forest bat 80 11 153 2730 a,b
Chapter 2: Bat call identification
29
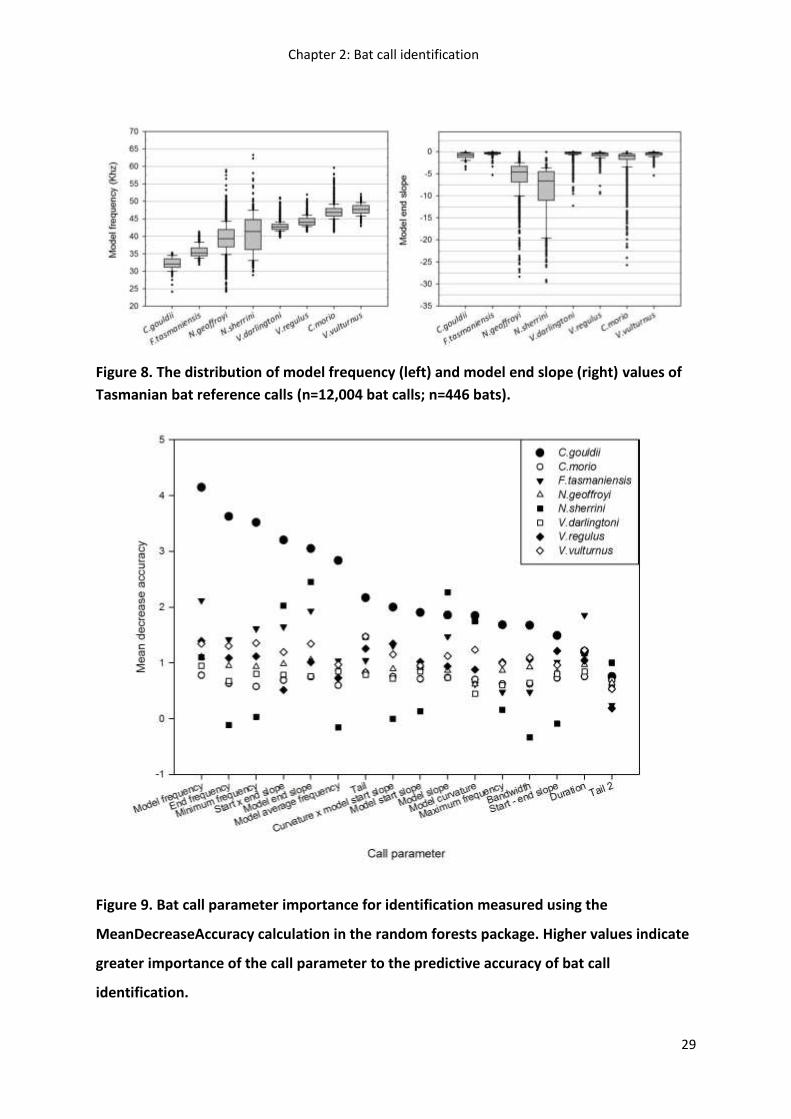
Figure 8. The distribution of model frequency (left) and model end slope (right) values of
Tasmanian bat reference calls (n=12,004 bat calls; n=446 bats).
Figure 9. Bat call parameter importance for identification measured using the
MeanDecreaseAccuracy calculation in the random forests package. Higher values indicate
greater importance of the call parameter to the predictive accuracy of bat call
identification.
Chapter 2: Bat call identification
30
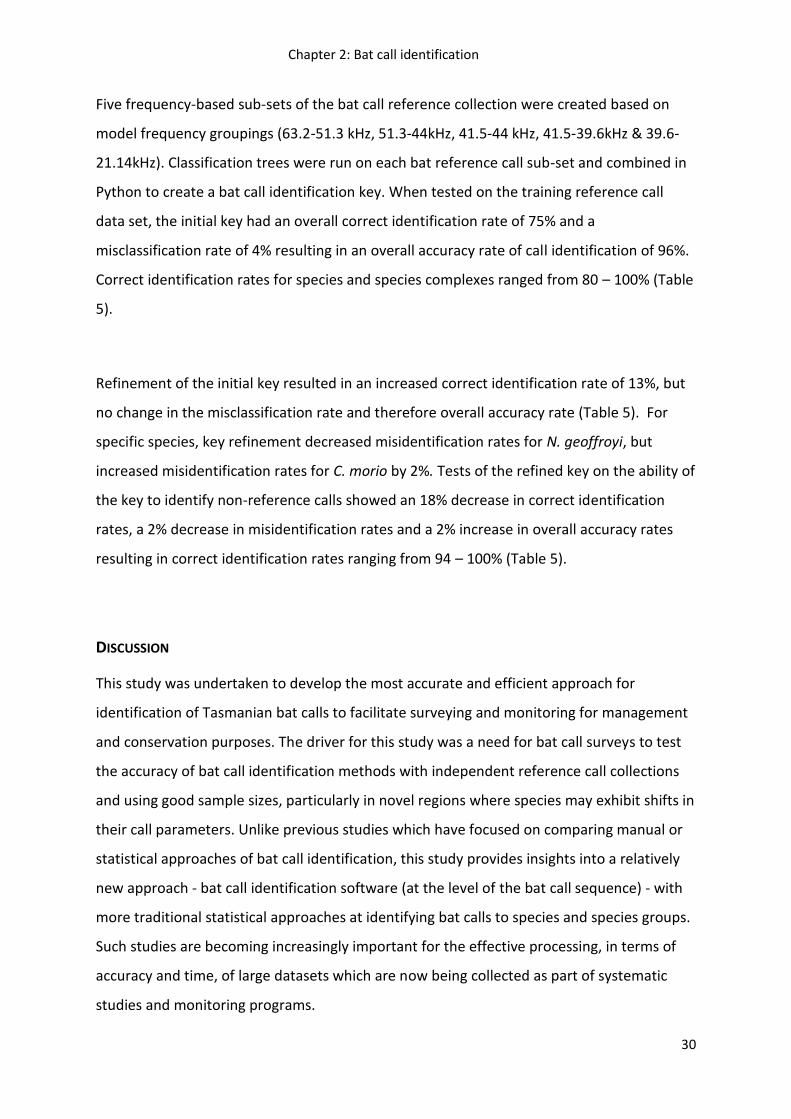
Five frequency-based sub-sets of the bat call reference collection were created based on
model frequency groupings (63.2-51.3 kHz, 51.3-44kHz, 41.5-44 kHz, 41.5-39.6kHz & 39.6-
21.14kHz). Classification trees were run on each bat reference call sub-set and combined in
Python to create a bat call identification key. When tested on the training reference call
data set, the initial key had an overall correct identification rate of 75% and a
misclassification rate of 4% resulting in an overall accuracy rate of call identification of 96%.
Correct identification rates for species and species complexes ranged from 80 – 100% (Table
5).
Refinement of the initial key resulted in an increased correct identification rate of 13%, but
no change in the misclassification rate and therefore overall accuracy rate (Table 5). For
specific species, key refinement decreased misidentification rates for N. geoffroyi, but
increased misidentification rates for C. morio by 2%. Tests of the refined key on the ability of
the key to identify non-reference calls showed an 18% decrease in correct identification
rates, a 2% decrease in misidentification rates and a 2% increase in overall accuracy rates
resulting in correct identification rates ranging from 94 – 100% (Table 5).
DISCUSSION
This study was undertaken to develop the most accurate and efficient approach for
identification of Tasmanian bat calls to facilitate surveying and monitoring for management
and conservation purposes. The driver for this study was a need for bat call surveys to test
the accuracy of bat call identification methods with independent reference call collections
and using good sample sizes, particularly in novel regions where species may exhibit shifts in
their call parameters. Unlike previous studies which have focused on comparing manual or
statistical approaches of bat call identification, this study provides insights into a relatively
new approach - bat call identification software (at the level of the bat call sequence) - with
more traditional statistical approaches at identifying bat calls to species and species groups.
Such studies are becoming increasingly important for the effective processing, in terms of
accuracy and time, of large datasets which are now being collected as part of systematic
studies and monitoring programs.
Chapter 2: Bat call identification
31
Similar to their mainland conspecifics, Tasmanian bats exhibited interspecific variation in
echolocation calls, enabling calls to be identified to species (Milne 2002; Pennay et al. 2004).
The level of inter-specific variation in echolocation calls was similar to that described in
previous unpublished research on Tasmanian bat calls. The large number of bat calls
recorded in this study also rectified the species identification issues of previous studies
where either particular species were missing from datasets or reference calls were collected
from bats not identified in the hand (Fueser 1997; Inada 2006, 2010; Law & Law 2011;
Rhodes 1996).
It would be useful from a methodological and evolutionary biology perspective to compare
bat calls from Tasmania with conspecifics on mainland Australia, and between different
regions of Tasmania. Several studies have highlighted geographic variation in bat
echolocation calls throughout species ranges in Australasia (Armstrong & Coles 2007; Law et
al. 2002; Leary & Pennay 2011; Reinhold et al. 2001). In this study, comparison of
geographic variation in bat calls between Tasmanian and mainland bats was confounded by
issues of methodology, a lack of published descriptions of bat calls, and, when published,
variations in bat call parameters used to describe bat calls (De Oliveira et al. 1999; Jones &
Corben 1993; Law et al. 2002; Leary & Pennay 2011; Reinhold et al. 2001; Scanlon & Petit
2008).
Tasmanian bat species exhibit similar overlaps in bat call parameters to their mainland
conspecifics (Pennay et al. 2004). Species such as N. geoffroyi and N. sherrini overlapped
considerably in call parameters in Tasmania. Such overlap is well recognised on mainland
Australia in the Nyctophilus genus and prevents the reliable identification of Nyctophilus to
species level throughout its range using Anabats (Bullen & McKenzie 2001; Hanspach et al.
2012; Lumsden & Bennett 2005).
Chapter 2: Bat call identification
32
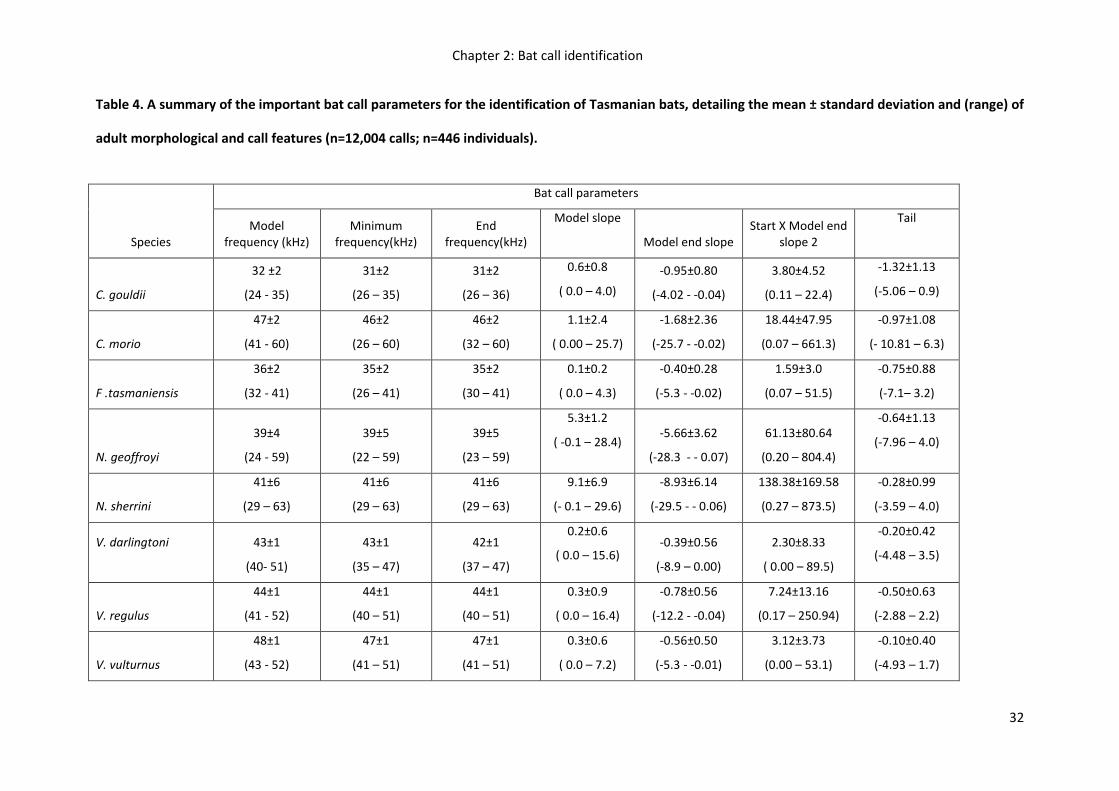
Table 4. A summary of the important bat call parameters for the identification of Tasmanian bats, detailing the mean ± standard deviation and (range) of
adult morphological and call features (n=12,004 calls; n=446 individuals).
Species
Bat call parameters
Model frequency (kHz)
Minimum frequency(kHz)
End frequency(kHz)
Model slope
Model end slope Start X Model end
slope 2
Tail
C. gouldii
32 ±2
(24 - 35)
31±2
(26 – 35)
31±2
(26 – 36)
0.6±0.8
( 0.0 – 4.0)
-0.95±0.80
(-4.02 - -0.04)
3.80±4.52
(0.11 – 22.4)
-1.32±1.13
(-5.06 – 0.9)
C. morio
47±2
(41 - 60)
46±2
(26 – 60)
46±2
(32 – 60)
1.1±2.4
( 0.00 – 25.7)
-1.68±2.36
(-25.7 - -0.02)
18.44±47.95
(0.07 – 661.3)
-0.97±1.08
(- 10.81 – 6.3)
F .tasmaniensis
36±2
(32 - 41)
35±2
(26 – 41)
35±2
(30 – 41)
0.1±0.2
( 0.0 – 4.3)
-0.40±0.28
(-5.3 - -0.02)
1.59±3.0
(0.07 – 51.5)
-0.75±0.88
(-7.1– 3.2)
N. geoffroyi
39±4
(24 - 59)
39±5
(22 – 59)
39±5
(23 – 59)
5.3±1.2
( -0.1 – 28.4) -5.66±3.62
(-28.3 - - 0.07)
61.13±80.64
(0.20 – 804.4)
-0.64±1.13
(-7.96 – 4.0)
N. sherrini
41±6
(29 – 63)
41±6
(29 – 63)
41±6
(29 – 63)
9.1±6.9
(- 0.1 – 29.6)
-8.93±6.14
(-29.5 - - 0.06)
138.38±169.58
(0.27 – 873.5)
-0.28±0.99
(-3.59 – 4.0)
V. darlingtoni
43±1
(40- 51)
43±1
(35 – 47)
42±1
(37 – 47)
0.2±0.6
( 0.0 – 15.6) -0.39±0.56
(-8.9 – 0.00)
2.30±8.33
( 0.00 – 89.5)
-0.20±0.42
(-4.48 – 3.5)
V. regulus
44±1
(41 - 52)
44±1
(40 – 51)
44±1
(40 – 51)
0.3±0.9
( 0.0 – 16.4)
-0.78±0.56
(-12.2 - -0.04)
7.24±13.16
(0.17 – 250.94)
-0.50±0.63
(-2.88 – 2.2)
V. vulturnus
48±1
(43 - 52)
47±1
(41 – 51)
47±1
(41 – 51)
0.3±0.6
( 0.0 – 7.2)
-0.56±0.50
(-5.3 - -0.01)
3.12±3.73
(0.00 – 53.1)
-0.10±0.40
(-4.93 – 1.7)
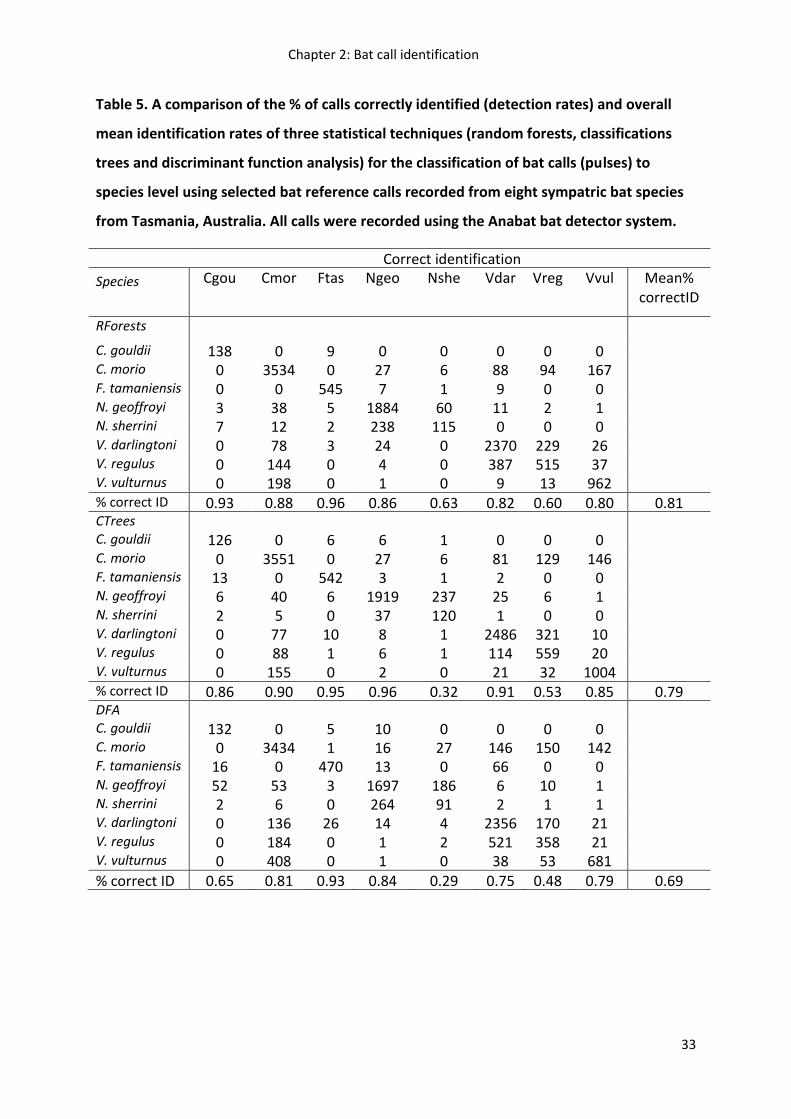
Chapter 2: Bat call identification
33
Table 5. A comparison of the % of calls correctly identified (detection rates) and overall
mean identification rates of three statistical techniques (random forests, classifications
trees and discriminant function analysis) for the classification of bat calls (pulses) to
species level using selected bat reference calls recorded from eight sympatric bat species
from Tasmania, Australia. All calls were recorded using the Anabat bat detector system.
Correct identification
Species Cgou Cmor Ftas Ngeo Nshe Vdar Vreg Vvul Mean% correctID
RForests
C. gouldii 138 0 9 0 0 0 0 0 C. morio 0 3534 0 27 6 88 94 167 F. tamaniensis 0 0 545 7 1 9 0 0 N. geoffroyi 3 38 5 1884 60 11 2 1 N. sherrini 7 12 2 238 115 0 0 0 V. darlingtoni 0 78 3 24 0 2370 229 26 V. regulus 0 144 0 4 0 387 515 37 V. vulturnus 0 198 0 1 0 9 13 962 % correct ID
0.93 0.88 0.96 0.86 0.63 0.82 0.60 0.80 0.81
CTrees C. gouldii 126 0 6 6 1 0 0 0 C. morio 0 3551 0 27 6 81 129 146 F. tamaniensis 13 0 542 3 1 2 0 0 N. geoffroyi 6 40 6 1919 237 25 6 1 N. sherrini 2 5 0 37 120 1 0 0 V. darlingtoni 0 77 10 8 1 2486 321 10 V. regulus 0 88 1 6 1 114 559 20 V. vulturnus 0 155 0 2 0 21 32 1004 % correct ID 0.86 0.90 0.95 0.96 0.32 0.91 0.53 0.85 0.79 DFA C. gouldii 132 0 5 10 0 0 0 0 C. morio 0 3434 1 16 27 146 150 142 F. tamaniensis 16 0 470 13 0 66 0 0 N. geoffroyi 52 53 3 1697 186 6 10 1 N. sherrini 2 6 0 264 91 2 1 1 V. darlingtoni 0 136 26 14 4 2356 170 21 V. regulus 0 184 0 1 2 521 358 21 V. vulturnus 0 408 0 1 0 38 53 681 % correct ID
ID
0.65 0.81 0.93 0.84 0.29 0.75 0.48 0.79 0.69
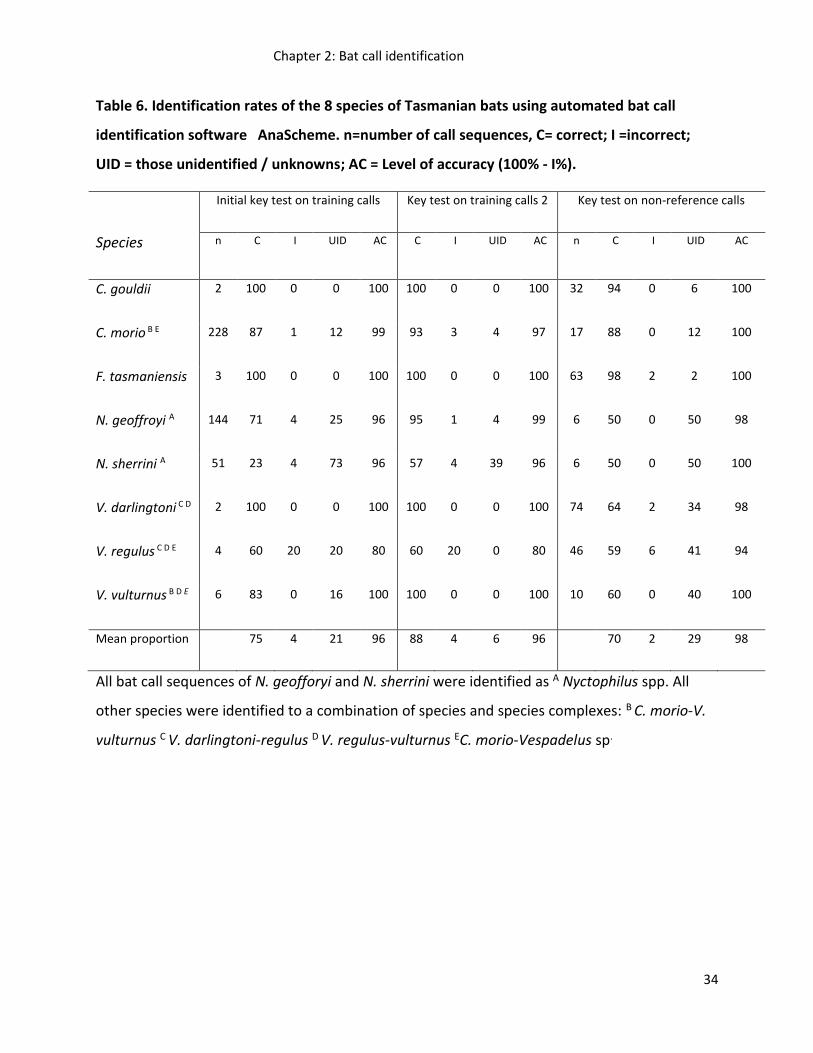
Chapter 2: Bat call identification
34
Table 6. Identification rates of the 8 species of Tasmanian bats using automated bat call
identification software AnaScheme. n=number of call sequences, C= correct; I =incorrect;
UID = those unidentified / unknowns; AC = Level of accuracy (100% - I%).
Species
Initial key test on training calls Key test on training calls 2 Key test on non-reference calls
n C I UID AC C I UID AC n C I UID AC
C. gouldii 2 100 0 0 100 100 0 0 100 32 94 0 6 100
C. morio B E 228 87 1 12 99 93 3 4 97 17 88 0 12 100
F. tasmaniensis 3 100 0 0 100 100 0 0 100 63 98 2 2 100
N. geoffroyi A 144 71 4 25 96 95 1 4 99 6 50 0 50 98
N. sherrini A 51 23 4 73 96 57 4 39 96 6 50 0 50 100
V. darlingtoni C D 2 100 0 0 100 100 0 0 100 74 64 2 34 98
V. regulus C D E 4 60 20 20 80 60 20 0 80 46 59 6 41 94
V. vulturnus B D E 6 83 0 16 100 100 0 0 100 10 60 0 40 100
Mean proportion 75 4 21 96 88 4 6 96 70 2 29 98
All bat call sequences of N. geofforyi and N. sherrini were identified as A Nyctophilus spp. All
other species were identified to a combination of species and species complexes: B C. morio-V.
vulturnus C V. darlingtoni-regulus D V. regulus-vulturnus EC. morio-Vespadelus sp.
Chapter 2: Bat call identification
35
Similarly, the three Vespadelus species in Tasmania (V. vulturnus, V. regulus and V. darlingtoni)
exhibited broad frequency ranges in their calls, overlapping extensively in frequencies. Such
overlap is similar to that observed in south-eastern Australia, where V. darlingtoni and V.
regulus can call between 40 – 48 kHz and V. vulturnus between 43 - 53 kHz depending on region
(Law et al. 2002). Law et al. (2002) investigated call frequency shifts in Vespadelus throughout
New South Wales and found that all three species exhibited shifts in call frequency throughout
their range. It is unclear what mechanisms are behind such shifts. Understanding shifts in bat
call frequencies could increase our ability to identify species in particular regions where species
may shift their call frequency in response to the presence of other species (Law et al. 2002).
Future work in Tasmania should aim to quantitatively compare bat call variation throughout the
island and if present, aim to use regional specific reference call libraries and identification keys
to potentially increase accuracy rates.
The three statistical techniques evaluated in this study showed considerable variation in their
ability to correctly identify Tasmanian bat calls. Overall random forests outperformed
classification tree and discriminant function analysis at identifying bat calls (mean correct
identification - 81% vs 79% vs 69% respectively). Identification rates were within 3% of each
other for random forests and classification tree analysis, with classification trees outperforming
random forests for identifying certain bat species calls. Several comparative studies have
demonstrated that machine learning techniques such as neural networks and random forests
perform better than discriminant function analysis at correctly identifying bat calls (Armitage &
Ober 2011; Britzke et al. 2011; Parsons & Jones 2000; Redgwell et al. 2009). A review of the
literature shows, however, that correct identification rates for bat calls vary markedly within
and between species. For example, neural networks: 62% to 100% (Armitage & Ober 2011;
Britzke et al. 2011; Jennings et al. 2008; Parsons 2001; Parsons & Jones 2000; Preatoni et al.
2005; Redgwell et al. 2009), random forests: 70% to 96% (Armitage & Ober 2011), discriminant
function analysis - 71 - 87% (Armitage & Ober 2011; Parsons & Jones 2000; Preatoni et al.
2005), support vector machines (SVM): 87 - 96% (Armitage & Ober 2011; Redgwell et al. 2009),
Chapter 2: Bat call identification
36
adaptive regression splines 93% (Britzke et al. 2011) and classification trees: 56% to 95%
(Adams et al. 2010; Herr et al. 1997; Preatoni et al. 2005).
It is important to recognise that when selecting an approach to bat call identification on the
basis of accuracy rates, rates will vary depending on the type, number and degree of call
overlap of species, quality of calls recorded, call recording technique, sample size of reference
calls, subjective approach used to categorise calls, the software used to measure call
parameters and the call parameters measured (Britzke et al. 2011; Herr et al. 1997; O'Farrell et
al. 1999). For example, Parsons et al. (2001) reported a correct identification rate of 97% using
artificial neural networks, whereas Preatoni et al. (2005) reported a much lower correct
identification rate of 64%. The variation in accuracy rates between these studies is likely to be
in part because Parsons et al. (2001) was classifying the calls of the only two extant
echolocating bat species in New Zealand, which are considered to be readily identifiable from
their calls. In contrast, Preatoni et al (2005) was classifying the calls of 20 bat species from
Europe that overlap extensively in call parameters.
The selection of statistical technique depends on the type of output the user requires. Although
random forest was the most accurate statistical technique for bat call identification and
provided a means of rating call parameter importance for identification purposes, its output
was not as easily interpretable as classification tree analysis, which produced a diagrammatic
and coded tree. The benefit of classification tree output is that it can be used as a manual bat
call identification tool and can be easily coded for use in automated bat call identification
software - AnaScheme (Adams et al. 2010). In contrast, random forest is a more effective
technique at determining the most important call parameters for bat call identification and can
be used when building classification trees to improve accuracy rates.
AnaScheme shows considerable promise for accurate bat call identification, with an overall
correct identification rate of 98% achieved in this study, outperforming the statistical
Chapter 2: Bat call identification
37
techniques of random forests, classification tree and discriminant function analysis. Only 2% of
calls were misidentified. Unlike the statistical techniques tested, AnaScheme was able to
classify poor quality calls as unknowns, which reduced the number of calls correctly identified
to 70%, but greatly reduced misclassification rates to 2% of calls – much lower than statistical
techniques. Calculating and minimising the misclassification rates of bat call identification
approaches is important, particularly when detecting rare or threatened species where
misidentification could have implications for research and management.
Like statistical techniques, the accuracy rate of bat call identification keys used in AnaScheme to
identify bat calls varied across regions and species, with misclassification rates ranging from 0
to 0.7% of calls (Adams et al. 2010; Law & Chidel 2006; Lumsden & Bennett 2005). In Victoria,
Lumsden and Bennett (2005) achieved an overall correct identification rate of 72% (range 32-
100% ) whereas in New South Wales Law and Chidel (2002) achieved 63% overall (range 33-
100%) and Adams et al. (2010) 75.4% overall (range 20-100%). Misclassification rates of bat
calls will depend largely on the particular assemblages of bats present in a region and the
degree of overlap in their calls.
AnaScheme is one of few automated sound identification programs developed, but is unique in
that it has been specifically designed for bat calls recorded using zero-cross analysis and
frequency-division recorders such as Anabats (Adams et al. 2010). Other automated sound
identification programs use full-spectrum call recordings from time-expansion recorders such as
the Petterson D240X and EM3 include SonoBat, Song Scope and SoundID (Boucher et al. 2012;
SonoBat 2012; SoundID 2012) and more recently Kaleidoscope which can use calls recorded in
any format (Wildlife acoustics Inc. 2013). SonoBat is the only other automated sound
identification program specifically designed for identifying bat calls. It uses a hierarchical
decision algorithm-based approach that uses amplitude and time-frequency parameters of
reference calls from across North American to identify bat calls. It shares many similar
parameters to AnaScheme in that user-defined call quality can be assessed and poor quality
Chapter 2: Bat call identification
38
calls, noise and non-bat calls can be ignored to reduce misclassification rates. SonoBat classifies
sequences to species and species complexes by generating a mean sequence decision of the
calls identified in the sequence and provides a reportable level of identification probability
(Kennedy 2011; SonoBat 2012). Like AnaScheme, manual identification is sometimes required
for low frequency bat calls which can be confused with bird and insect noises or for bat species
which are poorly represented in reference call libraries (Kennedy 2011). The main limitation of
SonoBat however is that currently it only identifies the calls of North American bat species
(Pennay 2012; SonoBat 2012).
Song Scope and Sound ID were originally developed for bird call identification (Agranat 2009;
Boucher et al. 2012) and have only recently been applied to bat call identification (Boucher
2012; Pennay 2012). Like Anascheme, Song Scope and Sound ID are not limited by region and
can be used anywhere where reference calls have been collected. Unlike AnaScheme, Song
Scope uses a classification algorithm approach that identifies call sequences based on specific
patterns of interest (Syllables) rather than individual calls (Wildlife acoustics Inc. 2012). In
contrast, SoundID uses a Geometric distance similarity measure approach to call identification.
The limitations of both programs for bat call identification remain unknown.
Comparisons of the effectiveness of automated bat call identification programs at identifying
bat calls are hampered by a lack of reporting on accuracy and detection rates for each program.
Mirzaei et al. (2011)conducted the only study to compare automated bat call identifications –
SonoBat and Song Scope– with four statistical techniques. That study reported that
identification rates of five species of bat in North America varied markedly between species and
identification method. Over all, Song Scope outperformed Sonobat for three of the five species
with accuracy rates ranging from 25 to 100% and an overall accuracy rate of ~65 and 75%,
respectively. In another study using 12 species, SonoBat was reported to have identification
rates of 47.1% to species and 52.9% to species complexes (Kennedy 2011). Identification and
misidentification rates of Song Scope are reported for birds and frogs (Brown et al. 2009; Hardin
Chapter 2: Bat call identification
39
Waddle et al. 2009), but there is no reported data available for bats. Currently SoundID is being
trialled on bats with no reported misclassification and identification rates available as yet
(Boucher 2012).
Irrespective of the approach used for bat call identification, the user is limited by the intra-
specific variability accounted for in the bat reference call library used. In this study, more bat
reference calls for those species that overlapped in bat call parameters, such as Vespadelus spp.
could possibly have decreased species misclassification rates and the ability to identify to
species level. Other detecting systems, such as full spectrum detectors, may also record greater
detail about calls enabling more accurate identification, but this has yet to be demonstrated for
the species in this study (Parsons & Szewczac 2009). This study included multiple known
sources of call variation in the reference call library, such as different body conditions, sexes,
social groups and environments (woodland vs temperate rain forest) (Jones & Siemers 2011),
which may have reduced classification rates when tested on known calls. It should have,
however, increased the applicability of classification rates for unknown calls recorded in a
variety of situations for which the key was developed (Britzke et al. 2011).
MANAGEMENT IMPLICATIONS
Bat call surveys are widely used and recognised as an invaluable technique for surveying bats
for wildlife management and conservation, despite their inherent limitations. This is particularly
so for those species not readily captured and for long-term studies and situations where
trapping is impractical. Using the approach described here, users of bat detectors can make an
informed decision on how to identify bat calls using empirical evidence of the accuracy rates of
three statistical techniques and automated bat call identification program Anascheme. The
future of bat call surveys as a technique for surveying echolocating bats lies in the continued
improvement in bat call recording technology and particularly bat call classification techniques,
targeting species that are currently considered to be problematic.

40
CHAPTER 3: WHITE-STRIPED FREETAIL BAT IN TASMANIA: RESIDENT, VAGRANT OR CLIMATE CHANGE MIGRANT?
A white-striped freetail bat (Austronomus australis) in Victoria, Australia.
Chapter 3: White-striped freetail bat in Tasmania
41
INTRODUCTION
Australia has a diverse range of bat species distributed from the tropics to temperate
regions. These bats belong to eight extant families, several of which occur in temperate
south-eastern Australia (Churchill 2009). Tasmania, Australia’s largest island, off the south-
east coast of the mainland, is home to only one of these families: the Vespertilionidae
(Driessen et al. 2011). Vespertilionidae, ‘the evening bats’ is the largest family of bats in
Australia, and one of the most widely dispersed groups of mammals in the world (Hall &
Woodside 1989). It is surprising, however, that no other bat families occur on the island.
Tasmania has a cool temperate climate and this may explain the absence of other bat
families. Resident Veserptilionids are known to use prolonged torpor bouts (hibernation) to
conserve energy in the colder months (Churchill 2009). Other bat families such as
Molossidae ‘ the freetail bats ‘, however, rarely use prolonged torpor bouts (Allison 1989;
Arlettaz et al. 2000; Cory Toussaint et al. 2010) which may be limiting their southern
distribution in Australia and explain their absence from Tasmania. A lack of systematic
surveys of the distribution of bats throughout Australia could mean that some bat species
and families may be more widespread than previously thought.
This paper describes the confirmed recording from bat call surveys of a ninth microbat
species in Tasmania, the white-striped freetail bat (Austronomus australis), from the
Molossidae. Bat call surveys have been used as an effective tool for expanding our
understanding of the distribution of many microbat species from around the world,
including Australia. I discuss three hypotheses: that it is (1) an undetected resident, (2) a
vagrant, or (3) a species expanding or shifting its range.
METHODS
Bat call surveys were carried out using Anabat bat detectors (Model: II, SD1 and 2, Titley,
Ballina, Australia) throughout Tasmania between December 2009 and January 2012 as part
of a concurrent study on Tasmanian bats (Cawthen et al. unpubl. data), community night-
Chapter 3: White-striped freetail bat in Tasmania
42
walks and mammal surveys in which I was involved. Sampling effort and methodology was
not consistent across surveys, as a combination of passive and active bat call survey
approaches were used depending on the objectives of the survey. Surveys varied in duration
from hours (i.e. community night walks) to weeks (i.e. concurrent study). Sampling was also
strongly biased to the south-eastern region of Tasmania in eucalypt forests and woodlands
in timber-production landscapes because this was where the concurrent study was being
undertaken.
The files recorded by the Anabats were identified as containing bat call sequences (a series
of calls produced by a bat contained within a 15 second Anabat file) that were then
identified to species and species complexes (i.e. Nyctophilus spp.) using the automated bat
call identification software AnaScheme(Adams et al. 2010). AnaScheme used a pre-defined
echolocation call key for Tasmanian bats developed by Cawthen and Law (in prep) that
included a sub-key for low frequency calls between 10 and 15 kHz in the known range of A.
australis (Churchill 2009). This subkey was included because of the possibility of A. australis
occurring in Tasmania based on previous unconfirmed reports in the 1980s (Martin Schulz,
pers. comm.). The following specifications were set in AnaScheme: identifications were
made only when a minimum of 50% of bat calls within a sequence were identified to the
same species or species complex and only sequences with a minimum of three calls were
identified to a species or species complex. If neither of these specifications were met, the
sequence was identified as an unknown.
RESULTS
In total, 386 476 files were analysed in AnaScheme. Of the files recorded, six were identified
as belonging to A. australis. I visually confirmed that these files contained calls of A. australis
by viewing files as sonograms (time frequency graphs) in AnaScheme. A. australis produces
a constant-frequency search-phase echolocation call that ranges from 11 to 13 kHz and is
much lower than any other bat call in Australia (Churchill 2009) (Figure 10&Table 7). To
confirm these identifications, three bat experts familiar with the calls of A. australis (Brad
Law, Michael Pennay and Greg Richards) were consulted and all confirmed that at least
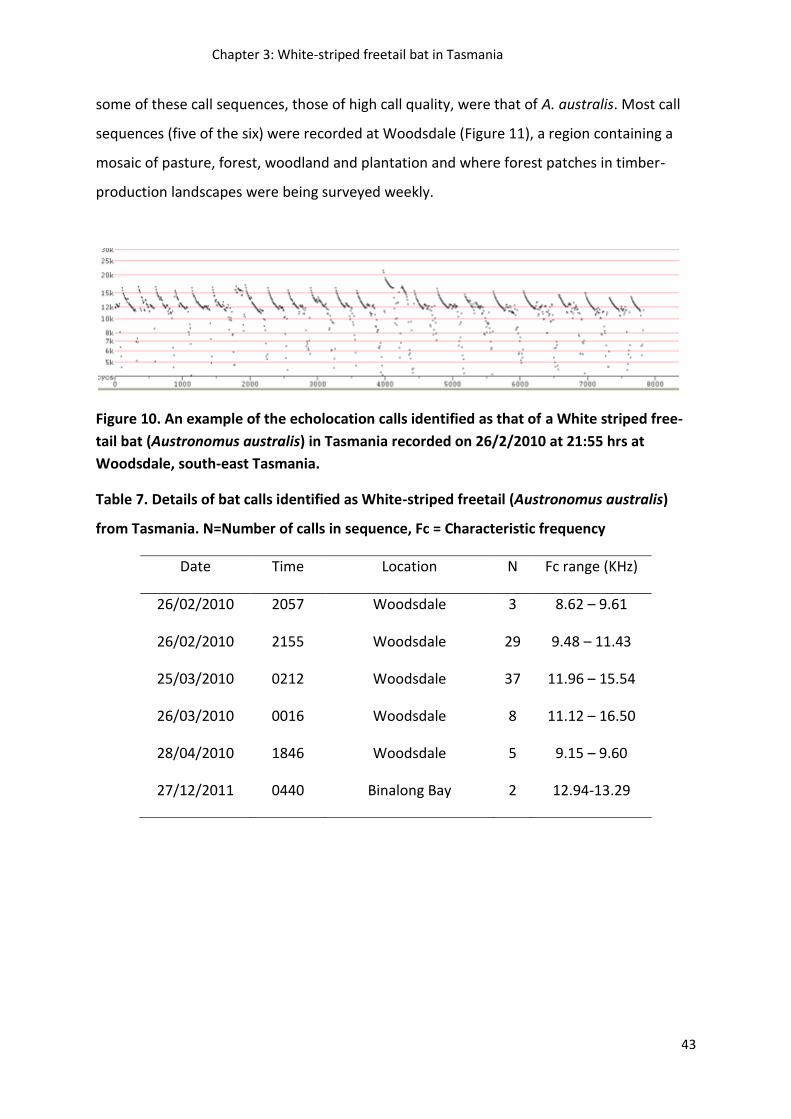
Chapter 3: White-striped freetail bat in Tasmania
43
some of these call sequences, those of high call quality, were that of A. australis. Most call
sequences (five of the six) were recorded at Woodsdale (Figure 11), a region containing a
mosaic of pasture, forest, woodland and plantation and where forest patches in timber-
production landscapes were being surveyed weekly.
Figure 10. An example of the echolocation calls identified as that of a White striped free-
tail bat (Austronomus australis) in Tasmania recorded on 26/2/2010 at 21:55 hrs at
Woodsdale, south-east Tasmania.
Table 7. Details of bat calls identified as White-striped freetail (Austronomus australis)
from Tasmania. N=Number of calls in sequence, Fc = Characteristic frequency
Date Time Location N Fc range (KHz)
26/02/2010 2057 Woodsdale 3 8.62 – 9.61
26/02/2010 2155 Woodsdale 29 9.48 – 11.43
25/03/2010 0212 Woodsdale 37 11.96 – 15.54
26/03/2010 0016 Woodsdale 8 11.12 – 16.50
28/04/2010 1846 Woodsdale 5 9.15 – 9.60
27/12/2011 0440 Binalong Bay 2 12.94-13.29
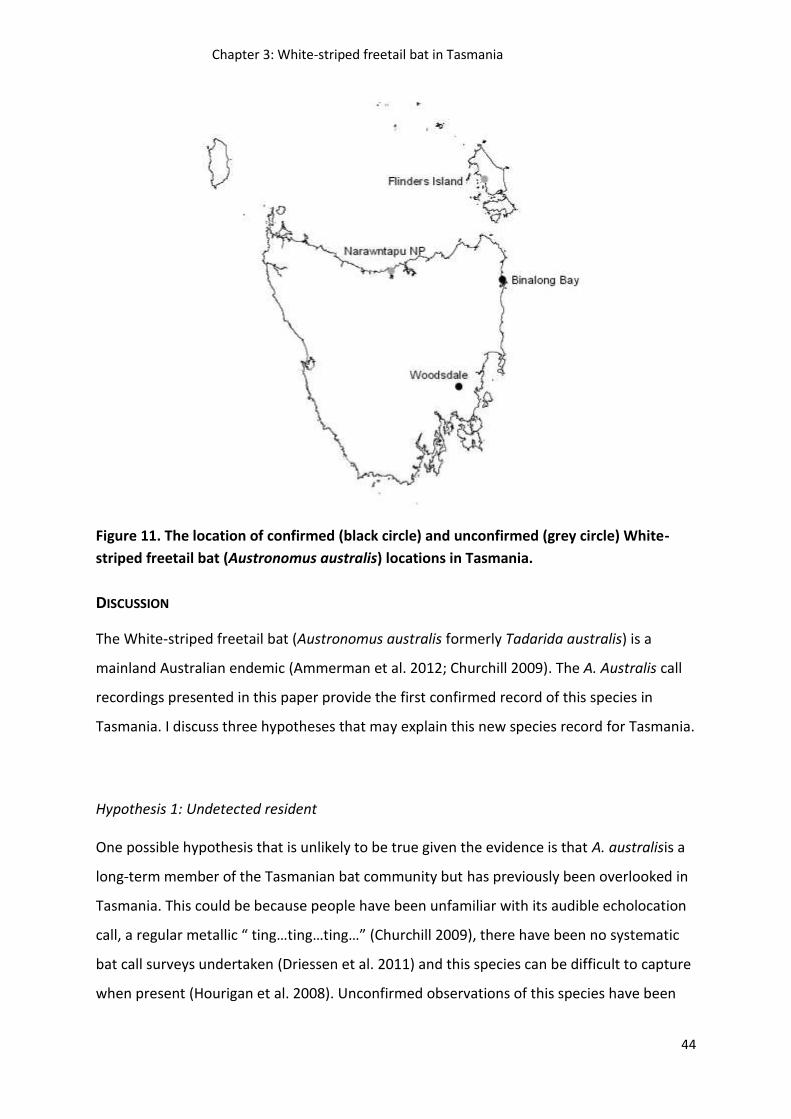
Chapter 3: White-striped freetail bat in Tasmania
44
Figure 11. The location of confirmed (black circle) and unconfirmed (grey circle) White-
striped freetail bat (Austronomus australis) locations in Tasmania.
DISCUSSION
The White-striped freetail bat (Austronomus australis formerly Tadarida australis) is a
mainland Australian endemic (Ammerman et al. 2012; Churchill 2009). The A. Australis call
recordings presented in this paper provide the first confirmed record of this species in
Tasmania. I discuss three hypotheses that may explain this new species record for Tasmania.
Hypothesis 1: Undetected resident
One possible hypothesis that is unlikely to be true given the evidence is that A. australisis a
long-term member of the Tasmanian bat community but has previously been overlooked in
Tasmania. This could be because people have been unfamiliar with its audible echolocation
call, a regular metallic “ ting…ting…ting…” (Churchill 2009), there have been no systematic
bat call surveys undertaken (Driessen et al. 2011) and this species can be difficult to capture
when present (Hourigan et al. 2008). Unconfirmed observations of this species have been
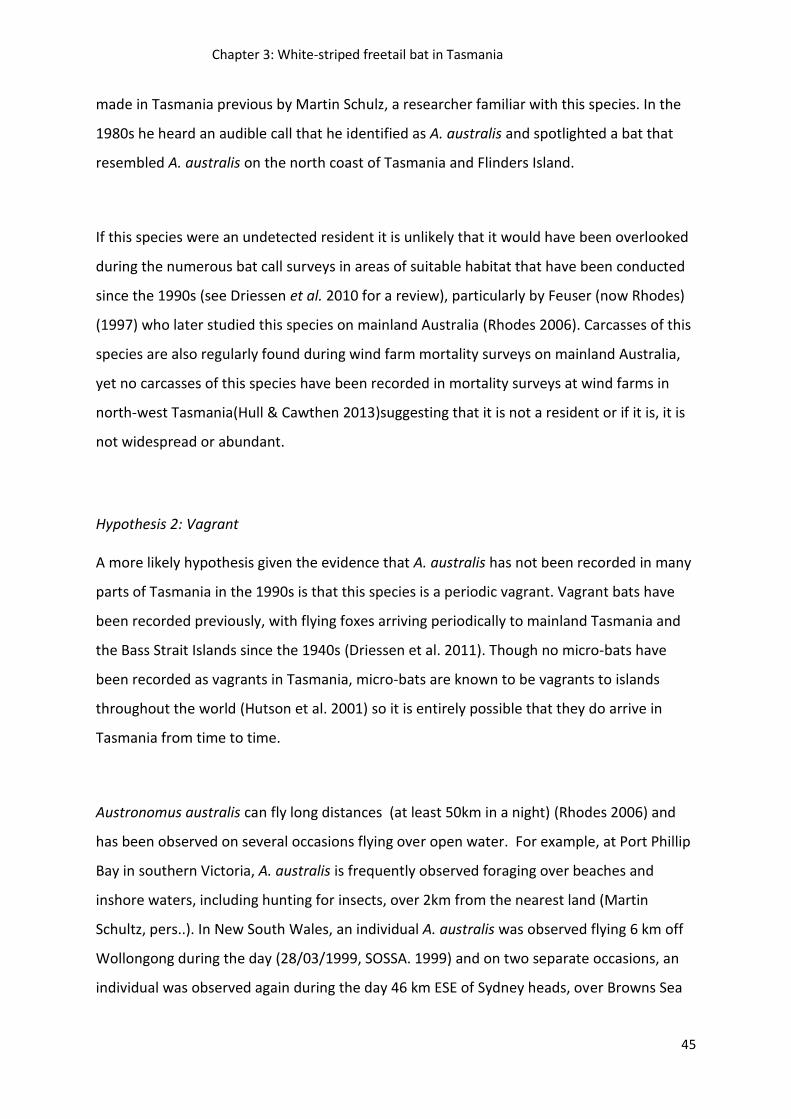
Chapter 3: White-striped freetail bat in Tasmania
45
made in Tasmania previous by Martin Schulz, a researcher familiar with this species. In the
1980s he heard an audible call that he identified as A. australis and spotlighted a bat that
resembled A. australis on the north coast of Tasmania and Flinders Island.
If this species were an undetected resident it is unlikely that it would have been overlooked
during the numerous bat call surveys in areas of suitable habitat that have been conducted
since the 1990s (see Driessen et al. 2010 for a review), particularly by Feuser (now Rhodes)
(1997) who later studied this species on mainland Australia (Rhodes 2006). Carcasses of this
species are also regularly found during wind farm mortality surveys on mainland Australia,
yet no carcasses of this species have been recorded in mortality surveys at wind farms in
north-west Tasmania(Hull & Cawthen 2013)suggesting that it is not a resident or if it is, it is
not widespread or abundant.
Hypothesis 2: Vagrant
A more likely hypothesis given the evidence that A. australis has not been recorded in many
parts of Tasmania in the 1990s is that this species is a periodic vagrant. Vagrant bats have
been recorded previously, with flying foxes arriving periodically to mainland Tasmania and
the Bass Strait Islands since the 1940s (Driessen et al. 2011). Though no micro-bats have
been recorded as vagrants in Tasmania, micro-bats are known to be vagrants to islands
throughout the world (Hutson et al. 2001) so it is entirely possible that they do arrive in
Tasmania from time to time.
Austronomus australis can fly long distances (at least 50km in a night) (Rhodes 2006) and
has been observed on several occasions flying over open water. For example, at Port Phillip
Bay in southern Victoria, A. australis is frequently observed foraging over beaches and
inshore waters, including hunting for insects, over 2km from the nearest land (Martin
Schultz, pers..). In New South Wales, an individual A. australis was observed flying 6 km off
Wollongong during the day (28/03/1999, SOSSA. 1999) and on two separate occasions, an
individual was observed again during the day 46 km ESE of Sydney heads, over Browns Sea
Chapter 3: White-striped freetail bat in Tasmania
46
Mount (26/10/11 & 14/10/12, Dave James, pers. comm.). Austronomus australis has also
been observed flying off the coast of Western Australia, 150 km south of Esperance, where
a group of 14 individuals were observed to land at 2am on the radar mast of a shark fishing
boat (Terry Reardon, unpublished data). Given these observations, this species is capable of
flying between mainland Australia and mainland Tasmania, especially via the Bass Strait
Islands.
During the same period that A. australis was recorded in Tasmania, flying foxes were also
reported on mainland Tasmania and the Bass Strait Islands. These reports resulted in four
specimens being collected, two of which were identified as the Grey-headed flying fox
(Pteropus poliocephalus) (Driessen 2010). At the same time Grey-headed flying foxes also
arrived in South Australia outside their normal range (Churchill 2009; Cox 2010). It is unlikely
that these events are unrelated. There are several possible explanations to the arrival of
these bats in Tasmania including strong wind fronts blowing bats southward, individuals
becoming lost during migrations, or accidently being introduced by humans in freight
(O'Donnel 2009). Severe storms in 2010 that caused flooding, strong winds and extreme
daily temperatures on mainland Australia may have caused both A. australis and P.
poliocephalus to go outside of their normal range in search of suitable habitat, take
advantage of favourable conditions outside of their range, become disorientated and or
arrive assisted by strong northerly winds. The accidental introduction of these species to
Tasmania in freight also cannot be ruled out but is unlikely given the number of flying foxes
recorded.
Hypothesis 3: Range extension / shift
A hypothesis that cannot be overlooked is that A. australis is undergoing a range extension
or shift into Tasmania. A range expansion of A. australis into Tasmania could occur in one of
two ways: vagrant bats find suitable habitat in Tasmania and persist, or an overall
movement of the population southward occurs increasing the probability of vagrants
reaching Tasmania and establishing a breeding or seasonal population.
Chapter 3: White-striped freetail bat in Tasmania
47
The historic absence of A. australis from Tasmania may be because this species cannot
physiologically withstand Tasmania’s cool temperate climate or because climatic conditions
make habitat (i.e. maternity roosts) unsuitable. If this were true and temperatures in
Tasmania increase this species may be able to expand its southern distribution into
Tasmania and to persist using a combination of short torpor bouts, seasonal migration or
reduced activity during the cooler months to survive. This could be beneficial for the species
if temperatures do not rise in its northern distribution. Temperature increases in its
northern distribution could result in a range shift of this species because it is highly sensitive
to high temperatures as a result of its inability to dissipate physiological heat during high-
speed flight (Bullen & McKenzie 2005).
Increasing temperatures as a result of climate change has been implicated as a main driver
of changes to the known ranges of many bat species around the world (Hughes et al. 2012;
Humphries et al. 2002; Lundy et al. 2010; Richards et al. 2012). In Australia, several
researchers have attributed range extensions of mega and micro-bats to climate change.
Between 2005 and 2012, Bullen and Ford (2012) observed southwards range extensions of
two micro-bat species – the Finlayson’s Cave Bat (Vespadelus finlaysoni) and Hill’s Sheath-
tailed bat (Taphozous hilli). They suggested that this southwards range expansion was
evidence of the effect of climate change making conditions more favourable for these
species at the southern edge of their range (Bullen & Ford 2012). Similarly, Richards et al.
(2012) suggest that the Grey-headed and Black Flying foxes and Little bent-wing bat have
shifted their range southwards in response to climate change. However, as Roberts et al.
(2011) point out, without quantitative analysis, climate change cannot be inferred as the
primary driver of species range shifts.
CONCLUSION
Without previous systematic surveys of Tasmanian bats and their distribution it will remain
unknown whether A. australis is a resident, a vagrant, or is expanding/shifting its range into
Tasmania. The evidence suggests that it is unlikely that this species is a long-term resident
and is highly likely that it is a vagrant that periodically arrives in Tasmania. Large-scale bat

Chapter 3: White-striped freetail bat in Tasmania
48
monitoring programs such as Climate Watch’s Tadarida australis monitoring program
(ClimateWatch 2012) could provide evidence to support or refute whether this species is
expanding or shifting its range into Tasmania and whether climate change is driving this.
Voucher specimens, video and photographs are also required to further verify this species in
Tasmania. Understanding whether bat communities are changing is critical given the range
of threats that species are under and the important functional role bats play in the
environment.
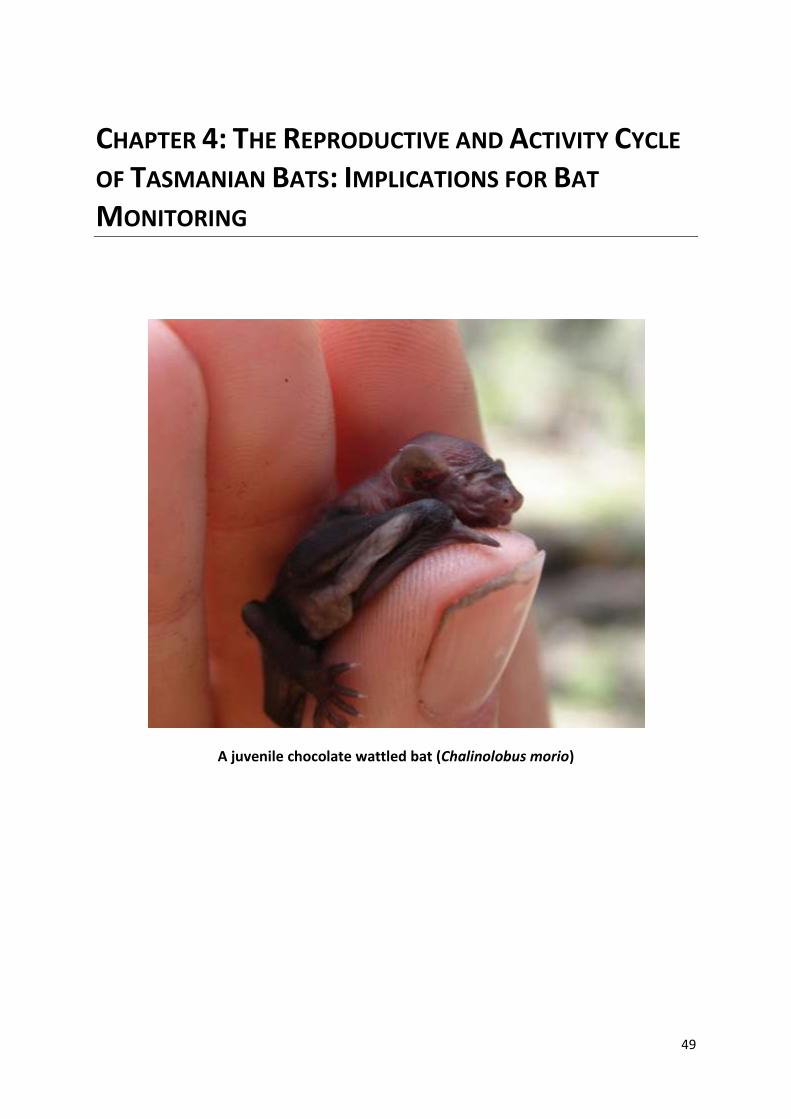
49
CHAPTER 4: THE REPRODUCTIVE AND ACTIVITY CYCLE
OF TASMANIAN BATS: IMPLICATIONS FOR BAT
MONITORING
A juvenile chocolate wattled bat (Chalinolobus morio)
Chapter 4: The reproductive and activity cycle of Tasmanian bats
50
INTRODUCTION
Understanding the reproductive patterns of bats is essential to their conservation and
management (Cryan et al. 2012), yet relatively little is known about the timing and patterns
of reproduction of many bat species. This is despite bats being one of the most widespread,
diverse and abundant vertebrate groups on the planet (Hutson et al. 2001; Mickleburgh et
al. 2002). Such information is crucial when undertaking bat monitoring, as the timing and
patterns of reproduction are associated with changes in bat activity (Daniel et al. 2010;
Mackie & Racey 2007; Russ et al. 2003; Rydell 1993), social behaviour (Behr & Von
Helversen 2004) and roost site selection (Lumsden et al. 2002b; Patriquin et al. 2010).
When life history information is lacking from a given region, many researchers use
information on the reproductive and activity cycles of conspecifics in other regions or
closely related species (Churchill 2009). However information on the reproduction of bats is
not readily transferable from one region to another because of latitudinal variation in the
timing and patterns of reproduction.
Throughout the world insectivorous bats exhibit a diverse range of reproductive patterns
(Racey & Entwistle 2000). Variation in the timing of reproductive patterns amongst bats are
linked to environmental factors and the influence these have on resource availability,
particularly food supplies (Greiner et al. 2011a). Bats are believed to time their reproductive
cycle so that the most energetically demanding reproductive stages, such as lactation and
weaning of young, coincide with optimal resource availability (Heideman 2000).
Environmental factors such as photoperiod, temperature and rainfall have all been directly
or indirectly associated with variation in the timing and patterns of reproductive stages in
bats (Greiner et al. 2011a; Greiner et al. 2011b).
For wide-ranging bat species, the timing and patterns of reproductive stages are known to
vary throughout their range as environmental factors vary with latitude (Racey & Entwistle
2000). In temperate regions, environmental factors vary markedly between winter and
summer, affecting the availability of food resources (Racey & Entwistle 2000). As a
Chapter 4: The reproductive and activity cycle of Tasmanian bats
51
consequence, temperate insectivorous bats exhibit a seasonal monoestrous breeding
pattern because of the necessity for most species to hibernate during periods of low food
availability and high energetic costs, such as winter (Bernard & Tsita 1995; Turbill & Geiser
2008). In tropical and sub-tropical regions, less pronounced seasonality in environmental
conditions enables bats to remain active year round (Milne et al. 2005) resulting in a range
of breeding patterns ranging from seasonal monoestry and polyoestry through to
multimodal polyoestry (Happold & Happold 1990). Many Australian insectivorous bat
species range from the tropics to temperate regions (Churchill 2009), but there are no
published studies on how the timing and patterns of reproduction and activity vary across
their range.
Tasmania represents the highest latitude bat population in Australia (located at 43⁰ South).
Like bat species around the world, Tasmania’s bats are faced with impacts from human
activities such as habitat loss and mortality from wind farms (Hull & Cawthen 2013; Taylor &
Savva 1988), yet little is understood about the reproductive and activity patterns of
Tasmanian bats to inform conservation and management. Two of Tasmania’s eight bat
species: the Gould’s wattled bat (Chalinolobus gouldii) and the lesser long-eared bat
(Nyctophilus geoffroyi) are widespread throughout Australia, ranging from southern
Tasmania to the northern tropics of Australia. For these species, the timing of reproductive
stages, such as lactation has been reported to be later with increasing latitude (Churchill
2009). Of the chocolate wattled bat (Chalinolobus morio), eastern falsistrelle (Falsistrellus
tasmaniensis), little forest bat (Vespadelus vulturnus), southern forest bat (Vespadelus
regulus) and large forest bat (Vespadelus darlingtoni) species, little is known of the variation
in their reproductive patterns throughout their range. There is no information on the timing
and patterns of reproduction in Tasmania’s endemic long-eared bat (Nyctophilus sherrini)
which could be crucial for the conservation of this species.
It is expected, given Tasmania’s island maritime climate and high latitude, that Tasmanian
bats would alter the timing of reproductive stages from their mainland conspecifics because
of environmental differences between populations. Based on limited data, several studies
have documented variations in Tasmanian bat reproduction and physiology compared to
Chapter 4: The reproductive and activity cycle of Tasmanian bats
52
mainland conspecifics. Taylor et al. (1987) reported that Tasmanian bats tend to be larger
than their mainland conspecifics which may in part mitigate against the effects of
environmental extremes in temperature (Racey & Entwistle 2000). Kincade et al. (1999;
2000) reported that some Tasmanian bats exhibited a shift in the timing of reproductive
stages compared to their mainland conspecifics, and that duration of lactation was shorter
in Tasmanian bats. Expanding on the work of Kincade et al. (1999; 2000), Dixon and Rose
(2003) reported that Nyctophilus geoffroyi exhibited physiological differences between
Tasmania and mainland Australia, such as lower basal metabolic rates and a 10⁰C
downward shift in the ambient temperature at which torpor is utilised. Dixon (2000) also
reported that Tasmanian Nyctophilus geoffroyi produce fewer offspring than their mainland
conspecifics as a potential adaptation to relatively low resource availability compared to
mainland populations.
The overall aim of this study was to provide the basic reproductive and activity data on
Tasmanian bat species necessary for the undertaking of bat monitoring programs for
management and conservation. The specific aims of this study were to describe the
reproductive cycle of Tasmanian bat species including the timing and patterns of
reproductive stages, to examine whether Australian bat species exhibit latitudinal variation
in their reproductive patterns, and to determine the relationship between the reproductive
and activity cycle of bats and discuss the implications for bat monitoring.
METHODS
The timing and patterns of reproductive stages in Tasmanian bats was investigated by using
data collected from the external physical examination of bats and hormone profiles. Both
physical examination and hormone profiles have been used successfully to determine the
reproductive stages of bats in previous studies of Australian insectivorous bats (Hosken
1997; Lloyd et al. 2001; Phillips & Inwards 1985).
Chapter 4: The reproductive and activity cycle of Tasmanian bats
53
External physical examination of bats
Data collected in the field were supplemented with data collected from museum specimens
(in particular collection notes of the physical examination of specimens stored in ethanol at
time of collection - (Tasmanian Museum and Art Gallery, Queen Victoria Museum and Art
Gallery), published research (Green 1965, 1966; Green 1988; Green & Rainbird 1984; Tyson
1981) and unpublished theses (Dixon 2000; O'Neill 1984). Data were collected from bats
throughout mainland Tasmania.
The majority of field data were collected over two periods: October 1998 to April 1999 and
October 2009 to December 2011 during two separate studies (1998 – 1999 Kincade; 2009-
2011 Cawthen). Both studies captured bats in the field using standard two banded harp
traps (Faunatech, Australia). The later study (2009-2011 Cawthen) also used four shelve
nylon and monofilament mist nets (Mesh – 20x20mm, Ecotone, Poland) set in open spaces
in the forest and outside known roosts. Upon capture all bats were identified to species
using a combination of field guides (Churchill 2009; Parnaby 1999; Taylor et al. 1987).
Forearm length, weight and descriptions of the sex, reproductive stage and relative age of
each animal (adult, sub-adult, juvenile) were also recorded.
For females, there are four stages of reproduction that can be assessed by external physical
examination: non-reproductive (nipples regressed or absent); pregnant (palpable foetus in
abdomen); lactating (nipple enlarged, area surrounding the nipple hairless with milk
production evident); and post-lactating (nipples prominent but fur regrowing and no milk
production evident). For males, six stages of reproduction were assessed by external
physical examination and categorised as: 0 (testis not enlarged: non-reproductive); 1 to 3
(testis enlarged, testis increasing in size from 1 to 4mm: sperm production); 4 (peak
testicular development, testis increasing in size from 4 to 7mm, epididymis distended:
sperm production and storage); and 5 (testis regressed with distended epididymis: sperm
storage). These reproductive classifications were adapted from Phillips and Inwards (1985)
and Churchill (2009).
Chapter 4: The reproductive and activity cycle of Tasmanian bats
54
Hormone profiles
Concentrations of reproductive hormones (progesterone and testosterone) were measured
in blood samples taken from live bats in the field between 1998 and 1999 by Kincade (2000).
Blood samples were taken from the brachial vein of the wing and through piercing small
peripheral veins running through the propagial (elbow joint) and uropatatigal (tail)
membranes. To enable blood sampling of live bats, bats were held in a restraining device
(Kabat & Kincade 2000). The blood sampling location on each bat was swabbed using 70%
ethanol to disinfect and to increase blood vessel dilation. Heat from a lamp was also used to
increase blood flow. The vein was punctured using a 25 gauge needle and blood collected
into a heparinised capillary tube (sample size: 10 to 100µl). In the lab, plasma was separated
by centrifugation and stored at -20 ⁰C.
Plasma progesterone and testosterone concentrations were determined using standard
radioimmunoassay techniques after extraction via column chromatography as described by
Jones and Rose (1992). These were conducted by Kincade (2000). Due to very low volumes
of plasma from the bats, the assays could not be validated specifically for bat plasma.
However, the hormone assays have been validated for both reptilian and mammalian
species, and there was no reason to believe that the validations would not hold for bat
plasma. Where possible, 50µl samples of plasma were assayed to optimise assay precision.
However, in the majority of cases, this was not possible and so the assay results were
adjusted accordingly. When plasma samples were less than 20 µl, samples from two to
three animals of the same species, judged to be of similar reproductive condition and
collected within the same two week period were pooled.
Bat activity
Bat call surveys were conducted throughout south-eastern and northern Tasmania as part
of a concurrent study (chapter 6). Bat activity, the total number of bat call sequences
recorded per night comprised a range of bat calls indicating searching, feeding, commuting
and socialising activities.
Chapter 4: The reproductive and activity cycle of Tasmanian bats
55
Bat call surveys were undertaken during four sampling periods between December 2009
and 2010 using Anabat detectors (models SD1 and SD 11, Titley Electronics, Ballina,
Australia). Each sampling period coincided with assumed periods in the annual cycle of bats:
the maternity season (Summer: December – February); mating/post lactation season
(Autumn: March – May); non-reproductive/overwintering season (Winter: June – August);
and pregnancy/post hibernation (Spring: Sep – Nov).
At each site, Anabat detectors were set in waterproof PVC boxes. A microphone extension
cable ran from the PVC box up a 1.5 metre stake to the microphone attachment. The
microphone attachment was angled up at 45⁰ pointed into vegetation gaps of the habitat
element being surveyed and enclosed in a PVC elbow for weatherproofing. Detectors were
calibrated against each other using a bat chirp board (Nevada Bat Technology, Las Vegas,
USA) to ensure microphone sensitivity was equal across detectors. Most studies record only
for the night (Hanspach et al. 2012) but bats can be observed flying during the day when
disturbed from roosts (Webala et al. 2010) so bat call surveys were conducted over a 24-
hour period.
Once files containing bat call sequences were downloaded, calls recorded on days where
detectors failed (drained batteries) were excluded. Although it is common to also exclude or
avoid sampling on nights based on poor weather conditions (Hanspach et al. 2012; Threlfall
et al. 2011) because of the correlation between bat activity and temperature (De Oliveira et
al. 1999), this was not done in this study. Instead, environmental variables of daily rainfall
and minimum and maximum temperature from nearby weather stations were incorporated
into the analysis.
The number of bat call sequences recorded per night was averaged across all sites as a
measure of mean monthly bat activity. A detailed analysis of variation in bat activity
between sites is available in Chapter 6. Bat call sequences were recorded onto a compact
Chapter 4: The reproductive and activity cycle of Tasmanian bats
56
flash memory card as individual files for analysis in the bat call identification program
AnaScheme (Adams et al. 2010) following the methods outlined in Chapter 1.
Environmental data
Two environmental factors were examined: mean monthly minimum temperature and day
length. Both temperature and day length have previously been associated with variations in
the reproductive patterns of bats (Racey & Entwistle 2000). Data were extracted from the
Bureau of Meteorology from the Australian Reference Climate Station (Levendale weather
station – within a range of 8 - 20km of each site). Day length was calculated as the time
between sunrise and sunset.
Statistical analysis
One-way analysis of variance (ANOVA) was used to test for significant variations in plasma
reproductive hormone concentrations between reproductive stages within species. Fishers
LSD post hoc tests were used to identify significant groups within treatments. For combined
data (not normally distributed), a Kruskal-Wallis one way analysis of variance on ranks with
Dunn’s pairwise multiple comparison was used to examine significant difference in plasma
hormone concentrations between reproductive stages and months. All data analysis was
undertaken in the statistical program R (R Development Core Team 2011).
RESULTS
Timing and patterns of reproductive stages
In total, 823 records were obtained from field and historical data collected between 1938
and 2011 (female = 383, male =411, unsexed juveniles = 29). Of these, 657 were collected
from field data between: 1998-1999 (n=246) and 2009 to 2011 (n=443), all other data were
collected from museum specimens (n=91) and previous studies (n=50). By species, 201
records were from V. regulus, 159 from V. vulturnus, 200 from V. darlingtoni, 99 from C.
Chapter 4: The reproductive and activity cycle of Tasmanian bats
57
morio, 13 from C. gouldii, 16 from F. tasmaniensis, 116 from N. geoffroyi and 19 from N.
sherrini. The uneven sample sizes reflect relative capture rates of bats in the field.
An overview of the timing over which different reproductive stages occur for all bat species
in Tasmania is provided in Figure 12. The earliest pregnancies were recorded in October
(n=4), with 95% of pregnancies detected between November and January (n=77). Lactating
females were recorded between late October and February, but as late as March (n=2), with
94% of lactating females recorded between December and February (n=115). Non-volant
and volant juveniles were recorded between November and April (n=50). Testicular growth
began in December (n=16) and peaked between January and March (n=28). Testicular
regression and enlargement of the epididymis was recorded between January and May
(n=14). During March, 68% of all males showed testicular regression and enlargement of the
epididymis. Non-reproductive males and females were recorded throughout the year.
Bat activity
In total, 33,722 bat call sequences (passes) were recorded during 1,388 nights of bat call
surveys between December 2009 and 2010. Three types of bat calls were distinguished:
search phase, foraging and social calls (as described in chapter 2). Search phase and foraging
calls were recorded throughout the year but social calls only occurred during autumn and
early spring.
Overall, mean monthly bat activity was lowest and least variable between May and
September during periods of low mean minimum temperature and short day length. Bat
activity steadily increased from October onwards, peaking in January, when mean minimum
temperatures were highest (Figure 12).
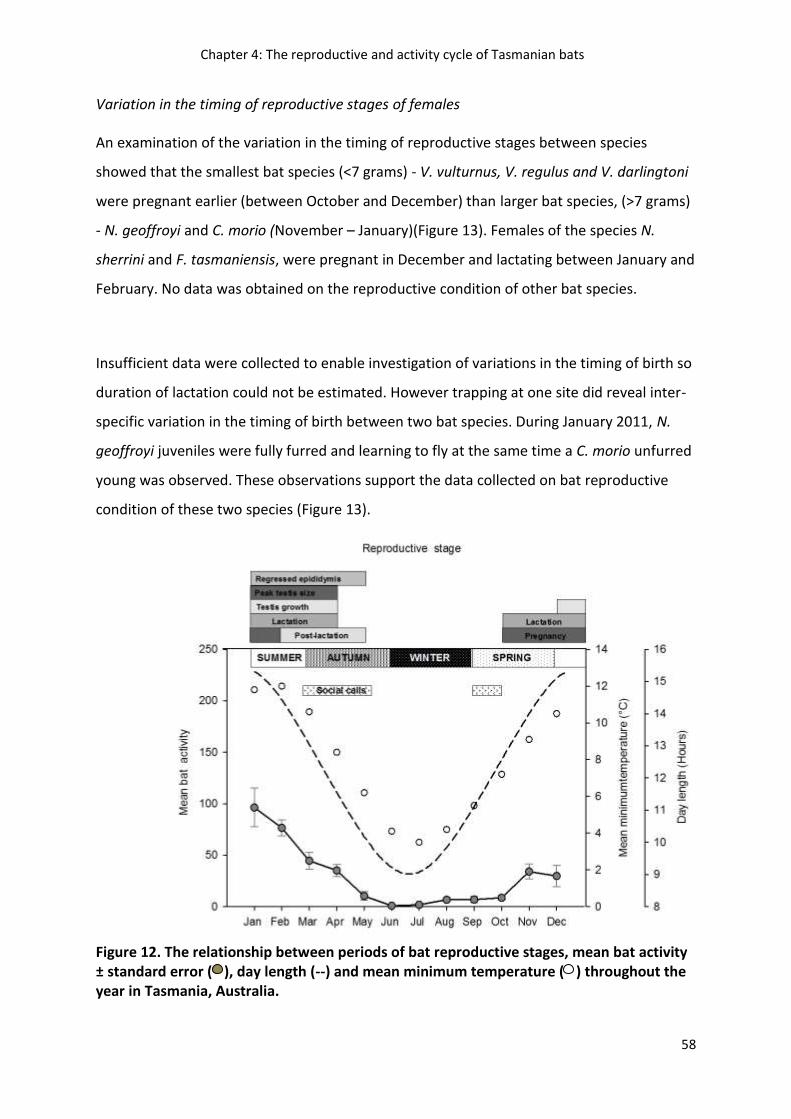
Chapter 4: The reproductive and activity cycle of Tasmanian bats
58
Variation in the timing of reproductive stages of females
An examination of the variation in the timing of reproductive stages between species
showed that the smallest bat species (<7 grams) - V. vulturnus, V. regulus and V. darlingtoni
were pregnant earlier (between October and December) than larger bat species, (>7 grams)
- N. geoffroyi and C. morio (November – January)(Figure 13). Females of the species N.
sherrini and F. tasmaniensis, were pregnant in December and lactating between January and
February. No data was obtained on the reproductive condition of other bat species.
Insufficient data were collected to enable investigation of variations in the timing of birth so
duration of lactation could not be estimated. However trapping at one site did reveal inter-
specific variation in the timing of birth between two bat species. During January 2011, N.
geoffroyi juveniles were fully furred and learning to fly at the same time a C. morio unfurred
young was observed. These observations support the data collected on bat reproductive
condition of these two species (Figure 13).
Figure 12. The relationship between periods of bat reproductive stages, mean bat activity ± standard error ( ), day length (--) and mean minimum temperature ( ) throughout the year in Tasmania, Australia.
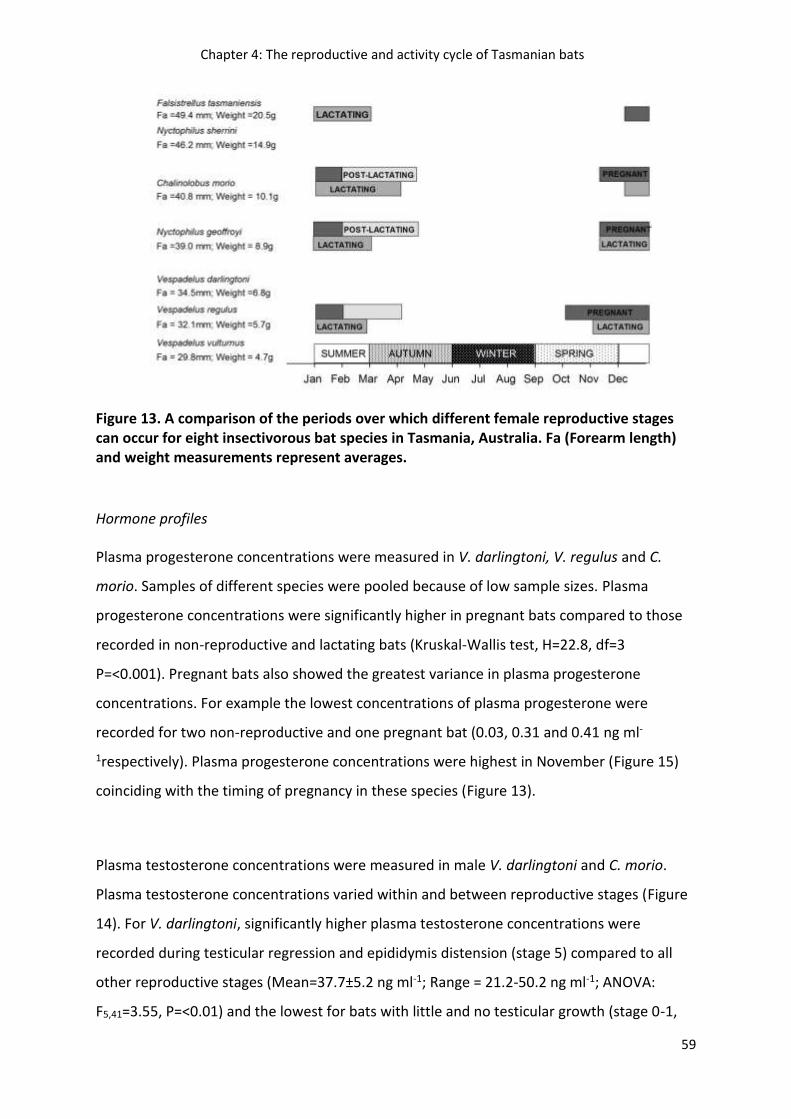
Chapter 4: The reproductive and activity cycle of Tasmanian bats
59
Figure 13. A comparison of the periods over which different female reproductive stages can occur for eight insectivorous bat species in Tasmania, Australia. Fa (Forearm length) and weight measurements represent averages.
Hormone profiles
Plasma progesterone concentrations were measured in V. darlingtoni, V. regulus and C.
morio. Samples of different species were pooled because of low sample sizes. Plasma
progesterone concentrations were significantly higher in pregnant bats compared to those
recorded in non-reproductive and lactating bats (Kruskal-Wallis test, H=22.8, df=3
P=<0.001). Pregnant bats also showed the greatest variance in plasma progesterone
concentrations. For example the lowest concentrations of plasma progesterone were
recorded for two non-reproductive and one pregnant bat (0.03, 0.31 and 0.41 ng ml-
1respectively). Plasma progesterone concentrations were highest in November (Figure 15)
coinciding with the timing of pregnancy in these species (Figure 13).
Plasma testosterone concentrations were measured in male V. darlingtoni and C. morio.
Plasma testosterone concentrations varied within and between reproductive stages (Figure
14). For V. darlingtoni, significantly higher plasma testosterone concentrations were
recorded during testicular regression and epididymis distension (stage 5) compared to all
other reproductive stages (Mean=37.7±5.2 ng ml-1; Range = 21.2-50.2 ng ml-1; ANOVA:
F5,41=3.55, P=<0.01) and the lowest for bats with little and no testicular growth (stage 0-1,
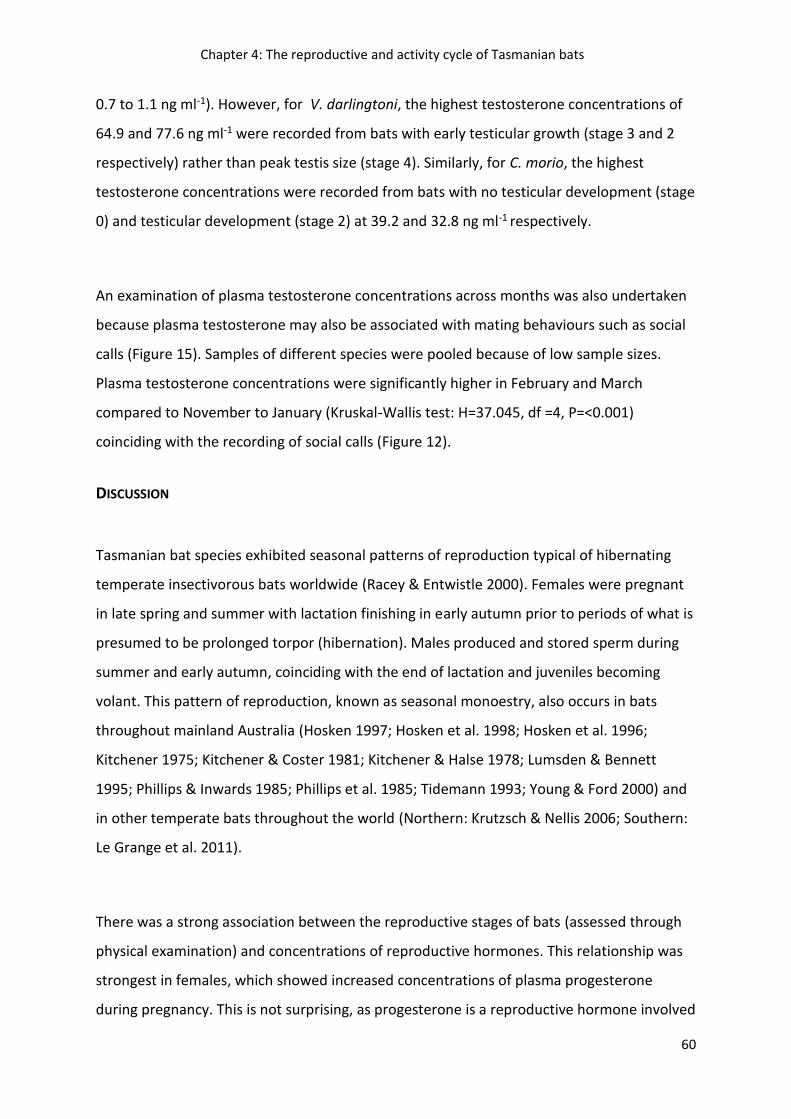
Chapter 4: The reproductive and activity cycle of Tasmanian bats
60
0.7 to 1.1 ng ml-1). However, for V. darlingtoni, the highest testosterone concentrations of
64.9 and 77.6 ng ml-1 were recorded from bats with early testicular growth (stage 3 and 2
respectively) rather than peak testis size (stage 4). Similarly, for C. morio, the highest
testosterone concentrations were recorded from bats with no testicular development (stage
0) and testicular development (stage 2) at 39.2 and 32.8 ng ml-1 respectively.
An examination of plasma testosterone concentrations across months was also undertaken
because plasma testosterone may also be associated with mating behaviours such as social
calls (Figure 15). Samples of different species were pooled because of low sample sizes.
Plasma testosterone concentrations were significantly higher in February and March
compared to November to January (Kruskal-Wallis test: H=37.045, df =4, P=<0.001)
coinciding with the recording of social calls (Figure 12).
DISCUSSION
Tasmanian bat species exhibited seasonal patterns of reproduction typical of hibernating
temperate insectivorous bats worldwide (Racey & Entwistle 2000). Females were pregnant
in late spring and summer with lactation finishing in early autumn prior to periods of what is
presumed to be prolonged torpor (hibernation). Males produced and stored sperm during
summer and early autumn, coinciding with the end of lactation and juveniles becoming
volant. This pattern of reproduction, known as seasonal monoestry, also occurs in bats
throughout mainland Australia (Hosken 1997; Hosken et al. 1998; Hosken et al. 1996;
Kitchener 1975; Kitchener & Coster 1981; Kitchener & Halse 1978; Lumsden & Bennett
1995; Phillips & Inwards 1985; Phillips et al. 1985; Tidemann 1993; Young & Ford 2000) and
in other temperate bats throughout the world (Northern: Krutzsch & Nellis 2006; Southern:
Le Grange et al. 2011).
There was a strong association between the reproductive stages of bats (assessed through
physical examination) and concentrations of reproductive hormones. This relationship was
strongest in females, which showed increased concentrations of plasma progesterone
during pregnancy. This is not surprising, as progesterone is a reproductive hormone involved
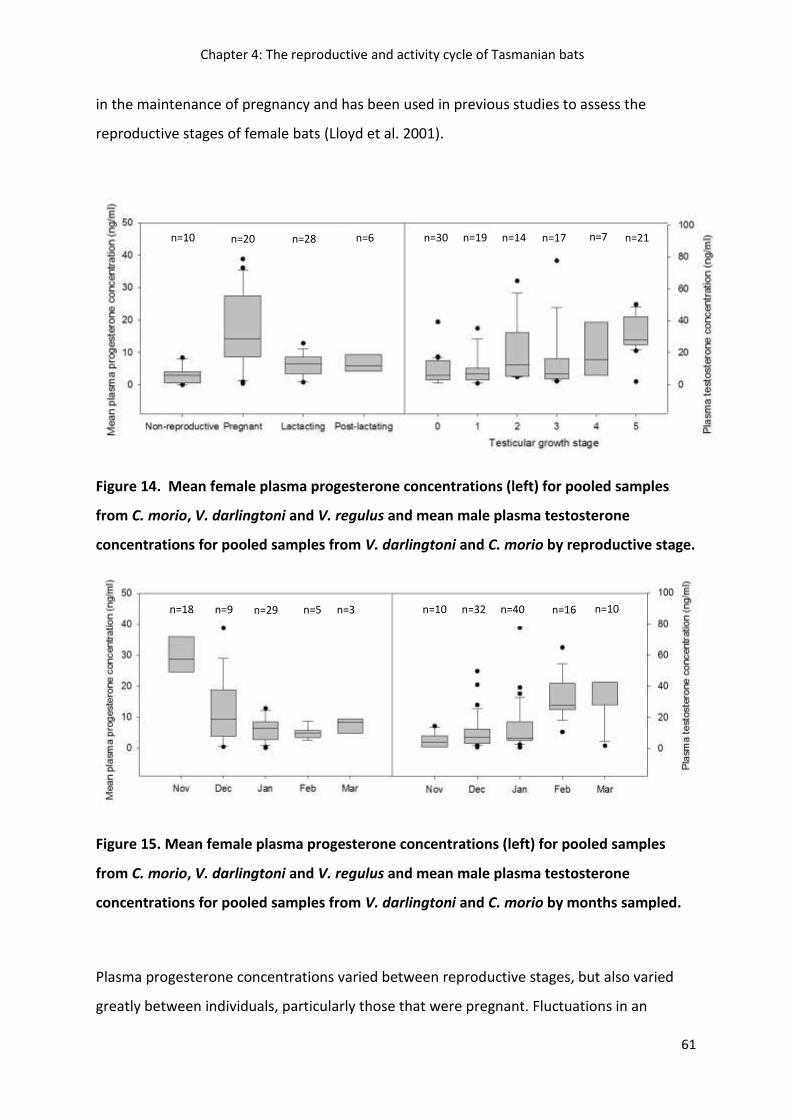
Chapter 4: The reproductive and activity cycle of Tasmanian bats
61
in the maintenance of pregnancy and has been used in previous studies to assess the
reproductive stages of female bats (Lloyd et al. 2001).
Figure 14. Mean female plasma progesterone concentrations (left) for pooled samples
from C. morio, V. darlingtoni and V. regulus and mean male plasma testosterone
concentrations for pooled samples from V. darlingtoni and C. morio by reproductive stage.
Figure 15. Mean female plasma progesterone concentrations (left) for pooled samples
from C. morio, V. darlingtoni and V. regulus and mean male plasma testosterone
concentrations for pooled samples from V. darlingtoni and C. morio by months sampled.
Plasma progesterone concentrations varied between reproductive stages, but also varied
greatly between individuals, particularly those that were pregnant. Fluctuations in an
n=10 n=20 n=28 n=6 n=30 n=19 n=14 n=17 n=7 n=21
n=18 n=9 n=29 n=5 n=10 n=32 n=40 n=16 n=10 n=3
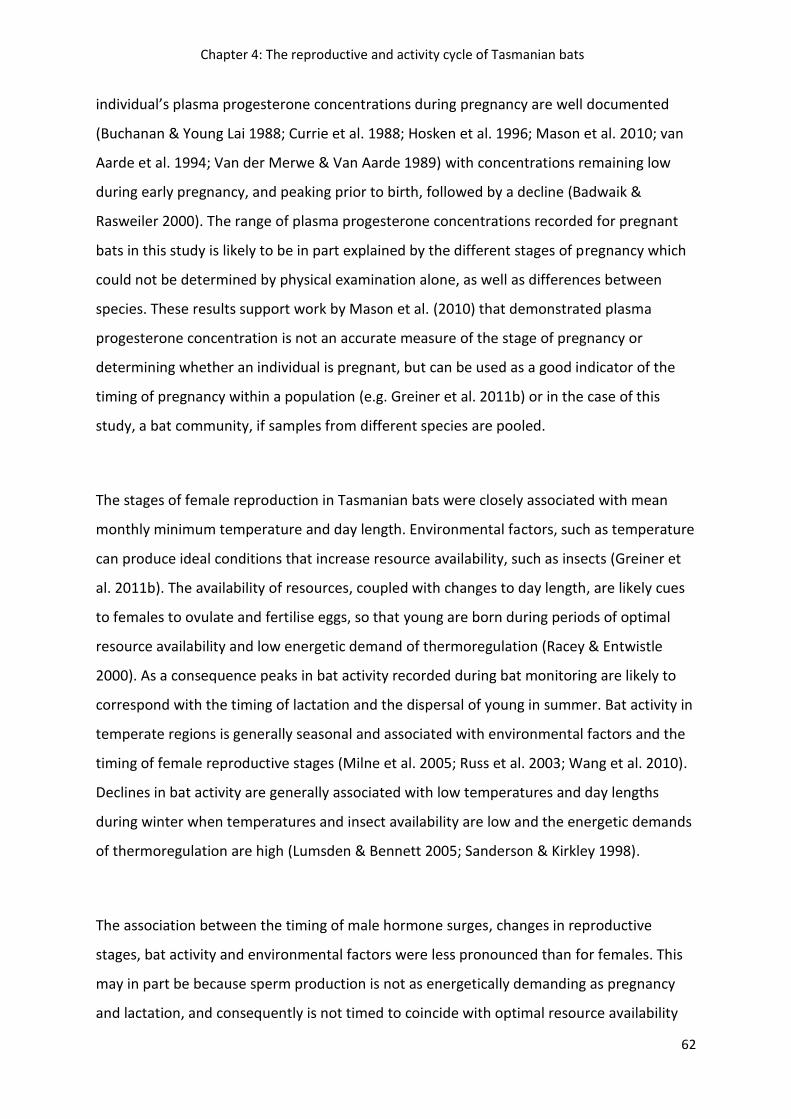
Chapter 4: The reproductive and activity cycle of Tasmanian bats
62
individual’s plasma progesterone concentrations during pregnancy are well documented
(Buchanan & Young Lai 1988; Currie et al. 1988; Hosken et al. 1996; Mason et al. 2010; van
Aarde et al. 1994; Van der Merwe & Van Aarde 1989) with concentrations remaining low
during early pregnancy, and peaking prior to birth, followed by a decline (Badwaik &
Rasweiler 2000). The range of plasma progesterone concentrations recorded for pregnant
bats in this study is likely to be in part explained by the different stages of pregnancy which
could not be determined by physical examination alone, as well as differences between
species. These results support work by Mason et al. (2010) that demonstrated plasma
progesterone concentration is not an accurate measure of the stage of pregnancy or
determining whether an individual is pregnant, but can be used as a good indicator of the
timing of pregnancy within a population (e.g. Greiner et al. 2011b) or in the case of this
study, a bat community, if samples from different species are pooled.
The stages of female reproduction in Tasmanian bats were closely associated with mean
monthly minimum temperature and day length. Environmental factors, such as temperature
can produce ideal conditions that increase resource availability, such as insects (Greiner et
al. 2011b). The availability of resources, coupled with changes to day length, are likely cues
to females to ovulate and fertilise eggs, so that young are born during periods of optimal
resource availability and low energetic demand of thermoregulation (Racey & Entwistle
2000). As a consequence peaks in bat activity recorded during bat monitoring are likely to
correspond with the timing of lactation and the dispersal of young in summer. Bat activity in
temperate regions is generally seasonal and associated with environmental factors and the
timing of female reproductive stages (Milne et al. 2005; Russ et al. 2003; Wang et al. 2010).
Declines in bat activity are generally associated with low temperatures and day lengths
during winter when temperatures and insect availability are low and the energetic demands
of thermoregulation are high (Lumsden & Bennett 2005; Sanderson & Kirkley 1998).
The association between the timing of male hormone surges, changes in reproductive
stages, bat activity and environmental factors were less pronounced than for females. This
may in part be because sperm production is not as energetically demanding as pregnancy
and lactation, and consequently is not timed to coincide with optimal resource availability
Chapter 4: The reproductive and activity cycle of Tasmanian bats
63
(Racey & Entwistle 2000). Alternatively, the role of testosterone non-reproductive
behaviours such as aggression may have influenced results (Harris 1999). This would in part
explain why plasma testosterone varied greatly between reproductive stages in males. In
contrast, plasma testosterone concentrations did show a trend to peak in autumn,
coinciding with the end of lactation, sperm storage and social calls produced by bats.
Elevated plasma testosterone concentrations have been recorded in other bat species
during the period of sperm storage and mating (Greiner et al. 2011a; Lloyd et al. 2001). In
temperate regions, mating in bats takes place when day lengths become short (Greiner et
al. 2011b) and may be influenced by female availability (Pfeiffer & Mayer 2012). The findings
of this study suggest bats mate in autumn, though mating was not directly observed.
An unexpected observation in this study was the association between the timing of mating
and the number of social calls. The social calls encoded in bat echolocation call sequences
likely play a crucial role in bat social communication, but there function is still largely
unknown (Knörnschild et al. 2012). A study by Russ et al.(2003) did, however, find that bats
produce social calls year round, with peaks during mating. During mating, male bats produce
territorial and courtship songs to attract a mate (Behr & Von Helversen 2004; Georgiakakis
& Russo 2012) and use social calls to discriminate between sexes of conspecifics
(Knörnschild et al. 2012). Such calls have not been studied in Australia, but the social calls
recorded in this study are similar in attributes to those recorded elsewhere (Behr & Von
Helversen 2004). Though unexplored in bats, this findings of this study suggest peaks in
plasma testosterone may play a role in initiating mating behaviours, such as social calls, in
bats (Greiner et al. 2011a). This is a novel area of research that requires further
investigation.
Other factors such as morphology can also influence the timing of reproductive stages in
closely related bat species. Variation in the timing of reproductive stages, such as birth, are
known to vary with bat body size, as this influences gestation length (Altringham 2011).
Bergmann’s rule states that body size increases with decreasing temperatures (Meiri &
Dayan 2003), and as a consequence bats are predicted to be larger in Tasmania’s cool high
latitude climate compared to the warmer mainland. Where data for comparison is available
Chapter 4: The reproductive and activity cycle of Tasmanian bats
64
Bergmann’s rule holds true. For example, N. geoffroyi in Northern Australia ranges in
forearm length from 30.6 to 38.6mm, in Victoria: 32.0 to 41.7mm and in Tasmania: 37.4 to
42.3mm (Churchill 2009). Furthermore within Tasmania, bat species (Vespadelus spp. <7
grams) were recorded as palpably pregnant and lactating earlier than larger bat species
(Nyctophilus spp., Chalinolobus spp. & F. tasmaniensis >7 grams). Tasmanian bats are
generally larger than their mainland conspecifics as predicted by Bergmann’s rule
(Bogdanowicz 1990). This may in part explain the variation in the timing of reproductive
stages in Tasmanian bats compared to their mainland conspecifics. Similar patterns have
also been found in ringtail possums in Tasmania (Munks 1995).
It is therefore important when undertaking bat monitoring programs not to assume life
history data, such as the timing of reproductive stages from one region to another, because
this may lead to the misinterpretation of data. It is well recognised that temperature, day
length and thus resource availability vary with latitude and therefore so does the
reproductive cycle of bats (Bernard & Tsita 1995; Happold & Happold 1990). In comparison
with mainland conspecifics for which data was available, Tasmanian bat species exhibited
latitudinal variation in the timing of reproductive stages, such as pregnancy and lactation
(Hosken 1997; Tidemann 1993; Van Dyck & Strahan 2008). For example, in Western
Australia (31⁰S), N. geoffroyi and C. morio lactate between September and October (Hosken
1997; Kitchener & Coster 1981), whereas in Tasmania (42⁰S) the majority of individuals do
not lactate until at least one month later between November and February. Such variations
in the timing and also the duration of reproductive stages with latitude are not confined to
bats - Echidnas (Morrow et al. 2009), mice (Dark et al. 1983) and even humans (Moos &
Randall 1995) vary in the timing and patterns of reproduction with latitude.
Kincade et al. (2000) reported the duration of lactation was shorter in Tasmanian bats
compared to their mainland conspecifics and that this may be in response to environmental
factors. In other Tasmanian fauna, such as the echidna (Morrow et al. 2009) and ringtail
possum (Munks 1995), the duration of reproductive stages, such as lactation, also varies
with latitude. However, examination of data in this study, including data from Kincade et al.
(2000) reveals that Tasmanian bats can be found lactating up to one month later than their
Chapter 4: The reproductive and activity cycle of Tasmanian bats
65
lower latitude mainland conspecifics, though as in mainland Australia, this varies yearly with
environmental conditions. Without knowledge of birth dates and understanding the growth
rates of Tasmanian bats it still remains unclear whether lactation is shorter compared to
mainland conspecifics, as birth dates may vary between populations. Similar patterns have
been observed in South Africa where as little as an 8⁰ latitudinal difference has been
associated with variation in the timing of reproductive stages (Le Grange et al. 2011).
In summary, these findings indicate that like bat communities elsewhere, the reproductive
and activity cycle of Tasmanian bats is strongly associated with the environment and the
energetic demands of reproduction. Variation in the timing of reproductive stages between
species is strongly associated with morphology, with larger bats breeding later than smaller
bats. Both environmental factors and morphology are likely to be major factors responsible
for the shift in the timing of reproduction with latitude. Future research into the annual
reproductive and activity cycles of bats throughout their range would provide further
insights into how reproductive stages shift in respond to changing environments.
IMPLICATIONS FOR BAT MONITORING
Understanding the relationship between the reproductive and activity cycle of bats, and
how this varies with latitude is an important component of their conservation and
management. Much information can be gained from bat activity data and this study
highlighted the fact that though little is understood about bat social calls, the type, timing
and number of social calls recorded potentially provide a simple indirect method for
assessing the timing of bat mating during monitoring studies. The data set used for this
study was however limited, and data was not always collected during the same year or to
the same extent, making yearly comparisons in the timing of reproductive stages
impossible. When bat monitoring, consideration should be given to the possibility that bats
may breed outside of the periods outlined in this study.
Such information can be used to inform management actions across a species range, such as
the timing of land management practices outside of key periods such as pregnancy and

Chapter 4: The reproductive and activity cycle of Tasmanian bats
66
lactation. Understanding the timing of reproductive and activity cycles of bats is also
important for monitoring programs and selecting the optimal time for surveying bats and
understanding how habitat requirements vary seasonally. If the timing of reproductive
stages and environmental factors are not accounted for, results of bat monitoring data are
likely to be erroneous.
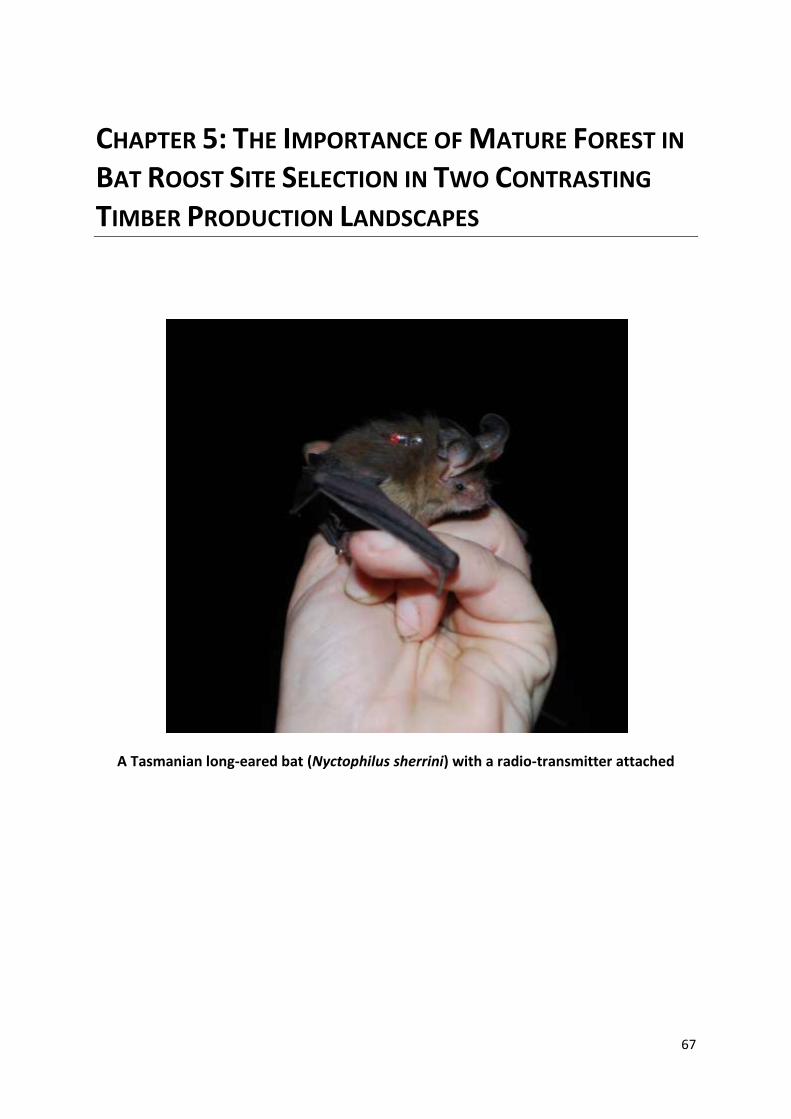
67
CHAPTER 5: THE IMPORTANCE OF MATURE FOREST IN
BAT ROOST SITE SELECTION IN TWO CONTRASTING
TIMBER PRODUCTION LANDSCAPES
A Tasmanian long-eared bat (Nyctophilus sherrini) with a radio-transmitter attached
Chapter 5: Bat roost site selection
68
INTRODUCTION
Mature forest containing hollow-bearing trees provides an important resource for a diverse
range of fauna around the world (Lohmus & Remm 2005; McComb & Noble 1982; Munks et
al. 2004; Webb & Shine 1997). A reduction in the availability of hollow-bearing trees could
have severe consequences for the conservation of many hollow-using fauna, particularly
those that depend upon tree hollows as a place to den, nest and roost (Gibbons &
Lindenmayer 2002). This is because a decline in the availability of hollow-bearing trees can
affect population demographics (e.g. Martin & Handasyde 2007), mating systems (e.g. Banks
et al. 2013) genetic diversity (e.g. Campbell et al. 2009) and abundance (e.g. Newton 1994;
Rhind 2004; Tyndale-Biscoe & Smith 1969) thereby affecting the ability of a species to
persist in landscapes where mature forest is already rare, has been lost, or is highly
fragmented (i.e. urban, agricultural and timber production landscapes).
The importance of maintaining a ‘hollow resource’ in the landscape is well recognised by
forest managers and consequently strategies for the retention and regeneration of hollow-
bearing trees in areas where mature forest is, or will be lost or modified, have been
developed around the world (Loyn & Kennedy 2009; Mazurek 2004; Munks et al. 2009;
Parnaby et al. 2012; Pattanavibool & Edge 1996). One of the greatest challenges for forest
managers, however, is how to make informed strategic decisions related to the
management of mature forest in relation to the type, amount and spatial arrangement of
mature forest that should be retained for biodiversity conservation (Munks et al. 2009;
Parnaby et al. 2012; Whitford & Stone 2004). This is particularly challenging because there is
relatively little information available on the effectiveness of current management strategies
for mature forest retention and the mature habitat requirements of many species.
The effective management of mature forest in the landscape is an important part of the
conservation of hollow-using bats(Parnaby et al. 2012). This is because many bat species
rely on mature forest elements, such as hollow-bearing trees, as roost sites. Roost sites are
not only important for shelter sites, but also for hibernation, socialising, mating and raising
Chapter 5: Bat roost site selection
69
young (Kunz & Lumsden 2003). Roost site preferences vary depending on their social,
energetic and thermoregulatory needs, which can vary between species, sex, reproductive
condition and seasonally(Boland et al. 2009; Lumsden et al. 2002a; Perry & Thill 2007;
RuczynÌski & Bogdanowicz 2008; Sedgeley 2003). Bats also exhibit both specifity and
flexibility in their roosting preferences (Lumsden & Bennett 2006). This may explain why
several studies have found that the type and location of roosts used by bats varies between
landscapes (Law & Anderson 2000; Miles et al. 2006; Waldien et al. 2000). Such variation in
roost site preferences may be a result of bats balancing their specific and flexible roost site
requirements with their other needs. By understanding the roost site preferences of bats in
different landscapes, an understanding of the importance of different roost site attributes
to bats can be ascertained to inform forest management.
Declines in bat species world-wide have been attributed at least in part to the loss and
modification of mature forest containing suitable hollow-bearing trees (Pierson & Racey
1998). It is speculated that the anticipated future loss of hollow-bearing trees, combined
with threats from timber harvesting, fire and drought stress, could mean that all bat species
that are dependent on hollow-bearing trees will become threatened (Parnaby et al. 2012).
Tasmania, is home to eight species of insectivorous bats (Family: Vespertilionidae) (Driessen
et al. 2011), including one endemic bat – the Tasmanian long-eared bat (Nyctophilus
sherrini) (Parnaby 2009). The retention of suitable types, amounts and spatial arrangements
of mature forest habitat is an important part of conserving Tasmania’s bats (Taylor & Savva
1988) because of their dependence on hollow-bearing trees as roost sites (Koch et al.
2008b). Management of the maintenance of mature forest for hollow-using fauna on
private and public land have been developed and are delivered via Tasmanian Forest
Practices Code (Forest Practices Board 2000; Munks et al. 2009; Taylor 1991). In the absence
of information on the habitat requirements of many hollow-using species, these
management strategies have been developed based on the multi-spatial scale approach to
forest management for biodiversity conservation developed using ecological theory
(Lindenmayer & Franklin 2002). These management strategies include the retention of
mature forest at the landscape and stand scale in the form of small and large patches and
strips (Baker & Read 2011; Forest Practices Board 2000; Munks et al. 2009; Taylor 1991).
Chapter 5: Bat roost site selection
70
The overall objective of this study was to investigate the roosting preferences of Tasmania’s
bats in two different timber production landscapes. In particular this study wanted to
investigate the importance of the type, amount and spatial arrangement of mature forest in
timber production forests for bat roosting habitat.
METHODS
Study area
The study was carried out in dry Eucalypt forests in south-eastern Tasmania. Dry Eucalypt
forests constitute 45% of Tasmania’s forest cover (Forest Practices Authority 2012) and have
a long history of human land use practices such as timber harvesting, plantation
development and agriculture over the last 200 years (Munks et al. 2007). In this region, two
‘landscapes’ were selected (‘Kellevie’ and ‘Woodsdale’). Each comprised of two partially
harvested forest stands surrounded by different types, amounts and spatial arrangements
of mature forest (Figure 17). The Kellevie landscape contained two regenerating forest
stands (Coupe: MM002A & 4A) in which 51.2ha were harvested in 1997 (2A) and 69ha in
2004 (4A). The Woodsdale landscape contained a 153ha forest stand regenerating after
harvest in 1998 (Coupe: SW049A). Both landscapes had different types of mature forest
patches retained in and on the edge of the harvested area. Both landscapes were also
known to have trees used by hollow-using fauna(Cawthen & Munks 2011). In addition, roost
sites were found in the Woodsdale landscape during a previous study prior to the harvesting
of SW049a (Taylor & Savva 1988). Each harvested forest stand was dominated by dry
sclerophyll forest and woodland (Eucalyptus obliqua and Eucalyptus pulchella-globulus-
viminalis) with wet sclerophyll forest in gullies (Eucalyptus obliqua) (Forest Practices
Authority. 2005).
Forest management strategies for the retention of mature forest implemented at each
landscape included:
Individual trees – one hollow-bearing tree retained in the harvested area as part of
the silvicultural prescriptions (Wilkinson 1994)
Chapter 5: Bat roost site selection
71
Small patches – a small patch ‘wildlife habitat clump’ containing two to three
hollow-bearing trees surrounded by ’recruitment’ trees retained in the harvested
area (mean size = 0.1ha)
Narrow strips – a narrow linear strip ‘roadside reserve’ retained on the edge of a
harvested area and adjacent road (mean size =3ha, 5-15 m wide)
Large strips – a large linear strip ‘wildlife habitat strip’ retained on the edge of a
harvested area between two harvested forests (mean size = 15ha, 100 m wide)
Large patches – a large area of forest retained immediately outside the harvested
area (mean size = 370ha) (Forest Practices Board 2000)
The type, amount and spatial arrangement of mature forest habitat surrounding each
harvested forest stand was assessed using a mature habitat spatial layer (Forest Practices
Authority. 2011) (Figure 17). The spatial layer was developed by using aerial photographs to
remotely assess mature habitat availability (Forest Practices Authority. 2011; Koch & Baker
2011) as one of five types: none, negligible, low, medium and high. Areas cleared of
vegetation and water bodies were classed as none and so were predicted to have no
hollow-bearing trees. Areas identified as non-forest, plantation or as regrowth forest with
no mature eucalypt cover were classed as negligible and so were predicted to have
negligible densities of hollow-bearing trees. Areas containing less than 20% mature eucalypt
crown cover were classed as low and so were predicted to have low densities of hollow-
bearing trees. Areas containing between 20 and 40% mature eucalypt crown cover were
classed as medium and so were predicted to have medium densities of hollow-bearing
trees. Areas with more than 40% mature eucalypt crown cover was classed as high and
predicted to have high densities of hollow-bearing trees (Forest Practices Authority. 2011).
The proportion of each mature habitat availability class in each landscape (‘Kellevie’ and
‘Woodsdale’) was calculated at one, three and five kilometre radii from the centre of each
landscape using ArcGIS 9.1. This approached illustrated variations in the type, amount and
spatial arrangement of mature habitat in each landscape (Figure 16). A five kilometre
maximum area was used as ‘the landscape’ because this was the maximum distance over
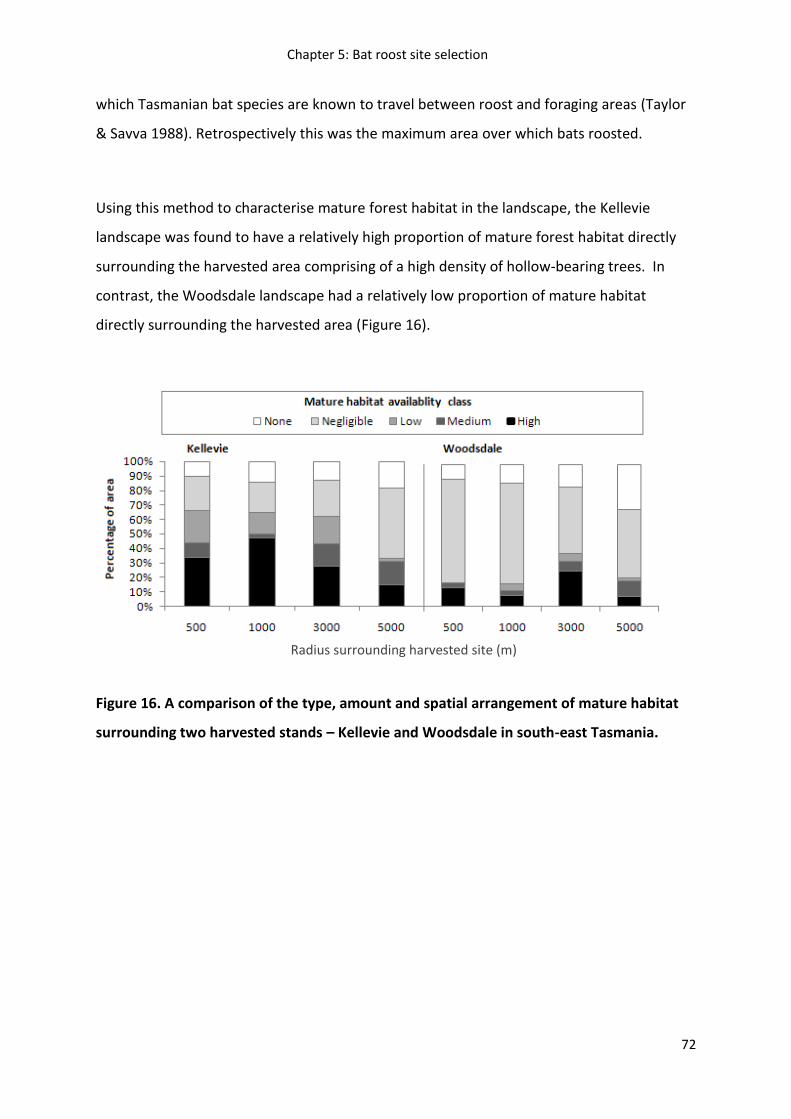
Chapter 5: Bat roost site selection
72
which Tasmanian bat species are known to travel between roost and foraging areas (Taylor
& Savva 1988). Retrospectively this was the maximum area over which bats roosted.
Using this method to characterise mature forest habitat in the landscape, the Kellevie
landscape was found to have a relatively high proportion of mature forest habitat directly
surrounding the harvested area comprising of a high density of hollow-bearing trees. In
contrast, the Woodsdale landscape had a relatively low proportion of mature habitat
directly surrounding the harvested area (Figure 16).
Figure 16. A comparison of the type, amount and spatial arrangement of mature habitat
surrounding two harvested stands – Kellevie and Woodsdale in south-east Tasmania.
Radius surrounding harvested site (m)
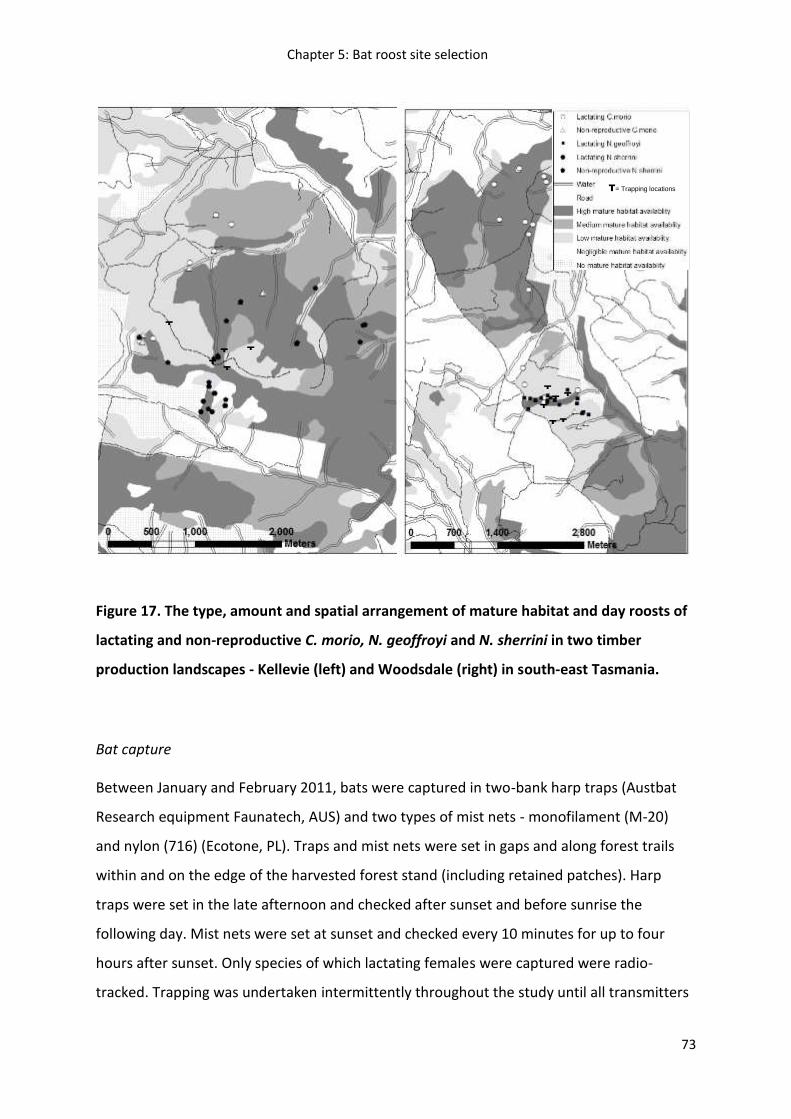
Chapter 5: Bat roost site selection
73
Figure 17. The type, amount and spatial arrangement of mature habitat and day roosts of
lactating and non-reproductive C. morio, N. geoffroyi and N. sherrini in two timber
production landscapes - Kellevie (left) and Woodsdale (right) in south-east Tasmania.
Bat capture
Between January and February 2011, bats were captured in two-bank harp traps (Austbat
Research equipment Faunatech, AUS) and two types of mist nets - monofilament (M-20)
and nylon (716) (Ecotone, PL). Traps and mist nets were set in gaps and along forest trails
within and on the edge of the harvested forest stand (including retained patches). Harp
traps were set in the late afternoon and checked after sunset and before sunrise the
following day. Mist nets were set at sunset and checked every 10 minutes for up to four
hours after sunset. Only species of which lactating females were captured were radio-
tracked. Trapping was undertaken intermittently throughout the study until all transmitters
T= Trapping locations
T
T T
T T
T
T T
T
T
T
Chapter 5: Bat roost site selection
74
were deployed. Two male F. tasmaniensis were also radio-tracked but the results are not
reported here as no lactating females were located.
Upon capture all bats were identified to species using field guides (Churchill 2009; Taylor et
al. 1987). Bats were checked for a pre-existing microchip and if the bat weighed more than 9
grams and was not chipped, an ISO FDX-B transponder chip (Passive implantable
transponder (PIT) tag) was implanted subcutaneously between the shoulder blades for
individual identification (Biomark, 12.50mm x 2.07mm, wt=0.102g). Bats were weighed,
sexed, aged and reproductive condition assessed following the methods outlined in
Churchill (2009).
Radio-telemetry
Radio-transmitters (Model LB-2N, Holohil Systems Ltd, Ontario, Canada) weighing between
0.32 and 0.42 g and with a battery life of 9 to 21 days were glued onto the skin between the
shoulder blades of bats using Urobond IV skin adhesive. Transmitter mass was between 3
and 5% of body mass to minimise potential effects on flight ecology (Aldridge & Brigham
1988).
Bats were radio-tracked by car and then on foot to their roosts by ‘homing’ in on the radio
transmitter signal between dawn and dusk each day using a hand-held receiver and yagi
antennae. Where possible, the location of each bat within the roost was determined by
inspecting the roost (e.g. in a basal cavity), roost watching at dusk or by detaching the
antennae from the receiver and locating the precise position of the transmitter to the
nearest ± 0.50 m. Bats were tracked until transmitters fell off or the batteries expired.
Roosts were watched before sunset for 30 to 90 minutes to determine colony size and for
roost site confirmation. One to five observers were positioned at a roost so that the
potential roost location (e.g. a hollow or fissure) was silhouetted against the setting sun. As
bats sometimes returned to the colony whilst other bats were emerging, a conservative
Chapter 5: Bat roost site selection
75
estimate of colony size was used (the number of bats emerged minus the number of bats
entering during the emergence).
Roosts were classified into roost types depending on number and reproductive condition of
the bats occupying the roost. Roosts were classified as follows:
Maternal solitary roost - a roost that contained one lactating bat.
Maternal colonial roost – a roost that contained more than one lactating bat.
Non-maternal solitary roost – a roost used by a non-reproductive bat.
Roost site attribute assessments
Attributes of the type and location of roost sites used by bats were measured and compared
to document differences in roost sites between species and sites. Attributes measured were
selected based on the results of previous studies (i.e. Webala et al. 2011) or were factors
thought to potentially influence the roost site suitability. These attributes were measured
using a combination of field collected and spatial data (Table 8). It was not possible to
collect all attributes for all roosts as a bat’s exact location in the roost tree could not always
be determined. Most roost-use studies compare the attributes of used roosts with those
that are available (e.g. Threlfall et al. 2013), but in this study comparisons of only used roost
sites were made because of the errors associated with assessing tree hollow occurrence and
abundance (Koch 2008).
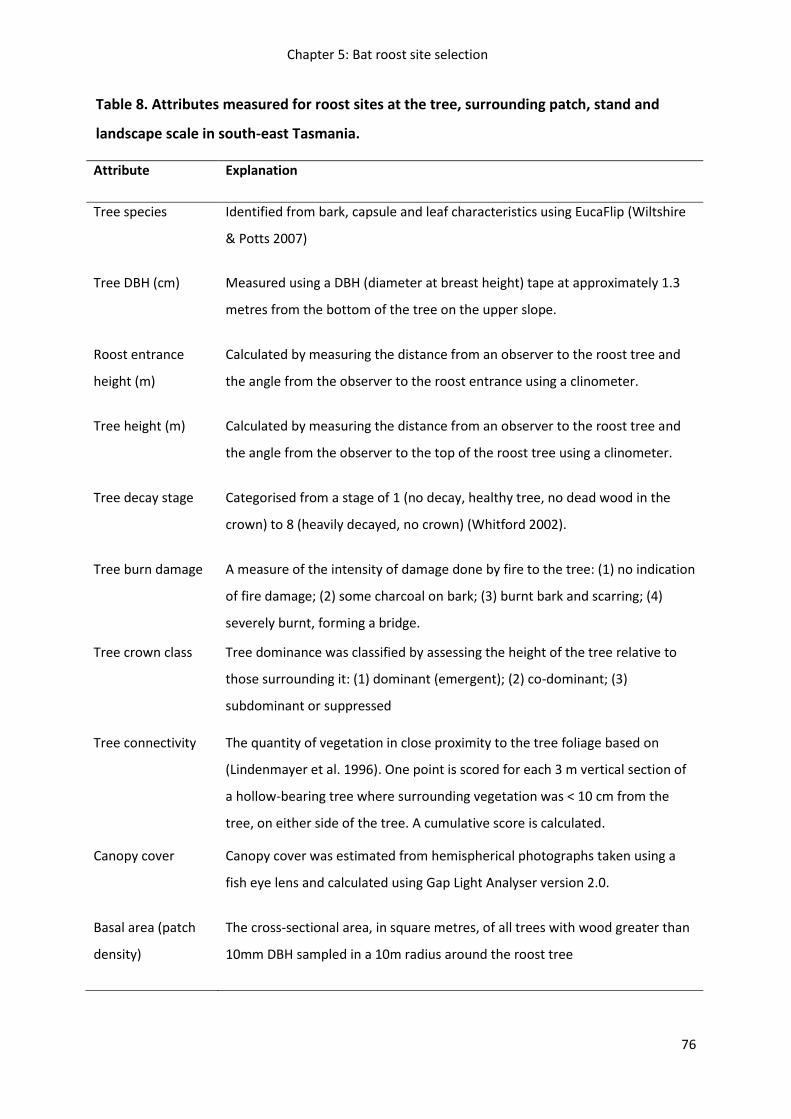
Chapter 5: Bat roost site selection
76
Table 8. Attributes measured for roost sites at the tree, surrounding patch, stand and
landscape scale in south-east Tasmania.
Attribute Explanation
Tree species Identified from bark, capsule and leaf characteristics using EucaFlip (Wiltshire
& Potts 2007)
Tree DBH (cm) Measured using a DBH (diameter at breast height) tape at approximately 1.3
metres from the bottom of the tree on the upper slope.
Roost entrance
height (m)
Calculated by measuring the distance from an observer to the roost tree and
the angle from the observer to the roost entrance using a clinometer.
Tree height (m) Calculated by measuring the distance from an observer to the roost tree and
the angle from the observer to the top of the roost tree using a clinometer.
Tree decay stage Categorised from a stage of 1 (no decay, healthy tree, no dead wood in the
crown) to 8 (heavily decayed, no crown) (Whitford 2002).
Tree burn damage A measure of the intensity of damage done by fire to the tree: (1) no indication
of fire damage; (2) some charcoal on bark; (3) burnt bark and scarring; (4)
severely burnt, forming a bridge.
Tree crown class Tree dominance was classified by assessing the height of the tree relative to
those surrounding it: (1) dominant (emergent); (2) co-dominant; (3)
subdominant or suppressed
Tree connectivity The quantity of vegetation in close proximity to the tree foliage based on
(Lindenmayer et al. 1996). One point is scored for each 3 m vertical section of
a hollow-bearing tree where surrounding vegetation was < 10 cm from the
tree, on either side of the tree. A cumulative score is calculated.
Canopy cover Canopy cover was estimated from hemispherical photographs taken using a
fish eye lens and calculated using Gap Light Analyser version 2.0.
Basal area (patch
density)
The cross-sectional area, in square metres, of all trees with wood greater than
10mm DBH sampled in a 10m radius around the roost tree
Chapter 5: Bat roost site selection
77
Patch Stem density The number of trees with wood greater than 10mm DBH sampled in a 10m
radius around the roost tree
Patch hollow-
bearing tree
density
The number of trees with a visible cavity with wood greater than 10mm DBH
sampled in a 10m radius around the roost tree
Patch size (ha) The area of the mature forest patch that the roost site was located in. If roost
site not located in mature forest value equals 0. Measured using ArcGIS and
georeferenced aerial images.
Stand height (m) Median tree canopy height for the forest stand the roost tree was located in.
Estimated from photo interpretation data.
Stand disturbance
history
Forest classified according to the presence and significance of aged eucalypt
regeneration elements as indicators of past disturbance
Site slope (degrees) Measured using a clinometer where the roost tree was situated.
Site elevation (m) Elevation of roost site. Estimated from spatial data (DPIPWE Contours_10m)
Distance to cleared
land (km)
Calculated using ArcGIS as the distance between roost site and the nearest
edge of cleared land and land converted to plantation or pasture.
Distance to water
source (m)
Calculated using ArcGIS as the distance between roost site and the nearest
water source
Distance to
regrowth forest (m)
Calculated using ArcGIS as the distance between roost site and the nearest
edge of regrowth forest
Distance to roads
(m)
Calculated using ArcGIS as the distance between roost site and the nearest
road or track
Chapter 5: Bat roost site selection
78
Statistical analyses
The attributes describing differences in the type and location of roost sites at Kellevie and
Woodsdale were analysed separately because of the different groups of species studied at
each landscape. MDS (multidimensional scaling) plots were used to determine whether sex
and reproductive condition or roost type influenced roost site selection and samples were
grouped accordingly for analysis. Since many roost site attributes measured were collinear,
a machine learning approach using random forest was used to select the most important
roost site attributes for comparison between species and landscapes (Breiman 2001). To
test whether variation in roost site selection and movements was significant between
groups, a randomization student t-test was used. For roost site attributes, selection was
assessed by comparing inter-specific variation in the attributes of roosts within a site and
intra-specific variation in the attributes of roosts between sites. This approach was used
rather than the traditional approach of comparing ‘ used ‘ with ‘ available’ roosts because of
the intrinsic issues associated with identifying ‘available’ trees that contain hollows from the
ground {Koch, 2008 #902} and because no asymptotic relationship between the number of
roosts located and the number of days bats were tracked had been reached, indicating that
if radio-tracking were to have continued, roosts that were potentially selected as ‘ available ‘
may have been used.
To determine whether bats were selecting roost site locations in relation to mature habitat
type (i.e. the availability of hollow-bearing trees), roost site selection was analysed at two
different spatial scales – the landscape and the finer local scale. Landscape habitat selection
was a comparison of the availability of types of mature forest habitat throughout the area
where bats were roosting with the proportion available in the landscape. Finer local scale
habitat selection was a comparison of the proportion of roost sites located in each mature
habitat type compared with their availability in the area over which bats were roosting. As
the total area of the landscape used by each species and group varied, and the total area of
the landscape used for each group was unknown due to the relatively small duration of the
study, finer scale habitat selection provided a conservative estimate of the surrounding
Chapter 5: Bat roost site selection
79
landscape that influenced roost-site selection. A bat’s roosting range was calculated using
100% minimum convex polygon analysis under the condition that at least three roost site
locations were recorded. A buffer of 100 metres at bat roost site locations was used to
avoid potential incorrect classifications of bat roost site habitat as photo interpretation was
mapped to 100m at these sites. Habitat selection was analysed using Fisher’s Exact Test. All
statistical analyses were carried out using the statistical program R (R Development Core
Team 2011).
RESULTS
Bats radio-tracked
All eight Tasmanian bat species were captured at Kellevie but at Woodsdale only N.
geoffroyi, C. morio, V. darlingtoni, V. regulus and V. vulturnus were captured. This was
despite lactating N. sherrini being captured at Woodsdale in the 1980s (Taylor & Savva
1988) and a male N. sherrini being captured the previous spring. A total of 24 individuals
from three bat species were radio-tracked between January and February 2011 (Table 9).
Individuals were radio-tracked for a mean 10±3 days (3-20 days) with transmitters dropping
off bats at roost sites (inside and outside) as well as in forest and along tracks. All three
species demonstrated site fidelity, with four of the lactating individuals radio-tracked being
recaptures from the previous summer (Kellevie: 2 N. sherrini, Woodsdale: 1 N. geoffroyi and
1 C. morio).
Table 9. Details of the 24 bats radio-tracked at two timber production landscapes – Kellevie and Woodsdale, in south-east Tasmania.
Species
Kellevie Woodsdale
Lactating Non-reproductive
Lactating Non-reproductive
Chalinolobus morio 1♀ 1 ♀ 1♂ 3♀ 1 ♀
Nyctophilus geoffroyi - 1♂ 7♀ -
Nyctophilius sherrni 4♀ 2 ♀ 3♂ - -
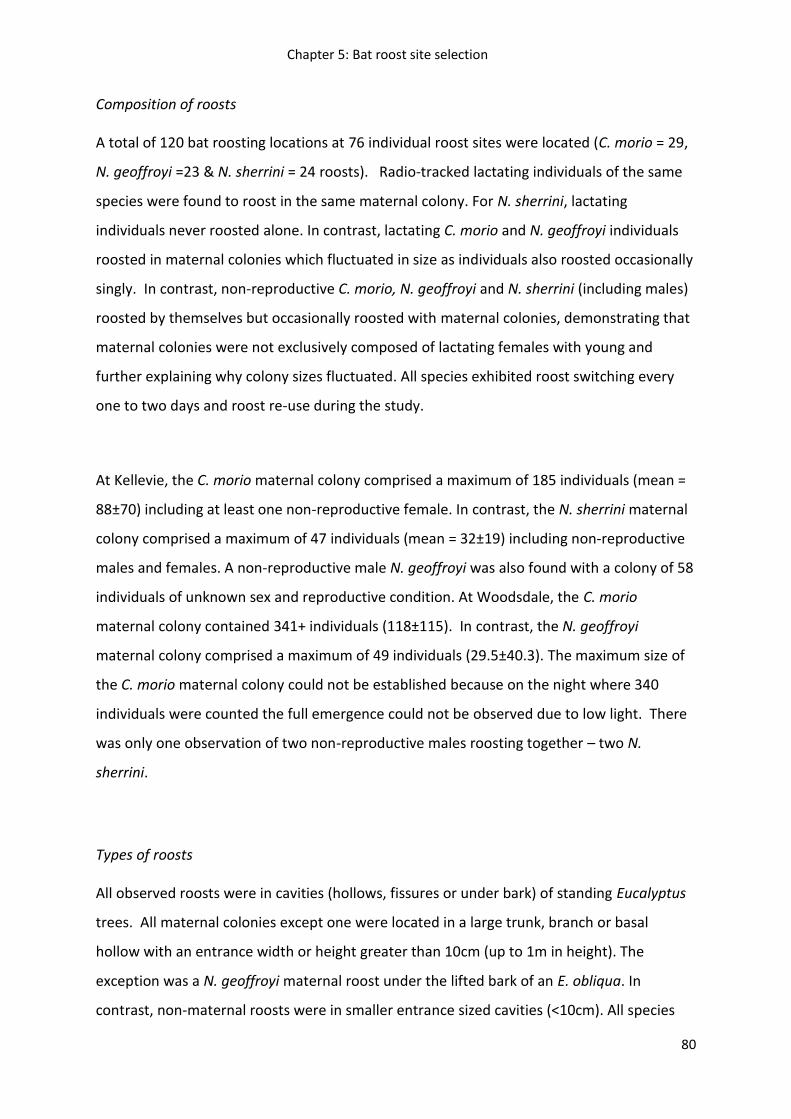
Chapter 5: Bat roost site selection
80
Composition of roosts
A total of 120 bat roosting locations at 76 individual roost sites were located (C. morio = 29,
N. geoffroyi =23 & N. sherrini = 24 roosts). Radio-tracked lactating individuals of the same
species were found to roost in the same maternal colony. For N. sherrini, lactating
individuals never roosted alone. In contrast, lactating C. morio and N. geoffroyi individuals
roosted in maternal colonies which fluctuated in size as individuals also roosted occasionally
singly. In contrast, non-reproductive C. morio, N. geoffroyi and N. sherrini (including males)
roosted by themselves but occasionally roosted with maternal colonies, demonstrating that
maternal colonies were not exclusively composed of lactating females with young and
further explaining why colony sizes fluctuated. All species exhibited roost switching every
one to two days and roost re-use during the study.
At Kellevie, the C. morio maternal colony comprised a maximum of 185 individuals (mean =
88±70) including at least one non-reproductive female. In contrast, the N. sherrini maternal
colony comprised a maximum of 47 individuals (mean = 32±19) including non-reproductive
males and females. A non-reproductive male N. geoffroyi was also found with a colony of 58
individuals of unknown sex and reproductive condition. At Woodsdale, the C. morio
maternal colony contained 341+ individuals (118±115). In contrast, the N. geoffroyi
maternal colony comprised a maximum of 49 individuals (29.5±40.3). The maximum size of
the C. morio maternal colony could not be established because on the night where 340
individuals were counted the full emergence could not be observed due to low light. There
was only one observation of two non-reproductive males roosting together – two N.
sherrini.
Types of roosts
All observed roosts were in cavities (hollows, fissures or under bark) of standing Eucalyptus
trees. All maternal colonies except one were located in a large trunk, branch or basal
hollow with an entrance width or height greater than 10cm (up to 1m in height). The
exception was a N. geoffroyi maternal roost under the lifted bark of an E. obliqua. In
contrast, non-maternal roosts were in smaller entrance sized cavities (<10cm). All species
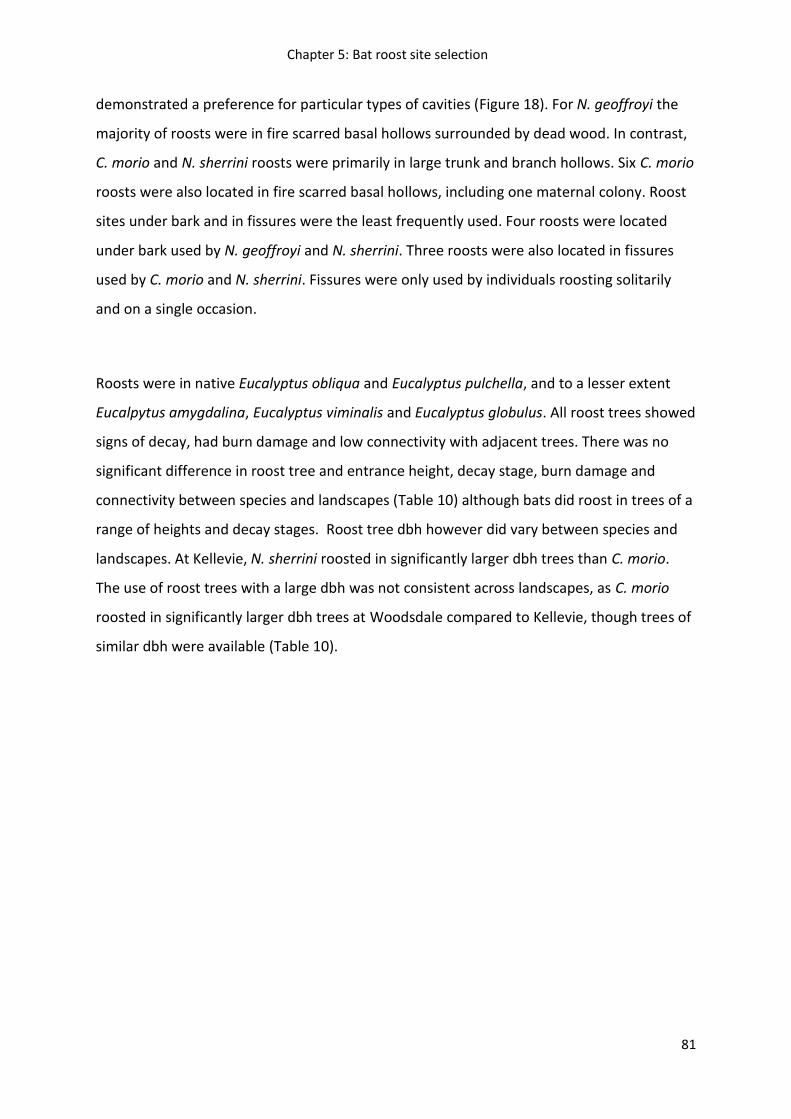
Chapter 5: Bat roost site selection
81
demonstrated a preference for particular types of cavities (Figure 18). For N. geoffroyi the
majority of roosts were in fire scarred basal hollows surrounded by dead wood. In contrast,
C. morio and N. sherrini roosts were primarily in large trunk and branch hollows. Six C. morio
roosts were also located in fire scarred basal hollows, including one maternal colony. Roost
sites under bark and in fissures were the least frequently used. Four roosts were located
under bark used by N. geoffroyi and N. sherrini. Three roosts were also located in fissures
used by C. morio and N. sherrini. Fissures were only used by individuals roosting solitarily
and on a single occasion.
Roosts were in native Eucalyptus obliqua and Eucalyptus pulchella, and to a lesser extent
Eucalpytus amygdalina, Eucalyptus viminalis and Eucalyptus globulus. All roost trees showed
signs of decay, had burn damage and low connectivity with adjacent trees. There was no
significant difference in roost tree and entrance height, decay stage, burn damage and
connectivity between species and landscapes (Table 10) although bats did roost in trees of a
range of heights and decay stages. Roost tree dbh however did vary between species and
landscapes. At Kellevie, N. sherrini roosted in significantly larger dbh trees than C. morio.
The use of roost trees with a large dbh was not consistent across landscapes, as C. morio
roosted in significantly larger dbh trees at Woodsdale compared to Kellevie, though trees of
similar dbh were available (Table 10).
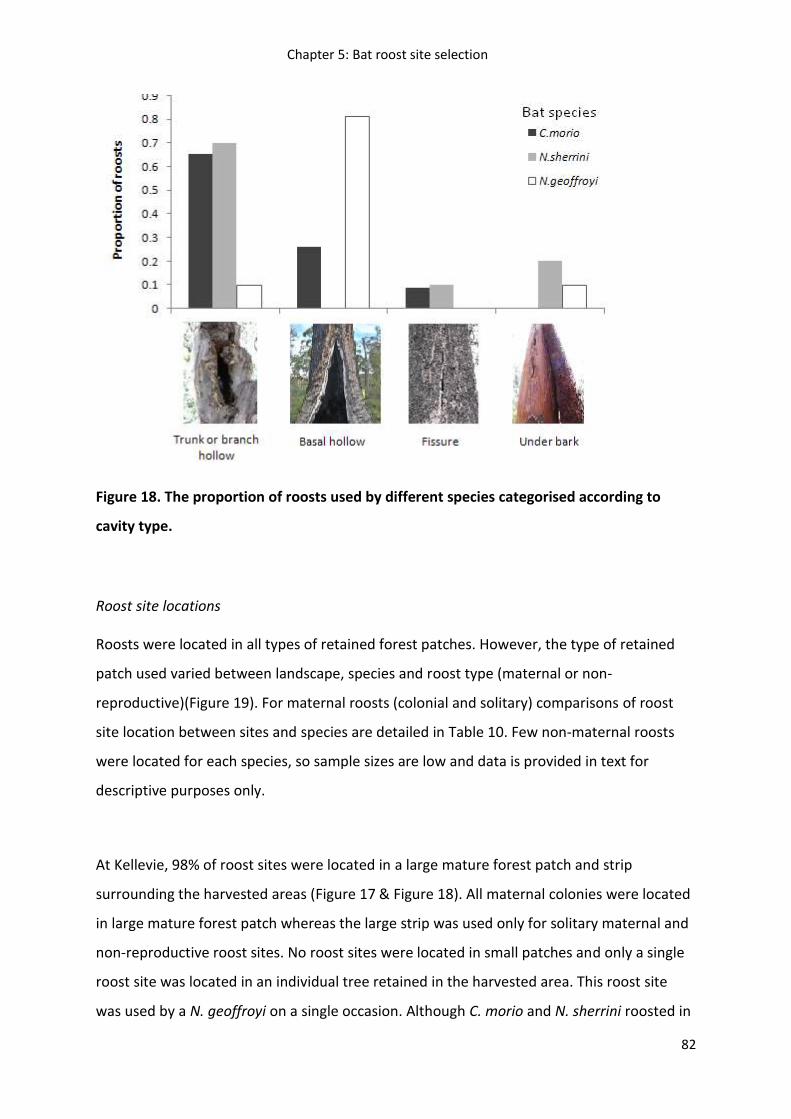
Chapter 5: Bat roost site selection
82
Figure 18. The proportion of roosts used by different species categorised according to
cavity type.
Roost site locations
Roosts were located in all types of retained forest patches. However, the type of retained
patch used varied between landscape, species and roost type (maternal or non-
reproductive)(Figure 19). For maternal roosts (colonial and solitary) comparisons of roost
site location between sites and species are detailed in Table 10. Few non-maternal roosts
were located for each species, so sample sizes are low and data is provided in text for
descriptive purposes only.
At Kellevie, 98% of roost sites were located in a large mature forest patch and strip
surrounding the harvested areas (Figure 17 & Figure 18). All maternal colonies were located
in large mature forest patch whereas the large strip was used only for solitary maternal and
non-reproductive roost sites. No roost sites were located in small patches and only a single
roost site was located in an individual tree retained in the harvested area. This roost site
was used by a N. geoffroyi on a single occasion. Although C. morio and N. sherrini roosted in
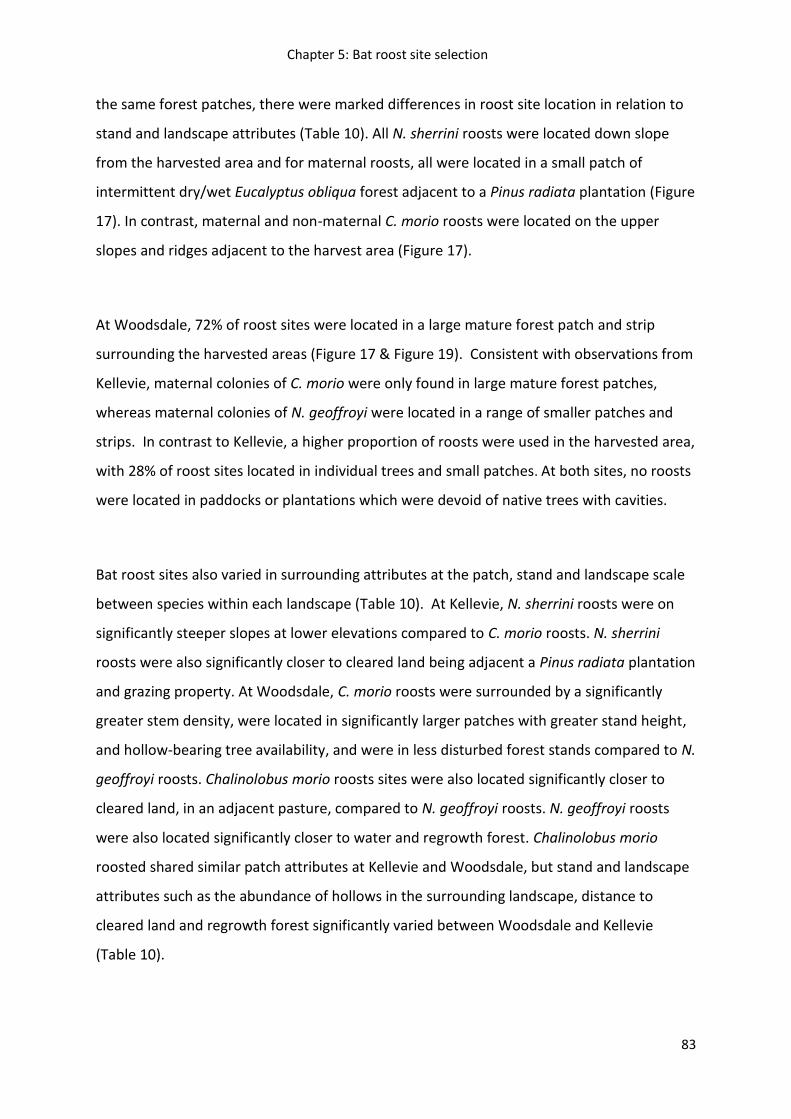
Chapter 5: Bat roost site selection
83
the same forest patches, there were marked differences in roost site location in relation to
stand and landscape attributes (Table 10). All N. sherrini roosts were located down slope
from the harvested area and for maternal roosts, all were located in a small patch of
intermittent dry/wet Eucalyptus obliqua forest adjacent to a Pinus radiata plantation (Figure
17). In contrast, maternal and non-maternal C. morio roosts were located on the upper
slopes and ridges adjacent to the harvest area (Figure 17).
At Woodsdale, 72% of roost sites were located in a large mature forest patch and strip
surrounding the harvested areas (Figure 17 & Figure 19). Consistent with observations from
Kellevie, maternal colonies of C. morio were only found in large mature forest patches,
whereas maternal colonies of N. geoffroyi were located in a range of smaller patches and
strips. In contrast to Kellevie, a higher proportion of roosts were used in the harvested area,
with 28% of roost sites located in individual trees and small patches. At both sites, no roosts
were located in paddocks or plantations which were devoid of native trees with cavities.
Bat roost sites also varied in surrounding attributes at the patch, stand and landscape scale
between species within each landscape (Table 10). At Kellevie, N. sherrini roosts were on
significantly steeper slopes at lower elevations compared to C. morio roosts. N. sherrini
roosts were also significantly closer to cleared land being adjacent a Pinus radiata plantation
and grazing property. At Woodsdale, C. morio roosts were surrounded by a significantly
greater stem density, were located in significantly larger patches with greater stand height,
and hollow-bearing tree availability, and were in less disturbed forest stands compared to N.
geoffroyi roosts. Chalinolobus morio roosts sites were also located significantly closer to
cleared land, in an adjacent pasture, compared to N. geoffroyi roosts. N. geoffroyi roosts
were also located significantly closer to water and regrowth forest. Chalinolobus morio
roosted shared similar patch attributes at Kellevie and Woodsdale, but stand and landscape
attributes such as the abundance of hollows in the surrounding landscape, distance to
cleared land and regrowth forest significantly varied between Woodsdale and Kellevie
(Table 10).
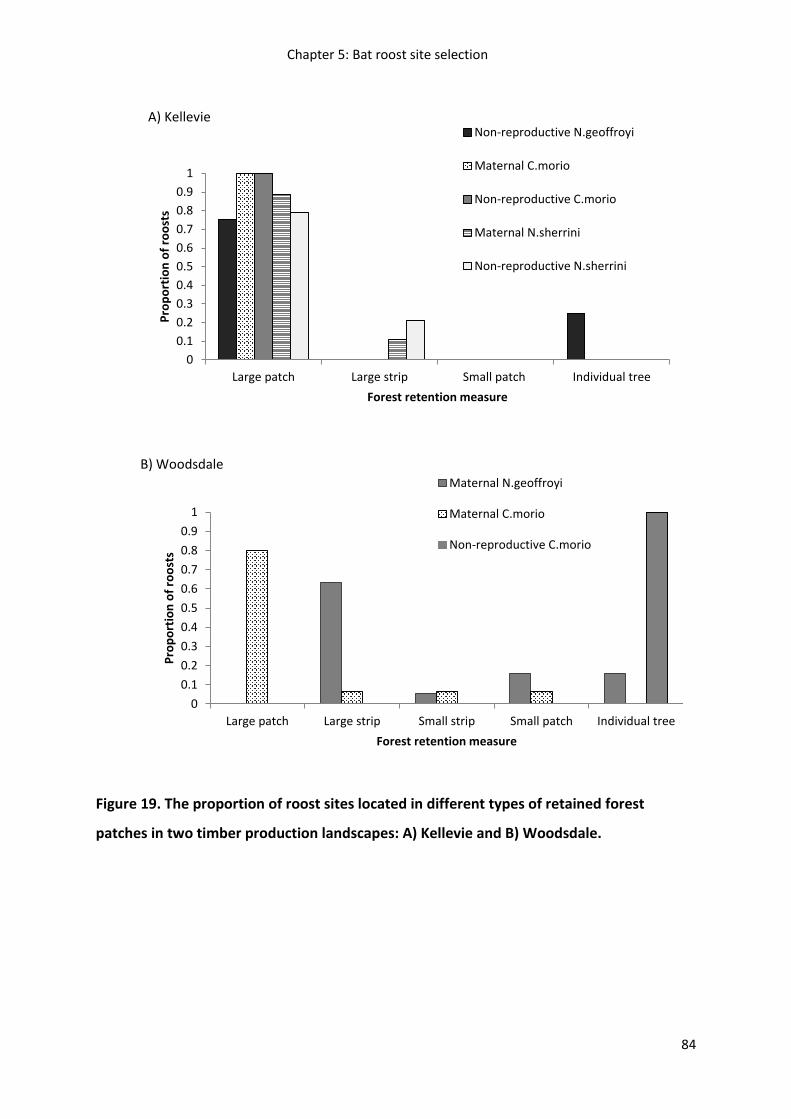
Chapter 5: Bat roost site selection
84
Figure 19. The proportion of roost sites located in different types of retained forest
patches in two timber production landscapes: A) Kellevie and B) Woodsdale.
0
0.1
0.2
0.3
0.4
0.5
0.6
0.7
0.8
0.9
1
Large patch Large strip Small strip Small patch Individual tree
Pro
po
rtio
n o
f ro
ost
s
Forest retention measure
Maternal N.geoffroyi
Maternal C.morio
Non-reproductive C.morio
B) Woodsdale
0
0.1
0.2
0.3
0.4
0.5
0.6
0.7
0.8
0.9
1
Large patch Large strip Small patch Individual tree
Pro
po
rtio
n o
f ro
ost
s
Forest retention measure
Non-reproductive N.geoffroyi
Maternal C.morio
Non-reproductive C.morio
Maternal N.sherrini
Non-reproductive N.sherrini
A) Kellevie
0
0.1
0.2
0.3
0.4
0.5
0.6
0.7
0.8
0.9
1
Large patch Large strip Small patch Individual tree
Pro
po
rtio
n o
f ro
ost
s
Forest retention measure
Non-reproductive N.geoffroyi
Maternal C.morio
Non-reproductive C.morio
Maternal N.sherrini
Non-reproductive N.sherrini
A) Kellevie
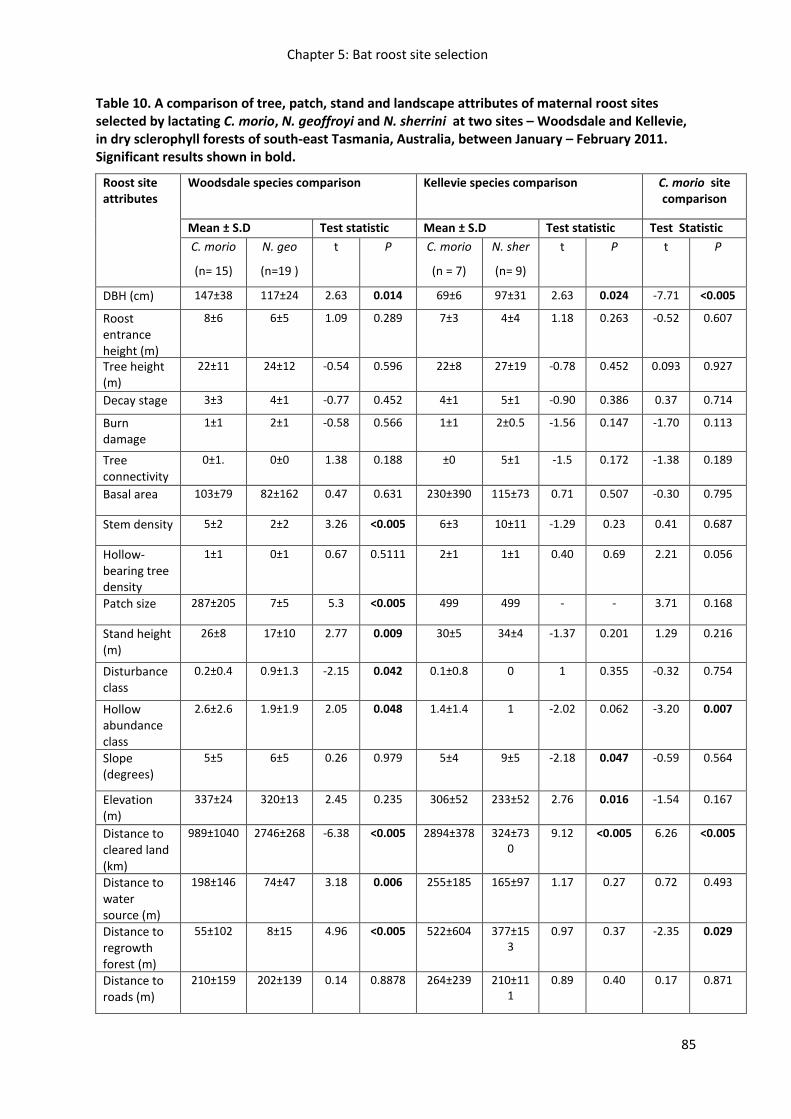
Chapter 5: Bat roost site selection
85
Table 10. A comparison of tree, patch, stand and landscape attributes of maternal roost sites selected by lactating C. morio, N. geoffroyi and N. sherrini at two sites – Woodsdale and Kellevie, in dry sclerophyll forests of south-east Tasmania, Australia, between January – February 2011. Significant results shown in bold.
Roost site attributes
Woodsdale species comparison Kellevie species comparison C. morio site comparison
Mean ± S.D Test statistic Mean ± S.D Test statistic Test Statistic
C. morio
(n= 15)
N. geo
(n=19 )
t P C. morio
(n = 7)
N. sher
(n= 9)
t P t P
DBH (cm) 147±38 117±24 2.63 0.014 69±6 97±31 2.63 0.024 -7.71 <0.005
Roost entrance height (m)
8±6 6±5 1.09 0.289 7±3 4±4 1.18 0.263 -0.52 0.607
Tree height (m)
22±11 24±12 -0.54 0.596 22±8 27±19 -0.78 0.452 0.093 0.927
Decay stage 3±3 4±1 -0.77 0.452 4±1 5±1 -0.90 0.386 0.37 0.714
Burn damage
1±1 2±1 -0.58 0.566 1±1 2±0.5 -1.56 0.147 -1.70 0.113
Tree connectivity
0±1. 0±0 1.38 0.188 ±0 5±1 -1.5 0.172 -1.38 0.189
Basal area 103±79 82±162 0.47 0.631 230±390 115±73 0.71 0.507 -0.30 0.795
Stem density 5±2 2±2 3.26 <0.005 6±3 10±11 -1.29 0.23 0.41 0.687
Hollow-bearing tree density
1±1 0±1 0.67 0.5111 2±1 1±1 0.40 0.69 2.21 0.056
Patch size 287±205 7±5 5.3 <0.005 499 499 - - 3.71 0.168
Stand height (m)
26±8 17±10 2.77 0.009 30±5 34±4 -1.37 0.201 1.29 0.216
Disturbance class
0.2±0.4 0.9±1.3 -2.15 0.042 0.1±0.8 0 1 0.355 -0.32 0.754
Hollow abundance class
2.6±2.6 1.9±1.9 2.05 0.048 1.4±1.4 1 -2.02 0.062 -3.20 0.007
Slope (degrees)
5±5 6±5 0.26 0.979 5±4 9±5 -2.18 0.047 -0.59 0.564
Elevation (m)
337±24 320±13 2.45 0.235 306±52 233±52 2.76 0.016 -1.54 0.167
Distance to cleared land (km)
989±1040 2746±268 -6.38 <0.005 2894±378 324±730
9.12 <0.005 6.26 <0.005
Distance to water source (m)
198±146 74±47 3.18 0.006 255±185 165±97 1.17 0.27 0.72 0.493
Distance to regrowth forest (m)
55±102 8±15 4.96 <0.005 522±604 377±153
0.97 0.37 -2.35 0.029
Distance to roads (m)
210±159 202±139 0.14 0.8878 264±239 210±111
0.89 0.40 0.17 0.871
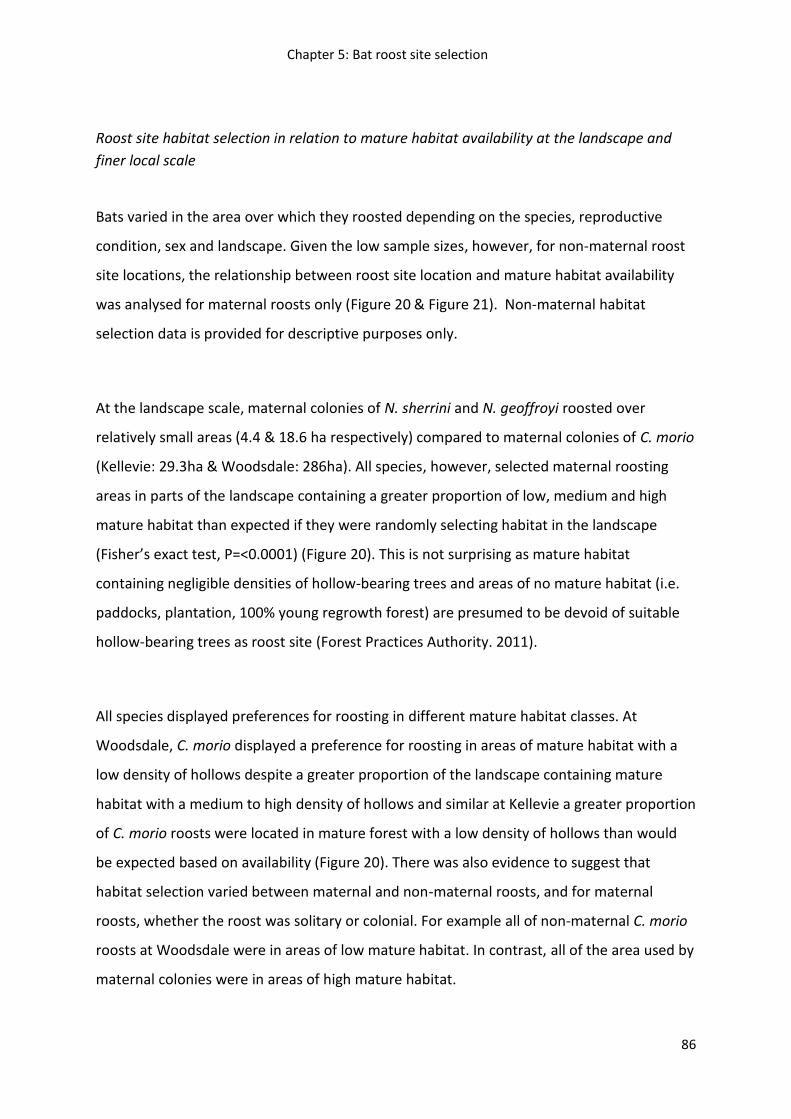
Chapter 5: Bat roost site selection
86
Roost site habitat selection in relation to mature habitat availability at the landscape and
finer local scale
Bats varied in the area over which they roosted depending on the species, reproductive
condition, sex and landscape. Given the low sample sizes, however, for non-maternal roost
site locations, the relationship between roost site location and mature habitat availability
was analysed for maternal roosts only (Figure 20 & Figure 21). Non-maternal habitat
selection data is provided for descriptive purposes only.
At the landscape scale, maternal colonies of N. sherrini and N. geoffroyi roosted over
relatively small areas (4.4 & 18.6 ha respectively) compared to maternal colonies of C. morio
(Kellevie: 29.3ha & Woodsdale: 286ha). All species, however, selected maternal roosting
areas in parts of the landscape containing a greater proportion of low, medium and high
mature habitat than expected if they were randomly selecting habitat in the landscape
(Fisher’s exact test, P=<0.0001) (Figure 20). This is not surprising as mature habitat
containing negligible densities of hollow-bearing trees and areas of no mature habitat (i.e.
paddocks, plantation, 100% young regrowth forest) are presumed to be devoid of suitable
hollow-bearing trees as roost site (Forest Practices Authority. 2011).
All species displayed preferences for roosting in different mature habitat classes. At
Woodsdale, C. morio displayed a preference for roosting in areas of mature habitat with a
low density of hollows despite a greater proportion of the landscape containing mature
habitat with a medium to high density of hollows and similar at Kellevie a greater proportion
of C. morio roosts were located in mature forest with a low density of hollows than would
be expected based on availability (Figure 20). There was also evidence to suggest that
habitat selection varied between maternal and non-maternal roosts, and for maternal
roosts, whether the roost was solitary or colonial. For example all of non-maternal C. morio
roosts at Woodsdale were in areas of low mature habitat. In contrast, all of the area used by
maternal colonies were in areas of high mature habitat.
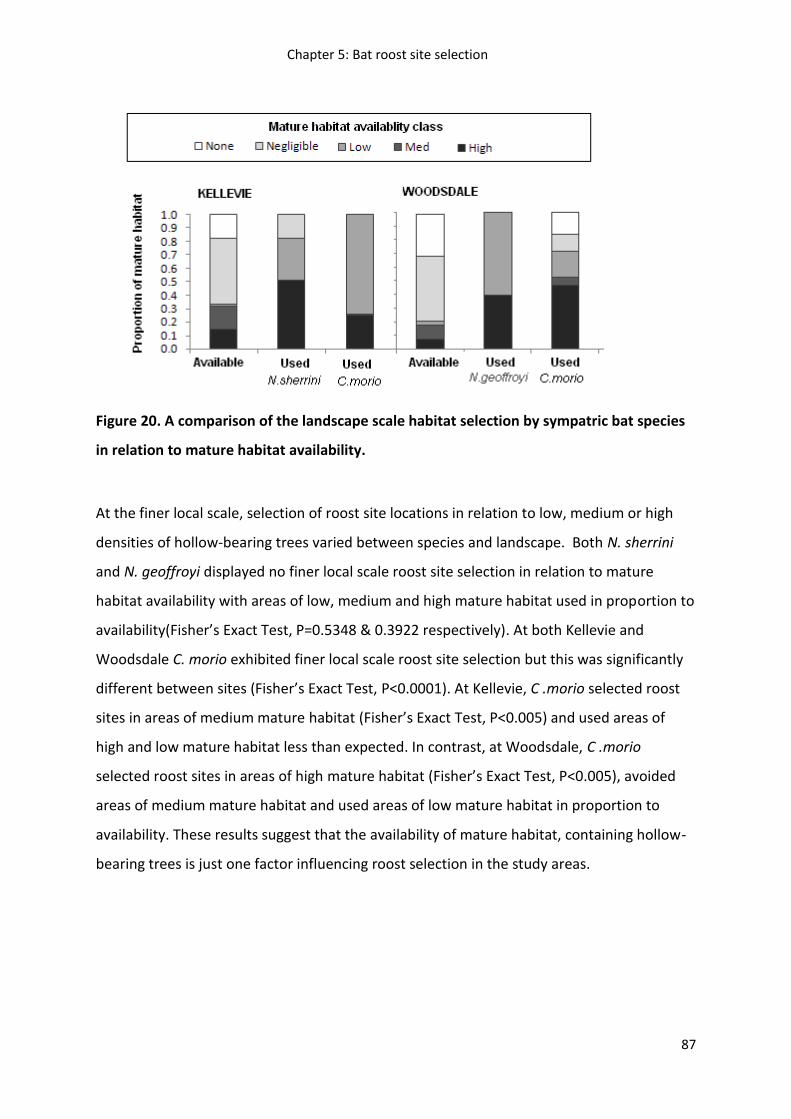
Chapter 5: Bat roost site selection
87
Figure 20. A comparison of the landscape scale habitat selection by sympatric bat species
in relation to mature habitat availability.
At the finer local scale, selection of roost site locations in relation to low, medium or high
densities of hollow-bearing trees varied between species and landscape. Both N. sherrini
and N. geoffroyi displayed no finer local scale roost site selection in relation to mature
habitat availability with areas of low, medium and high mature habitat used in proportion to
availability(Fisher’s Exact Test, P=0.5348 & 0.3922 respectively). At both Kellevie and
Woodsdale C. morio exhibited finer local scale roost site selection but this was significantly
different between sites (Fisher’s Exact Test, P<0.0001). At Kellevie, C .morio selected roost
sites in areas of medium mature habitat (Fisher’s Exact Test, P<0.005) and used areas of
high and low mature habitat less than expected. In contrast, at Woodsdale, C .morio
selected roost sites in areas of high mature habitat (Fisher’s Exact Test, P<0.005), avoided
areas of medium mature habitat and used areas of low mature habitat in proportion to
availability. These results suggest that the availability of mature habitat, containing hollow-
bearing trees is just one factor influencing roost selection in the study areas.
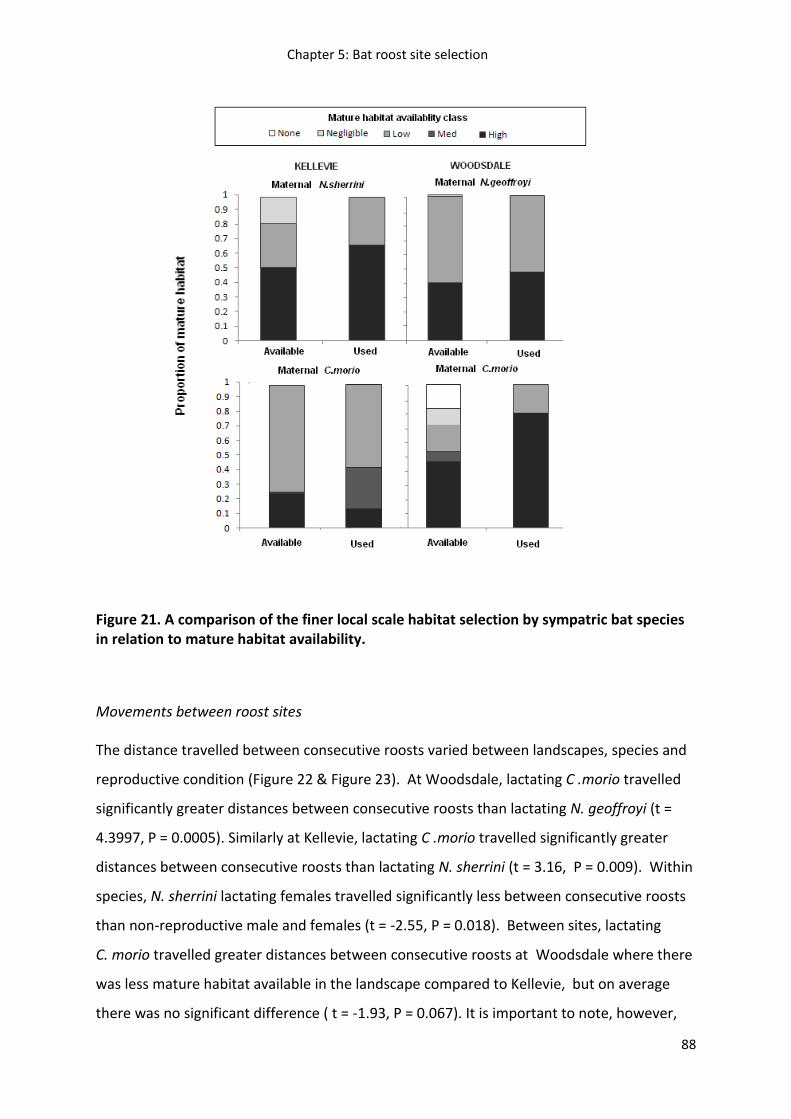
Chapter 5: Bat roost site selection
88
Figure 21. A comparison of the finer local scale habitat selection by sympatric bat species in relation to mature habitat availability.
Movements between roost sites
The distance travelled between consecutive roosts varied between landscapes, species and
reproductive condition (Figure 22 & Figure 23). At Woodsdale, lactating C .morio travelled
significantly greater distances between consecutive roosts than lactating N. geoffroyi (t =
4.3997, P = 0.0005). Similarly at Kellevie, lactating C .morio travelled significantly greater
distances between consecutive roosts than lactating N. sherrini (t = 3.16, P = 0.009). Within
species, N. sherrini lactating females travelled significantly less between consecutive roosts
than non-reproductive male and females (t = -2.55, P = 0.018). Between sites, lactating
C. morio travelled greater distances between consecutive roosts at Woodsdale where there
was less mature habitat available in the landscape compared to Kellevie, but on average
there was no significant difference ( t = -1.93, P = 0.067). It is important to note, however,
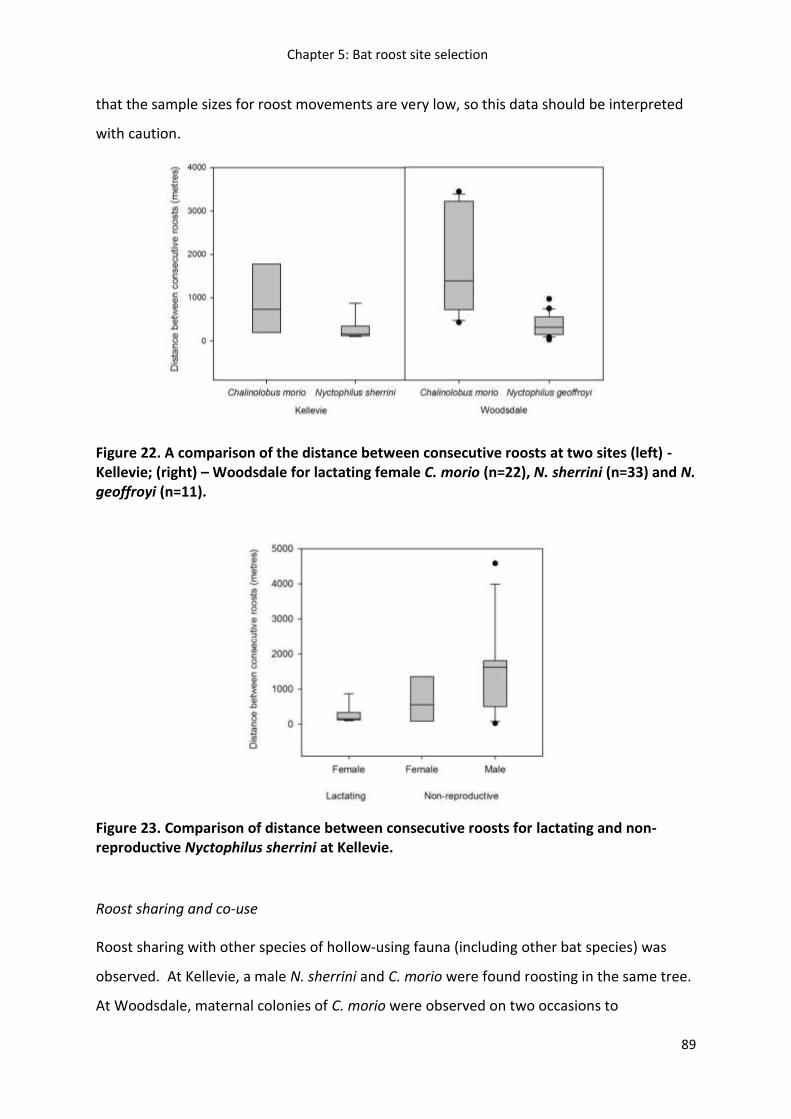
Chapter 5: Bat roost site selection
89
that the sample sizes for roost movements are very low, so this data should be interpreted
with caution.
Figure 22. A comparison of the distance between consecutive roosts at two sites (left) - Kellevie; (right) – Woodsdale for lactating female C. morio (n=22), N. sherrini (n=33) and N. geoffroyi (n=11).
Figure 23. Comparison of distance between consecutive roosts for lactating and non-reproductive Nyctophilus sherrini at Kellevie.
Roost sharing and co-use
Roost sharing with other species of hollow-using fauna (including other bat species) was
observed. At Kellevie, a male N. sherrini and C. morio were found roosting in the same tree.
At Woodsdale, maternal colonies of C. morio were observed on two occasions to
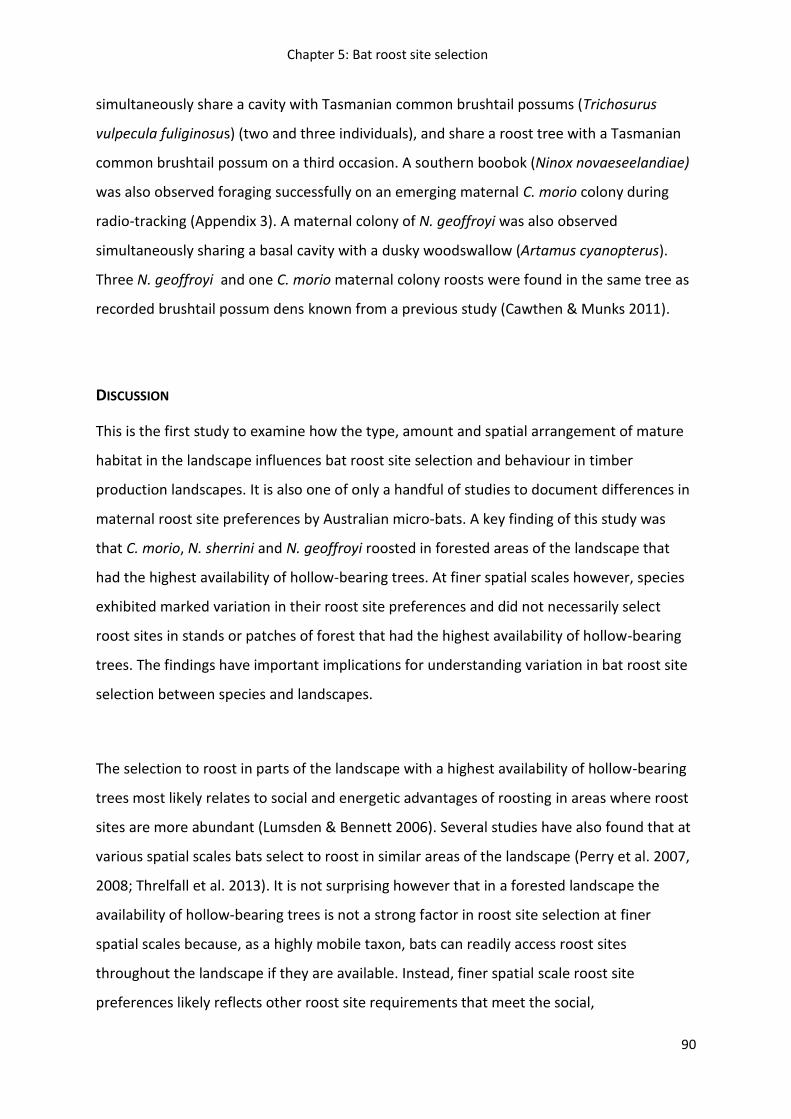
Chapter 5: Bat roost site selection
90
simultaneously share a cavity with Tasmanian common brushtail possums (Trichosurus
vulpecula fuliginosus) (two and three individuals), and share a roost tree with a Tasmanian
common brushtail possum on a third occasion. A southern boobok (Ninox novaeseelandiae)
was also observed foraging successfully on an emerging maternal C. morio colony during
radio-tracking (Appendix 3). A maternal colony of N. geoffroyi was also observed
simultaneously sharing a basal cavity with a dusky woodswallow (Artamus cyanopterus).
Three N. geoffroyi and one C. morio maternal colony roosts were found in the same tree as
recorded brushtail possum dens known from a previous study (Cawthen & Munks 2011).
DISCUSSION
This is the first study to examine how the type, amount and spatial arrangement of mature
habitat in the landscape influences bat roost site selection and behaviour in timber
production landscapes. It is also one of only a handful of studies to document differences in
maternal roost site preferences by Australian micro-bats. A key finding of this study was
that C. morio, N. sherrini and N. geoffroyi roosted in forested areas of the landscape that
had the highest availability of hollow-bearing trees. At finer spatial scales however, species
exhibited marked variation in their roost site preferences and did not necessarily select
roost sites in stands or patches of forest that had the highest availability of hollow-bearing
trees. The findings have important implications for understanding variation in bat roost site
selection between species and landscapes.
The selection to roost in parts of the landscape with a highest availability of hollow-bearing
trees most likely relates to social and energetic advantages of roosting in areas where roost
sites are more abundant (Lumsden & Bennett 2006). Several studies have also found that at
various spatial scales bats select to roost in similar areas of the landscape (Perry et al. 2007,
2008; Threlfall et al. 2013). It is not surprising however that in a forested landscape the
availability of hollow-bearing trees is not a strong factor in roost site selection at finer
spatial scales because, as a highly mobile taxon, bats can readily access roost sites
throughout the landscape if they are available. Instead, finer spatial scale roost site
preferences likely reflects other roost site requirements that meet the social,
Chapter 5: Bat roost site selection
91
thermoregulatory and energetic needs of bats, and levels of competition and predation risk
(Lumsden & Bennett 2006).
At the finer spatial scales bats roosted in the cavities of Eucalypt trees with signs of
senescence (i.e. dead branch in crown) and burn damage. These findings are consistent
with the attributes of bat roost sites in hollow-bearing trees throughout Australia (Goldingay
2009). Inter-specific variation in bat roost site selection was however evident. Notably that
the particular type of cavity used by bats varied between species. N. geoffroyi showed a
preference for basal cavities with burn damage whereas N. sherrini and C. morio preferred
trunk and branch cavities. Previous work has shown that N. geoffroyi frequently breeds
under the bark of dead trees (Lumsden & Bennett 2006), therefore the lack of dead trees
with exfoliating bark in the landscape (Cawthen pers comm) could explain the use of basal
cavities for breeding in this study. Basal cavities with burn damage may share similar
thermoregulatory advances as exfoliating bark on dead trees for bat roost sites. Maternal
colonies all exhibited a preference for roosting in large hollows (entrance size >10 cm)
rather than the small hollows (entrance<2cm) which were used more often by solitary
individuals. Maternal colonies are likely to select large hollows because they accommodate
more bats (Goldingay 2009). Larger colony sizes are likely to provide either a social,
physiological or ecological advantage over roosting in small groups or individually. Bats also
exhibited marked inter-specific variation at the patch, stand and landscape scale in other
roost site attributes. These included tree size (dbh), the density of stems surrounding the
tree (forest structure), patch size, stand height, the number of visible hollows nearby and
the amount of disturbance surrounding roosts. Differences in roost site attributes between
species and roost types(Carter & Feldhamer 2005; Carver & Ashley 2008; Lumsden et al.
2002a; Sedgeley 2003; Webala et al. 2010) demonstrate that bats have species-specific
habitat requirements that can vary depending on whether they are breeding or non-
breeding.
The importance of particular bat roost site attributes to a particular species cannot be fully
understood without comparing roost site preferences across landscapes. Few studies
however have done this (Law & Anderson 2000). Such studies are important because they
Chapter 5: Bat roost site selection
92
provide insight into those roost site attributes that are flexible (i.e. vary and are less
important) and those that are specific (i.e. consistent and more important) (Lumsden &
Bennett 2006).In this current study it was not possible to do this for all species. For maternal
colonies of C. morio however it was evident that these bats exhibited a strong preference
for roost sites in large patches of undisturbed mature forest (>287ha in size) despite an
availability of smaller patches containing large hollows that were used by other bat species
and the common brushtail possum (Trichosurus vulpecula) (Cawthen & Munks 2011).
Attributes such as tree size (dbh), hollow abundance in the patch and the distance of the
roost to regrowth forest and cleared areas were considered to be flexible roost site
attributes because these varied between landscapes.
Understanding the specific and flexible roost site requirements of bats can help explain why
in a particular landscape, bats did not use retained forest patches. For example, in a
landscape (‘Kellevie’) where the extent of mature forest was greater and directly
surrounding the harvested area (60% of the landscape containing low to high mature
habitat density within 1km), maternal colonies and non-reproductive individuals of C. morio
and N. sherrini roosted in large patches of mature forest (>360ha in size). Individual trees,
small patches and a large strip of mature forest retained in the harvested area were not
used as roost sites. In a landscape (‘Woodsdale’) where the extent of mature forest was less
and little mature forest was retained directly surrounding the harvested area (20% of the
landscape containing low to high mature habitat density within 1km) maternal colonies of C.
morio roosted in the broader landscape in a nearby large patch of mature forest, whereas
non-reproductive and lactating individuals of C. morio and maternal colonies of N. geoffroyi
roosted in patches retained in the harvested area in form of individual trees, small patches
and narrow and large strips.
In Australia’s Eucalyptus forest and woodlands, bats generally show a preference for
roosting in large patches of mature forest and, not surprisingly, avoiding regrowth and
young forest where no mature forest elements have been retained (Lunney et al. 1985;
Lunney et al. 1988; Taylor & Savva 1988). In harvested areas where mature forest habitat
has been retained however, bats have been found to use individual trees and narrow strips
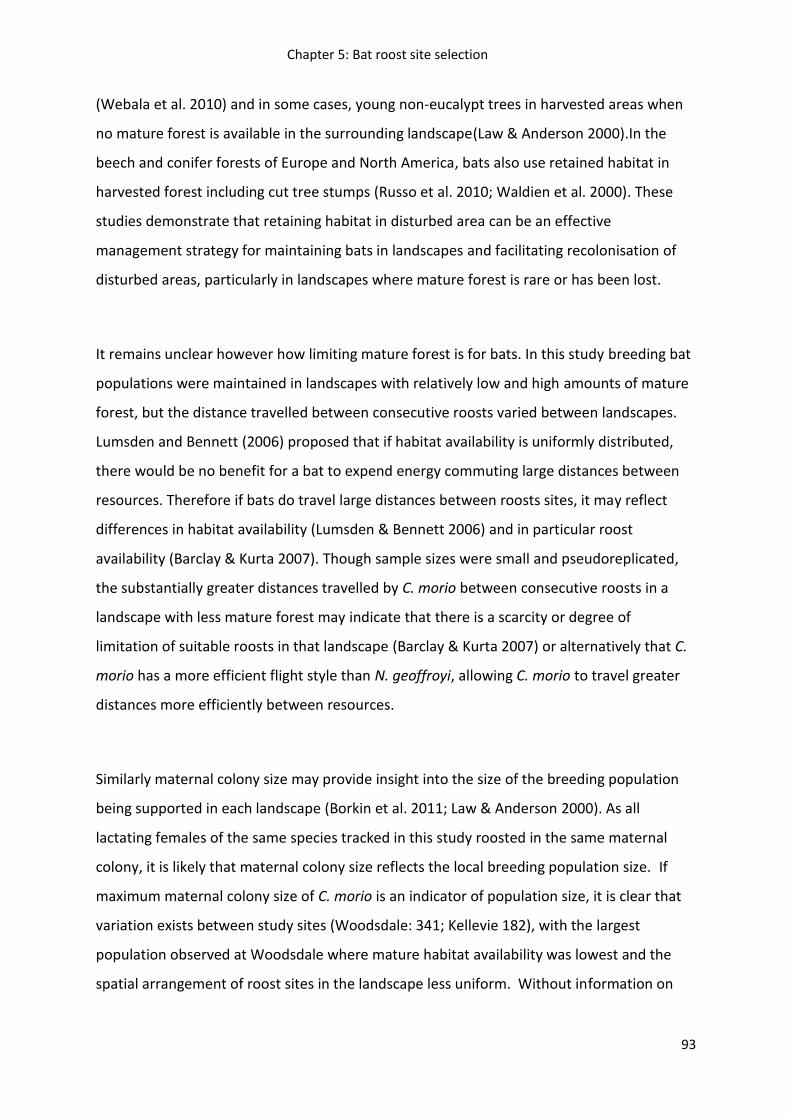
Chapter 5: Bat roost site selection
93
(Webala et al. 2010) and in some cases, young non-eucalypt trees in harvested areas when
no mature forest is available in the surrounding landscape(Law & Anderson 2000).In the
beech and conifer forests of Europe and North America, bats also use retained habitat in
harvested forest including cut tree stumps (Russo et al. 2010; Waldien et al. 2000). These
studies demonstrate that retaining habitat in disturbed area can be an effective
management strategy for maintaining bats in landscapes and facilitating recolonisation of
disturbed areas, particularly in landscapes where mature forest is rare or has been lost.
It remains unclear however how limiting mature forest is for bats. In this study breeding bat
populations were maintained in landscapes with relatively low and high amounts of mature
forest, but the distance travelled between consecutive roosts varied between landscapes.
Lumsden and Bennett (2006) proposed that if habitat availability is uniformly distributed,
there would be no benefit for a bat to expend energy commuting large distances between
resources. Therefore if bats do travel large distances between roosts sites, it may reflect
differences in habitat availability (Lumsden & Bennett 2006) and in particular roost
availability (Barclay & Kurta 2007). Though sample sizes were small and pseudoreplicated,
the substantially greater distances travelled by C. morio between consecutive roosts in a
landscape with less mature forest may indicate that there is a scarcity or degree of
limitation of suitable roosts in that landscape (Barclay & Kurta 2007) or alternatively that C.
morio has a more efficient flight style than N. geoffroyi, allowing C. morio to travel greater
distances more efficiently between resources.
Similarly maternal colony size may provide insight into the size of the breeding population
being supported in each landscape (Borkin et al. 2011; Law & Anderson 2000). As all
lactating females of the same species tracked in this study roosted in the same maternal
colony, it is likely that maternal colony size reflects the local breeding population size. If
maximum maternal colony size of C. morio is an indicator of population size, it is clear that
variation exists between study sites (Woodsdale: 341; Kellevie 182), with the largest
population observed at Woodsdale where mature habitat availability was lowest and the
spatial arrangement of roost sites in the landscape less uniform. Without information on
Chapter 5: Bat roost site selection
94
population sizes prior to declines in mature habitat availability in each landscape it is
impossible to determine what factors are influencing bat colonies.
MANAGEMENT IMPLICATIONS
This study has important implications for understanding the effectiveness of different
approaches for managing mature forest habitat for bats. These findings suggest that the
degree to which bats use different retained forest patches for roosting varies depending on
the type, amount and spatial configuration of mature forest in the surrounding landscape. It
is becoming well recognised by forest managers that understanding habitat use patterns at
finer spatial scales cannot be fully understand without considering the landscape (Mazerolle
& Villard 1999). Studies that have compared bat roost site selection between sites have
demonstrated similar results to this study (Kroll et al. 2012a; Law & Anderson 2000; Miles et
al. 2006; Waldien et al. 2000). The management of bats and their habitat requires an
understanding of the variation in habitat requirements of sympatric species in any given
region and how this varies spatially and temporally. As demonstrated by this study, while
bats can have specific habitat requirements (e.g. hollow-bearing trees as roost sites),
requirements can also be flexible and vary throughout a region depending on the attributes
of the habitat that is available (e.g. tree diameter). Furthermore, habitat requirements can
vary between individuals within a population and during different times of year (e.g. Law &
Anderson 2000).
The findings of this study indicate that a ‘one-size-fits-all’ approach to managing a landscape
for hollow-using bats is likely to be inappropriate (Perry et al. 2008) and that the retention
of a mosaic of mature forest patches throughout timber production forest is needed to
meet the spatial and temporal habitat requirements of bats. Large patches of mature forest
containing a high availability of hollow-bearing trees should, however, be a priority when
retaining habitat for bats to ensure breeding habitat is retained in the landscape. Other
retention measures such as small and large strips and patches are also important,
particularly in landscapes where mature forest is limited, because they facilitate
recolonisation of forested areas regenerating after harvest. Importantly forest managers
should consider the type, amount and spatial arrangement of existing mature forest in the

Chapter 5: Bat roost site selection
95
landscape when deciding on the type, amount and spatial configuration of mature forest to
retain in a harvested area in order to provide bats and other fauna with sufficient habitat in
the long-term.
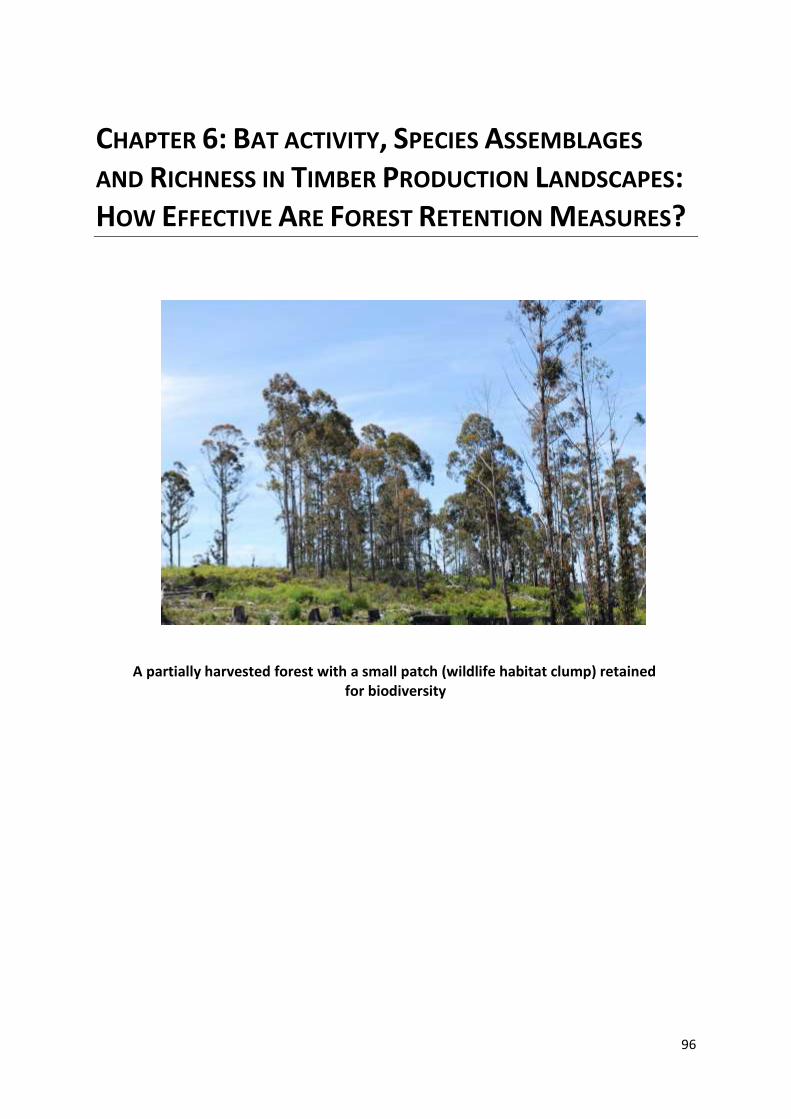
96
CHAPTER 6: BAT ACTIVITY, SPECIES ASSEMBLAGES
AND RICHNESS IN TIMBER PRODUCTION LANDSCAPES: HOW EFFECTIVE ARE FOREST RETENTION MEASURES?
A partially harvested forest with a small patch (wildlife habitat clump) retained for biodiversity
Chapter 6: Bat activity and species composition
97
INTRODUCTION
Forest management for biodiversity conservation is crucial as forests support a high
proportion of the world’s known terrestrial biodiversity (World Commission on Forests and
Sustainable Development 1999). Protected areas alone will not necessarily conserve this
biodiversity because much of the world’s forests are unprotected, important habitat for
many species occurs outside of protected areas and because these areas are not necessarily
managed for their biodiversity benefits or will they necessarily be protected indefinitely
(FAO 2010; Lindenmayer et al. 2012; Mascia & Pailler 2011; Munks et al. 2009). Many forest
managers recognise this and incorporate measures for the conservation of biodiversity into
off-reserve forest management strategies (Munks et al. 2009; Polasky et al. 2005; Sergio &
Pedrini 2007). In many cases however, there is little information on the habitat
requirements of species to inform the development of such forest management strategies.
As a consequence, these strategies are often based on accepted sustainable forest
management principles developed using ecological theory (Lindenmayer et al. 2006; Schulte
et al. 2006).
One approach is to manage biodiversity in multi-use landscapes that are not designated
primarily for conservation (the matrix) by maintaining habitat across a range of spatial scales
and configurations ranging from the individual tree to large reserve. This approach, known
as multi-spatial scale approach to forest management is based on the principles of: the
maintenance of connectivity across a landscape; the maintenance of landscape
heterogeneity; the maintenance of structure complexity and plant species diversity within
managed stands; and the maintenance of integrity of aquatic ecosystems (Lindenmayer &
Franklin 2002). The multi-spatial scale approach is considered an effective strategy for
managing habitat for fauna because it has the greatest probability of: meeting the diverse
habitat requirements of species; facilitating dispersal through the landscape; and enhancing
recolonisation of disturbed areas (Whitford & Stone 2004). It is also a risk-spreading
approach that is essential in the instance that any single strategy is found to be ineffective
(Lindenmayer & Franklin 2002).
Chapter 6: Bat activity and species composition
98
A key component of the multi-spatial scale approach is to collect new data to fill gaps in
existing knowledge and to use this information through adaptive management to facilitate
the continual improvement of strategies (Lindenmayer & Franklin 2002). Effectiveness
monitoring of strategies is an essential part of adaptive management and a fundamental
part of ecological sustainable forestry and the ‘social license to operate‘ that is increasingly
required by forest certification schemes(Forest Stewardship Council. 1996; Lindenmayer &
Franklin 2002). While many studies have examined the effectiveness of a particular forest
management strategy for a species or fauna group (e.g. riparian strips: Lloyd et al. 2006),
there has been little research into the effectiveness of the multi-spatial scale approach to
forest management in a particular matrix (Munks et al. 2004).
Another challenge for forest managers is that in many regions the value of the matrix to
biodiversity is changing with increases in the conversion of mature and older-aged regrowth
forest to young regrowth or plantation (FAO 2010). This is of particular concern for fauna
species dependent on mature forest elements, such as hollow-bearing trees, because it
takes a considerable amount of time for such elements to form in young regrowth forest –
at least 100 years (Koch et al. 2008a; Whitford 2002). If insufficient amounts, spatial scales
and configurations of mature forest are retained in a landscape (matrix and designated
protected areas), it could have severe ramifications for biodiversity. Recognising this, a key
question being asked by forest managers is what amount and spatial configuration of
mature forest is needed to be retained in the landscape to maintain biodiversity? (Munks et
al. 2009; Parnaby et al. 2012; Whitford & Stone 2004).
With so many species potentially influenced by ineffective forest management strategies it
is an almost impossible task to determine the effectiveness of forest management strategies
for all species (Koch et al. 2012). One fauna group that may provide useful insights into the
effectiveness of forest management strategies is insectivorous bats. Insectivorous bats
depend on forests for commuting, foraging and socializing habitat (Lacki et al. 2007) and
many species depend on hollow-bearing trees for roost and breeding sites (Kroll et al.
Chapter 6: Bat activity and species composition
99
2012b). As they are highly mobile, they are likely to respond to changes at the broader
landscape scale, such as the availability of hollow-bearing trees (Lucan et al. 2009; Webala
et al. 2010; Zahn 1999). They are also likely to respond to changes at the finer local scale
because they are sensitive to changes in forest structure (i.e. conversion of mature forest to
regrowth or plantation) because it influences their manoeuvrability and ability to forage and
access roosts in a particular area (Jung et al. 2012).
Tasmania is home to eight resident bat species, all of which are widespread, insectivorous
and dependent on hollow-bearing trees for roost and breeding sites (Koch et al. 2008b).
Tasmania has a large forest estate, with half of Tasmania’s land mass forested and unlike
other regions of the world, a relatively large proportion of this, just under half, is protected
as part of a formal reserve system (FAO 2010; Forest Practices Authority 2012). This reserve
system is, however, biased towards the south-west region of the main island, contains both
formal and informal protected areas, is not representative for all forest communities and for
several hollow-using species (including threatened species) it does not cater for their habitat
needs (Forest Practices Authority 2012; Munks et al. 2009). Forest managers recognise this
and in the matrix outside of the formal reserve system a number of forest management
strategies are applied following the principles of the multi-spatial scaled approach to forest
management (Munks et al. 2009). These include the retention of mature forest habitat at
the landscape and stand scale in the form of large reserves, narrow and large strips,
streamside reserves, aggregates and clumps (Baker & Read 2011; Forest Practices Board
2000; Munks et al. 2009; Taylor 1991). There have been many studies investigating the
effectiveness of particular forest management strategies using a variety of measures and
‘snap shots‘ in time (Baker et al. 2009; Cawthen & Munks 2011; Cawthen et al. 2012; Koch
et al. 2009a; Law & Law 2011; Lefort & Grove 2009; MacDonald et al. 2005; Munks et al.
2004; Stephens et al. 2012a; Wapstra & Taylor 1998). However little is understood about
the effectiveness of Tasmania’s forest management strategies and the influence of the
surrounding matrix (Wardlaw et al. 2012), as well as how effectiveness varies temporally as
the ecological, physiological and social habitat requirements of bats change (Lumsden &
Bennett 2006).
Chapter 6: Bat activity and species composition
100
The overall aim of this study was to investigate whether bats use forest retention measures
developed using the multi-spatial scale approach to forest management and what factors
influence use. To do this the following questions were asked: (1) how do bats vary in their
use of different types of retained mature forest patches?; (2) what temporal, spatial and
climatic factors influence the use of different types of retained mature forest patches?; and
(3) how can the amount and configuration of retained mature forest patches most
effectively maintain bat species in Tasmania’s timber production landscapes?
METHODS
Study area and experimental design
The study was carried out in dry Eucalypt obliqua forests of eastern Tasmania, which
constitute 45% of Tasmania’s forest cover (Forest Practices Authority 2012). In this region,
twelve ‘landscapes’ were selected. These landscapes ranged from areas with little mature
forest to areas with a large amount of mature forest. Ten of these landscapes were areas
surrounding 10 partially harvested forest stands, and two were areas surrounding
unharvested forest stands. Each harvested forest stand was on average 81.5 ha in size. Each
landscape varied in the amount and type of human and natural disturbance and contained a
mix of agricultural, plantation and native timber forest stands. Details of each landscape is
provided in Table 12.
The type and amount of mature forest in each landscape was measured at two scales - 1km
from the centre of the forest stand (directly surrounding) and within 5km of the forest stand
(in the broader landscape) (Table 12; Figure 24). The amount of mature habitat for each
landscape (1km and 5km) surrounding each forest stand was estimated using a mature
habitat spatial layer (Forest Practices Authority. 2011). This spatial layer was developed
using aerial photographs to remotely allocate mature habitat availability to one of five
classes and also provides a measure for the relative abundance of hollow-bearing trees in
the landscape (Forest Practices Authority. 2011; Koch & Baker 2011): None - cleared areas
and water bodies; Negligible - non-forest, plantation or regrowth forest with no mature
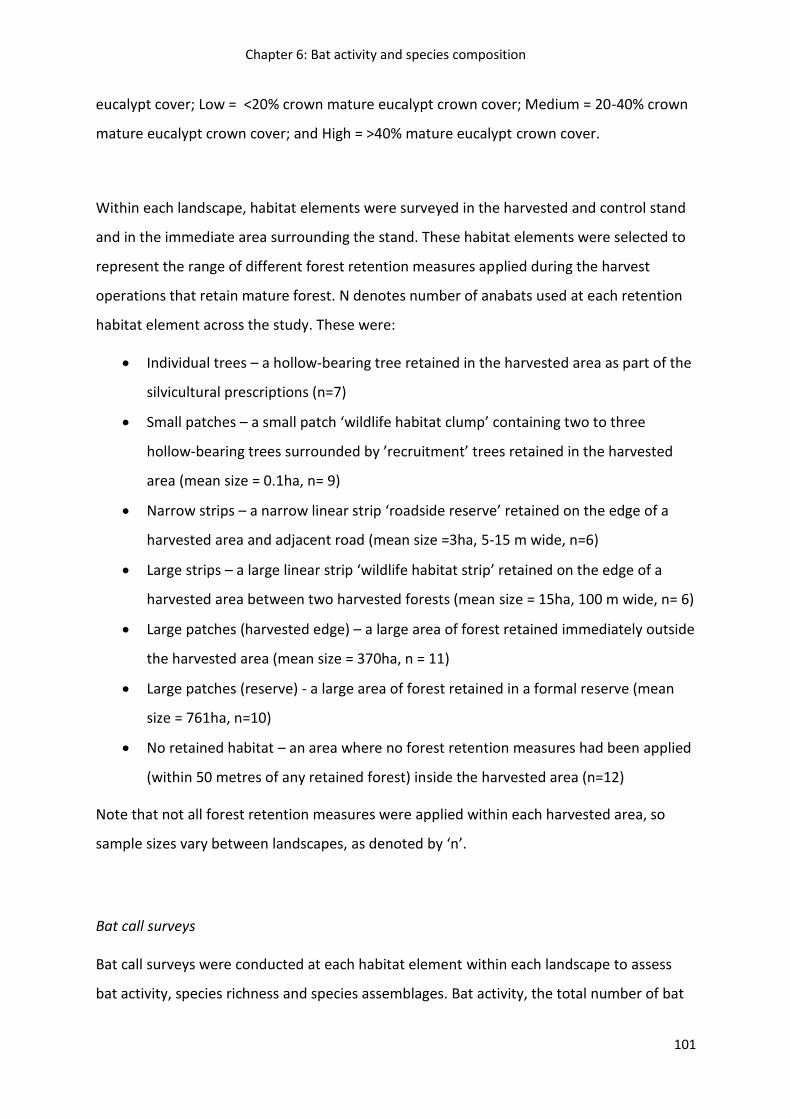
Chapter 6: Bat activity and species composition
101
eucalypt cover; Low = <20% crown mature eucalypt crown cover; Medium = 20-40% crown
mature eucalypt crown cover; and High = >40% mature eucalypt crown cover.
Within each landscape, habitat elements were surveyed in the harvested and control stand
and in the immediate area surrounding the stand. These habitat elements were selected to
represent the range of different forest retention measures applied during the harvest
operations that retain mature forest. N denotes number of anabats used at each retention
habitat element across the study. These were:
Individual trees – a hollow-bearing tree retained in the harvested area as part of the
silvicultural prescriptions (n=7)
Small patches – a small patch ‘wildlife habitat clump’ containing two to three
hollow-bearing trees surrounded by ’recruitment’ trees retained in the harvested
area (mean size = 0.1ha, n= 9)
Narrow strips – a narrow linear strip ‘roadside reserve’ retained on the edge of a
harvested area and adjacent road (mean size =3ha, 5-15 m wide, n=6)
Large strips – a large linear strip ‘wildlife habitat strip’ retained on the edge of a
harvested area between two harvested forests (mean size = 15ha, 100 m wide, n= 6)
Large patches (harvested edge) – a large area of forest retained immediately outside
the harvested area (mean size = 370ha, n = 11)
Large patches (reserve) - a large area of forest retained in a formal reserve (mean
size = 761ha, n=10)
No retained habitat – an area where no forest retention measures had been applied
(within 50 metres of any retained forest) inside the harvested area (n=12)
Note that not all forest retention measures were applied within each harvested area, so
sample sizes vary between landscapes, as denoted by ‘n’.
Bat call surveys
Bat call surveys were conducted at each habitat element within each landscape to assess
bat activity, species richness and species assemblages. Bat activity, the total number of bat
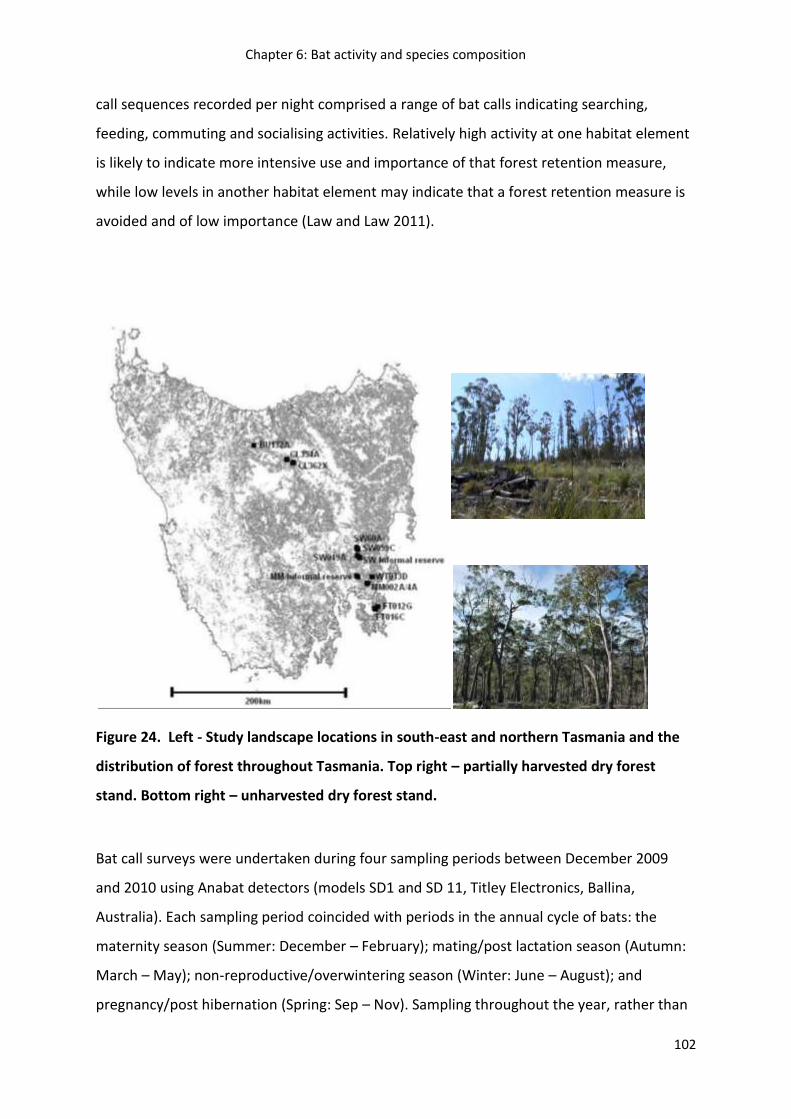
Chapter 6: Bat activity and species composition
102
call sequences recorded per night comprised a range of bat calls indicating searching,
feeding, commuting and socialising activities. Relatively high activity at one habitat element
is likely to indicate more intensive use and importance of that forest retention measure,
while low levels in another habitat element may indicate that a forest retention measure is
avoided and of low importance (Law and Law 2011).
Figure 24. Left - Study landscape locations in south-east and northern Tasmania and the
distribution of forest throughout Tasmania. Top right – partially harvested dry forest
stand. Bottom right – unharvested dry forest stand.
Bat call surveys were undertaken during four sampling periods between December 2009
and 2010 using Anabat detectors (models SD1 and SD 11, Titley Electronics, Ballina,
Australia). Each sampling period coincided with periods in the annual cycle of bats: the
maternity season (Summer: December – February); mating/post lactation season (Autumn:
March – May); non-reproductive/overwintering season (Winter: June – August); and
pregnancy/post hibernation (Spring: Sep – Nov). Sampling throughout the year, rather than
Chapter 6: Bat activity and species composition
103
during periods of known heightened bat activity (i.e. the maternity season) provided data on
whether the importance of habitat elements to bats varied temporally. Each landscape was
sampled for between five and 12 days per sampling period. Variation in the number of
samples per landscape per sampling period was a result of poor weather conditions
hampering access to sites or when batteries failed prematurely.
At each habitat element, Anabat detectors were set in waterproof PVC boxes. A
microphone extension cable ran from the PVC box up a 1.5 metre stake to the microphone
attachment. The microphone attachment was angled up at 45⁰ pointed into vegetation gaps
of the habitat element being surveyed and enclosed in a PVC elbow for weatherproofing.
Detectors were calibrated against each other using a bat chirp board (Nevada Bat
Technology, Las Vegas, USA) to ensure microphone sensitivity was equal across detectors.
Most studies record only for the night (Hanspach et al. 2012)but bats can be observed flying
during the day when disturbed from roosts (Webala et al. 2010) so bat call surveys were
conducted over a 24-hour period.
Once files containing bat call sequences were downloaded, calls recorded on days where
detectors failed (drained batteries) were excluded. Although it is common to also exclude or
avoid sampling on nights based on poor weather conditions (Hanspach et al. 2012; Threlfall
et al. 2011) because of the correlation between bat activity and temperature (De Oliveira et
al. 1999), this was not done in this study. Instead, environmental variables of daily rainfall
and minimum and maximum temperature from nearby weather stations were incorporated
into the analysis.
Bat call identification
Bat activity was assessed at two scales - the community (overall bat activity) and the
individual/group (species/species complex). Bat call sequences were identified by the
program AnaScheme using a pre-defined Tasmanian bat call key as described in Chapter 2.
AnaScheme automatically calculated the total number of bat call sequences recorded per 24
Chapter 6: Bat activity and species composition
104
hour period (overall bat activity) and identified bat call sequences to species or species
complexes (individual/group bat activity). Not all species could be accurately identified (e.g.
Nyctophilus sherrini) so they were identified to a species complex (e.g. Nyctophilus spp.).
This was also the case for Chalinolobus morio and Vespadelus vulturnus and a sub-set of the
calls from Vespadelus darlingtoni and Vespadelus regulus, and V. vulturnus and V. regulus.
Species that were considered especially problematic to identify were double-checked by
manual identification of sonograms (e.g. Nyctophilus spp. whose calls can be misidentified
as feeding calls of other species).
The following options were set within AnaScheme. Identifications were only made when a
minimum of 50% of bat calls within a sequence were identified to the same species/species
complex and only sequences with a minimum of three calls were identified to a
species/species complex. If neither of these specifications were met, the sequence was
identified as an unknown. Species richness was estimated by calculating the number of
species whereas bat taxa richness calculated the number of species and species complexes.
Based on the above call analysis, four responses at each habitat element for each night were
surveyed: (1) overall bat activity, the number of files containing sequences irrespective of
identification (including unknowns); (2) species/species complex activity, the number of
sequences identified to a specific species/species complex (excluding unknowns), (3) species
richness, the number of species identified (excluding unknowns) and (4) species/species
complex richness, the number of species/species complexes identified (excluding
unknowns).
Habitat variables
A total of 22 variables describing spatial, temporal and climatic factors were measured
(Table 11). Seven variables measured the composition of the landscape surrounding each
habitat elements (the matrix) at a range of scales. The scales used were 500m, 1km, 3km
and 5km radii. These variables were chosen because they can be readily assessed by forest
managers when determining the type and amount of forest retention measures that should

Chapter 6: Bat activity and species composition
105
be applied in a given area and because 5 km reflects the maximum distances Tasmanian
bats are known to travel between foraging and roosting areas (Taylor & Savva 1988).
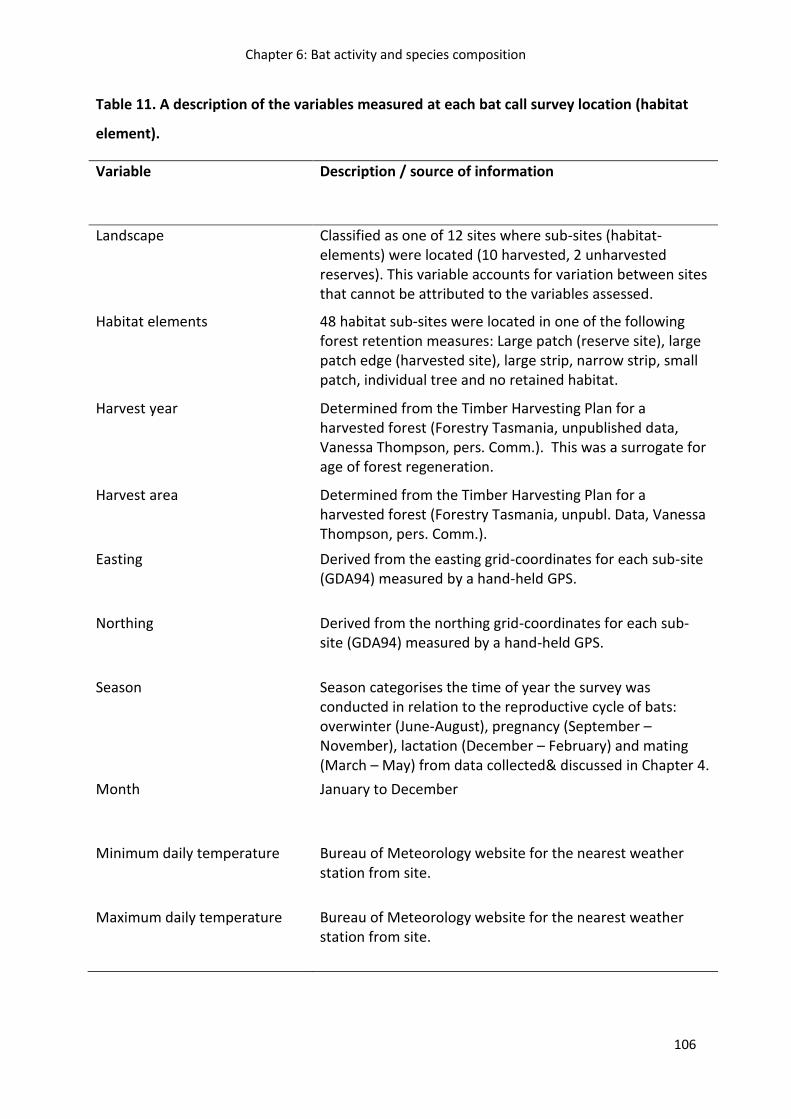
Chapter 6: Bat activity and species composition
106
Table 11. A description of the variables measured at each bat call survey location (habitat
element).
Variable Description / source of information
Landscape Classified as one of 12 sites where sub-sites (habitat-elements) were located (10 harvested, 2 unharvested reserves). This variable accounts for variation between sites that cannot be attributed to the variables assessed.
Habitat elements 48 habitat sub-sites were located in one of the following forest retention measures: Large patch (reserve site), large patch edge (harvested site), large strip, narrow strip, small patch, individual tree and no retained habitat.
Harvest year Determined from the Timber Harvesting Plan for a harvested forest (Forestry Tasmania, unpublished data, Vanessa Thompson, pers. Comm.). This was a surrogate for age of forest regeneration.
Harvest area Determined from the Timber Harvesting Plan for a harvested forest (Forestry Tasmania, unpubl. Data, Vanessa Thompson, pers. Comm.).
Easting Derived from the easting grid-coordinates for each sub-site (GDA94) measured by a hand-held GPS.
Northing Derived from the northing grid-coordinates for each sub-site (GDA94) measured by a hand-held GPS.
Season Season categorises the time of year the survey was conducted in relation to the reproductive cycle of bats: overwinter (June-August), pregnancy (September – November), lactation (December – February) and mating (March – May) from data collected& discussed in Chapter 4.
Month January to December
Minimum daily temperature Bureau of Meteorology website for the nearest weather station from site.
Maximum daily temperature Bureau of Meteorology website for the nearest weather station from site.
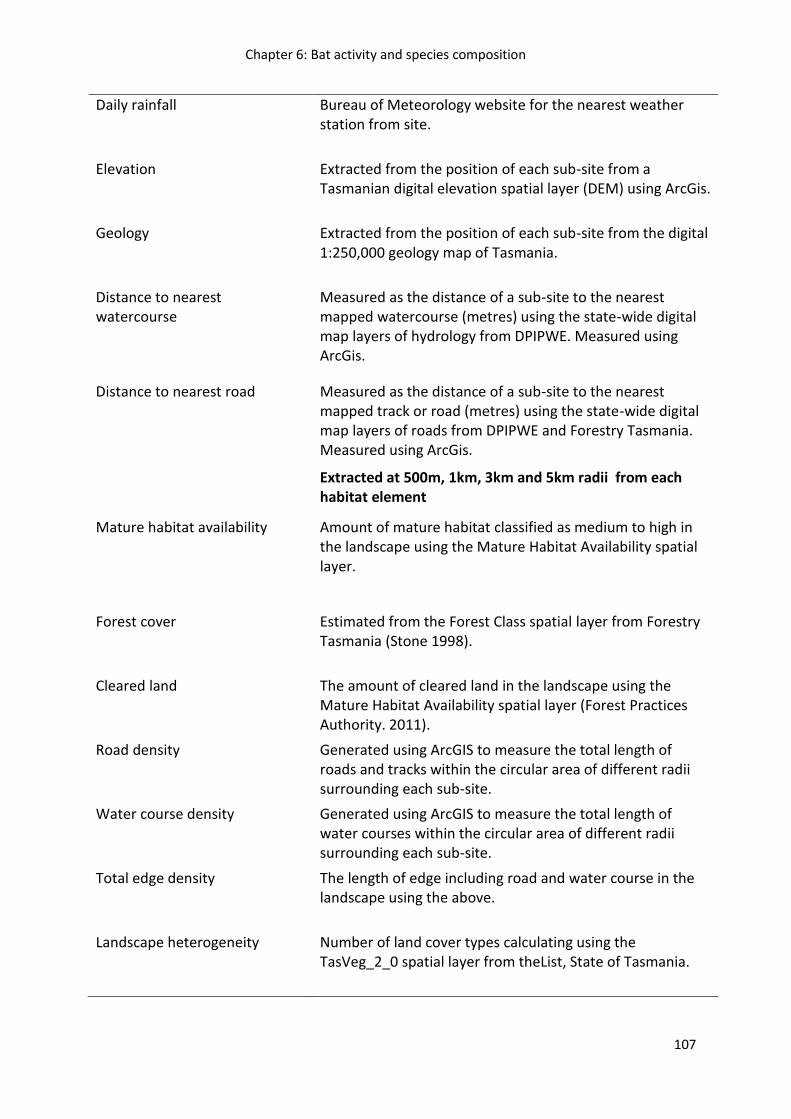
Chapter 6: Bat activity and species composition
107
Daily rainfall Bureau of Meteorology website for the nearest weather station from site.
Elevation Extracted from the position of each sub-site from a Tasmanian digital elevation spatial layer (DEM) using ArcGis.
Geology Extracted from the position of each sub-site from the digital 1:250,000 geology map of Tasmania.
Distance to nearest watercourse
Measured as the distance of a sub-site to the nearest mapped watercourse (metres) using the state-wide digital map layers of hydrology from DPIPWE. Measured using ArcGis.
Distance to nearest road Measured as the distance of a sub-site to the nearest mapped track or road (metres) using the state-wide digital map layers of roads from DPIPWE and Forestry Tasmania. Measured using ArcGis.
Extracted at 500m, 1km, 3km and 5km radii from each habitat element
Mature habitat availability Amount of mature habitat classified as medium to high in the landscape using the Mature Habitat Availability spatial layer.
Forest cover Estimated from the Forest Class spatial layer from Forestry Tasmania (Stone 1998).
Cleared land The amount of cleared land in the landscape using the Mature Habitat Availability spatial layer (Forest Practices Authority. 2011).
Road density Generated using ArcGIS to measure the total length of roads and tracks within the circular area of different radii surrounding each sub-site.
Water course density Generated using ArcGIS to measure the total length of water courses within the circular area of different radii surrounding each sub-site.
Total edge density The length of edge including road and water course in the landscape using the above.
Landscape heterogeneity Number of land cover types calculating using the TasVeg_2_0 spatial layer from theList, State of Tasmania.
Chapter 6: Bat activity and species composition
108
Statistical analysis
Temporal, spatial and environmental variables that influence bat activity and species
richness habitat elements in the different forest retention measures were assessed using a
Classification and Regression Trees (CARTs) approach (De'ath & Fabricius 2000). Regression
tree models included all variables listed in Table 11. The most appropriate regression tree
was refined via a cross validation approach using size and deviance explained by additional
branches being assessed via the cost-complexity parameter k. Bat activity and species
richness data were transformed (log(x+1) & log(x + 0.01)) transformed to improve model
performance. Analyses were carried out using the ‘tree’ package in R. To examine
correlations between climatic variables and bat activity, a spearman’s rank correlation was
used. To examine differences the use of habitat elements by different bat taxa, an ANOVA of
ranks using Dunn’s method for a pair-wise multiple comparison was performed for the most
commonly occurring bat taxa in the study. All analysis was undertaken in R (R Development
Core Team 2011).
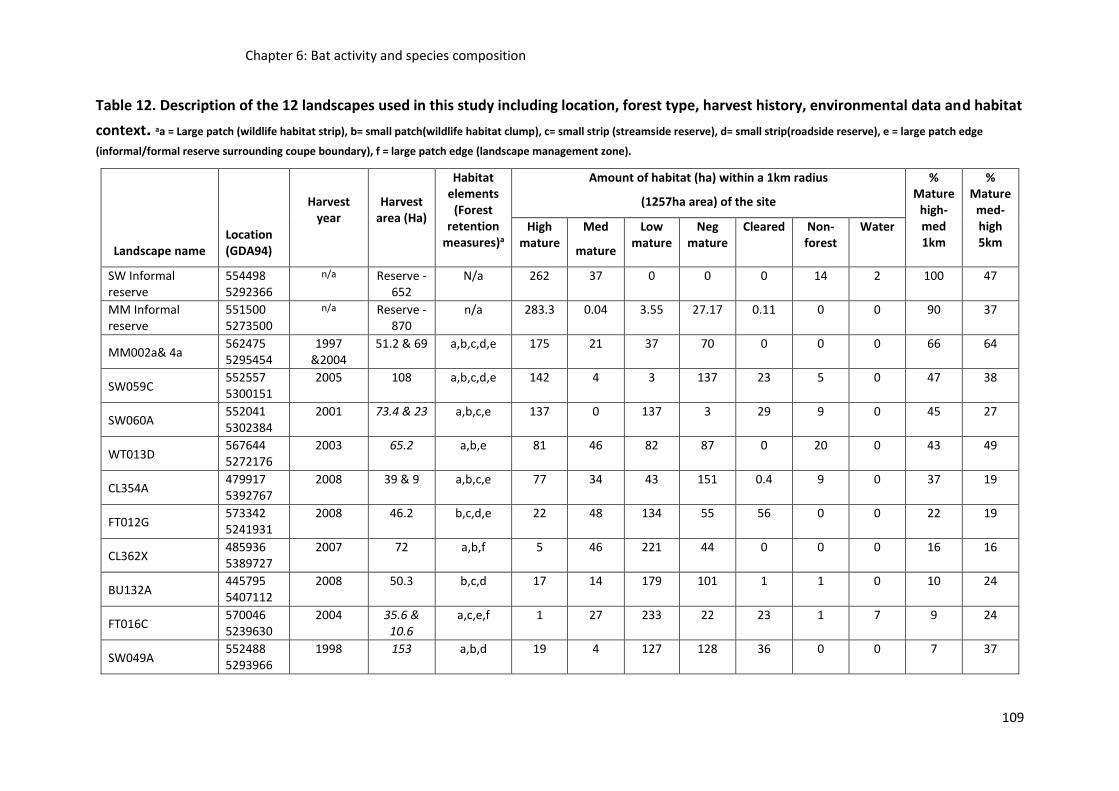
Chapter 6: Bat activity and species composition
109
Table 12. Description of the 12 landscapes used in this study including location, forest type, harvest history, environmental data and habitat
context. aa = Large patch (wildlife habitat strip), b= small patch(wildlife habitat clump), c= small strip (streamside reserve), d= small strip(roadside reserve), e = large patch edge
(informal/formal reserve surrounding coupe boundary), f = large patch edge (landscape management zone).
Landscape name Location (GDA94)
Harvest year
Harvest area (Ha)
Habitat elements
(Forest retention
measures)a
Amount of habitat (ha) within a 1km radius
(1257ha area) of the site
% Mature
high-med 1km
% Mature
med-high 5km
High mature
Med
mature
Low mature
Neg mature
Cleared Non-forest
Water
SW Informal reserve
554498 5292366
n/a Reserve -652
N/a 262 37 0 0 0 14 2 100 47
MM Informal reserve
551500 5273500
n/a Reserve - 870
n/a 283.3 0.04 3.55 27.17 0.11 0 0 90 37
MM002a& 4a 562475 5295454
1997 &2004
51.2 & 69 a,b,c,d,e 175 21 37 70 0 0 0 66 64
SW059C 552557 5300151
2005 108 a,b,c,d,e 142 4 3 137 23 5 0 47 38
SW060A 552041 5302384
2001 73.4 & 23 a,b,c,e 137 0 137 3 29 9 0 45 27
WT013D 567644 5272176
2003 65.2 a,b,e 81 46 82 87 0 20 0 43 49
CL354A 479917 5392767
2008 39 & 9 a,b,c,e 77 34 43 151 0.4 9 0 37 19
FT012G 573342 5241931
2008 46.2 b,c,d,e 22 48 134 55 56 0 0 22 19
CL362X 485936 5389727
2007 72 a,b,f 5 46 221 44 0 0 0 16 16
BU132A 445795 5407112
2008 50.3 b,c,d 17 14 179 101 1 1 0 10 24
FT016C 570046 5239630
2004 35.6 & 10.6
a,c,e,f 1 27 233 22 23 1 7 9 24
SW049A 552488 5293966
1998 153 a,b,d 19 4 127 128 36 0 0 7 37
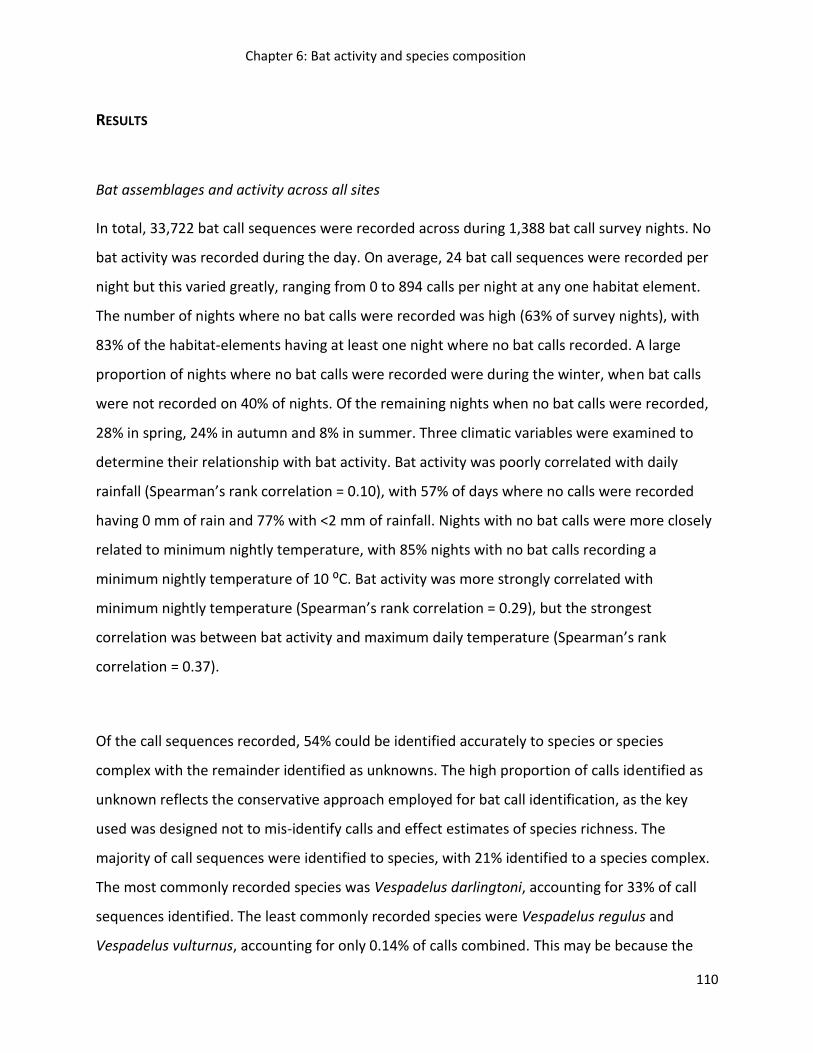
Chapter 6: Bat activity and species composition
110
RESULTS
Bat assemblages and activity across all sites
In total, 33,722 bat call sequences were recorded across during 1,388 bat call survey nights. No
bat activity was recorded during the day. On average, 24 bat call sequences were recorded per
night but this varied greatly, ranging from 0 to 894 calls per night at any one habitat element.
The number of nights where no bat calls were recorded was high (63% of survey nights), with
83% of the habitat-elements having at least one night where no bat calls recorded. A large
proportion of nights where no bat calls were recorded were during the winter, when bat calls
were not recorded on 40% of nights. Of the remaining nights when no bat calls were recorded,
28% in spring, 24% in autumn and 8% in summer. Three climatic variables were examined to
determine their relationship with bat activity. Bat activity was poorly correlated with daily
rainfall (Spearman’s rank correlation = 0.10), with 57% of days where no calls were recorded
having 0 mm of rain and 77% with <2 mm of rainfall. Nights with no bat calls were more closely
related to minimum nightly temperature, with 85% nights with no bat calls recording a
minimum nightly temperature of 10 ⁰C. Bat activity was more strongly correlated with
minimum nightly temperature (Spearman’s rank correlation = 0.29), but the strongest
correlation was between bat activity and maximum daily temperature (Spearman’s rank
correlation = 0.37).
Of the call sequences recorded, 54% could be identified accurately to species or species
complex with the remainder identified as unknowns. The high proportion of calls identified as
unknown reflects the conservative approach employed for bat call identification, as the key
used was designed not to mis-identify calls and effect estimates of species richness. The
majority of call sequences were identified to species, with 21% identified to a species complex.
The most commonly recorded species was Vespadelus darlingtoni, accounting for 33% of call
sequences identified. The least commonly recorded species were Vespadelus regulus and
Vespadelus vulturnus, accounting for only 0.14% of calls combined. This may be because the
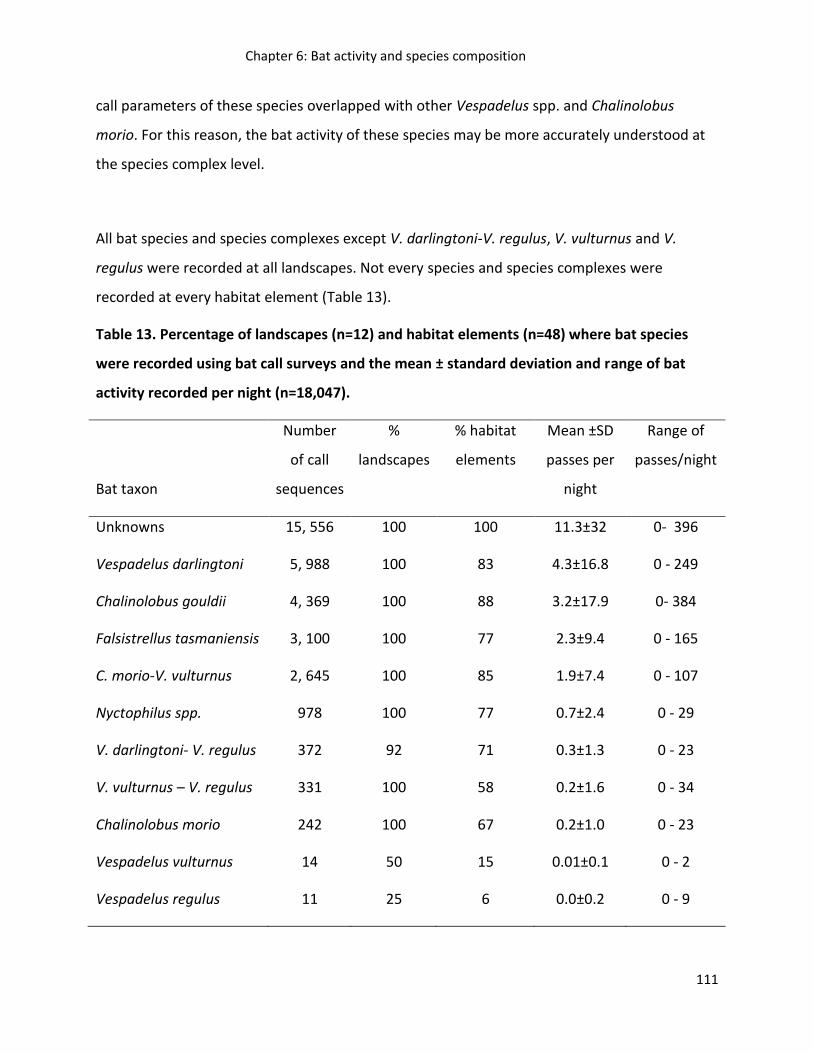
Chapter 6: Bat activity and species composition
111
call parameters of these species overlapped with other Vespadelus spp. and Chalinolobus
morio. For this reason, the bat activity of these species may be more accurately understood at
the species complex level.
All bat species and species complexes except V. darlingtoni-V. regulus, V. vulturnus and V.
regulus were recorded at all landscapes. Not every species and species complexes were
recorded at every habitat element (Table 13).
Table 13. Percentage of landscapes (n=12) and habitat elements (n=48) where bat species
were recorded using bat call surveys and the mean ± standard deviation and range of bat
activity recorded per night (n=18,047).
Bat taxon
Number
of call
sequences
%
landscapes
% habitat
elements
Mean ±SD
passes per
night
Range of
passes/night
Unknowns 15, 556 100 100 11.3±32 0- 396
Vespadelus darlingtoni 5, 988 100 83 4.3±16.8 0 - 249
Chalinolobus gouldii 4, 369 100 88 3.2±17.9 0- 384
Falsistrellus tasmaniensis 3, 100 100 77 2.3±9.4 0 - 165
C. morio-V. vulturnus 2, 645 100 85 1.9±7.4 0 - 107
Nyctophilus spp. 978 100 77 0.7±2.4 0 - 29
V. darlingtoni- V. regulus 372 92 71 0.3±1.3 0 - 23
V. vulturnus – V. regulus 331 100 58 0.2±1.6 0 - 34
Chalinolobus morio 242 100 67 0.2±1.0 0 - 23
Vespadelus vulturnus 14 50 15 0.01±0.1 0 - 2
Vespadelus regulus 11 25 6 0.0±0.2 0 - 9
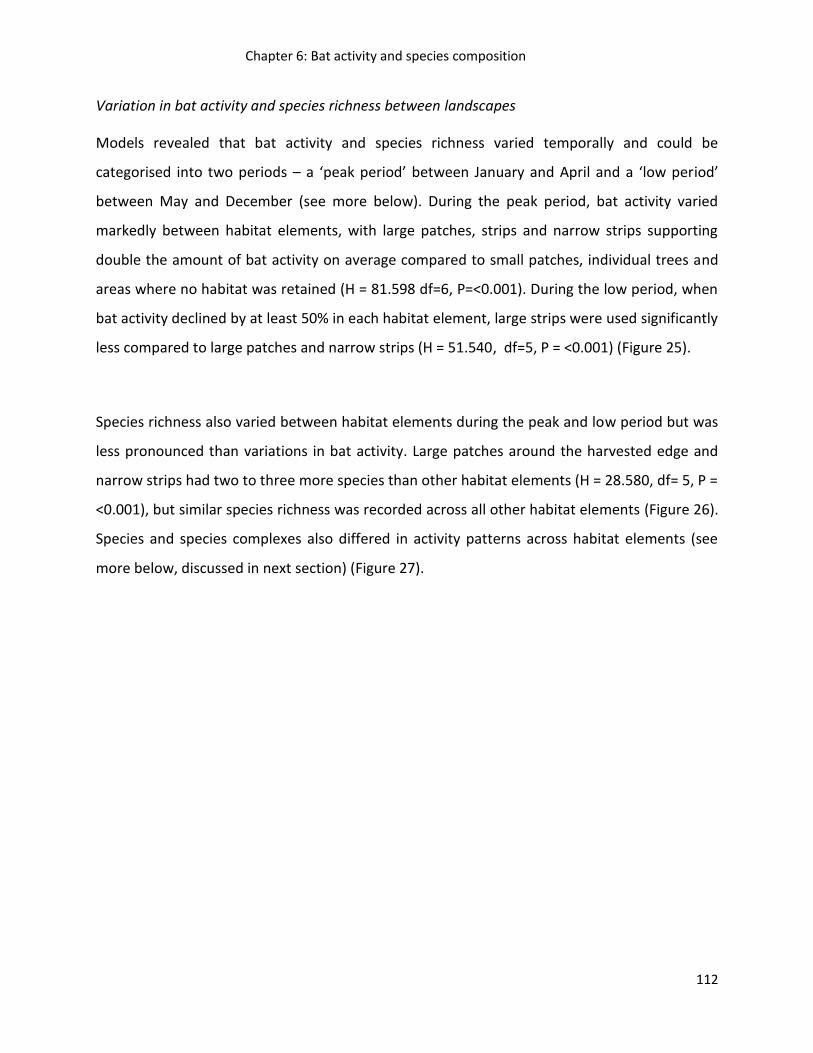
Chapter 6: Bat activity and species composition
112
Variation in bat activity and species richness between landscapes
Models revealed that bat activity and species richness varied temporally and could be
categorised into two periods – a ‘peak period’ between January and April and a ‘low period’
between May and December (see more below). During the peak period, bat activity varied
markedly between habitat elements, with large patches, strips and narrow strips supporting
double the amount of bat activity on average compared to small patches, individual trees and
areas where no habitat was retained (H = 81.598 df=6, P=<0.001). During the low period, when
bat activity declined by at least 50% in each habitat element, large strips were used significantly
less compared to large patches and narrow strips (H = 51.540, df=5, P = <0.001) (Figure 25).
Species richness also varied between habitat elements during the peak and low period but was
less pronounced than variations in bat activity. Large patches around the harvested edge and
narrow strips had two to three more species than other habitat elements (H = 28.580, df= 5, P =
<0.001), but similar species richness was recorded across all other habitat elements (Figure 26).
Species and species complexes also differed in activity patterns across habitat elements (see
more below, discussed in next section) (Figure 27).
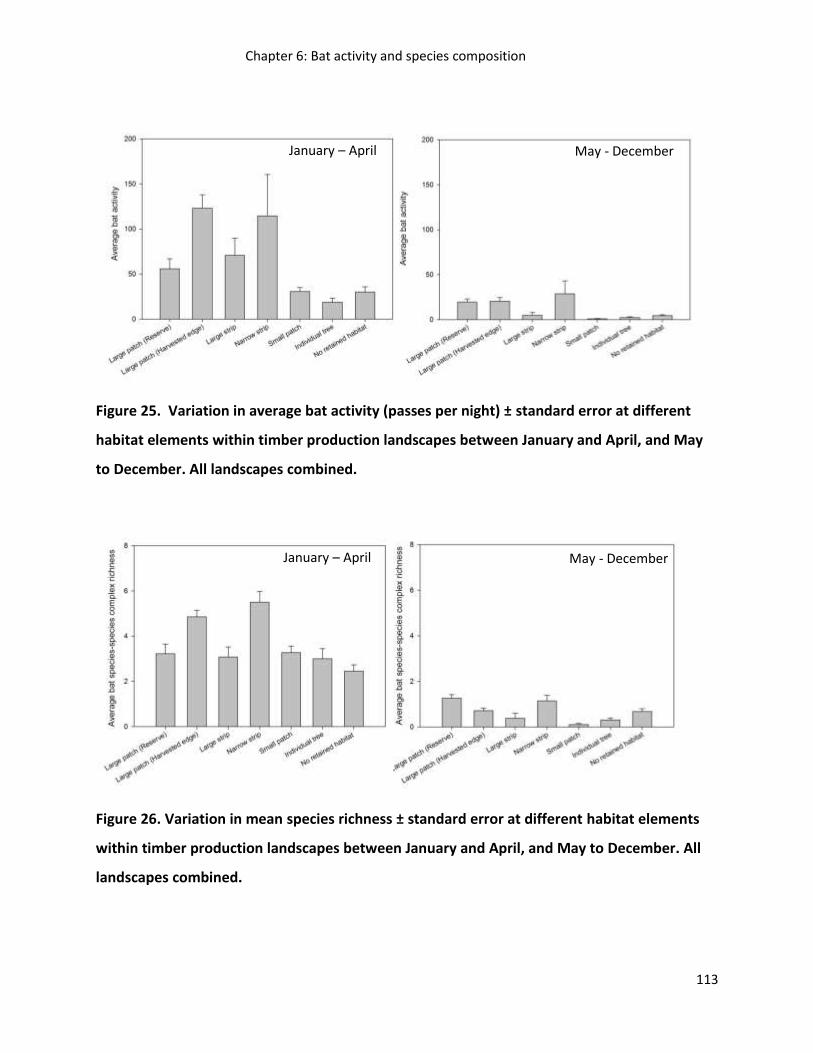
Chapter 6: Bat activity and species composition
113
Figure 25. Variation in average bat activity (passes per night) ± standard error at different
habitat elements within timber production landscapes between January and April, and May
to December. All landscapes combined.
Figure 26. Variation in mean species richness ± standard error at different habitat elements
within timber production landscapes between January and April, and May to December. All
landscapes combined.
January – April May - December
January – April May - December
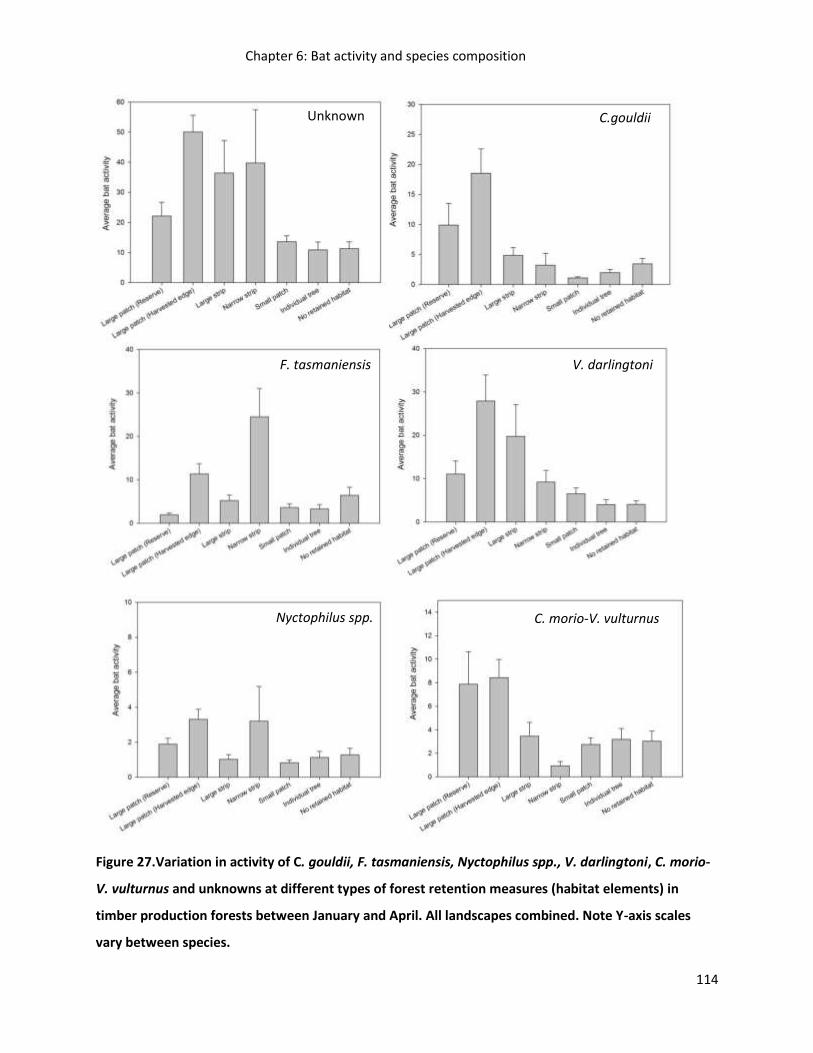
Chapter 6: Bat activity and species composition
114
Figure 27.Variation in activity of C. gouldii, F. tasmaniensis, Nyctophilus spp., V. darlingtoni, C. morio-
V. vulturnus and unknowns at different types of forest retention measures (habitat elements) in
timber production forests between January and April. All landscapes combined. Note Y-axis scales
vary between species.
V. darlingtoni F. tasmaniensis
Unknown C.gouldii
C. morio-V. vulturnus Nyctophilus spp.

Chapter 6: Bat activity and species composition
115
Relationship between bat activity and species richness and temporal, spatial and climatic
factors
Regression tree models revealed there were several spatial, temporal and climatic factors that
were good predictors of bat activity and species richness at habitat elements. Month was the
strongest variable in all of the models. Bat activity and species richness varied significantly over
the survey period, being relatively higher from January to April compared to May to December
(Figure 25& Figure 26). Other spatial and climatic factors were: the amount of heterogeneity
and edge in the surrounding 5 km landscape; the amount of mature forest in the surrounding 1
km landscape; distance to road and water; monthly and daily rainfall. All models except those
for large patches performed reasonably well at explaining bat responses (R2>0.50). However
the amount of variance explained by variables did, however, vary between models and not all
models included the same variables, as detailed below for each habitat element (forest
retention measure) (Table 14).
At sites in large patches (reserves), bat activity was negatively influenced by the amount of daily
rainfall and was positively influenced by distance to water sources. In contrast, species richness
was positively associated with the amount of edge in the landscape (5km). Both model
accuracies were poor (R2<0.50) suggesting that other variables not measured in this study are
likely to be better predictors of bat activity and species richness in large patches (reserves)
(Table 14). Patterns of bat activity were highest in this habitat element for C. morio-V. vulturnus
(Figure 27).
At large patches around the harvested stand edge, bat activity and species richness were both
positively influenced by the amount of edge in the landscape (5km). Patterns of bat activity
were highest in this habitat element for C. gouldii and V. darlingtoni (Figure 27).
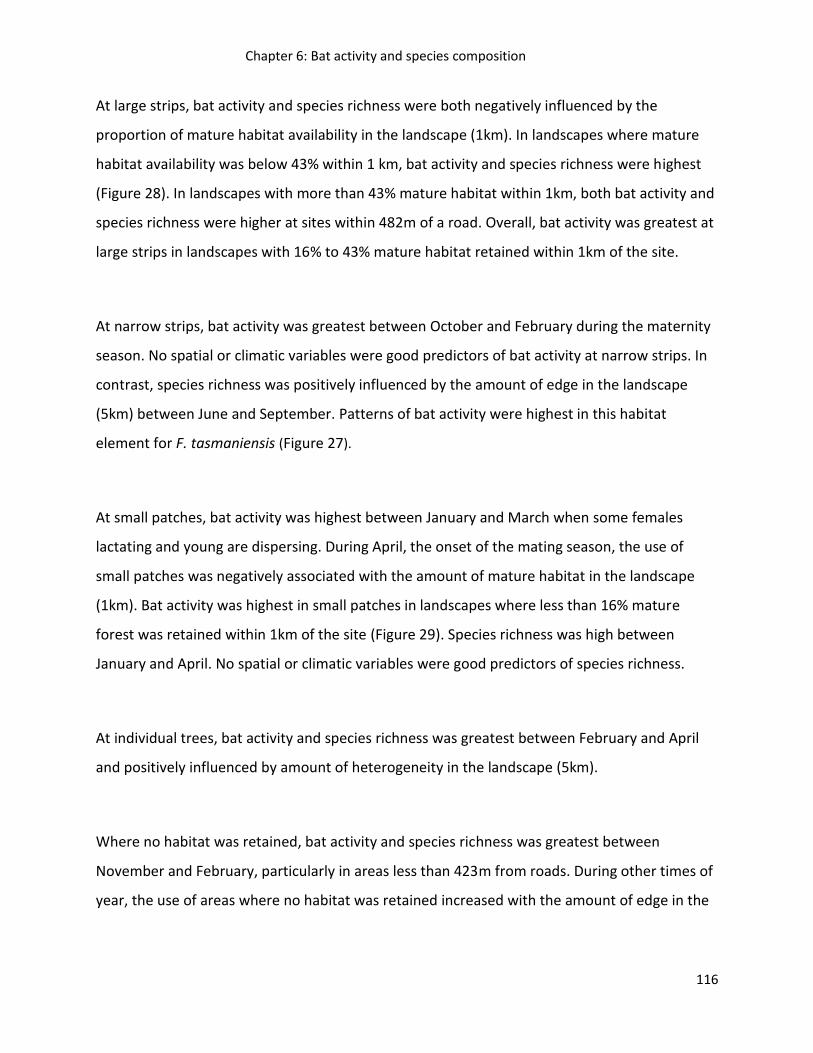
Chapter 6: Bat activity and species composition
116
At large strips, bat activity and species richness were both negatively influenced by the
proportion of mature habitat availability in the landscape (1km). In landscapes where mature
habitat availability was below 43% within 1 km, bat activity and species richness were highest
(Figure 28). In landscapes with more than 43% mature habitat within 1km, both bat activity and
species richness were higher at sites within 482m of a road. Overall, bat activity was greatest at
large strips in landscapes with 16% to 43% mature habitat retained within 1km of the site.
At narrow strips, bat activity was greatest between October and February during the maternity
season. No spatial or climatic variables were good predictors of bat activity at narrow strips. In
contrast, species richness was positively influenced by the amount of edge in the landscape
(5km) between June and September. Patterns of bat activity were highest in this habitat
element for F. tasmaniensis (Figure 27).
At small patches, bat activity was highest between January and March when some females
lactating and young are dispersing. During April, the onset of the mating season, the use of
small patches was negatively associated with the amount of mature habitat in the landscape
(1km). Bat activity was highest in small patches in landscapes where less than 16% mature
forest was retained within 1km of the site (Figure 29). Species richness was high between
January and April. No spatial or climatic variables were good predictors of species richness.
At individual trees, bat activity and species richness was greatest between February and April
and positively influenced by amount of heterogeneity in the landscape (5km).
Where no habitat was retained, bat activity and species richness was greatest between
November and February, particularly in areas less than 423m from roads. During other times of
year, the use of areas where no habitat was retained increased with the amount of edge in the
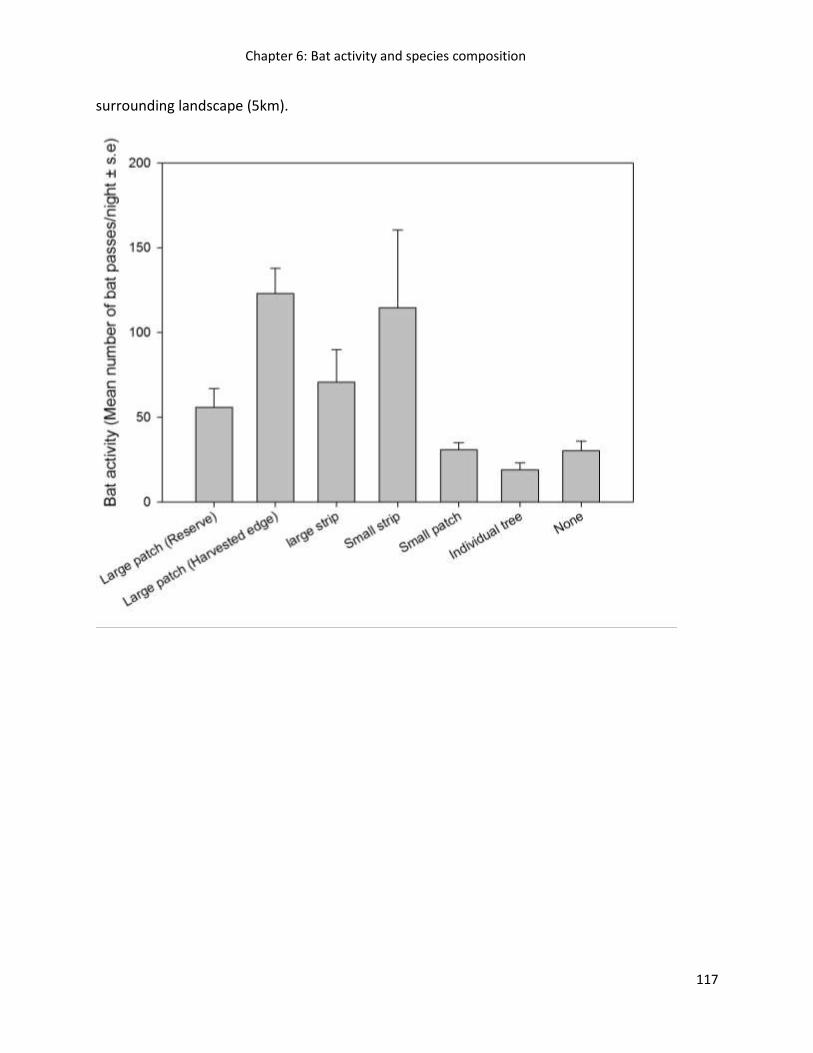
Chapter 6: Bat activity and species composition
117
surrounding landscape (5km).
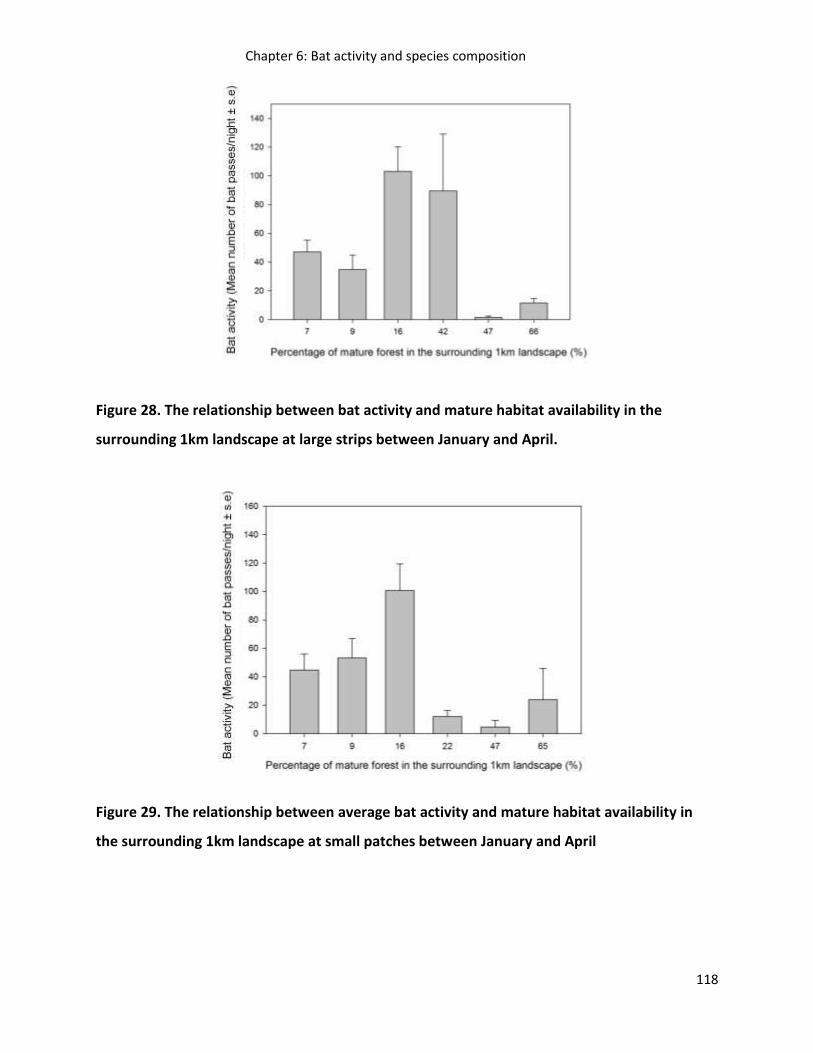
Chapter 6: Bat activity and species composition
118
Figure 28. The relationship between bat activity and mature habitat availability in the
surrounding 1km landscape at large strips between January and April.
Figure 29. The relationship between average bat activity and mature habitat availability in
the surrounding 1km landscape at small patches between January and April
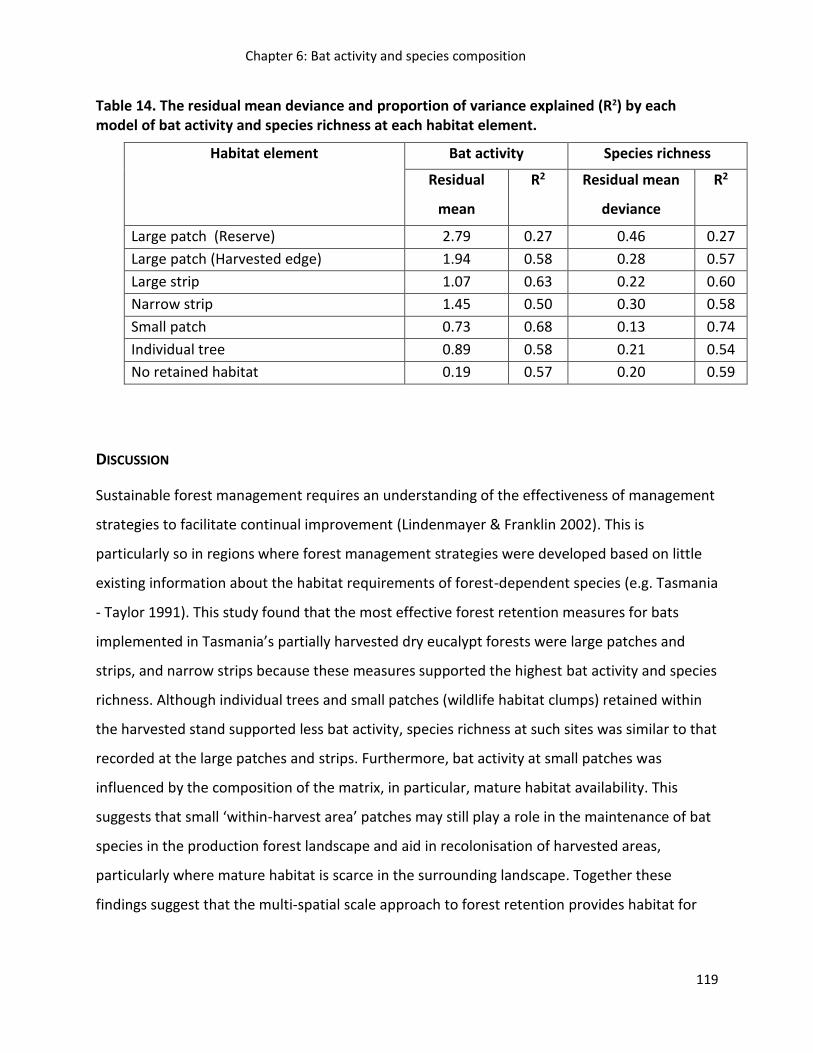
Chapter 6: Bat activity and species composition
119
Table 14. The residual mean deviance and proportion of variance explained (R2) by each model of bat activity and species richness at each habitat element.
Habitat element Bat activity Species richness
Residual
mean
deviance
R2 Residual mean
deviance
R2
Large patch (Reserve) 2.79 0.27 0.46 0.27
Large patch (Harvested edge) 1.94 0.58 0.28 0.57
Large strip 1.07 0.63 0.22 0.60
Narrow strip 1.45 0.50 0.30 0.58
Small patch 0.73 0.68 0.13 0.74
Individual tree 0.89 0.58 0.21 0.54
No retained habitat 0.19 0.57 0.20 0.59
DISCUSSION
Sustainable forest management requires an understanding of the effectiveness of management
strategies to facilitate continual improvement (Lindenmayer & Franklin 2002). This is
particularly so in regions where forest management strategies were developed based on little
existing information about the habitat requirements of forest-dependent species (e.g. Tasmania
- Taylor 1991). This study found that the most effective forest retention measures for bats
implemented in Tasmania’s partially harvested dry eucalypt forests were large patches and
strips, and narrow strips because these measures supported the highest bat activity and species
richness. Although individual trees and small patches (wildlife habitat clumps) retained within
the harvested stand supported less bat activity, species richness at such sites was similar to that
recorded at the large patches and strips. Furthermore, bat activity at small patches was
influenced by the composition of the matrix, in particular, mature habitat availability. This
suggests that small ‘within-harvest area’ patches may still play a role in the maintenance of bat
species in the production forest landscape and aid in recolonisation of harvested areas,
particularly where mature habitat is scarce in the surrounding landscape. Together these
findings suggest that the multi-spatial scale approach to forest retention provides habitat for
Chapter 6: Bat activity and species composition
120
bats, facilitating recolonisation of harvested areas in the short to medium term (<20 years) and
maintenance of bat species richness in timber production landscapes.
The influence of the landscape on the response of fauna to forest management strategies has
been demonstrated by several studies (Kroll et al. 2012a; Vergara in press; Wardlaw et al.
2012). The premise of these studies is that understanding the effectiveness of forest retention
measures cannot be fully understood without considering the influence of the matrix
(Mazerolle & Villard 1999). For example, Kroll et al. (2012a) found that in landscapes where
there was a relatively large amount of mature forest surrounding the harvested stand, the
creation of hollows in the harvested stand was not an effective approach. Wardlaw et al.
(2012)also found that the ability of many plant, bird and beetle species to recolonise harvested
areas was reduced if there was relatively little mature forest in the surrounding landscape. For
species dependent on mature forest elements, such as hollow-bearing trees, the amount of
mature forest in the landscape could be an important factor in determining whether forest
retention measures in a harvested stand are utilised.
Several temporal, spatial and climatic variables were also good predictors of bat activity and
species richness at different patches and can further explain differences in the use of retained
areas. Not surprisingly, time of year had the strongest influence. Temporal variation in bat
activity is well recognised (Hayes 1997; Kuenzi & Morrison 2003; Milne et al. 2005; O'Donnell
2000), but there are few studies that have sampled bat activity and species richness throughout
the year when undertaking effectiveness monitoring. Most studies sample during late spring
and early summer. The rationale behind this approach is that this is the most important period
to sample because it has: the highest bat activity as recorded by ultrasonic detectors; the
maternity period when resource requirements, especially for females, are likely to be highest;
and that bat activity is likely to be inflated in late summary when young become volant (i.e.
Threlfall et al. 2012a; Webala et al. 2011). For effectiveness monitoring, however, this
approach has a major limitation in that it only provides a ‘snap-shot’ of how bats and other
Chapter 6: Bat activity and species composition
121
fauna use retained patches, which may vary throughout the annual cycle of bats as the spatial
habitat requirements change(Kroll et al. 2012b).
The findings of this study demonstrate that the effectiveness of forest management strategies
vary temporally. Between January and April (the maternity / mating season), large patches on
the harvested area edge and narrow strips supported 50% more bat activity than large patches
in reserves. However between May and December, both large patches in reserves and on the
harvested edge, as well as narrow strips, supported similar bat activity. This pattern was similar
but less pronounced for species richness, which varied by one to two species. High bat activity
during the spring and summer months is generally associated with moderate temperatures, day
lengths and insect availability, as well as the energetic requirements of lactation and juvenile
dispersal. Low bat activity is generally associated with low temperatures and day lengths which
reduce insect availability and increases in the energetic demands of thermoregulation
(Lumsden & Bennett 2005; Sanderson & Kirkley 1998). These findings suggest that there are
features of large patches and narrow strips on the harvested edge that make these patches
more suitable to bats from a resource (i.e. insect or roost availability) or thermoregulatory
perspective than large patches in reserves.
Both large patches on the edge of harvested forest and narrow strips share one feature in
common: they have a relatively large area of linear edges. Linear edges created during timber
harvesting operations function in the same way as natural forest gaps do in undisturbed forest
– they create additional bat habitat by opening up areas of high vegetation density for
commuting and foraging that would otherwise be inaccessible to those bat species that cannot
maneuver through such habitat (Morris et al. 2010). This is consistent with data collected
throughout Australia, where bat activity has been found to be higher on tracks and streams
throughout regrowth and old growth forest (Cawthen et al. 2012; Law & Chidel 2002; Webala
et al. 2011). Indeed, in this study the amount of edge in the landscape influenced bat activity
and species richness at large patches around the harvested edge. Our results combined with

Chapter 6: Bat activity and species composition
122
previous studies demonstrate the importance of linear edges for bats, such as tracks (Law &
Chidel 2002; Webala et al. 2011), hedgerows (Boughey et al. 2012), riparian zones (Cawthen et
al. 2012; Downs & Racey 2006; Law & Chidel 2002), intact woodland and harvested area edges
(Downs & Racey 2006; Morris et al. 2010).
Individual trees and small patches are unlikely to provide all the resources that bats require and
do not provide a greater thermoregulatory or resource advantage compared to larger patches
which were readily accessible to bats. These patches are generally exposed and provide little
edge for bats to commute and forage. They are also small in size and so the likelihood of
containing a suitable available roost is greatly decreased. These findings differ to those from
North America, where the use of small patches of trees has been found to be similar to that of
the harvest edge (Hogberg et al. 2002). Such forest retention measures are likely to be more
effective in landscapes where forest is highly fragmented or modified, such as agricultural
landscapes (Fischer et al. 2010; Lumsden & Bennett 2005). Bats can travel relatively large
distances (Lumsden & Bennett 2005), so in highly modified and fragmented landscapes,
multiple individual trees and small patches are likely to provide key resources to bats and
encourage recolonisation of harvested areas and facilitate connectivity (Russo et al. 2010). The
findings of this study support this, as small patches were used more in timber production
landscapes where there was less than 16% mature forest remaining within 1km of the
harvested area. Therefore, the retention of individual trees and small patches may be effective
in landscapes where there is little mature forest available close by.
No single forest retention measure is likely to benefit all bat species in an area. One of the main
benefits of the multi-spatial scale approach to forest retention is that it is likely to cater for the
diverse habitat requirements of forest-dependent species through ‘risk-spreading’ (Whitford &
Stone 2004). Different bat species are known to respond differently to forest loss and
modification (e.g. Webala et al. 2011) and this is related to differences in ecomorphology
(Hanspach et al. 2012; Threlfall et al. 2012b). The findings of this study, that bat species varied
Chapter 6: Bat activity and species composition
123
in their patterns of activity at different forest retention measures, demonstrate the value of the
multi-spatial scale approach. For example, the high-flying less manoeuvrable F. tasmaniensis
used open areas where no habitat had been retained twice as much as large patches in
reserves, but used narrow strips twice as much as any other forest retention measure. Narrow
riparian strips may be an important habitat element in Tasmania’s forests (Cawthen et al.
2012), but this could not be assessed in this study because few sites contained riparian
reserves. In contrast there was little variation in the use of forest retention measures by the
low-flying highly manoeuvrable Nyctophilus spp. most likely because these bat species can
access open and closed forest patches. Results from other studies suggest that the response of
bat species to forest management strategies will vary depending on forest structure in a given
area (Law & Chidel 2002; Law & Chidel 2001; Webala et al. 2011). This may in part explain why
Nyctophilus spp. readily used regrowth in dry eucalypt forests in this study, but avoided
regrowth forest in wet eucalypt forests in other Tasmanian studies (Law & Law 2011; Rhodes
1996).
The findings of this study overcame many of the limitations recognised in previous research by
including ‘unknown’ bat call identifications in the analysis. This precluded inferences of forest
retention measure use being biased towards only bat species whose calls could be identified
accurately, and replicating sampling both temporally and spatially (Sherwin et al. 2000). Using
bat call surveys as a survey method is however not without its limitations, and these should be
taken into account when interpreting the results for individual species. Firstly, not all species
could be identified to species level, so inferences of habitat use patterns are based on bat taxa
(e.g. Nyctophilus spp. for N. sherrini &N. geoffroyi). For Nyctophilus spp. in particular, although
both species are known to occur in the study (Driessen et al. 2011). It is possible that the
habitat use patterns inferred from bat call data reflect the habitat use patterns of only one
species, as N. geoffroyi and N. sherrini are known to select habitat differently (Chapter 5).
Secondly, this study did not sample insect biomass or diversity which is a probable to be a
factor influencing bat activity and may be a strong driver of the temporal variation observed
(Threlfall et al. 2011; Threlfall et al. 2012b). Excluding insect abundance or diversity from our
Chapter 6: Bat activity and species composition
124
analysis likely resulted in poorer models, but forest managers are unlikely to survey insects
when selecting habitat for bats, so other factors such as those measured in this study are more
practical for the purposes of this study. Thirdly, the survey design did not take into account the
vertical stratification in bat habitat use which may have resulted in overestimates and
underestimates in bat activity of some species (Adams et al. 2009) but as dry eucalyptus forests
were quite low in height, this is unlikely to be an issue compared to the tall wet eucalyptus
forests. Lastly, bat call surveys do not take into account intra-specific variation in habitat use
patterns or the value of forest retention measures for roosting which can only be obtained from
radio-telemetry data (Chapter 4). Despite these limitations, this data set was robust and
indicates seasonal and species-specific differences in the use of retained areas by bats which
can help inform management practices.
MANAGEMENT CONSIDERATIONS
World-wide, the multi-spatial scale approach to mature forest retention is considered to be one
of the most effective strategies for maintaining bat diversity in timber production landscapes
(Adams et al. 2009; Dodd et al. 2012; Grindal & Brigham 1998; Jung et al. 2012; Morris et al.
2010; Patriquin & Barclay 2003). Because bats used forest retention measures differently and
the extent of use varied temporally and spatially this approach is likely to be more appropriate
than the ‘ one-size-fits-all ‘ approach to forest management in catering for the habitat
requirements of bats and maintaining bat species in the landscape. That said, the effectiveness
of this approach will depend on the ability of land managers to implement strategies across
multiple land tenures (e.g. public and private forest) and land managers (e.g. local council and
state government). This is challenging but crucial as the findings of this study demonstrate the
importance of mature forest availability for bats. For improvement of current forest
management strategies, forest managers should consider the retention of forest patches that
optimise the amount of edge in the stand; and the retention of small patches and large strips in
landscapes where current and anticipated future amounts of mature forest habitat in the
Chapter 6: Bat activity and species composition
125
landscape are rare or low. In landscapes where mature forest habitat is low in relation to past
extents, regeneration of mature forest should also be a priority. Future research into the
effectiveness of forest management strategies for bats should focus on how the type, amount
and spatial arrangement of mature forest are influencing populations in terms of genetic
diversity, abundance and reproductive success. The long-term success of the multi-spatial scale
forest management approach will require such studies in addition to ongoing monitoring of
whether retained habitat survives and continues to be used by bats as the forest regenerates.
Without such research forest managers cannot understand how effective forest retention
measures are and how to improve them, which is a necessary objective of ecologically
sustainable forest management.
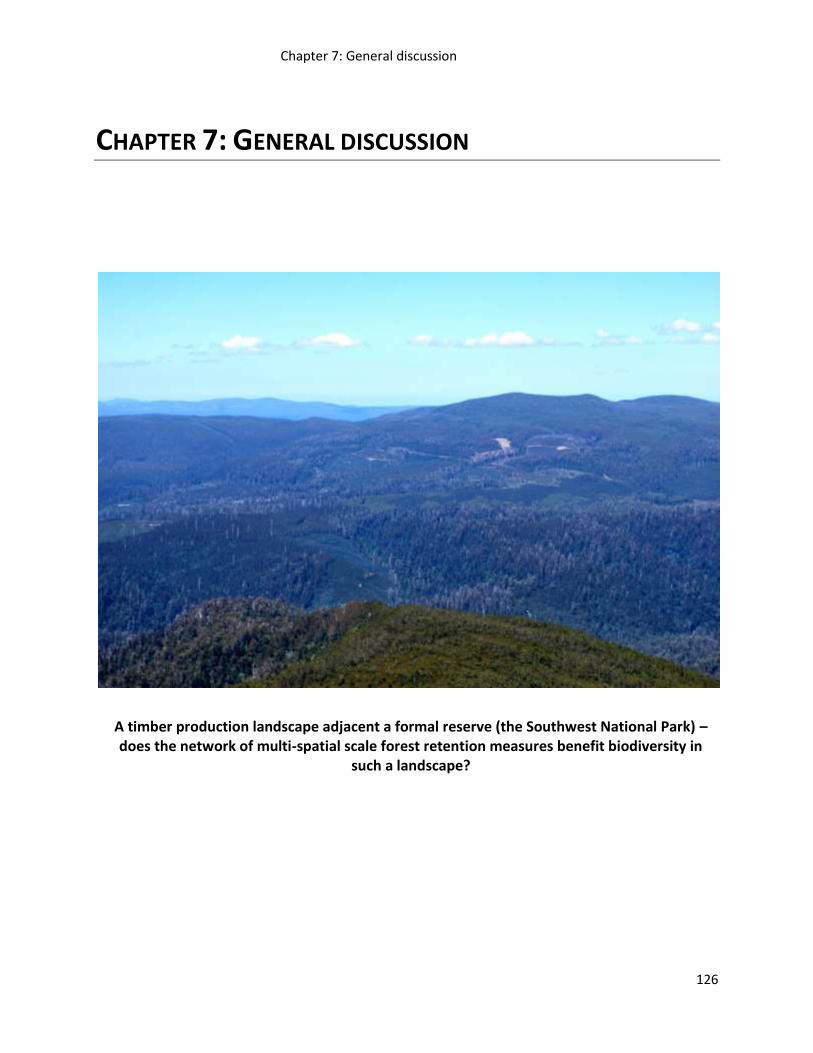
Chapter 7: General discussion
126
CHAPTER 7: GENERAL DISCUSSION
A timber production landscape adjacent a formal reserve (the Southwest National Park) – does the network of multi-spatial scale forest retention measures benefit biodiversity in
such a landscape?
Chapter 7: General discussion
127
INTRODUCTION
Ecologically sustainable forest management has been described as the perpetuation of
ecosystem processes and maintenance of ecosystem integrity whilst utilising forests for their
timber production and non-timber values (Lindenmayer et al. 2000). The maintenance of
biodiversity is an important part of ecologically sustainable forest management, not only
because of the intrinsic value of the biota forests support, but also because of the important
role many species play in maintaining the health of forest ecosystems and aiding in
regeneration after disturbance (Burton et al. 1992). Understanding the effectiveness of
different approaches to forest management for biodiversity conservation, and how effectively
these are applied in practice, is crucial for the continual improvement of forest management
strategies for biodiversity conservation (Lindenmayer & Franklin 2002). The overall aim of this
thesis was to gather information that can be collectively used to assess the effectiveness of this
multi-scale approach to forest management as applied in practice in Tasmania, at conserving
hollow-using bats.
Though bats represent a large component of Tasmania’s terrestrial mammalian diversity, there
is limited understanding of their distribution, abundance, echolocation calls (for bat call
identification), reproduction, activity patterns and ecological requirements (Driessen et al.
2011). Such information is vital for developing and interpreting the results of studies such as
effectiveness monitoring of forest management strategies (Chapters 5 and 6). Though some of
this information, such as the timing of reproduction, is known from mainland conspecifics, such
information cannot be readily transferred from one region to another. This is because of
variation in the morphology, physiology and ecology of bat species across their range
influences, their echolocation call attributes, timing of reproduction and activity patterns, and
ecological requirements (Racey & Entwistle 2003). Recognising this, a large proportion of this
thesis (Chapters 2 – 4) is dedicated to filling gaps in the understanding of Tasmanian bats with
the findings informing the development and interpretation of the studies in Chapters 5 and 6.
Chapter 7: General discussion
128
This chapter synthesises the main findings of this thesis and discusses how they have
contributed to expanding our knowledge of Tasmanian bats and evaluating the effectiveness of
the multi-scale approach to forest management for bats. This chapter concludes by providing
recommendations on the improvement of current forest management strategies for bats and
other forest-dependent fauna.
SYNTHESIS OF KEY FINDINGS
Tasmanian bats
There are just over a 1000 bat species, almost a quarter of which are threatened (Mickleburgh
et al. 2002). Australia’s most recent mammalian extinction was a bat, the Christmas island
pipistrelle (Lunney et al. 2011). Like Tasmanian bats, this species was a hollow-using
insectivorous micro-bat (Koch et al. 2008b). Reminiscent of so many species that have become
extinct, little was understood of the Christmas Island pipistrelle’s distribution, abundance,
reproduction and ecology to inform conservation initiatives when it was first found to be in
decline. Though Tasmanian bats are currently not considered threatened (Driessen et al. 2011),
like the Christmas island pipistrelle, no baseline data exists to adequately assess their
conservation status. The studies undertaken as part of this thesis have provided a significant
contribution to filling the gaps in the knowledge of Tasmanian bats to enable such assessment
and to inform the development of management strategies for Tasmanian bats and their habitat.
One of the main approaches used in this thesis to collect data on Tasmanian bats was though
bat call surveys. Bat call surveys are promoted as one of the most appropriate methods for
surveying bats because in many regions species cannot be effectively detected through capture
methods alone (e.g. species adapted to flying in open spaces - Duffy et al. 2000; Mills et al.
1996) and because capture methods are not always practical(e.g. wind farm monitoring at
height- Johnson et al. 2004) or suitable for long-term monitoring (e.g. species declines - Brooks
2011). Bat call surveys are also less invasive, and do not require animals to be captured once a
bat call identification key has been developed. Though in many regions not all bat species can
be readily identified by their calls (Barclay 1999; Fenton 2003), bat call surveys can be a

Chapter 7: General discussion
129
valuable tool for collecting baseline data on bats if the limitations of this approach, such as the
ability to identify bat calls, are fully understood(Walters et al. 2012).
One of the greatest challenges for anyone undertaking bat call surveys is the identification of
bat call sequences. Specifically, deciding on the most accurate and efficient approach to bat call
identification given the likelihood that not all calls can be identified accurately to species level.
Various approaches to bat call identification are outlined in the literature, but few are
compared (e.g. Adams et al. 2010; Herr et al. 1997; Parsons & Szewczac 2009). Chapter 2
provides one of the most comprehensive quantitative comparisons of different approaches to
bat call identification, and provides details on developing a bat call identification key. By
collating and comparing bat calls from throughout Tasmania, this study demonstrates the
ability of the computer software package AnaScheme to accurately and efficiently identify bat
call sequences, in particular, bat call sequences that overlap extensively in call attributes. This
chapter also discusses alternative computer software packages that have the potential, like
AnaScheme, to assist with bat call identification. Importantly for future bat research and
monitoring in Tasmania, this chapter provides an approach to bat call identification that can be
used to collect data to inform management of Tasmanian bats and their habitat without the
biases associated with subjective bat call identification or statistical techniques. This
approached to bat call identification is not Tasmanian bat specific and has the potential to be
successful at identifying bat call sequences in other regions throughout the world.
The value of bat call surveys and the bat call identification key developed for Chapter 2 is
exemplified by the discovery of the white-striped freetail bat in Tasmania during data collection
for this thesis (chapter 3). This discovery demonstrates the power of bat call surveys as a bat
survey approach, particularly for species not readily captured. The successfulness of this
approach was also demonstrated by using bat call surveys to clarify the relationship between
the activity and reproductive cycles of Tasmanian bats (Chapter 4) and evaluate the importance
of different forest retention measures for bats (Chapter 6). It is important to note, however,
Chapter 7: General discussion
130
that bat call surveys do have their limitations. In Tasmania, the main limitation of this
technique, as demonstrated in Chapter 2 and 6 is that not all species can be identified by their
calls and so this approach cannot provide a complete inventory of Tasmanian bat species.
By using a combination of bat call surveys and bat capture Chapters 2 and 4 were able to clarify
that Tasmanian bat species exhibit marked variation in their echolocation calls (Chapter 2), as
well as in their reproductive and activity cycles (Chapter 4) compared to their mainland
conspecifics. These differences likely reflect the size, location and glacial history of Tasmania
and the influence these factors have had on bat morphology, physiology and ecology since
Tasmania separated from mainland Australia (Driessen et al. 2011). The identification of such
variation between bat populations is crucial because it confirms that information on the
echolocation, reproduction and ecology of bats in one region cannot be readily transferred to
another. If this were attempted, this could result in conducting bat surveys at inappropriate
times of year (e.g. sampling outside of the maternity season in Chapter 5) or the
misinterpretation of data (e.g. seasonal variation in bat activity in Chapter 6).
The effectiveness of forest management strategies for bats
Off-reserve forest management is promoted as an important strategy for biodiversity
conservation (Lindenmayer & Franklin 2002), though little is known of the effectiveness of
different management approaches. The data collected in Chapters 5 and 6 reveal that the
multi-spatial scale approach to forest management is effective at maintaining bats in off-
reserve areas such as timber production landscapes. By retaining mature forest elements at a
range of spatial scales, such as in the form of individual hollow-bearing trees, as well as small
and large mature forest patches and strips, bats can not only be maintained in timber
production landscapes, but are also provided with suitable habitat that facilitates their
recolonisation of regenerating forest stands.
Chapter 7: General discussion
131
The retention of a variety of different types, amounts and spatial arrangements of mature
forest habitat is one of the main reasons why the multi-spatial scale approach to forest
management is promoted to be effective for biodiversity conservation (Lindenmayer & Franklin
2002). Bats vary in their ecological requirements spatially and temporally to meet changes in
their physiological, ecological and social needs (Lumsden & Bennett 2006).By retaining habitat
at multiple spatial scales there is a greater likelihood that suitable habitat will be retained to
cater for the range of roosting, foraging and commuting habitat preferences demonstrated by
bats.
Tasmanian bats exhibit a range of roosting, foraging and commuting habitat preferences. The
findings of Chapters 5 and 6 revealed that not all bat species shared the same roosting, foraging
and commuting habitat preferences nor did each species use the same habitat for roosting as
they did for foraging and commuting. This was particularly evident for maternal colonies of
different species. Lactating females of all species foraged in small patches and large strips of
regenerating forest but varied in their roost site selection at multiple spatial scales. For
example, Nyctophilus geoffroyi readily used small patches and large strips to breed in whereas
other species such as Nyctophilus sherrini and Chalinolobus morio avoided such patches. These
findings imply that no single forest management strategy (e.g. ‘the one-size fits all approach’) is
likely to meet all the habitat requirements all bat species as well as facilitate the recolonisation
of regenerating forest and thus maintain bat species in timber production landscapes. This
reinforces the conclusion that the multi-spatial scale approach to forest management, as
applied in Tasmania’s dry eucalypt forests, is a viable and effective approach for bat
conservation.
One of the most significant findings of this thesis was that the value of forest retention
strategies for bats varies with landscape composition. This is not surprising as studies have
found that the landscape has an important influence on the habitat use patterns and
community structure of a variety of fauna including birds (Antongiovanni & Metzger 2005;
Chapter 7: General discussion
132
Jokimäki & Huhta 1996; Pardini et al. 2009; Tubelis et al. 2007; Vergara et al. 2013; Wardlaw et
al. 2012), mammals (Caryl et al. 2012; Caryl et al. in press ; Cawthen & Munks 2011; Flynn et al.
2011a; Flynn et al. 2011b; Pardini et al. 2009; Umetsu & Pardini 2007), reptiles (Pardini et al.
2009; Steen et al. 2012), amphibians (Pardini et al. 2009; Parris 2004) and invertebrates (Pardini
et al. 2009; Wardlaw et al. 2012). What is significant about this finding for bats is that it could
explain differences in habitat use patterns and species assemblages that have been observed
across different landscapes and landscape contexts (e.g. urban areas) that vary in landscape
composition.
There were several components of the landscape that were particularly important to bats.
These were the amount of mature forest in the landscape (within 1km), the amount of
landscape heterogeneity and edge in the broader landscape (within 5km) and distance to roads.
Specifically, the findings of both Chapters 5 and 6 revealed that the type, amount and spatial
arrangement of mature forest influenced both bat roosting and activity patterns in timber
production landscapes. For example, bats used small patches and large strips of mature forest
retained in young regenerating forest to a greater extent in landscapes where mature forest
availability was relatively low compared to a landscape where mature forest was readily
available. The relationship between the composition of the surrounding landscape and the use
of small forest patches has also been noted in hollow-using birds (Kroll et al. 2012a) and
arboreal marsupials (Banks et al. 2013). Together these findings suggest that the less mature
forest available in the landscape, the greater the likelihood that retained habitat at smaller
spatial scales (e.g. individual tree, small patch and strips) will be utilised by fauna, and thus the
greater importance of retaining such habitat. By using bat ecomorphology, land managers may
be able to predict how species will use retained forest habitat (Table 15) (Hanspach et al. 2012).
Chapter 7: General discussion
133
ARE TASMANIA’S FOREST MANAGEMENT STRATEGIES EFFECTIVE FOR CONSERVING FAUNA?
The findings of this thesis have important implications for understanding the effectiveness of
Tasmania’s forest management strategies for conserving fauna. Unfortunately there is limited
information on how fauna are responding to Tasmanian forest management strategies and how
this varies in response to landscape composition. Though a range of studies have been
undertaken on a variety of fauna including ground-dwelling small mammals (Stephens et al.
2012a), arboreal marsupials (Cawthen & Munks 2011; Flynn et al. 2011b), birds (Koch et al.
2009a; Koch et al. 2009b; Lefort & Grove 2009; MacDonald et al. 2005; MacDonald et al. 2002),
invertebrates (Baker et al. 2009; Grove) and even bats (Cawthen et al. 2012; Law & Law 2011),
for the most part, there has been a lack of consideration of the composition of the surrounding
landscape when interpreting results. What these studies do provide us with is a consensus that,
overall, Tasmania’s forest management strategies as a collective (i.e. the multi-spatial scale
approach)is effective for conserving a wide range of fauna, but that each forest retention
measure (e.g. large reserves or small patches)is not necessarily effective on its own at meeting
the habitat requirements of all species. This is because not only do fauna vary in their habitat
requirements, but each species varies spatially and temporally in the habitat they require as
demonstrated by the findings of this thesis (Table 15). It is also important to note that though
small patches, strips and individual trees may not cater for all the habitat requirements of a
species, these retention measures do provide important habitat for facilitating the
recolonisation of harvested areas and conserving species in the landscape (e.g. Cawthen &
Munks 2011). This is particularly so in landscapes where large areas of mature forest have been
cleared or are naturally rare.
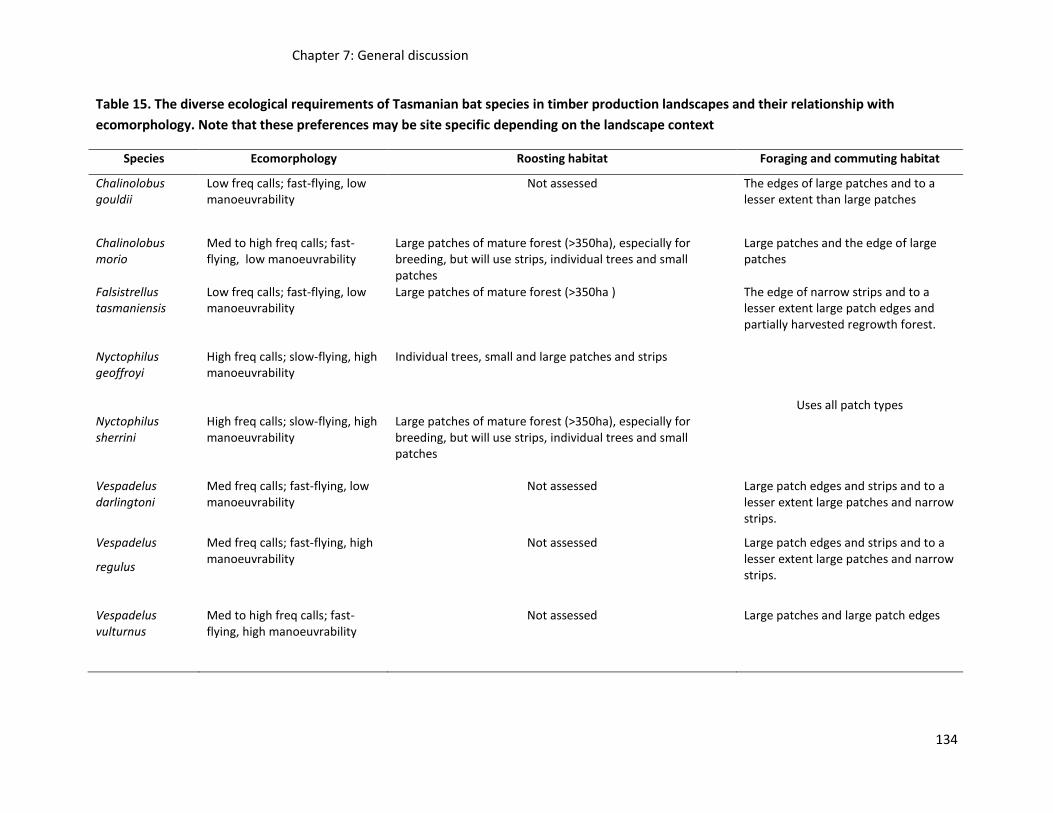
Chapter 7: General discussion
134
Table 15. The diverse ecological requirements of Tasmanian bat species in timber production landscapes and their relationship with
ecomorphology. Note that these preferences may be site specific depending on the landscape context
Species Ecomorphology Roosting habitat Foraging and commuting habitat
Chalinolobus gouldii
Low freq calls; fast-flying, low manoeuvrability
Not assessed
The edges of large patches and to a lesser extent than large patches
Chalinolobus morio
Med to high freq calls; fast-flying, low manoeuvrability
Large patches of mature forest (>350ha), especially for breeding, but will use strips, individual trees and small patches
Large patches and the edge of large patches
Falsistrellus tasmaniensis
Low freq calls; fast-flying, low manoeuvrability
Large patches of mature forest (>350ha ) The edge of narrow strips and to a lesser extent large patch edges and partially harvested regrowth forest.
Nyctophilus geoffroyi
High freq calls; slow-flying, high manoeuvrability
Individual trees, small and large patches and strips
Uses all patch types Nyctophilus sherrini
High freq calls; slow-flying, high manoeuvrability
Large patches of mature forest (>350ha), especially for breeding, but will use strips, individual trees and small patches
Vespadelus darlingtoni
Med freq calls; fast-flying, low manoeuvrability
Not assessed
Large patch edges and strips and to a lesser extent large patches and narrow strips.
Vespadelus
regulus
Med freq calls; fast-flying, high manoeuvrability
Not assessed
Large patch edges and strips and to a lesser extent large patches and narrow strips.
Vespadelus vulturnus
Med to high freq calls; fast-flying, high manoeuvrability
Not assessed
Large patches and large patch edges
Chapter 7: General discussion
135
CONSIDERATIONS FOR IMPROVEMENT OF FOREST MANAGEMENT STRATEGIES
There is a large amount of evidence to demonstrate that retaining forest in areas where forest
is to be lost or modified (off-reserve forest management) is beneficial for biodiversity around
the world (Baker & Read 2011; Banks et al. 2013; Kroll et al. 2012b; Lindenmayer et al. 2012).
Although current forest management strategies are mitigating the impacts of forest loss and
fragmentation on a variety of fauna species (Baker et al. 2009; Cawthen & Munks 2011;
Cawthen et al. 2012; Flynn et al. 2011a; Flynn et al. 2011b; Grove & Yaxley 2005; Lefort & Grove
2009; Stephens et al. 2012a; Wardlaw et al. 2012), including bats, the long-term effectiveness
of these management strategies can be improved by retaining a variety of different types of
forest habitat at a variety of spatial scales ranging from the hollow to the stand scale, and by
considering the composition of the landscape when deciding on the type, amount and spatial
arrangement of mature forest to retained in an area to be retained.
Considering the composition of the landscape (the matrix) when managing habitat for
biodiversity is a huge challenge. Unlike retaining habitat at smaller spatial scales (e.g. an
individual tree), managing habitat at the landscape scale can involve forest stands or
catchments that are managed by multiple land managers whose management objectives and
strategies vary (Kroll et al. 2012a). Inconsistencies in forest management strategies have the
potential to create landscapes devoid of large tracts of mature forest, which as shown in this
thesis, are important habitat for many species. These deficiencies will be long-term, as it takes
at least 100 years for mature forest elements to develop (e.g. hollow-bearing trees) (Koch et al.
2008a). Furthermore, though the retention of small patches and large strips are beneficial in
maintaining biodiversity in landscapes where large tracts of mature forest are lost or naturally
rare, it is unclear how the long-term persistence of species in such landscapes will be affected
by reduced habitat availability(e.g. genetic structure: Stephens et al. 2012b). Recognising the
importance of landscape scale forest management and consistency in forest management
strategies across land tenures and land use regulatory systems is essential to ensuring that
forest biodiversity is conserved in the long-term.
Chapter 7: General discussion
136
FINAL REMARKS
Ultimately, species respond in different ways to forest management strategies depending on
the taxon in question, the spatial and temporal scale at which forest is lost, modified and
fragmented and the composition of the surrounding landscape. It is an almost impossible task
to understand the effectiveness of forest management actions for all species given their range
of responses, but through studying groups of species whose ecological characteristics are
shared by other species, we can test ecological theory applicable to the conservation of
multiple species (Koch et al. 2012). This is the approach that has been followed in this thesis. It
is however crucial that basic research on both individual species and communities is
undertaken to underpin management actions for biodiversity conservation, particularly given
the potential for bat species to be shifting their ranges throughout the world. Such
management actions must however be underpinned by sound scientific research which is
integrated with community education, sound policy and action by government based on
research and monitoring of outcomes (Lunney et al. 2011).
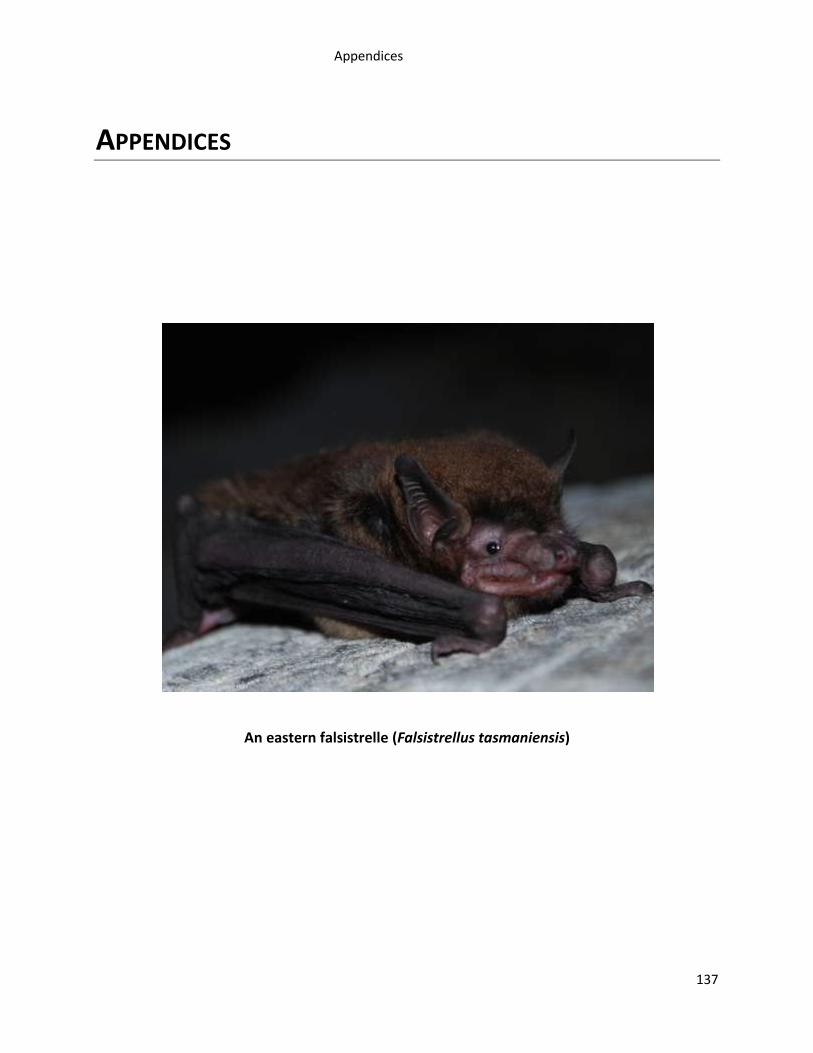
Appendices
137
APPENDICES
An eastern falsistrelle (Falsistrellus tasmaniensis)
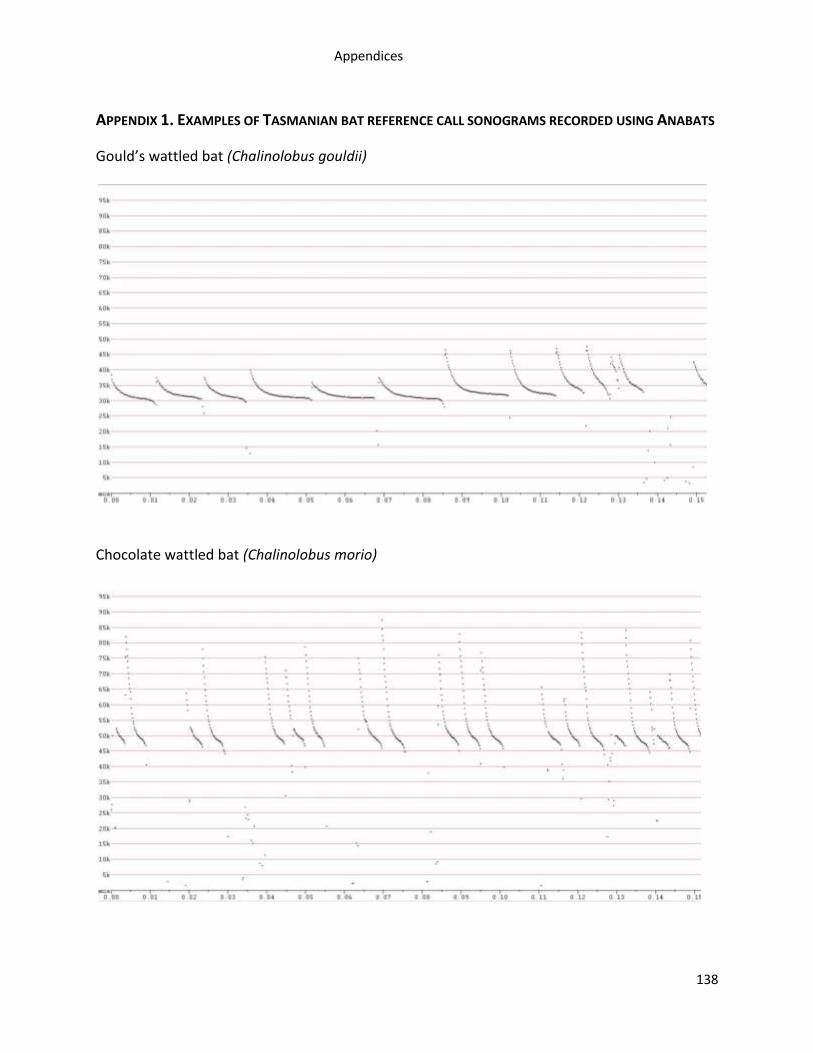
Appendices
138
APPENDIX 1. EXAMPLES OF TASMANIAN BAT REFERENCE CALL SONOGRAMS RECORDED USING ANABATS
Gould’s wattled bat (Chalinolobus gouldii)
Chocolate wattled bat (Chalinolobus morio)
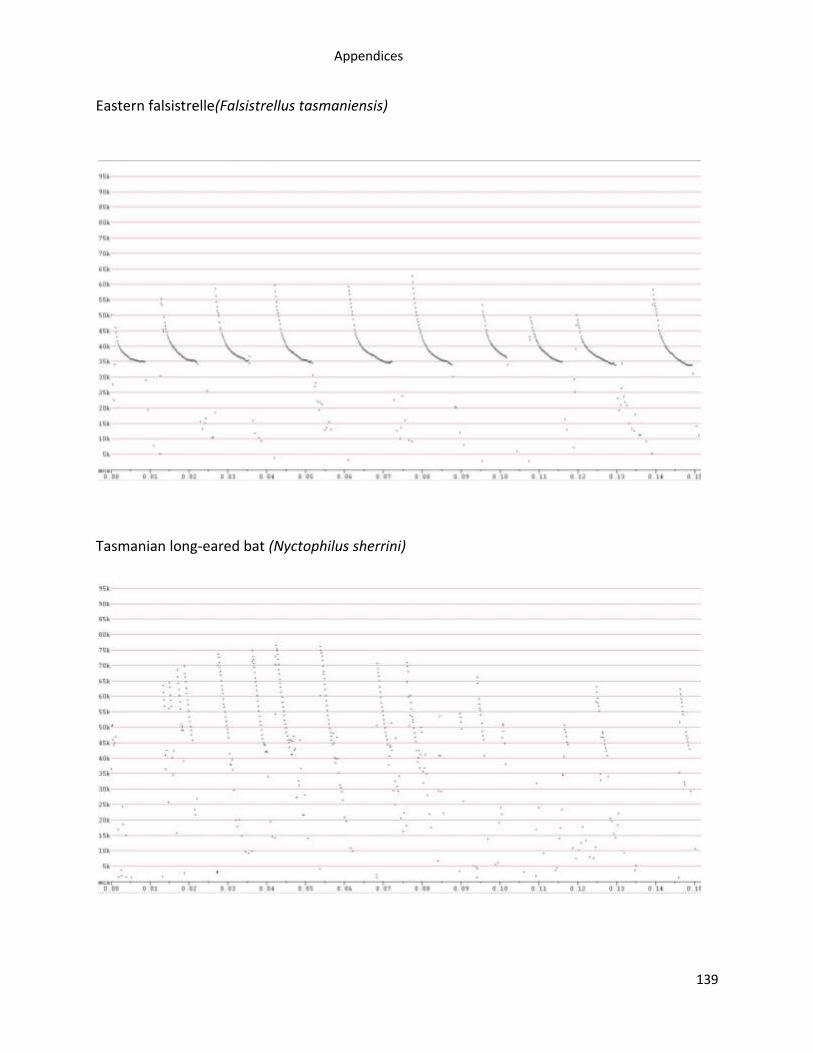
Appendices
139
Eastern falsistrelle(Falsistrellus tasmaniensis)
Tasmanian long-eared bat (Nyctophilus sherrini)
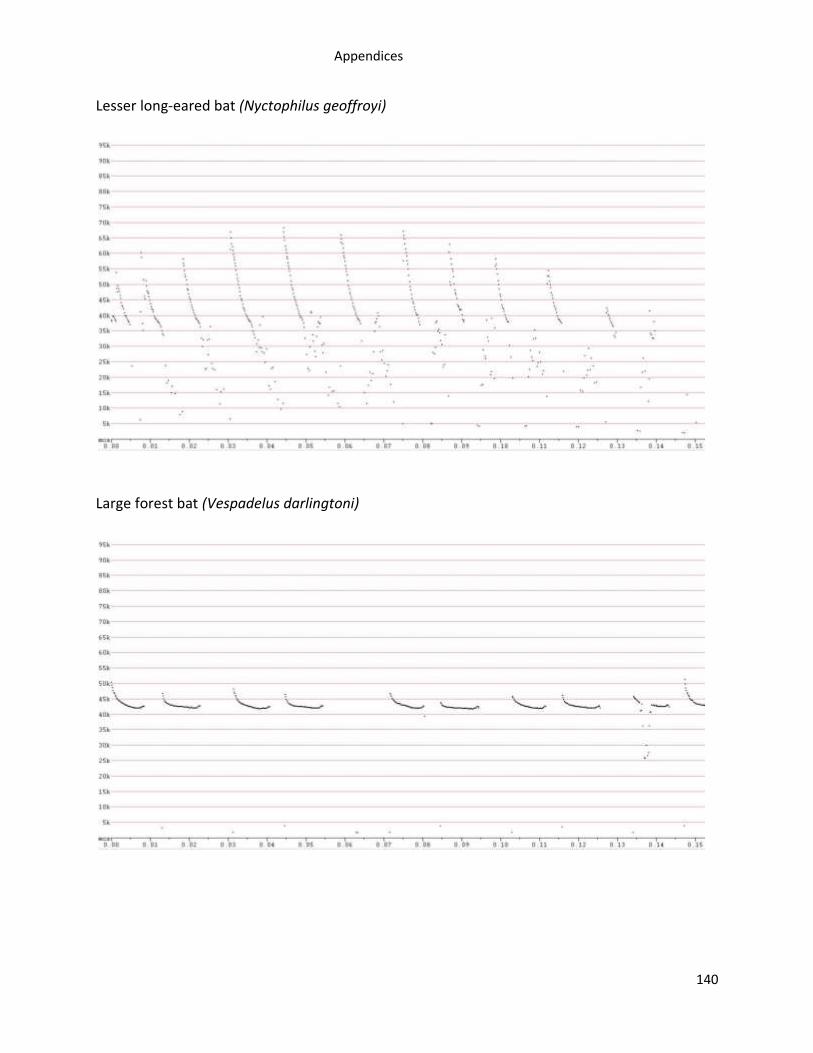
Appendices
140
Lesser long-eared bat (Nyctophilus geoffroyi)
Large forest bat (Vespadelus darlingtoni)
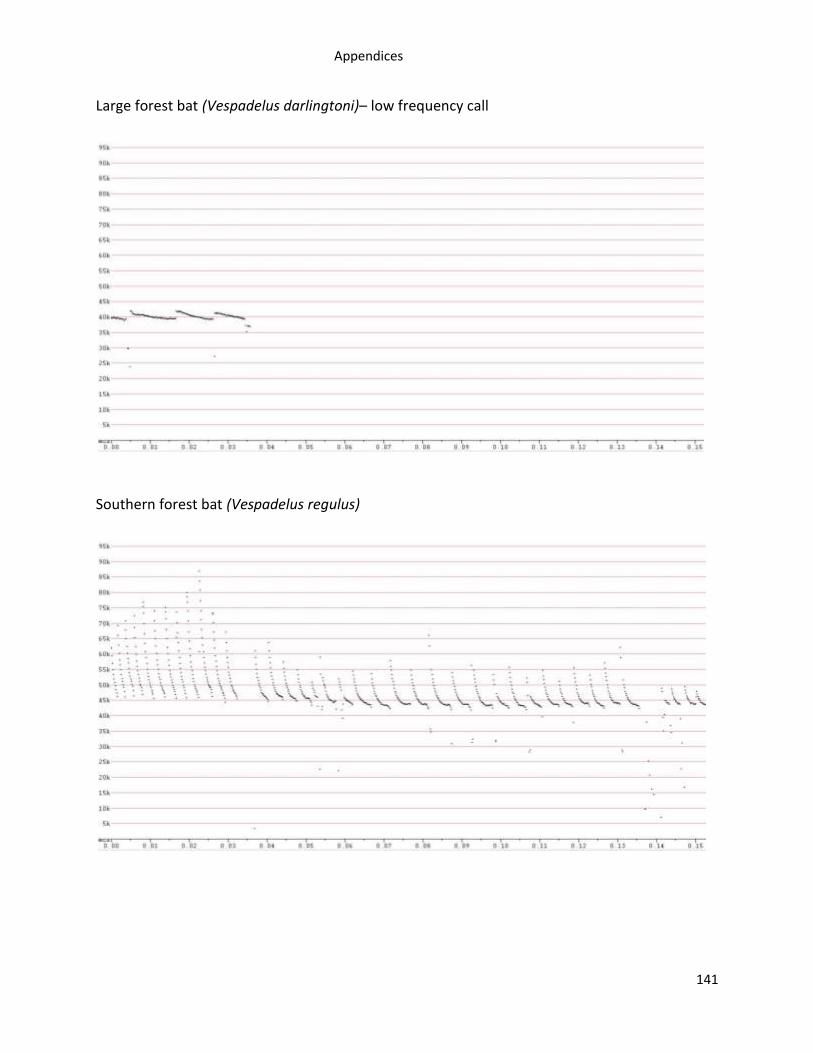
Appendices
141
Large forest bat (Vespadelus darlingtoni)– low frequency call
Southern forest bat (Vespadelus regulus)
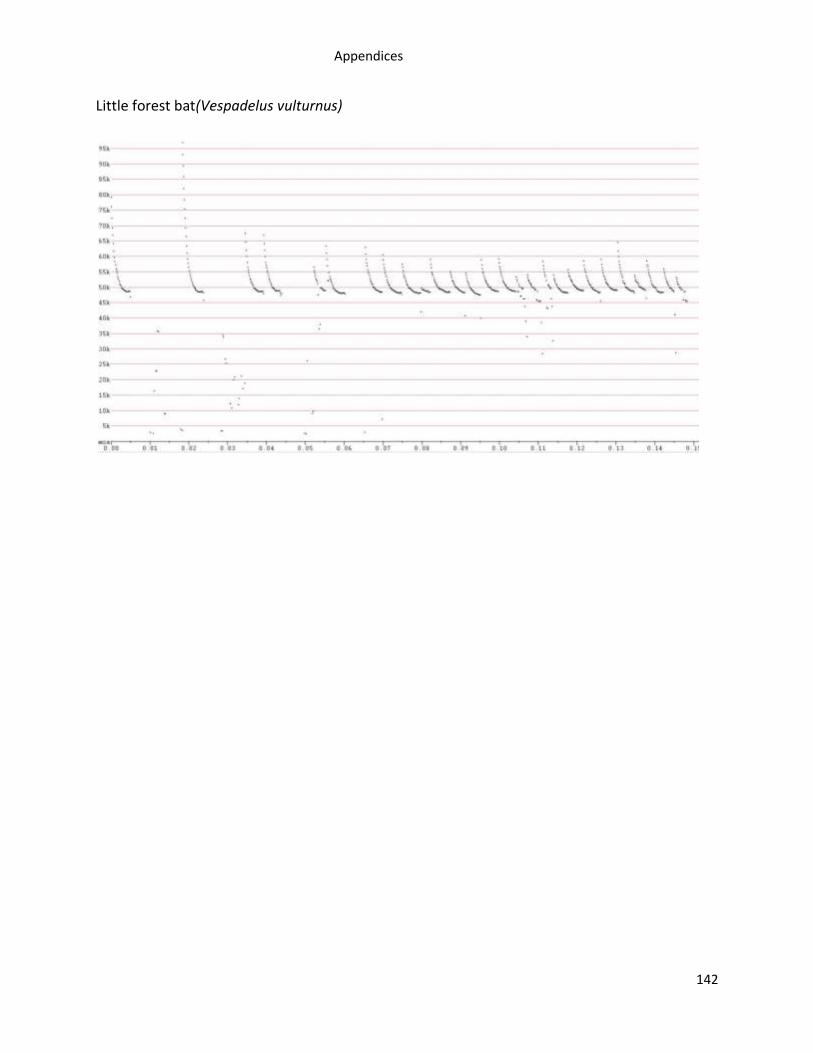
Appendices
142
Little forest bat(Vespadelus vulturnus)

Appendices
143
APPENDIX 2. ANASCHEME BAT CALL IDENTIFICATION KEY
def PulseKey(pulse): tail=end_frequency-model_frequency tail2=end_frequency-minimum_frequency curvxmodelstarslo=model_curvature*model_start_slope start_endslo1=model_start_slope-model_end_slope startxendslop2=model_start_slope*model_end_slope bandwidth=maximum_frequency-minimum_frequency
if model_frequency < 9.9: if model_quality > 0.9: if (end_frequency - start_frequency > 2): return 'noise' if model_quality < 0.9: return 'noise' if within(model_frequency, 10, 16): if model_quality > 0.9: if freq_gap_stdev >372: if duration <9.4 or average_time_between_pulses <15: return 'noise' if duration >9.4 and average_time_between_pulses >15: return 'Tadarida australis' if freq_gap_stdev <372: if average_time_between_pulses <15 or duration <5.1: return 'noise' if average_time_between_pulses >15 and duration >5.1: return 'Tadarida australis' if model_quality < 0.9: return 'noise' if within(model_frequency, 16, 21.5): if model_quality > 0.9: if freq_gap_stdev >372: if duration <5.4: return 'noise' if within(model_frequency, 24, 39.67): if model_end_slope< -1.5193: if model_curvature >=1.06535: if model_curvature>=1.9365: if mean_model_curvature < 2.0365: return 'cgouldi' if model_curvature< 1.9365: return 'Nycto sp.' if model_end_slope >=-1.5193: if model_frequency< 33.07: return 'Chalinolobus gouldii' if model_frequency >=33.0704: return 'Falsistrellus tasmaniensis' if model_end_slope <-1.5193: return 'Nyctophilus sp.' if within(model_frequency, 39.68, 41.51): if model_end_slope< -0.9237: return 'Nyctophilus sp.' if model_end_slope>= -0.9237: return 'Vespadelus darlingtoni' if within(model_frequency, 41.52,44.00): if model_end_slope< -2.4299: return 'Nyctophilus sp.' if model_end_slope>=-2.4299: if model_start_slope>=-4.1064:
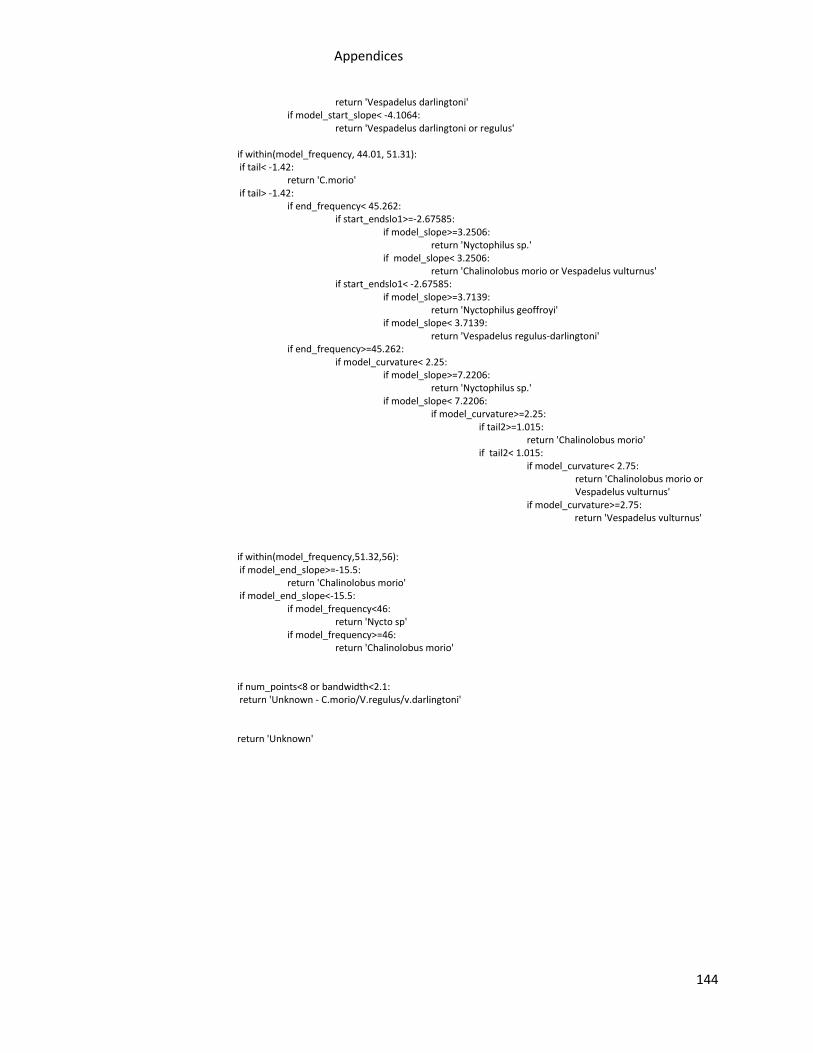
Appendices
144
return 'Vespadelus darlingtoni' if model_start_slope< -4.1064: return 'Vespadelus darlingtoni or regulus' if within(model_frequency, 44.01, 51.31): if tail< -1.42: return 'C.morio' if tail> -1.42: if end_frequency< 45.262: if start_endslo1>=-2.67585: if model_slope>=3.2506: return 'Nyctophilus sp.' if model_slope< 3.2506: return 'Chalinolobus morio or Vespadelus vulturnus' if start_endslo1< -2.67585: if model_slope>=3.7139: return 'Nyctophilus geoffroyi' if model_slope< 3.7139: return 'Vespadelus regulus-darlingtoni' if end_frequency>=45.262: if model_curvature< 2.25: if model_slope>=7.2206: return 'Nyctophilus sp.' if model_slope< 7.2206: if model_curvature>=2.25: if tail2>=1.015: return 'Chalinolobus morio' if tail2< 1.015: if model_curvature< 2.75:
return 'Chalinolobus morio or Vespadelus vulturnus'
if model_curvature>=2.75: return 'Vespadelus vulturnus'
if within(model_frequency,51.32,56): if model_end_slope>=-15.5: return 'Chalinolobus morio' if model_end_slope<-15.5: if model_frequency<46: return 'Nycto sp' if model_frequency>=46: return 'Chalinolobus morio' if num_points<8 or bandwidth<2.1: return 'Unknown - C.morio/V.regulus/v.darlingtoni' return 'Unknown'
Appendices
145
APPENDIX 3. ANTI-PREDATION STRATEGIES IN TASMANIA’S HOLLOW-USING BATS
INTRODUCTION
Predation risk has a major influence on bat behaviour and is considered to be one of the main
selection pressures on roost selection by hollow-using bats(Kunz & Lumsden 2003). However
little is understood about how predators influence bat roost site selection and behaviour.
Observations of predation on bats at roosts are relatively rare (Baker 1962; Borkin & Ludlow
2009; Dwyer 1964; Esberard & Vrcibradic 2007; Hammer & Arlettaz 1998; Twente 1954) and
virtually nothing is known about anti-predation strategies in bats (Lima & O'Keefe 2013;
Petrzelkova & Zukal 2003). If predators influence bat behaviour, than an increase in predation
risk should generally lead to a change in behaviour favouring a safer behavioural option (anti-
predation strategy) most likely at some cost to the bat (i.e. foraging efficiency,
thermoregulation) (Lima & O'Keefe 2013).
One might expect that roost selection by individual bats is in part in response to the day-to-day
variation in predation risk(Lima & O'Keefe 2013). A range of bat roosting behaviour such as
nocturnality, avoidance, coloniality, roost switching, adjusting the times and durations of
emergence, changing the hollow of emergence, clustering during emergence and roost
abandonment have been interpreted as an anti-predation strategy(Fenton et al. 1994;
Petrzelkova & Zukal 2003; Speakman 1991). However there is little information to support or
refute whether bats use these behaviours in response to predation risk and if so, when and in
what situations they are used (Lima & O'Keefe 2013).
Generally most predation on bats is opportunistic with only a few predators specialising on bats
(e.g. The bat hawk, Macheiramphus alcinus) (Jones et al. 2012). Opportunistic bat predators
include several centipede, frog, snake, bird and mammal species (including humans) (Baxter et

Appendices
146
al. 2006; Blainey 1982; de Castro et al. 2011; Esberard & Vrcibradic 2007; Molinari et al. 2005;
Souza et al. 1997; Tidemann 1986). In most regions, owls are thought to be main predators of
bats (Baxter et al. 2006). This is based on bat remains in regurgitated pellets (Garcia et al. 2005;
Green et al. 1986; Hall & Blewett 1964; Khalafalla & Iudica 2012; Lesinski et al. 2012; Rosina &
Shokhrin 2011; Wiley 2010; Yuan Li et al. 2010) and several owl predation events that have
been reported (Baker 1962; Borkin & Ludlow 2009; Olsen 2011; Twente 1954). Bats can be
captured in roosts during the day, presumably while torpid (e.g. by cats) (Scrimgeour et al.
2012) or on the wing as they emerge from roosts at night (e.g. by owls) (Lima & O'Keefe 2013).
In Australia, bats have a range of nocturnal predators including several owl species such as the
southern boobook(Olsen et al. 2008), masked owl (Todd 2012) and barking owl (Stanton 2011);
yawny frogmouths (Nick Mooney and Monika Rhodes pers comm.) and nightjars (Michael
Pennay pers comm.). Other animals observed pursuing or having consumed bats include (but
are unlikely not limited to): wedge tailed eagles, brown falcons, grey goshawks, Australian
hobbys (Nick Mooney pers comm.), Tasmanian devils (Jillian Smith), spotted-tail quolls (Glen &
Dickman 2008), cats (Phillips et al. 2001), foxes (Dwyer 1964) and water rats (Woollard et al.
1978). Information on how bats respond to predation risk by different predators (e.g. Birds
versus mammals), in different situations (e.g. at roosts versus foraging) could provide valuable
insights into habitat and roost choice (Lima & O'Keefe 2013).
This short note describes the situation and response of bats to a predation event by a southern
boobook (Ninox novaeseelandiae) on a maternal colony of chocolate wattled bats (Chalinolobus
morio). I use this observation and anecdotal and published observations to provide insights into
anti-predation strategies used by bats and how predation risk may influence roost use and
behaviour.
Appendices
147
MATERIALS AND METHODS
In January 2011,lactating female Chocolate wattled bats with non-volant young were radio-
tracked to their day-time roosts in Woodsdale, south-east Tasmania, Australia (552488E
5293966N). Roost emergence was monitored by two to three people. Each observation of roost
emergence started approximately 30 minutes before the expected onset of emergence. The
number of bats emerging, inter-species interactions and emergence behavior (e.g. emerging in
clusters) were recorded by observers. Anabat detectors (SD2, Titley electronics, Ballina,
Australia) were used as a secondary method of monitoring bats during emergence by listening
to calls. Moon illumination and sunset times were calculated using the on-line tool time and
date (http://www.timeandate.com). This study was undertaken under the guidelines of the
University of Tasmania Animal Ethics Committee permit #A0010640 and the Department of
Primary Industries Water and the Environment scientific permit #FA09132.
RESULTS
On 13th January 2011 a maternal colony of Chocolate wattled bats were located in a hollow
with a large entrance size (>10cm) in a Eucalypt tree. Bats began emerging at 21:02. Bats
emerged individually, but more often in clusters of up to 40 individuals. At 21:12, a Southern
Boobook was observed on a nearby branch, approximately 20 meters from the roost tree.
After several minutes, the Boobook flew to the roost entrance, hovering in mid-air in a reared
‘sitting position’, wings out, talons open directed into the roost. Bats continued to emerge and
echolocate in clusters despite the presence of the Boobook. After a minute, the Boobook took
flight from the roost and then returned, pursuing emerging bats as they circled the roost tree.
After two failed attempts to capture a bat, an individual bat that had circled the roost tree was
captured by its wing in the Boobook’s talons. The Boobook then pecked the bats body, the bat
became immobile and the Boobook flew into nearby forest out of sight.
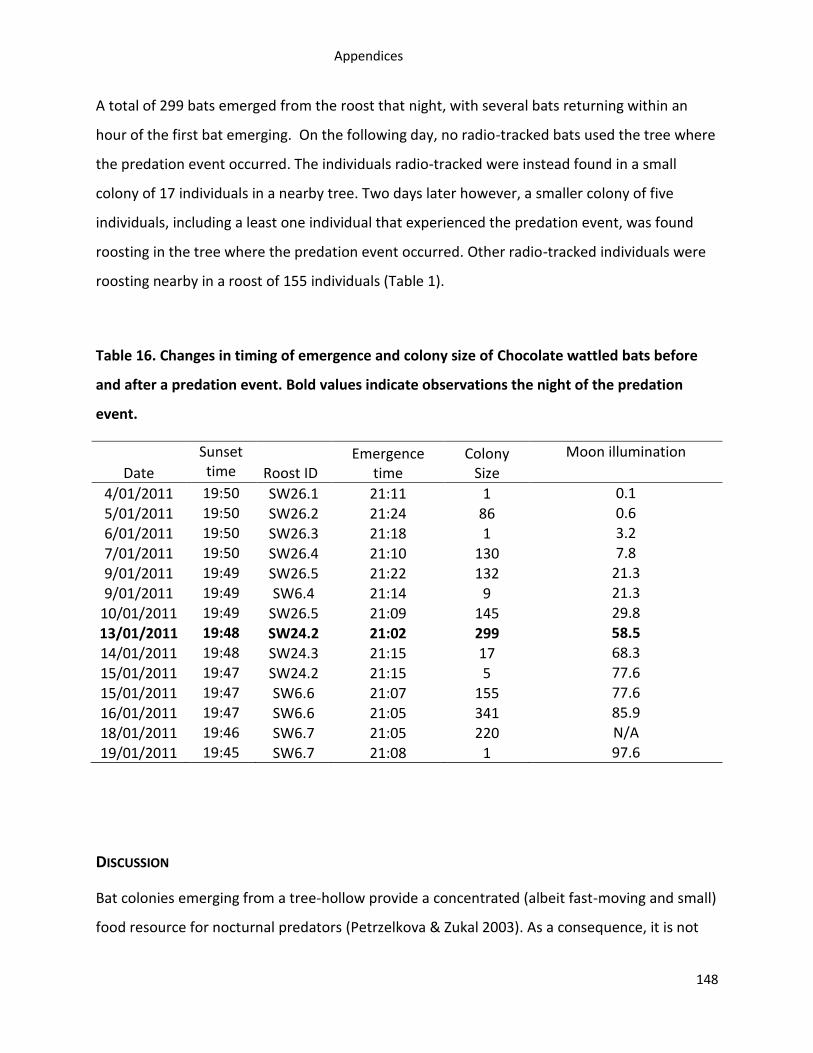
Appendices
148
A total of 299 bats emerged from the roost that night, with several bats returning within an
hour of the first bat emerging. On the following day, no radio-tracked bats used the tree where
the predation event occurred. The individuals radio-tracked were instead found in a small
colony of 17 individuals in a nearby tree. Two days later however, a smaller colony of five
individuals, including a least one individual that experienced the predation event, was found
roosting in the tree where the predation event occurred. Other radio-tracked individuals were
roosting nearby in a roost of 155 individuals (Table 1).
Table 16. Changes in timing of emergence and colony size of Chocolate wattled bats before
and after a predation event. Bold values indicate observations the night of the predation
event.
Date
Sunset time Roost ID
Emergence time
Colony Size
Moon illumination
4/01/2011 19:50 SW26.1 21:11 1 0.1
5/01/2011 19:50 SW26.2 21:24 86 0.6
6/01/2011 19:50 SW26.3 21:18 1 3.2
7/01/2011 19:50 SW26.4 21:10 130 7.8
9/01/2011 19:49 SW26.5 21:22 132 21.3
9/01/2011 19:49 SW6.4 21:14 9 21.3
10/01/2011 19:49 SW26.5 21:09 145 29.8
13/01/2011 19:48 SW24.2 21:02 299 58.5
14/01/2011 19:48 SW24.3 21:15 17 68.3
15/01/2011 19:47 SW24.2 21:15 5 77.6
15/01/2011 19:47 SW6.6 21:07 155 77.6
16/01/2011 19:47 SW6.6 21:05 341 85.9
18/01/2011 19:46 SW6.7 21:05 220 N/A
19/01/2011 19:45 SW6.7 21:08 1 97.6
DISCUSSION
Bat colonies emerging from a tree-hollow provide a concentrated (albeit fast-moving and small)
food resource for nocturnal predators (Petrzelkova & Zukal 2003). As a consequence, it is not
Appendices
149
surprising that bats feature in the diet of nocturnal predators throughout the world. This is
especially so for Owls (Khalafalla and Iudica, Hall and Blewett 1964, Green et al. 1986, Garcia et
al. 2005, Wiley 2010, Yuan Li et al. 2010, Rosina and Shokhrin 2011, Lesinski et al. 2012), which
are able to access and pursue bats in flight (Olsen 2011). It is therefore not surprising that bats
have developed anti-predation strategies. The observations reported in this study demonstrate
some of these strategies in use including clustering, delayed emergence and roost switching.
Clustering during emergence is proposed by Speakman (1992) to be increasingly used in the
presence of a predator to decrease the probability of predation on the individual (safety in
numbers). This strategy appears to be used by several bat species around the world (Fenton et
al. 1994; Petrazelkova & Zukal 2003; Speakman 1995), especially in large colonies where it is
most likely to be effective (Fenton 1994). This strategy seems to be effective, as Owls have
been observed to be unsuccessful at predating upon bats when bats emerge in clusters from
roosts in this study and by others (Temby pers comm; Baker 1962; Twente 1954). Indeed, Owls
seem more successful predating on individual bats in mid-air (Olsen 2011) rather than directly
at a tree hollow roost entrance.
Avoidance is another strategy employed by bats to minimise predation risk. Avoidance may be
in the form of roost-switching (avoiding the location of the predation event) or fleeing the
predator (Kunz & Lumsden 2003). In this study, bats were observed to switch roosts directly
after the predation event. It is difficult to say however, whether this was in response the
predation event, as roost-switching was a frequently observed during the radio-tracking study
(Cawthen et al. unpublished data). Bats may switch roosts to avoid predators which may return
to the roost tree the following night.
An alternative strategy most likely used when roost-switching or clustering is not effective is
delaying the timing of emergence to avoid or reduce the likelihood of predation (Fenton et al.
1994). In my observation, C. morio did not delay emergence in the presence of a predator but
Appendices
150
on the following night in an alternative roost with a smaller colony emergence was delayed.
This may indicate that C. morio could not perceive the increased predation risk when the
Boobook was present or that there was ‘safety in numbers.’ Delayed emergence is not an
uncommon strategy in bats in response to predation risk. Tadarida australis has also been
observed to delay emergence in response to the presence of predators, including humans. This
species also stops echolocating and producing social calls in the presence of predators (Monika
Rhodes pers comm.), a strategy not used by the C. morio in this study. However, because
insectivorous bats are constrained by the emergence times of insects, they may not be capable
of varying their emergence times greatly without effecting foraging efficiency (Baxter et al.
2006; Jones & Rydell 1994).
Bats may not alter their roosting behaviour at all, instead, using evasive manoeuvres in-flight to
avoid predators (Lima & O'Keefe 2013). Although this was not observed in this study, several
instances of evasive manoeuvres have been observed overseas (Lima & O'Keefe 2013) and in
Australia. In Australia, a Saccolaimus flaviventris has been observed being pursued by a Barking
Owl and using an aerobatic strategy to avoid predation. As the Owl approached, the bat pulled
in its wings, dropped out of the Owls flight path and then re-extended its wing and altered
direction (Luke Hogan pers comm.). Bats may also confront their predators in an attempt to
avoid predation. For example, Chalinolobus gouldii has been observed being pursued by a
nightjar and then change its flight to pursue and harass the nightjar (Michael Pennay pers
comm.).
There are a range of anti-predation strategies used by bats which may influence bat habitat and
roost choice, and other bat behaviours. Some of which, such as delayed emergence, are likely
to reduce the amount of time spent foraging, and may result in changes to habitat selection,
potentially reducing bat foraging efficiency. Therefore understanding anti-predation strategies
used by bats is an important component of understanding bat behaviour. Future and previous

Appendices
151
studies should report movements and habitat selection of bats when exposed to predation
events to inform our understanding of anti-predation strategies used by bats.
References
152
REFERENCES Adams, MD, Law, BS & French, KO 2009, 'Vegetation structure influences the vertical stratification of open- and edge-space aerial-foraging bats in harvested forests', Forest Ecology and Management, vol. 258, no. 9, pp. 2090-2100. Adams, MD, Law, BS & Gibson, MS 2010, 'Reliable automation of bat call identification for eastern New South Wales, Australia, using classification trees and Anascheme software', Acta Chiropterologica, vol. 12, no. 1, pp. 231-245. Agranat, ID 2009, Automatically identifying animal species from their vocalizations, <http://www.wildlifeacoustics.com/wp-content/uploads/2011/08/Automatically-Identifying-Animal-Species-from-their-Vocalizations.pdf>. Aldridge, HDJN & Brigham, RM 1988, 'Load carrying and maneuverability in an insectivorous nat: a test of the 5% "rule" of radio-telemetry', Journal of Mammalogy, vol. 69, no. 2, pp. 379-382. Allchin, R, Kirkpatrick, J & Kriwoken, L 2013, 'On Not Protecting the Parrot: Impact of Conservation and Planning Legislation on an Endangered Species in Tasmania', Journal of International Wildlife Law and Policy, vol. 16, no. 1, pp. 81-104. Allison, FR 1989, 'Molossidae', in DW Watlon & BJ Richardson (eds), Volume 1B Mammalia., Australian Government Publishing Service, Canberra, pp. 892-909. Altringham, JD 2011, Bats: From Evolution to Conservation, Second edition edn, Oxford University Press, Oxford. Ammerman, LK, Lee, DN & Tipps, TM 2012, 'First molecular phylogenetic insights into the evolution of free-tailed bats in the subfamily Molossinae (Molossidae, Chiroptera)', Journal of Mammalogy, vol. 93, no. 1, pp. 12-28. Antongiovanni, M & Metzger, JP 2005, 'Influence of matrix habitats on the occurrence of insectivorous bird species in Amazonian forest fragments', Biological Conservation, vol. 122, no. 3, pp. 441-451. Arlettaz, R, Ruchet, C, Aeschimann, J, Brun, E, Genoud, M & Vogel, P 2000, 'Physiological traits affecting the distribution and wintering strategy of the bat Tadarida teniotis', Ecology, vol. 81, no. 4, pp. 1004-1014. Armitage, DW & Ober, HK 2011, 'A comparison of supervised learning techniques in the classification of bat echolocation calls', Ecological Informatics, vol. 5, no. 6, pp. 465-473. Armstrong, KN & Coles, RB 2007, 'Echolocation call frequency differences between geographic isolates of Rhinonicteris aurantia (Chiroptera: Hipposideridae): Implications of nasal chamber size', Journal of Mammalogy, vol. 88, no. 1, pp. 94-104.
References
153
Azevedo-Ramos, C, de Carvalho Jr, O & do Amaral, BD 2006, 'Short-term effects of reduced-impact logging on eastern Amazon fauna', Forest Ecology and Management, vol. 232, no. 1-3, pp. 26-35. Badwaik, NK & Rasweiler, JJ 2000, 'Pregnancy', in EG Crichton & PH Krutzsch (eds), Reproductive Biology of Bats, Academic Press, London. Baker, JK 1962, 'The manner and efficient of raptor predation on bats', Condor, vol. 64, pp. 500-504. Baker, SC, Grove, SJ, Forster, L, Bonham, KJ & Bashford, D 2009, 'Short-term responses of ground-active beetles to alternative silvicultural systems in the Warra Silvicultural Systems Trial, Tasmania, Australia', Forest Ecology and Management, vol. 258, no. 4, pp. 444-459. Baker, SC & Read, SM 2011, 'Variable retention silviculture in Tasmania's wet forests: ecological rationale, adaptive management and synthesis of biodiversity benefits', Australian Forestry, vol. 74, no. 3, pp. 218-232. Banks, SC, Lindenmayer, DB, Wood, JT, McBurney, L, Blair, D & Blyton, MDJ 2013, 'Can Individual and Social Patterns of Resource Use Buffer Animal Populations against Resource Decline?' PLoS ONE, vol. 8, no. 1. Banks, SC, Piggott, MP, Stow, AJ & Taylor, AC 2007, 'Sex and sociality in a disconnected world: A review of the impacts of habitat fragmentation on animal social interactions', Canadian Journal of Zoology, vol. 85, no. 10, pp. 1065-1079. Banks, SC, Ward, SJ, Lindenmayer, DB, Finlayson, GR, Lawson, SJ & Taylor, AC 2005, 'The effects of habitat fragmentation on the social kin structure and mating system of the agile antechinus, Antechinus agilis', Molecular Ecology, vol. 14, no. 6, pp. 1789-1801. Barclay, RMR 1999, 'Bats are not birds - A cautionary note on using echolocation calls to identify bats: A comment', Journal of Mammalogy, vol. 80, no. 1, pp. 290-296. Barclay, RMR & Kurta, A 2007, 'Ecology and behaviour of bats roosting in tree cavities and under bark', in MJ Lacki, JP Hayes & A Kurta (eds), Bats in forests: Conservation and management, Johns hopkins university press. Barlow, J, Peres, CA, Henriques, LMP, Stouffer, PC & Wunderle, JM 2006, 'The responses of understorey birds to forest fragmentation, logging and wildfires: An Amazonian synthesis', Biological Conservation, vol. 128, no. 2, pp. 182-192. Baxter, DJM, Psyllakis, JM, Gillingham, MP & O'Brien, EL 2006, 'Behavioural response of bats to perceived predation risk while foraging', Ethology, vol. 112, no. 10, pp. 977-983. Behr, O & Von Helversen, O 2004, 'Bat serenades - Complex courtship songs of the sac-winged bat (Saccopteryx bilineata)', Behavioral Ecology and Sociobiology, vol. 56, no. 2, pp. 106-115. Bernard, RTF & Tsita, JN 1995, Seasonally monoestrous reproduction in the molossid bat, Tadarida aegyptiaca from low temperate latitudes (33°S) in South Africa, vol. 30, 2011.
References
154
Biscardi, S, Orprecio, J, Fenton, MB, Tsoar, A & Ratcliffe, JM 2004, 'Data, sample sizes and statistics affect the recognition of species of bats by their echolocation calls', Acta Chiropterologica, vol. 6, no. 2, pp. 347-363. Blainey, G 1982, Triumph of the nomads: a history of ancient Australia, Macmillan, Hong Kong Bogdanowicz, Wa 1990, 'Geographic variation and taxonomy of Daubenton's bat, Myotis daubentoni, in europe', Journal of Mammalogy, vol. 71, no. 2, pp. 205-218. Boland, JL, Hayes, JP, Smith, WP & Huso, MM 2009, 'Selection of day-roosts by Keen's myotis (Myotis Keenii) at multiple spatial scales', Journal of Mammalogy, vol. 90, no. 1, pp. 222-234. Borkin, KM & Ludlow, E 2009, 'Notes on New Zealand mammals 9: long-tailed bat (Chalinolobus tuberculatus) chased by morepork (Ninox novaeseelandiae)', New Zealand Journal of Zoology, vol. 36, no. 1, pp. 11-12. Borkin, KM, O'Donnell, C & Parsons, S 2011, 'Bat colony size reduction coincides with clear-fell harvest operations and high rates of roost loss in plantation forest', Biodiversity and Conservation, pp. 1-12. Boucher, N 2012, 'Some ways in which SoundID will change bio-acoustics for bats', in Australian Bat Society Conference workshop, Kingslake. Boucher, N, Jinnai, M & Smolders, A 2012, 'A fully automatic wildlife acoustic monitor and survey system', paper presented to Acoustics 2012 Nantes Conference, Nantes, France. Boughey, KL, Lake, IR, Haysom, KA & Dolman, PM 2012, 'Improving the biodiversity benefits of hedgerows: How physical characteristics and the proximity of foraging habitat affect the use of linear features by bats', Biological Conservation, vol. 144, no. 6, pp. 1790-1798. Breiman, L 2001, 'Random Forests', Machine Learning, vol. 45, pp. 5 - 32. Brigham, RM, Francis, RL & Hamdorf, S 1997, 'Microhabitat use by two species of nyctophilus bats: A test of ecomorphology theory', Australian Journal of Zoology, vol. 45, no. 6, pp. 553-560. Britzke, ER, Duchamp, JE, Murray, KL, Swihart, RK & Robbins, LW 2011, 'Acoustic identification of bats in the eastern United States: A comparison of parametric and nonparametric methods', The Journal of Wildlife Management, vol. 75, no. 3, pp. 660-667. Brooks, RT 2011, 'Declines in summer bat activity in central New England 4-years following the initial detection of white-nose syndrome', Biodiversity and Conservation, pp. 1-5. Brown, M, Chaston, D, Cooney, A, Maddali, D & Price, T 2009, 'Recognising bird songs - comparative study', pp. 1-10. Buchanan, GD & Young Lai, EV 1988, 'Plasma progesterone concentrations in female little brown bats (Myotis lucifugus) during hibernation', Journal of Reproduction and Fertility, vol. 83, no. 1, pp. 59-65.
References
155
Bullen, B & Ford, S 2012, 'More evidence of the effect of climate change on Western Australian bats', The Australasian Bat Society Newsletter, vol. 39, p. 28. Bullen , R & McKenzie , N 2001, 'Differentiating Western Australian nyctophilus (Chiroptera: Vespertilionidae) echolocation calls.' Australian Mammalogy, vol. 23 no. 2, pp. 89-93. Bullen, RD & McKenzie, NL 2005, 'Seasonal range variation of Tadarida australis (Chiroptera : Molossidae) in Western Australia: The impact of enthalpy', Australian Journal of Zoology, vol. 53, no. 3, pp. 145-156. Burke, DM & Nol, E 1998, 'Influence of food abundance, nest-site habitat, and forest fragmentation on breeding Ovenbirds', Auk, vol. 115, no. 1, pp. 96-104. Burton, PJ, Balisky, AC, Coward, LP, Cumming, SG & Kneeshaw, DD 1992, 'The value of managing for biodiversity', Forestry Chronicle, vol. 68, no. 2, pp. 225-237. Campbell, S, Guay, PJ, Mitrovski, PJ & Mulder, R 2009, 'Genetic differentiation among populations of a specialist fishing bat suggests lack of suitable habitat connectivity', Biological Conservation, vol. 142, no. 11, pp. 2657-2664. Carter, TC & Feldhamer, GA 2005, 'Roost tree use by maternity colonies of Indiana bats and northern long-eared bats in southern Illinois', Forest Ecology and Management, vol. 219, no. 2-3, pp. 259-268. Carver, BD & Ashley, N 2008, 'Roost tree use by sympatric Rafinesque's big-eared bats (Corynorhinus rafinesquii) and southeastern myotis (Myotis austroriparius)', American Midland Naturalist, vol. 160, no. 2, pp. 364-373. Caryl, FM, Quine, CP & Park, KJ 2012, 'Martens in the matrix: The importance of nonforested habitats for forest carnivores in fragmented landscapes', Journal of Mammalogy, vol. 93, no. 2, pp. 464-474. Caryl, FM, Thomson, K & Van der Ree, R in press 'Permeability of the urban matrix to arboreal gliding mammals: Sugar gliders in Melbourne, Australia', Austral Ecology. Castelletta, M, Thiollay, JM & Sodhi, NS 2005, 'The effects of extreme forest fragmentation on the bird community of Singapore Island', Biological Conservation, vol. 121, no. 1, pp. 135-155. Cawthen, L & Munks, S 2011, 'The use of hollow-bearing trees retained in multi-aged regenerating production forest by the Tasmanian common brushtail possum (Trichosurus vulpecula fuliginosus)', Wildlife Research, vol. 38, no. 8, pp. 687-695. Cawthen, L, Utesch, M, Koch, N & Munks, S 2012, 'Insectivorous bat activity in timber production forests in the headwaters of the South Esk River, North East Tasmania', Australian Zoologist, vol. 36, no. 1. Churchill, S 2009, Australian bats, Second edn, vol. 2nd edition, Allen & Unwin. ClimateWatch 2012, Bat listening results: October - December 2010, Earthwatch institute, viewed 06/06/2012 2012, <http://www.climatewatch.org.au/news/4f4465a8eebda9761800013b>.
References
156
Cory Toussaint, D, McKechnie, AE & van der Merwe, M 2010, 'Heterothermy in free-ranging male Egyptian free-tailed bats (Tadarida aegyptiaca) in a subtropical climate', Mammalian Biology, vol. 75, no. 5, pp. 466-470. Cox, S 2010, 'Grey-headed flying-foces sighted in Adelaide's eastern suburbs', Department of Environment and Heritage, p. 1. Cryan, PM, Jameson, JW, Baerwald, EF, Willis, CKR, Barclay, RMR, Snider, EA & Crichton, EG 2012, 'Evidence of late-summer mating readiness and early sexual maturation in migratory tree-roosting bats found dead at wind turbines', PLoS ONE, vol. 7, no. 10. Currie, WB, Blake, M & Wimsatt, WA 1988, 'Fetal development, and placental and maternal plasma concentrations of progesterone in the little brown bat (Myotis lucifugus)', Journal of Reproduction and Fertility, vol. 82, no. 1, pp. 401-407. Cutler, DR, Edwards Jr, TC, Beard, KH, Cutler, A, Hess, KT, Gibson, J & Lawler, JJ 2007, 'Random forests for classification in ecology', Ecology, vol. 88, no. 11, pp. 2783-2792. Daniel, S, Korine, C & Pinshow, B 2010, 'Foraging behavior of a desert dwelling arthropod-gleaning bat (Otonycteris hemprichii) during pregnancy and nursing', Acta Chiropterologica, vol. 12, no. 2, pp. 293-299. Dark, J, Johnston, PG, Healy, M & Zucker, I 1983, 'Latitude of origin influences photoperiodic control of reproduction of deer mice (Peromyscus maniculatus)', Biology of Reproduction, vol. 28, no. 1, pp. 213-220. De'ath, G & Fabricius, K 2000, 'Classification and regression trees: A powerful yet simple techinque for ecological data analysis', Ecology, vol. 8, no. 11, pp. 3178-3192. de Castro, IJ, Silva, CR, da Costa, AJS & Martins, ACM 2011, 'Opportunistic predation of Artibeus planirostris (Spix, 1823) and Carollia perspicillata (Linnaeus, 1758) (Chiroptera, Phyllostomidae) by marsupials and anuran in the APA do Rio Curiaú, Amapá State, Brazil ', Acta Amazonica, vol. 41, no. 1, pp. 171-174. De Oliveira, MC, Smith, GC & Hogan, LD 1999, 'Current limitations in the use of bat detectors to assess the impact of logging - A pilot study in south-east Queensland', Australian Zoologist, vol. 31, no. 1, pp. 110-117. Dixon, KJ 2000, 'Energetics of Nyctophilus geoffroyi in Tasmania', Honours thesis, University of Tasmania. Dixon, KJ & Rose, RW 2003, 'Thermal energetics of Nyctophilus geoffroyi (Chiroptera: Vespertilionidae) at the southern limits of its distribution', Australian Journal of Zoology, vol. 51, no. 1, pp. 43-50. Dodd, LE, Lacki, MJ, Britzke, ER, Buehler, DA, Keyser, PD, Larkin, JL, Rodewald, AD, Wigley, TB, Wood, PB & Rieske, LK 2012, 'Forest structure affects trophic linkages: How silvicultural disturbance impacts bats and their insect prey', Forest Ecology and Management, vol. 267, no. 1, pp. 262-270.

References
157
Downs, NC & Racey, PA 2006, 'The use by bats of habitat features in mixed farmland in Scotland', Acta Chiropterologica, vol. 8, no. 1, pp. 169-185. Driessen, M 2010, 'Recent sightings of flying foxes in Tasmania', The Tasmanian Naturalist, vol. 132, pp. 35-39. Driessen, M, Brereton, R & Pauza, P 2011, 'Status and conservation of Tasmanian bats', in B Law, P Eby, D Lunney & L Lumsden (eds), The Biology and Conservation of Australasian bats, Royal Zoological Society of New South Wales, pp. 324-336. Duchamp, JE, Sparks, DW & Swihart, RK 2010, 'Exploring the "nutrient hot spot" hypothesis at trees used by bats', Journal of Mammalogy, vol. 91, no. 1, pp. 48-53. Duffy, AM, Lumsden, LF, Caddle, CR, Chick, RR & Newell, GR 2000, 'The efficacy of Anabat ultrasonic detectors and harp traps for surveying microchiropterans in south-eastern Australia', Acta Chiropterologica, vol. 2, no. 2, pp. 127-144. Dwyer, PD 1964, 'Fox predation on cave-bats', Australian Journal of Science, vol. 26, pp. 397–398. Esberard, CEL & Vrcibradic, D 2007, 'Snakes preying on bats: New records from Brazil and a review of recorded cases in the Neotropical Region', Revista Brasileira de Zoologia, vol. 24, no. 3, pp. 848-853. Ethier, K & Fahrig, L 2011, 'Positive effects of forest fragmentation, independent of forest amount, on bat abundance in eastern Ontario, Canada', Landscape Ecology, vol. 26, no. 6, pp. 865-876. FAO 2010, Global forest resources assessment 2010: main report, Rome. Felton, A, Lindbladh, M, Brunet, J & Fritz, A 2010, 'Replacing coniferous monocultures with mixed-species production stands: An assessment of the potential benefits for forest biodiversity in northern Europe', Forest Ecology and Management, vol. 260, no. 6, pp. 939-947. Fenton, BM, Rautenbach, IL, Smith, CM, Grosell, J & Van Jaarsveld, J 1994, 'Raptors and bats: threats and opportunities', Animnal behaviour, vol. 48, pp. 9-18. Fenton, MB 2003, 'Science and the conservation of bats: Where to next?' WIldlife Society Bulletin, vol. 31, no. 1, pp. 6-15. Fischer, J, Stott, J & Law, BS 2010, 'The disproportionate value of scattered trees', Biological Conservation, vol. 143, no. 6, pp. 1564-1567. Flynn, EM, Jones, SM, Jones, ME, Jordan, GJ & Munks, SA 2011a, 'Characteristics of mammal communities in Tasmanian forests: exploring the influence of forest type and disturbance history', Wildlife Research, vol. 38, no. 1, pp. 13-29 Flynn, EM, Munks, SA & Jones, SM 2011b, 'Influences of forest type and disturbance on reproduction of the brushtail possum (Trichosurus vulpecula)', Journal of Mammalogy, vol. 92, no. 5, pp. 1050-1059.
References
158
Ford, HA, Barrett, GW, Saunders, DA & Recher, HF 2001, 'Why have birds in the woodlands of southern Australia declined?' Biological Conservation, vol. 97, no. 1, pp. 71-88. Forest Practices Authority 2007, State of The Forests Tasmania 2006, Forest Practices Authority, Hobart, Tasmania Forest Practices Authority 2012, State of the forests Tasmania 2012, Hobart, Tasmania Forest Practices Authority. 2005, Forest Botany Manual Module 4 Freycinet Region, Forest Practices Authority, Tasmania. Forest Practices Authority. 2011, Mature habitat availablity map, Forest Practices Authority Hobart, Tasmania Forest Practices Board 2000, Forest Practices Code, Forest Practices Authority, Hobart. Forest Stewardship Council. 1996, FSC principles and criteria for forest stewardship Bonn, Germany Fueser, M 1997, 'Echolocation behaviour of Tasmanian Bats (Echoortung asmanischer Fledermause)', MSc Thesis thesis, Eberhard-Karls Universisat Tubingen. Gannon, WL, O'Farrell, M, Corben, C & Bedrick, EJ 2004, 'Call Character lexicon and analysis of field recorded bat echolocation calls', in T Moss & M Vater (eds), Echolocation in bats and dolphins, University of Chicago Press, Chicago, pp. 478-486. Garcia, AM, Cervera, F & Rodriguez, A 2005, 'Bat predation by long-eared owls in mediterranean and temperatre regions of southern europe', Journal of Raptor Research, vol. 39, no. 4, pp. 445-453. Georgiakakis, P & Russo, D 2012, 'The distinctive structure of social calls by Hanaki's dwarf bat Pipistrellus hanaki', Acta Chiropterologica, vol. 14, no. 1, pp. 167-174. Gibbons, P & Lindenmayer, D 2002, Tree Hollows and Wildlife Conservation In Australia, CSIRO Publishing, Collingwood. Gibson, M & Lumsden, L 2003, 'The AnaScheme automated bat call identification system', Australasian Bat Society Newsletter, vol. 20, pp. 24-26. Glen, AS & Dickman, CR 2008, 'Niche overlap between marsupial and eutherian carnivores: Does competition threaten the endangered spotted-tailed quoll?' Journal of Applied Ecology, vol. 45, no. 2, pp. 700-707. Goldingay, RL 2009, 'Characteristics of tree hollows used by Australian birds and bats', Wildlife Research, vol. 36, no. 5, pp. 394-409. Green, RH 1965, 'Observations on the little brown bat Eptesicus pumilus Gray in Tasmania', Records of the Queen Victoria Museum, vol. 20, pp. 1-16.
References
159
Green, RH 1966, 'Notes on the lesser long-eared bat Nyctophilus geoffroyi in northern Tasmania', Records of the Queen Victoria Museum, vol. 22, pp. 1-4. Green, RH 1988, 'Beetles in Bat dung', The Tasmanian Naturalist, vol. 94, pp. 6-7. Green, RH & Rainbird, JL 1984, 'The bat genus Eptesicus Gray in Tasmania', The Tasmanian Naturalist, vol. 76, pp. 1-5. Green, RH, Rainbird, JL & McQuillian, PB 1986, 'Food of the southern boobook Ninox novaeseelandiae', Tasmanian Naturalist, vol. 86, pp. 1-3. Greiner, S, Dehnhard, M & Voigt, CC 2011a, 'Differences in plasma testosterone levels related to social status are more pronounced during mating than nonmating season in the tropical bat Saccopteryx bilineata (greater sac-winged bat)', Canadian Journal of Zoology, vol. 89, no. 12, pp. 1157-1163. Greiner, S, Schwarzenberger, F & Voigt, CC 2011b, 'Predictable timing of oestrus in the tropical bat Saccopteryx bilineata living in a Costa Rican rain forest', Journal of Tropical Ecology, vol. 27, no. 2, pp. 121-131. Grindal, SD & Brigham, RM 1998, 'Short-term effects of small-scale habitat disturbance on activity by insectivorous bats', The Journal of Wildlife Management, vol. 62, no. 3, pp. 996-1003. Grove, S & Yaxley, B 2005, 'Wildlife habitat strips and native forest ground-active beetle assemblages in plantation nodes in northeast Tasmania', Australian Journal of Entomology, vol. 44, no. 4, pp. 331-343. Grove, SJ 'Do wildlife habitat strips act as refuges for mature-forest carabid beetle assemblages? A case-study in Tasmanian wet eucalypt forest, Australia', Forest Ecology and Management, vol. 259, no. 3, pp. 496-504. Hall, JS & Blewett, CH 1964, 'Bat remains in owl pellets from missouri', Journal of Mammalogy, vol. 45, no. 2, pp. 303-304. Hall, LS & Woodside, DP 1989, 'Vespertilionidae', Fauna of Australia 1B Mammalia. Fauna of Australia Series. Australian Government Publishing Service. Canberra, Australia, pp. 903-943. Hammer, M & Arlettaz, R 1998, 'A case of snake predation upon bats in northern Morocco: Some implications for designing bat grilles', Journal of Zoology, vol. 245, no. 2, pp. 211-212. Hanspach, J, Fischer, J, Ikin, K, Stott, J & Law, BS 2012, 'Using trait-based filtering as a predictive framework for conservation: a case study of bats on farms in southeastern Australia', Journal of Applied Ecology, pp. no-no. Happold, DCD & Happold, M 1990, 'Reproductive strategies of bats in Africa', Journal of Zoology, vol. 222, no. 4, pp. 557-583. Hardin Waddle, J, Thigpen, TF & Gloriosa, BM 2009, 'Effiacy of automatic vocalization: Recognition software for anuran monitoring', Terpetological Conservation and Biology, vol. 4, no. 3, pp. 384-388.
References
160
Harris, JA 1999, 'Review and methodological considerations in research on testosterone and aggression', Aggression and Violent Behavior, vol. 4, no. 3, pp. 273-291. Haseler, M & Taylor, R 1993, 'Use of Tree Hollows by Birds in Sclerophyll Forest in North-eastern Tasmania', Tasforests, pp. 51-56. Hayes, JP 1997, 'Temporal variation in activity of bats and the design of echolocation-monitoring studies', Journal of Mammalogy, vol. 78, no. 2, pp. 514-524. Heideman, PD 2000, 'Environmental Regulation of Reproduction', in EG Crichton & PH Krutzsch (eds), Reproductive Biology of Bats, Academic Press, London, pp. 470-499. Herr, A, Klomp, NI & Atkinson, JS 1997, 'Identification of bat echolocation calls using a decision tree classification system', Complexity International, vol. 4. Hogberg, LK, Patriquin, KJ & Barclay, RMR 2002, 'Use by bats of patches of residual trees in logged areas of the boreal forest', American Midland Naturalist, vol. 148, no. 2, pp. 282-288. Hosken, DJ 1997, 'Reproduction and the Female Reproductive Cycle of Nyctophilus geoffroyi and N.major (Chiroptera:Vespertilionidae) from south-western Australia', Australian Journal of Zoology, vol. 45, pp. 489-504. Hosken, DJ, Blackberry, MA, Stewart, TB & Stucki, AF 1998, 'The male reproductive cycle of three species of Australian vespertilionid bat', Journal of Zoology, vol. 245, no. 3, pp. 261-270. Hosken, DJ, O'Shea, JE & Blackberry, MA 1996, 'Blood plasma concentrations of progesterone, sperm storage and sperm viability and fertility in Gould's wattled bat (Chalinolobus gouldii)', Journal of Reproduction and Fertility, vol. 108, no. 2, pp. 171-177. Hourigan, CL, Catterall, CP, Jones, D & Rhodes, M 2008, 'A comparison of the effectiveness of bat detectors and harp traps for surveying bats in an urban landscape', Wildlife Research, vol. 35, no. 8, pp. 768-774. Hughes, AC, Satasook, C, Bates, PJJ, Bumrungsri, S & Jones, G 2012, 'The projected effects of climatic and vegetation changes on the distribution and diversity of Southeast Asian bats', Global Change Biology, vol. 18, no. 6, pp. 1854-1865. Hull, CL & Cawthen, L 2013, 'Bat fatalities at two wind farms in Tasmania, Australia: bat characteristics, and spatial and temporal patterns', New Zealand Journal of Zoology, vol. 40, no. 1, pp. 5-15. Humphries, MM, Thomas, DW & Speakman, JR 2002, 'Climate-mediated energetic constraints on the distribution of hibernating mammals', Nature, vol. 418, no. 6895, pp. 313-316. Hutson, AM, Mickelburgh, SP & Racey, PA 2001, Microchiropteran Bats: Global Status Survey and Conservation Action Plan. Inada, M 2006, 'Acoustical survey on winter activity of Tasmanian bats: a comparative study', Honours thesis, University of Tasmania
References
161
Inada, M 2010, 'Tasmanian bat ecology: Conservation of native fauna', Masters thesis, University of Tasmania. Jennings, N, Parsons, S & Pocock, MJO 2008, 'Human vs. machine: Identification of bat species from their echolocation calls by humans and by artificial neural networks', Canadian Journal of Zoology, vol. 86, no. 5, pp. 371-377. Johnson, GD, Perlik, MK, Erickson, WP & Strickland, MD 2004, 'Bat activity, composition, and collision mortality at a large wind plant in Minnesota', WIldlife Society Bulletin, vol. 32, no. 4, pp. 1278-1288. Jokimäki, J & Huhta, E 1996, 'Effects of landscape matrix and habitat structure on a bird community in northern Finland: A multi-scale approach', Ornis Fennica, vol. 73, no. 3, pp. 97-113. Jones, G & Corben, C 1993, 'Echolocation calls from six species of microchiropteran bats in south-eastern Queensland', Australian Mammalogy, vol. 16, no. 1, pp. 35-38. Jones, G, Jacobs, DS, Kunz, TH, Wilig, MR & Racey, PA 2009, 'Carpe noctem: The importance of bats as bioindicators', Endangered Species Research, vol. 8, no. 1-2, pp. 93-115. Jones, G & Rydell, J 1994, 'Foraging strategy and predation risk as factors influencing emergence time in echolocating bats', Philosophical Transactions of the Royal Society B: Biological Sciences, vol. 346, no. 1318, pp. 445-455. Jones, G & Siemers, BM 2011, 'The communicative potential of bat echolocation pulses', Journal of Comparative Physiology A: Neuroethology, Sensory, Neural, and Behavioral Physiology, vol. 197, no. 5, pp. 447-457. Jones, LR, Black, HL & White, CM 2012, 'Evidence for vonvergent evolution in gape morphology of the bat hawk (Macheiramphus alcinus) with wwifts, swallows, and goatsuckers', Biotropica, vol. 44, no. 3, pp. 386-393. Jones, SM & Rose, RW 1992, 'Plasma progesterone levels in the pregnant female rat-kangaroo (Bettongia gaimardi)', General and Comparative Endocrinology, vol. 87, no. 2, pp. 178-182. Jung, K, Kaiser, S, Böhm, S, Nieschulze, J & Kalko, EKV 2012, 'Moving in three dimensions: Effects of structural complexity on occurrence and activity of insectivorous bats in managed forest stands', Journal of Applied Ecology, vol. 49, no. 2, pp. 523-531. Kabat, AP & Kincade, T 2000, 'A portable device for restraining small bats', Australian Mammalogy, vol. 21, no. 2, pp. 249-250. Kalcounis, MC, Hobson, KA, Brigham, RM & Hecker, KR 1999, 'Bat activity in the boreal forest: Importance of stand type and vertical strata', Journal of Mammalogy, vol. 80, no. 2, pp. 673-682. Kennedy, J-P 2011, 'Bat activity across the vertifical gradient of an old-growth redwood forest', Masters thesis, Humboldt State University.
References
162
Keyser, AJ, Hill, GE & Soehren, EC 1998, 'Effects of forest fragment size, nest density, and proximity to edge on the risk of predation to ground-nesting passerine birds', Conservation Biology, vol. 12, no. 5, pp. 986-994. Khalafalla, SM & Iudica, CA 2012, 'Barn owl (Tyto alba) predation on big brown bats (Eptesicus fuscus) in Pennsylvania', Canadian Field-Naturalist, vol. 126, no. 1, pp. 38-40. Kincade, T 1999, 'Reproductive biology of the Tasmanian Microchiroptera', Honours thesis, Universiy of Tasmania. Kincade, TJ, Jones, SM & Richardson, A 2000, 'Evidence of a shift in timing of reproductive events in Tasmanian bats', Australasian Bat Society Newsletter, vol. 15, p. 32. Kitchener, DJ 1975, 'Reproduction in female Gould's wattled bat, Chalinolobus gouldii (Gray) (Vespertilionidae), in Western Australia', Australian Journal of Zoology, vol. 23, no. 1, pp. 29-42. Kitchener, DJ & Coster, P 1981, 'Reproduction in female Chalinolobus morio (Gray) (Vespertilionoidae) in south-western Australia', Australian Journal of Zoology, vol. 29, no. 305-320. Kitchener, DJ & Halse, SA 1978, 'Reproduction in female Eptesicus regulus (Thomas) (Vespertilionidae) in south-western Australia', Australian Journal of Zoology, vol. 26, no. 257-67. Knörnschild, M, Jung, K, Nagy, M, Metz, M & Kalko, E 2012, 'Bat echolocation calls facilitate social communication', Proceedings of the Royal Society B: Biological Sciences, vol. 279, no. 1748, pp. 4827-4835. Koch, A, Wapstra, M & Munks, SA 2009a, 'Re-examining the use of retained trees for nesting birds in logged dry eucalypt forest in north-eastern Tasmania: 11 years on', Tasmanian Bird Report, vol. 33, pp. 4-9. Koch, AJ 2008, 'Errors associated with two methods of assessing tree hollow occurrence and abundance in Eucalyptus obliqua forest, Tasmania', Forest Ecology and Management, vol. 255, no. 3-4, pp. 674-685. Koch, AJ & Baker, SC 2011, 'Using aerial photographs to remotely assess tree hollow availability', Biodiversity and Conservation, vol. 20, no. 5, pp. 1089-1101. Koch, AJ, Chuter, A & Munks, S 2012, A review of forestry impacts on biodiversity and the effectiveness of 'off-reserve' management actions in areas covered by the Tasmanian Forest practices system. Koch, AJ, Driscoll, DA & Kirkpatrick, JB 2008a, 'Estimating the accuracy of tree ageing methods in mature Eucalyptus obliqua forest, Tasmania', Australian Forestry, vol. 71, no. 2, pp. 147-159. Koch, AJ, Munks, SA & Spencer, C 2009b, 'Bird use of native trees retained in young eucalypt plantations: Species richness and use of hollows', Wildlife Research, vol. 36, no. 7, pp. 581-591. Koch, AJ, Munks, SA & Woehler, EJ 2008b, 'Hollow-using vertebrate fauna of Tasmania: Distribution, hollow requirements and conservation status', Australian Journal of Zoology, vol. 56, no. 5, pp. 323-349.
References
163
Kroll, AJ, Duke, SD, Hane, ME, Johnson, JR, Rochelle, M, Betts, MG & Arnett, EB 2012a, 'Landscape composition influences avian colonization of experimentally created snags', Biological Conservation, vol. 152, pp. 145-151. Kroll, AJ, Lacki, MJ & Arnett, EB 2012b, 'Research needs to support management and conservation of cavity-dependent birds and bats on forested landscapes in the Pacific Northwest', Western Journal of Applied Forestry, vol. 27, no. 3, pp. 128-136. Krutzsch, PH & Nellis, DW 2006, 'Reproductive anatomy and cyclicity of the male bat Brachyphylla cavernarum (Chiroptera: Phyllostomidae)', Acta Chiropterologica, vol. 8, no. 2, pp. 497-507. Kuenzi, AJ & Morrison, ML 2003, 'Temporal patterns of bat activity in southern Arizona', Journal of Wildlife Management, vol. 67, no. 1, pp. 52-64. Kunz, TH, de Torrez, EB, Bauer, D, Lobova, T & Fleming, TH 2011, Ecosystem services provided by bats, 00778923 (ISSN), <http://www.scopus.com/inward/record.url?eid=2-s2.0-79953159703&partnerID=40&md5=a81759982761937f291940080472854e>. Kunz, TH & Lumsden, L 2003, 'Ecology of Cavity and Foilage Roosting bats', in TH Kunz & BM Fenton (eds), Bat Ecology, The University of Chicago Press, Chicago and London, pp. 3-89. Kuussaari, M, Bommarco, R, Heikkinen, RK, Helm, A, Krauss, J, Lindborg, R, Ockinger, E, Partel, M, Pino, J, Roda , F, Stefanescu, C, Teder, T, Zobel, M & Steffan-Dewenter, I 2009, 'Extinction debt: a challenge for biodiversity conservation', Trends in Ecology and Evolution, vol. 24, no. 10, pp. 564-571. Lacki, MJ, Hayes, JP & Kurta, A (eds) 2007, Bats in forests - Conservation and Management, The Johns hopkins University press, Baltimore. Law, B, Anderson, J & Chidel, M 1998, 'A bat survey in State Forests on the south-west slopes region of New South Wales with suggestions of improvements for future surveys', Australian Zoologist, vol. 30, no. 4, pp. 467-479. Law, B & Chidel, M 2002, 'Tracks and riparian zones facilitate the use of Australian regrowth forest by insectivorous bats', Journal of Applied Ecology, vol. 39, no. 4, pp. 605-617. Law, B & Law, P 2010, Baseline sampling of bats in aggregated retention coupes and other silvicultural treatments at Warra, Unpublished report to Forestry Tasmania. Law, BS & Anderson, J 2000, 'Roost preferences and foraging ranges of the eastern forest bat Vespadelus pumilus under two disturbance histories in northern New South Wales, Australia', Austral Ecology, vol. 25, no. 4, pp. 352-367. Law, BS & Chidel, M 2001, 'Bat activity 22 years after first-round intensive logging of alternate coupes near Eden, New South Wales', Australian Forestry, vol. 64, no. 4, pp. 242-247. Law, BS & Chidel, M 2006, 'Eucalypt plantings on farms: Use by insectivorous bats in south-eastern Australia', Biological Conservation, vol. 133, no. 2, pp. 236-249.
References
164
Law, BS & Law, PR 2011, 'Early responses of bats to alternative silvicultural treatments in wet eucalypt forests of Tasmania', Pacific Conservation Biology, vol. 17, no. 1, pp. 36-47. Law, BS, Reinhold, L & Pennay, M 2002, 'Geographic variation in the echolocation calls of Vespadelus spp. (Vespertilionidae) from New South Wales and Queensland, Australia', Acta Chiropterologica, vol. 4, no. 2, pp. 201-215. Le Grange, A, Van Der Merwe, M & Bester, M 2011, 'Reproductive strategy of the Egyptian free-tailed bat, Tadarida aegyptiaca, from a subtropical latitude (25°S) in South Africa', African Zoology, vol. 46, no. 1, pp. 169-175. Leary, T & Pennay, M 2011, 'Echolocation calls of eight microchiroptera from Papua New Guinea', Australian Zoologist, vol. 35, no. SPEC. ISSUE, pp. 106-127. Lefort, P & Grove, S 2009, 'Early responses of birds to clearfelling and its alternatives in lowland wet eucalypt forest in Tasmania, Australia', Forest Ecology and Management, vol. 258, no. 4, pp. 460-471. Lesinski, G, Kasprzyk, K & Gryz, J 2012, 'Bats taken by the tawny owl in relation to its roosting site', North-Western Journal of Zoology, vol. 8, no. 2, pp. 247-251. Lima, SL & O'Keefe, JM 2013, 'Do predators influence the behaviour of bats?' Biological Reviews. Lindenmayer, DB & Franklin, JF 2002, Conserving Forest Biodiversity - A comprehensive multisccaled apprach, Island Press, London. Lindenmayer, DB, Franklin, JF & Fischer, J 2006, 'General management principles and a checklist of strategies to guide forest biodiversity conservation', Biological Conservation, vol. 131, no. 3, pp. 433-445. Lindenmayer, DB, Franklin, JF, Lauhmus, A, Baker, SC, Bauhus, J, Beese, W, Brodie, A, Kiehl, B, Kouki, J, Pastur, GM, Messier, C, Neyland, M, Palik, B, Sverdrup-Thygeson, A, Volney, J, Wayne, A & Gustafsson, L 2012, 'A major shift to the retention approach for forestry can help resolve some global forest sustainability issues', Conservation Letters, vol. 5, no. 6, pp. 421-431. Lindenmayer, DB, Margules, CR & Botkin, DB 2000, 'Indicators of biodiversity for ecologically sustainable forest management', Conservation Biology, vol. 14, no. 4, pp. 941-950. Lindenmayer, DB, Welsh, A, Donnelly, CF & Cunningham, RB 1996, 'Use of nest trees by the mountain brushtail possum (Trichosurus caninus) (Phalangeridae: Marsupialia) 2. Characteristics of occupied trees', Wildlife Research, vol. 23, no. 5, pp. 531-545. Lloyd, A, Law, B & Goldingay, R 2006, 'Bat activity on riparian zones and upper slopes in Australian timber production forests and the effectiveness of riparian buffers', Biological Conservation, vol. 129, no. 2, pp. 207-220. Lloyd, S, Bradley, AJ & Hall, LS 2001, 'Changes in progesterone and testosterone during the breeding season of the large-footed myotis Myotis moluccarum (Microchiroptera: Vespertilionidae)', Acta Chiropterologica, vol. 3, no. 1, pp. 107-117.
References
165
Lohmus, A & Remm, J 2005, 'Nest Quality limtis the number of hole-nesting passerines in their natural cavity-rich habitat', Acta Oecoglogica, vol. 27, pp. 125-128. Loyn, RH & Kennedy, SJ 2009, 'Designing old forest for the future: Old trees as habitat for birds in forests of Mountain Ash Eucalyptus regnans', Forest Ecology and Management, vol. 258, no. 4, pp. 504-515. Lucan, RK, Hanak, V & Horacek, I 2009, 'Long-term re-use of tree roosts by European forest bats', Forest Ecology and Management, vol. 258, no. 7, pp. 1301-1306. Lumsden, L & Bennett, AF 2006, 'Flexibility and specificity in the roosting ecology of the Lesser long-eared bat, Nyctophilus geoffroyi: A common and widespread Australian species', in A Zubaid, GF McCracken & TH Kunz (eds), Functional and Evolutionary Ecology of bats, Oxford University Press, pp. 290-307. Lumsden, LF & Bennett, AF 1995, 'Bats of a semi-arid environment in south-eastern Australia: Biogeography, ecology and conservation', Wildlife Research, vol. 22, no. 2, pp. 217-240. Lumsden, LF & Bennett, AF 2005, 'Scattered trees in rural landscapes: Foraging habitat for insectivorous bats in south-eastern Australia', Biological Conservation, vol. 122, no. 2, pp. 205-222. Lumsden, LF, Bennett, AF & Silins, JE 2002a, 'Location of roosts of the lesser long-eared bat Nyctophilus geoffroyi and Gould's wattled bat Chalinolobus gouldii in a fragmented landscape in south-eastern Australia', Biological Conservation, vol. 106, no. 2, pp. 237-249. Lumsden, LF, Bennett, AF & Silins, JE 2002b, 'Selection of roost sites by the lesser long-eared bat (Nyctophilus geoffroyi) and Gould's wattled bat (Chalinolobus gouldii) in south-eastern Australia', Journal of Zoology, vol. 257, no. 2, pp. 207-218. Lundy, M, Montgomery, I & Russ, J 2010, 'Climate change-linked range expansion of Nathusius' pipistrelle bat, Pipistrellus nathusii (Keyserling & Blasius, 1839)', Journal of Biogeography, vol. 37, no. 12, pp. 2232-2242. Lunetta, KL, Hayward, LB, Segal, J & van Eerdewegh, P 2004, 'Screening large-scale association study data: Exploiting interactions using random forests', BMC Genetics, vol. 5, p. 13. Lunney, D, Barker, J & Priddel, D 1985, 'Movements and day roosts of the chocolate wattled bat Chalinolobus morio (Gray) (Microchiroptera: Vespertilionidae) in a logged forest', Aust. Mammal., vol. 8, pp. 313-317. Lunney, D, Barker, J, Priddel, D & O'Connel, M 1988, 'Roost selection by Gould's Long-eared Bat, Nyctophilus gouldi Tomes (Chiroptera: Vespertilionidae), in Logged Forest on the South Coast of New South Wales', Australian Wildlife Research, vol. 15, pp. 375-384. Lunney, D, Law, B, Schulz, M & Pennay, M 2011, 'Turning the spotlight onto the conservation of Australian bats and the extinction of the Christmas Island Pipistrelle', Australian Zoologist, vol. 35, no. SPEC. ISSUE, pp. 485-498.
References
166
MacDonald, MA, Apiolaza, LA & Grove, S 2005, 'The birds of retained vegetation corridors: A pre- and post-logging comparison in dry sclerophyll forest in Tasmania', Forest Ecology and Management, vol. 218, no. 1-3, pp. 277-290. MacDonald, MA, Taylor, RJ & Candy, SG 2002, 'Bird assemblages in wildlife habitat strips in a Tasmanian plantation matrix', Pacific Conservation Biology, vol. 8, no. 2, pp. 82-98. Mackie, IJ & Racey, PA 2007, 'Habitat use varies with reproductive state in noctule bats (Nyctalus noctula): Implications for conservation', Biological Conservation, vol. 140, no. 1-2, pp. 70-77. Maindonald, J & Braun, WJ 2007, Data Analysis and Graphics Using R - an Example-Based Approach, 2nd edition edn, Cambridge University Press, New York. Martin, JK & Handasyde, KA 2007, 'Comparison of bobuck (Trichosurus cunninghami) demography in two habitat types in the Strathbogie Ranges, Australia', Journal of Zoology, vol. 271, no. 4, pp. 375-385. Mascia, MB & Pailler, S 2011, 'Protected area downgrading, downsizing, and degazettement (PADDD) and its conservation implications', Conservation Letters, vol. 4, no. 1, pp. 9-20. Mason, MK, Hockman, D, Jacobs, DS & Illing, N 2010, 'Evaluation of maternal features as indicators of asynchronous embryonic development in Miniopterus natalensis', Acta Chiropterologica, vol. 12, no. 1, pp. 161-171. Mazerolle, MJ & Villard, MA 1999, 'Patch characteristics and landscape context as predictors of species presence and abundance: A review', Ecoscience, vol. 6, no. 1, pp. 117-124. Mazurek, MJ, and Zielinski, W.J., 2004, 'Individual legacy trees influence vertebrate wildlife diversity in commercial forests', Forest Ecology and Management, vol. 193, pp. 321-334. McComb, WC & Noble, RE 1982, 'Invertebrate use of natural tree cavities and vertebrate nest boxes', American Midland Naturalist, vol. 107, no. 163-172. Meiri, S & Dayan, T 2003, 'On the validity of Bergmann's rule', Journal of Biogeography, vol. 30, no. 3, pp. 331-351. Mickleburgh, SP, Hutson, AM & Racey, PA 2002, 'A review of the global conservation status of bats', ORYX, vol. 36, no. 1, pp. 18-34. Miles, AC, Castleberry, SB, Miller, DA & Conner, LM 2006, 'Multi-scale roost-site selection by evening bats on pine-dominated landscapes in southwest Georgia', Journal of Wildlife Management, vol. 70, no. 5, pp. 1191-1199. Mills, DJ, Norton, TW, Parnaby, HE, Cunningham, RB & Nix, HA 1996, 'Designing surveys for microchiropteran bats in complex forest landscapes--a pilot study from south-east Australia', Forest Ecology and Management, vol. 85, no. 1-3, pp. 149-161. Milne, DJ 2002, Key to the bat calls of the top end of Northern Territory, Parks and Wildlife Commission of the Northern Territory.
References
167
Milne, DJ, Fisher, A, Rainey, I & Pavey, CR 2005, 'Temporal patterns of bats in the Top End of the Northern Territory, Australia', Journal of Mammalogy, vol. 86, no. 5, pp. 909-920. Mirzaei, G, Majid, MW, Jamali, MM, Ross, J, Frizado, J, Gorsevski, PV & Bingman, V 2011, 'The application of evolutionary neural network for bat echolocation calls recognition', in Proceedings of the International Joint Conference on Neural Networks, San Jose, CA, pp. 1106-1111. Molinari, J, Gutiérrez, EE, de Ascenção, AA, Nassar, JM, Arends, A & Márquez, RJ 2005, 'Predation by giant centipedes, Scolopendra gigantea, on three species of bats in a Venezuelan cave', Caribbean Journal of Science, vol. 41, no. 2, pp. 340-346. Moos, WS & Randall, W 1995, 'Patterns of human reproduction and geographic latitude', International Journal of Biometeorology, vol. 38, no. 2, pp. 84-88. Morris, AD, Miller, DA & Kalcounis-Rueppell, MC 2010, 'Use of forest edges by bats in a managed pine forest landscape', Journal of Wildlife Management, vol. 74, no. 1, pp. 26-34. Morrow, G, Andersen, NA & Nicol, SC 2009, 'Reproductive strategies of the short-beaked echidna a review with new data from a long-term study on the Tasmanian subspecies (Tachyglossus aculeatus setosus)', Australian Journal of Zoology, vol. 57, no. 4, pp. 275-282. Munks, S 1995, 'The breeding biology of Pseudocheirus peregrinus viverrinus on Flinders Island, Bass Strait', Wildlife Research, vol. 22, no. 5, pp. 521-534. Munks, S, Richards, K, Meggs, J & Brereton, R 2004, 'The importance of adaptive management in 'off-reserve' conservation for forest fauna: implementing, monitoring and upgrading Swift Parrot Lathamus discolor conservation measures in Tasmania', in D Lunney (ed.), Conservation of Australia's Forest Fauna, 2nd edition edn, Royal Zoological Society of New South Wales, Mosman, pp. 688-698, <file://E:%5CMy%20Documents%5CPaper_from_Australian_Forest_Fauna.pdf>. Munks, S, Wapstra, M, Corkrey, R, Otley, H, Miller, G & Walker, B 2007, 'The occurence of potential tree hollows in the dry Eucalypt forests of south-eastern Tasmania, Australia', Australian Zoologist, vol. 34, no. 1, pp. 22-36. Munks, SA, Koch, AJ & Wapstra, M 2009, 'From guiding principles for the conservation of forest biodiversity to on-ground practice: Lessons from tree hollow management in Tasmania', Forest Ecology and Management, vol. 258, no. 4, pp. 516-524. Newton, I 1994, 'The role of nest sites in limiting the numbers of hole-nesting birds: A review', Biological Conservation, vol. 70, pp. 265-276. Neyland, M 2010, Sivicultural systems for native eucalpy forests, Native forest silviculture technical bulletin. no. 5., Forestry Tasmania, Hobart Novacek, MJ & Cleland, EE 2001, 'The current biodiversity extinction event: Scenarios for mitigation and recovery', Proceedings of the National Academy of Sciences of the United States of America, vol. 98, no. 10, pp. 5466-5470.
References
168
O'Donnel, C, F.J 2009, 'The ecology and conservation of New Zealand bats', in TH Fleming (ed.), Racey, P.A., The University of Chicago Press, Chicago, pp. 460-495. O'Donnell, CFJ 2000, 'Influence of season, habitat, temperature, and invertebrate availability on nocturnal activity of the New Zealand long-tailed bat (Chalinolobus tuberculatus)', New Zealand Journal of Zoology, vol. 27, no. 3, pp. 207-221. O'Farrell, MJ, Miller, BW & Gannon, WL 1999, 'Qualitative identification of free-flying bats using the anabat detector', Journal of Mammalogy, vol. 80, no. 1, pp. 11-23. O'Neill, MG 1983, 'Structure and composition of Tasmanian bat communities', PhD thesis, Universiy of Tasmania. O'Neill, MG 1984, 'Structure and composition of Tasmanian bat communities', PhD thesis, Universiy of Tasmania. O'Neill, MG & Taylor, RJ 1986, 'Observations of the flight patterns and foraging behaviour of Tasmanian bats', Australian Wildlife Research, vol. 13, no. 3, pp. 427-432. O'Neill, MG & Taylor, RJ 1989, 'Feeding ecology of Tasmanian bats', Australian Journal of Ecology, vol. 14, pp. 19-31. Olsen, J 2011, Australian High Country Owls CSIRO Publishing Olsen, J, Trost, S & Rose, AB 2008, 'Southern boobook Ninox novaeseelandiae pair feeding two broods of fledglings', Australian Field Ornithology, vol. 25, pp. 12-21. Pardini, R, Faria, D, Accacio, GM, Laps, RR, Mariano-Neto, E, Paciencia, MLB, Dixo, M & Baumgarten, J 2009, 'The challenge of maintaining Atlantic forest biodiversity: A multi-taxa conservation assessment of specialist and generalist species in an agro-forestry mosaic in southern Bahia', Biological Conservation, vol. 142, no. 6, pp. 1178-1190. Parnaby, H 1999, An interim guide to identification of insectivorous bats of south-eastern Australia. Parnaby, H, Lunney, D & Fleming, M 2012, 'Four issues influencing the management of hollow-using bats of the PIlliga forests of inland New South Wales', in B Law, P Eby, D Lunney & L Lumsden (eds), The Biology and Conservation of Australasian Bats, Royal Zoological Society of New South Wales Mossman. Parnaby, HE 2009, 'A taxonomic review of australian greater long-eared bats previously known as Nyctophilias timoriensis (Chiroptera:Vespertilionidae) and some associated taxa', Australian Zoologist, vol. 35, no. 1, pp. 39-81. Parris, KM 2004, 'Environmental and spatial variables influence the composition of frog assemblages in sub-tropical eastern Australia', Ecography, vol. 27, no. 3, pp. 392-400.
References
169
Parsons, S 1997, 'Search-phase echolocation calls of the New Zealand lesser short-tailed bat (Mystacina tuberculata) and long-tailed bat (Chalinolobus tuberculatus)', Canadian Journal of Zoology, vol. 75, no. 9, pp. 1487-1494. Parsons, S 2001, 'Identification of New Zealand bats (Chalinolobus tuberculatus and Mystacina tuberculata) in flight from analysis of echolocation calls by artificial neural networks', Journal of Zoology, vol. 253, no. 4, pp. 447-456. Parsons, S & Jones, G 2000, 'Acoustic identification of twelve species of echolocating bat by discriminant function analysis and artificial neural networks', Journal of Experimental Biology, vol. 203, no. 17, pp. 2641-2656. Parsons, S & Szewczac, J 2009, 'Detecting, recording and analyzing the vocalizations of bats', in TH Kunz & S Parsons (eds), Ecological and behavioural methods for the study of bats, The John Hopkins University Press, Baltimore, vol. 2nd, pp. 91-111. Patriquin, KJ & Barclay, RMR 2003, 'Foraging by bats in cleared, thinned and unharvested boreal forest', Journal of Applied Ecology, vol. 40, no. 40, pp. 646-657. Patriquin, KJ, Leonard, ML, Broders, HG & Garroway, CJ 2010, 'Do social networks of female northern long-eared bats vary with reproductive period and age?' Behavioral Ecology and Sociobiology, vol. 64, no. 6, pp. 899-913. Pattanavibool, A & Edge, WD 1996, 'Single-tree selection silviculture affects cavity resources in mixed deciduous forests in Thailand', Journal of Wildlife Management, vol. 60, no. 1, pp. 67-73. Pennay, M 2012, 'Product Review: EM3 EchoMeter bat detector/recorder by Wildlife Acoustics', The Australasian Bat Society Newsletter, vol. `38, pp. 55-57. Pennay, M, Law, B & Reinhold, L 2004, Bat calls of New South Wales: Region based guide to the echolocation calls of microchiropteran bats, Department of Environment and Conservation and State Forests of NSW, Hurtsville. Perry, RW & Thill, RE 2007, 'Tree roosting by male and female eastern pipistrelles in a forested landscape', Journal of Mammalogy, vol. 88, no. 4, pp. 974-981. Perry, RW, Thill, RE & Leslie Jr, DM 2007, 'Selection of roosting habitat by forest bats in a diverse forested landscape', Forest Ecology and Management, vol. 238, no. 1-3, pp. 156-166. Perry, RW, Thill, RE & Leslie Jr, DM 2008, 'Scale-dependent effects of landscape structure and composition on diurnal roost selection by forest bats', Journal of Wildlife Management, vol. 72, no. 4, pp. 913-925. Petrazelkova, KJ & Zukal, J 2003, 'Does a live barn owl (Tyto alba) affect emergence behavior of serotine bats (Eptesicus serotinus)?' Acta Chiropterologica, vol. 5, no. 2, pp. 177-184. Petrzelkova, KJ & Zukal, J 2003, 'Does a live barn owl (Tyto alba) affect emergence behavior of serotine bats (Eptesicus serotinus)?' Acta Chiropterologica, vol. 5, no. 2, pp. 177-184.

References
170
Pfeiffer, B & Mayer, F 2012, 'Spermatogenesis, sperm storage and reproductive timing in bats', Journal of Zoology. Phillips, S, Coburn, D & James, R 2001, 'An observation of cat predation upon an Eastern Blossum Bat Syncoyncteris australis ', Australian Mammalogy, vol. 23, no. 1, pp. 57-58. Phillips, WR & Inwards, SJ 1985, 'The annual activity and breeding cycles of Gould's long-eared bat, Nyctophilus gouldi ( Microchiroptera: Vespertilionidae)', Australian Journal of Zoology, vol. 33, no. 2, pp. 111-126. Phillips, WR, Tidemann, C, Inwards, SJ & Winderlich, S 1985, 'The Tasmanian pipistrelle: Pipistrellus tasmaniensis Gould 1858: annual activity and breeding cycles', Macroderma, vol. 1, pp. 2-11. Pierson, ED & Racey, PA 1998, 'Conservation biology: introduction', in TH Kunz & PA Racey (eds), Bat biology and conservation, Smithsonian Institute Press, Washington, pp. 247-248. Polasky, S, Nelson, E, Lonsdorf, E, Fackler, P & Starfield, A 2005, 'Conserving species in a working landscape: Land use with biological and economic objectives', Ecological applications, vol. 15, no. 4, pp. 1387-1401. Preatoni, DG, Nodari, M, Chirichella, R, Tosi, G, Wauters, LA & Martinoli, A 2005, 'Identifying bats from time-expanded recordings of search calls: Comparing classification methods', Journal of Wildlife Management, vol. 69, no. 4, pp. 1601-1614. Quinn, GP & Keough, MJ 2002, Experimental Design and Data Analysis for Biologists, Cambridge University Press, United Kingdom. R Development Core Team 2011, R: A Language and Environment for Statistical Computing, Vienna, Austria, <http://www.R-project.org/>. Racey, PA & Entwistle, AC 2000, 'Life history and reproductive stratedgies of bat', in EG Crichton & PH Krutzsch (eds), Reproductive Biology of Bats, Academic Press, New York, pp. 363-401. Racey, PA & Entwistle, AC 2003, 'Conservation Ecology of bats', in TH Kunz & BM Fenton (eds), Bat Ecology, University of Chicago Press, Chicago, vol. 680-722. Redgwell, RD, Szewczak, JM, Jones, G & Parsons, S 2009, 'Classification of echolocation calls from 14 species of bat by support vector machines and ensembles of neural networks', Algorithms, vol. 2, no. 3, pp. 907-924. Reinhold, L, Herr, A, Lumsden, L, Reardon, T, Corben, C, Law, B, Prevett, P, Ford, G, Conole, L, Kutt, A, Milne, D & Hoye, G 2001, 'Geographic variation in the echolocation calls of Gould's Wattled Bat Chalinolobus gouldii', Australian Zoologist, vol. 31, no. 4, pp. 618-624. Rhind, SG 2004, 'Direct impacts of logging and forest management on the brush-tailed phascogale Phascogale tapoatafa and other arboreal marsupials in a jarrah forest of Western Australia', in D Lunney
References
171
(ed.), Conservation of Australia's Forest Fauna, 2nd ed edn, Royal Zoological Society of New South Wales, Mosman, NSW, Australia, pp. 639-655. Rhodes, M 2006, 'The Ecology and conservation of the White-striped freetail bat (Tadarida australis) in Urban Environments', PhD thesis, Griffith University. Rhodes, MP 1996, Use of Silvicultural regrowth for foraging by Tasmanian bat species, Forest Practices Board, Hobart Richards, GC, Hall, LS & Parish, S 2012, 'Trials and tribulations of being a bat', in GC Richards, LS Hall & S Parish (eds), A natural history of Australian bats - working the night shift, CSIRO publishing, pp. 117-118. Roberts, BJ, Catterall, CP, Eby, P & Kanowski, J 2011, 'Latitudinal range shifts in Australian flying-foxes: A re-evaluation', Austral Ecology, vol. 37, no. 1, pp. 12-22. Robinson, SK, Thompson Iii, FR, Donovan, TM, Whitehead, DR & Faaborg, J 1995, 'Regional forest fragmentation and the nesting success of migratory birds', Science, vol. 267, no. 5206, pp. 1987-1990. Rosina, VV & Shokhrin, VP 2011, 'Bats in the diet of owls from the russian far east, southern sikhote alin', Hystrix Italian journal of mammalogy, vol. 22, no. 1, pp. 205-213. RuczynÌski, I & Bogdanowicz, W 2008, 'Summer roost selection by tree-dwelling bats Nyctalus noctula and N. leisleri: A multiscale analysis', Journal of Mammalogy, vol. 89, no. 4, pp. 942-951. Russ, JM, Briffa, M & Montgomery, WI 2003, 'Seasonal patterns in activity and habitat use by bats (Pipistrellus spp. and Nyctalus leisleri) in Northern Ireland, determined using a driven transect', Journal of Zoology, vol. 259, no. 3, pp. 289-299. Russo, D, Cistrone, L, Garonna, AP & Jones, G 2010, 'Reconsidering the importance of harvested forests for the conservation of tree-dwelling bats', Biodiversity and Conservation, vol. 19, no. 9, pp. 2501-2515. Rydell, J 1993, 'Variation in foraging activity of an aerial insectivorous bat during reproduction', Journal of Mammalogy, vol. 74, no. 2, pp. 503-509. Sanderson, K & Kirkley, D 1998, 'Yearly activity patterns of bats at Belair National Park, in Adelaide, South Australia', Australian Mammalogy, vol. 20, no. 3, pp. 369-375. Saunders, DA, Hobbs, RJ & Ehrlich, PR 1993, 'The reconstruction of fragmented ecosystems: global and regional perspectives', The reconstruction of fragmented ecosystems: global and regional perspectives. Saunders, MB & Barclay, RMR 1992, 'Ecomorphology of insectivorous bats: a test of predictions using two morphologically similar species', Ecology, vol. 73, no. 4, pp. 1335-1345. Scanlon, AT & Petit, S 2008, 'Effects of site, time, weather and light on urban bat activity and richness: Considerations for survey effort', Wildlife Research, vol. 35, no. 8, pp. 821-834.
References
172
Schulte, LA, Mitchell, RJ, Hunter Jr, ML, Franklin, JF, Kevin McIntyre, R & Palik, BJ 2006, 'Evaluating the conceptual tools for forest biodiversity conservation and their implementation in the U.S', Forest Ecology and Management, vol. 232, no. 1-3, pp. 1-11. Schulz, M & Kristensen, K 1996, 'Bats of coastal southwestern Tasmania', Papers and Proceedings - Royal Society of Tasmania, vol. 130, no. 1, pp. 1-5. Scrimgeour, J, Beath, A & Swanney, M 2012, 'Cat predation of short-tailed bats (mystacina tuberculata rhyocobia) in rangataua forest, mount ruapehu, central North Island, New Zealand', New Zealand Journal of Zoology, vol. 39, no. 3, pp. 257-260. Sedgeley, JA 2003, 'Roost site selection and roosting behaviour in lesser short-tailed bats (Mystacina tuberculata) in comparison with long-tailed bats (Chalinolobus tuberculatus) in Nothofagus forest, Fiordland', New Zealand Journal of Zoology, vol. 30, no. 3, pp. 227-241. Sergio, F & Pedrini, P 2007, 'Biodiversity gradients in the Alps: The overriding importance of elevation', Biodiversity and Conservation, vol. 16, no. 12, pp. 3243-3254. Sherwin, RE, Gannon, WL & Haymond, S 2000, 'The efficacy of acoustic techniques to infer differential use of habitat by bats', Acta Chiropterologica, vol. 2, no. 2, pp. 145-153. SonoBat 2012, SonoBat - Software for Bat Call Analysis, viewed 25/05/2012 2012, <http://www.sonobat.com/about_SonoBat.html>. SOSSA. 1999, 28th March 1999 WOLLONGONG PELAGIC TRIP REPORT, NSW, AUSTRALIA, Southern Oceans Seabird Study Association Inc., viewed 15/12/12 2012, <http://www.sossa-international.org/forum/content.php?326-28th-March-1999-WOLLONGONG-PELAGIC-TRIP-REPORT-NSW-AUSTRALIA>. SoundID 2012, SoundID for Sound Recognition and Monitoring, viewed 25/05/2012 2012, <http://www.soundid.net/SoundID/Software_Home.html>. Souza, LL, Ferrari, SF & Pina, ALCB 1997, 'Feeding Behaviour and Predation of a Bat by Saimiri sciureus in a Semi-Natural Amazonian Environment', Folia Primatologica, vol. 68, no. 3--5, pp. 194-198. Speakman, JR 1991, 'The impact of predation by birds on bat populations in the British Isles', Mammal Review, vol. 21, no. 3, pp. 123-142. Speakman, JR 1995, 'Chiropteran nocturnality', Symposia of the Zoological Society of London, vol. 67, pp. 187-201. Speakman, JR, Bullock, DJ, Eales, LA & Racey, PA 1992, 'A problem defining temporal pattern in animal behaviour: clustering in the emergence behaviour of bats from maternity roosts', Animal Behaviour, vol. 43, no. 3, pp. 491-500. Steen, DA, McClure, CJW, Brock, JC, Rudolph, DC, Pierce, JB, Lee, JR, Humphries, WJ, Gregory, BB, Sutton, WB, Smith, LL, Baxley, DL, Stevenson, DJ & Guyer, C 2012, 'Landscape-level influences of
References
173
terrestrial snake occupancy within the southeastern United States', Ecological applications, vol. 22, no. 4, pp. 1084-1097. Stephens, HC, Baker, SC, Potts, BM, Munks, SA, Stephens, D & O'Reilly-Wapstra, JM 2012a, 'Short-term responses of native rodents to aggregated retention in old growth wet Eucalyptus forests', Forest Ecology and Management, vol. 267, no. 2, pp. 18-27. Stephens, HC, Schmuki, C, Burridge, CP & O'Reilly-Wapstra, JM 2012b, 'Habitat fragmentation in forests affects relatedness and spatial genetic structure of a native rodent, Rattus lutreolus', Austral Ecology, pp. n/a-n/a. Stone, M 1998, 'Forest-type mapping by photo-interpretation: A multi-purpose base for Tasmania's forest management', Tasforests, vol. 10, pp. 1-15. Taylor, AC & Savva, NM 1988, 'Use of Roost Sites by Four Species of Bats in State Forest in South-Eastern Tasmania', Australian Wildlife Research, vol. 15, pp. 637-645. Taylor, R, O'Neill, MG & Reardon, T 1987, 'Tasmanian bats: identification, distribution and natural history', Papers and Proceedings - Royal Society of Tasmania, vol. 121, pp. 109-117. Taylor, R & Savva, NM 1990, 'Annual activity and weight cylces of bats in south-eastern Tasmania', Australian Wildlife Research, vol. 17, pp. 181-188. Taylor, RJ 1991, 'Fauna management practices in State forests in Tasmania', in D Lunney (ed.), Conservation of Australia's Forest Fauna, Royal Zoological Society of NSW, Mosman, pp. 260-263. Taylor, RJ & O'Neill, MG 1985, 'Composition of the bat (Chiroptera: Vespertillionidae) communities in Tasmanian forests', Australian Mammalogy, vol. 9, no. 125-130. Threlfall, C, Law, B, Penman, T & Banks, PB 2011, 'Ecological processes in urban landscapes: Mechanisms influencing the distribution and activity of insectivorous bats', Ecography, vol. 34, no. 5, pp. 814-826. Threlfall, CG, Law, B & Banks, PB 2012a, 'Influence of landscape structure and human modifications on insect biomass and bat foraging activity in an urban landscape', PLoS ONE, vol. 7, no. 6. Threlfall, CG, Law, B & Banks, PB 2012b, 'Sensitivity of insectivorous bats to urbanization: Implications for suburban conservation planning', Biological Conservation, vol. 146, no. 1, pp. 41-52. Threlfall, CG, Law, B & Banks, PB 2013, 'Roost selection in suburban bushland by the urban sensitive bat Nyctophilus gouldi', Journal of Mammalogy. Tidemann, CR 1986, 'Morphological variation in Australian and island populations of Gould's wattled bat, Chalinolobus gouldii (Gray) ( Chiroptera: Vespertilionidae)', Australian Journal of Zoology, vol. 34, no. 4, pp. 503-514. Tidemann, CR 1993, 'Reproduction in the bats Vespadelus vulturnus, V. regulus and V. darlingtoni (Microchiroptera: Vespertilionidae) in coastal south- eastern Australia', Australian Journal of Zoology, vol. 41, no. 1, pp. 21-35.
References
174
Tubelis, DP, Lindenmayer, DB & Cowling, A 2007, 'Bird populations in native forest patches in south-eastern Australia: The roles of patch width, matrix type (age) and matrix use', Landscape Ecology, vol. 22, no. 7, pp. 1045-1058. Turbill, C & Geiser, F 2008, 'Hibernation by tree-roosting bats', Journal of Comparative Physiology B: Biochemical, Systemic, and Environmental Physiology, vol. 178, no. 5, pp. 597-605. Turner, IM 1996, 'Species loss in fragments of tropical rain forest: A review of the evidence', Journal of Applied Ecology, vol. 33, no. 2, pp. 200-209. Twente, JW 1954, 'Predation on bats by hawks and owls', The Wilson Bulletin, vol. 66, no. 2, pp. 135-136. Tyndale-Biscoe, CH & Smith, RFC 1969, 'Studies on the marsupial glider, Schoinobates volans ( Kerr): III. response to habitat Destruction', The journal of Animal Ecology, vol. 38, no. 3, pp. 651-659. Tyson, RM 1981, 'Strange bat deaths at St Leonards, Northern Tasmania', Tasmanian Naturalist, vol. 66, pp. 2-3. Umetsu, F & Pardini, R 2007, 'Small mammals in a mosaic of forest remnants and anthropogenic habitats - Evaluating matrix quality in an Atlantic forest landscape', Landscape Ecology, vol. 22, no. 4, pp. 517-530. van Aarde, RJ, van der Merwe, M & Skinner, DC 1994, 'Progesterone concentrations and contents in the plasma, ovary, adrenal gland and placenta of the pregnant natal clining bat Miniopterus schreibersii natalensis', Journal of Zoology, vol. 232, no. 3, pp. 457-464. Van der Merwe, M & Van Aarde, RJ 1989, 'Plasma progesterone concentrations in the female Natal clinging bat (Miniopterus schreibersii natalensis)', Journal of Reproduction and Fertility, vol. 87, no. 2, pp. 665-669. Van Dyck, S & Strahan, R 2008, The Mammals of Australia, Third edition edn, Martin ford. Vergara, PM in press 'Matrix-dependent corridor effectiveness and the abundance of forest birds in fragmented landscapes', Landscape Ecology, vol. 26, no. 8, pp. 1085-1096. Vergara, PM, Pérez-Hernández, CG, Hahn, IJ & Jiménez, JE 2013, 'Matrix composition and corridor function for austral thrushes in a fragmented temperate forest', Landscape Ecology, vol. 28, no. 1, pp. 121-133. Waldien, DL, Hayes, JP & Arnett, EB 2000, 'Day-roosts of female long-eared myotis in western Oregon', Journal of Wildlife Management, vol. 64, no. 3, pp. 785-796. Walters, CL, Freeman, R, Collen, A, Dietz, C, Brock Fenton, M, Jones, G, Obrist, MK, Puechmaille, SJ, Sattler, T, Siemers, BM, Parsons, S & Jones, KE 2012, 'A continental-scale tool for acoustic identification of European bats', Journal of Applied Ecology.
References
175
Wang, J, Kanwal, J, Zhang, C, Jiang, T, Lu, G & Feng, J 2010, 'Seasonal habitat use by greater horseshoe bat Rhinolophus ferrumequinum (Chiroptera: Rhinolophidae) in Changbai Mountain temperate forest, Northeast China', Mammalia, vol. 74, no. 3, pp. 257-266. Wapstra, M & Taylor, RJ 1998, 'Use of retained trees for nesting by birds in logged eucalypt forest in north-eastern Tasmania', Australian Forestry, vol. 61, no. 1, pp. 48-52. Wardlaw, TJ, Grove, SJ, Balmer, J, Hingston, A, Forster, L, Schmuki, C & Read, S 2012, Persistence of mature-forest biodiversity elements in a production-forest landscape managed under a Regional Forest Agreement. . Webala, PW, Craig, MD, Law, BS, Armstrong, KN, Wayne, AF & Bradley, JS 2011, 'Bat habitat use in logged jarrah eucalypt forests of south-western Australia', Journal of Applied Ecology, vol. 48, no. 2, pp. 398-406. Webala, PW, Craig, MD, Law, BS, Wayne, AF & Bradley, JS 2010, 'Roost site selection by southern forest bat Vespadelus regulus and Gould's long-eared bat Nyctophilus gouldi in logged jarrah forests; south-western Australia', Forest Ecology and Management. Webb, JK & Shine, R 1997, 'Out on a limb: Conservation implications of tree-hollow use by a threatened snake species (Hoplocephalus bungaroides: Serptentes, Elapidae)', Biological Conservation, vol. 81, no. 1-2, pp. 21-33. Whitford, K & Stone, M 2004, 'Management of tree hollows in the jarrah Eucalyptus marginata forest of Western Australia ', in D Lunney (ed.), Conservation of Australia's Forest Fauna, second edition edn, Royal Zoological Society of New South Wales, NSW, Australia, pp. 807-829. Whitford, KR 2002, 'Hollows in jarrah (Eucalyptus marginata) and marri (Corymbia calophylla) trees I. Hollow sizes, tree attributes and ages', Forest Ecology and Management, vol. 160, pp. 201-214. Wickramasinghe, LP, Harris, S, Jones, G & Vaughan, N 2003, 'Bat activity and species richness on organic and conventional farms: Impact of agricultural intensification', Journal of Applied Ecology, vol. 40, no. 6, pp. 984-993. Wildlife acoustics Inc. 2012, Song Scope, viewed 25/05/2012 2012, <http://www.wildlifeacoustics.com/products/analysis-software>. Wildlife acoustics Inc. 2013, Overview of Kaleidoscope Software Wildlife Acoustics, viewed 07/02/13, <http://www.wildlifeacoustics.com/products/kaleidoscope-software>. Wiley, JW 2010, 'Food habits of the endemic ashy-faced owl (Tyto glaucops) and recently arrived barn owl (T. alba) in hispaniola', Journal of Raptor Research, vol. 44, no. 2, pp. 87-100. Wilkinson, G 1994, Silvicultural systems, Native Forest Silviculture Technical Bulletin No. 5, Forestry Tasmania, Hobart. Wiltshire, R & Potts, B 2007, EucaFlip - Life-size guide to the eucalypts of Tasmania, University of Tasmania, Hobart.

References
176
Woinarski, J 1986, 'Sharing of small hollow by roosting bats and nesting forty-spotted pardalotes', The Tasmanian Naturalist, vol. 84. Woollard, P, Vestjens, WJM & MacLean, L 1978, 'The ecology of the eastern water rat Hydromys chrysogaster at Griffith, N.S.W.: food and feeding habits', Australian Wildlife Research, vol. 5, pp. 59-73. World Commission on Forests and Sustainable Development 1999, Our forests our future, Cambridge University Press, Cambridge, England Young, RA & Ford, GI 2000, 'Bat fauna of a semi-arid environment in central western Queensland, Australia', Wildlife Research, vol. 27, no. 2, pp. 203-215. Yuan Li, Bao Weidong, Anmeng, W & Lijia, Z 2010, 'Bat Components in the Food of Wintering Long-eared Owls in Beijing', Scientia Silvae Sinicae, vol. 46, no. 5, pp. 109-112. Zahn, A 1999, 'Reproductive success, colony size and roost temperature in attic-dwelling bat Myotis myotis', Journal of Zoology, vol. 247, no. 2, pp. 275-280.
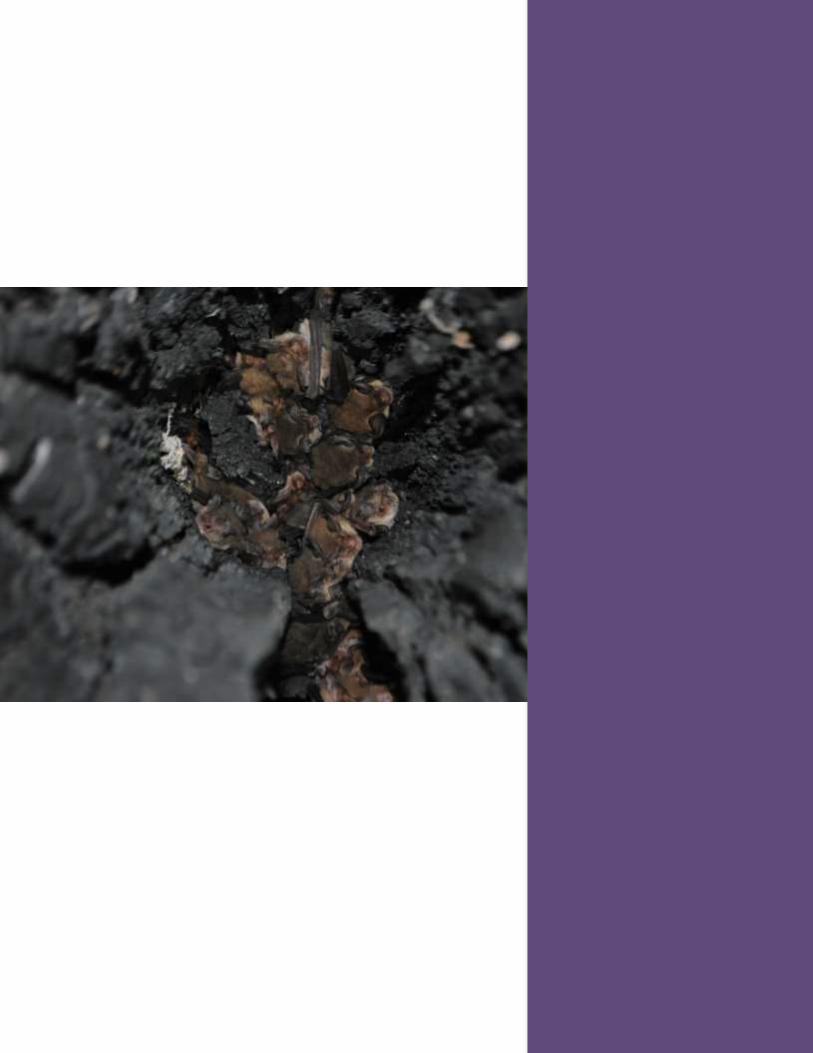
177