hdfc bank ltd. - myirisbreport.myiris.com/idbicap1/hdfcbank_20110909.pdf · hdfc bank ltd. (hdfcb)...
TRANSCRIPT

COMPANY
REPORT
September 9, 2011
HDFC Bank Ltd. Stands tall during challenges
COMPANY
REPORT
CMP Rs484
Target Price Rs503
Potential Upside/Downside +4%
Relative to Sensex
Summary
HDFC Bank Ltd. (HDFCB) has been a top performer compared to peers due to its consistent performance
over last several years. With 30% profit growth, a maintained margin of 4%+ and superior risk
management, the bank has been delivering RoAs of ~1.5% from last several quarters. The consistent
performance over the years justifies the premium valuation at which HDFCB trades compared to peers. In
the current macroeconomic environment, we believe that HDFCB will be a key participant in the flight to
safety among Indian heavy weights.
We estimate the bank’s earnings growth to be at 20% CAGR during FY11-13E, lower than its trademark
~30% growth. We estimate a lower earnings growth factoring in lower credit off take and a 15bps
contraction in margins as worst case scenarios which can unfold in the event of further increase in saving
rates and competition from domestic players. However, due to its consistent performance over the years,
the bank will remain an all season’s pick and will be able to maintain its supremacy over peers. Further,
during the season of multiple de-rating and estimate cuts historically, HDFCB has shown less severe
impact amongst peers. We believe the trend will continue due to its flawless asset quality and
sustainability of profitability. At CMP of Rs484, HDFCB is trading at 3.3x of its FY13E Book value of Rs148.
We initiate coverage with an HOLD rating and price target of Rs503 (3.4x FY13E BV).
Key Highlights
Liability franchisee holds the key
One of the major determinants in the performance of HDFCB is its high CASA ratio of ~50%, which
benefits it with the lowest cost of funds compared to peers. Further, with an increase in savings rate,
we expect the cost of funds will increase for the bank but will remain lowest amongst peers. With
~2,000 branches and focus on retail banking, we expect the CASA Ratio to remain in the range of
50%-52%. However, the key risk to our assumption of CASA ratio remains in the uncertainty
regarding deregulation of saving rates and a resultant increase in competition to garner deposits by
peers. This in turn could further increase the cost of funds for the entire sector.
Flawless asset quality
Despite having the highest exposure to retail sector, HDFCB has maintained its assets quality. With
proper risk management practices in place, the bank was able to record a GNPA ratio of 1.1% and
NNPA ratio of 0.2% in FY11. Further, the bank has the lowest restructured assets (0.4% of total
advances) amongst peers. NPA coverage ratio based on specific provision was at 82.5% as on FY11.
Valuation
We estimate a book value of Rs127 for FY12E and Rs148 for FY13E. At CMP, the bank is trading at
3.8x/3.3x of its FY12E/FY13E Book value. With high CASA, balanced loan book and superior asset
quality, we believe that HDFCB is the best conservative play in the current volatile environment.
We value the bank at its 6 year historical P/BV multiple of 3.4x and arrive at target price of Rs503.
Initiate coverage with HOLD.
Source: Capitaline
HOLD
Nifty: 5,153; Sensex: 17,166
Analyst
Sandeep Jain
+91-22-4322 1185
Bijoy Shah
Sector Banking
Bloomberg / Reuters HDFCB IN / HDBK.BO
Shares o/s (mn) 466.8
Market cap. (Rs mn) 225,917
Market cap. (US$ mn) 4,892
3-m daily average vol. 153,566
Key Stock Data
52-week high/low Rs520/396
-1m -3m -12m
Absolute (%) 5 3 11
Rel to Sensex (%) 4 9 19
Price Performance
Promoters 23.3
FIIs/NRIs/OCBs/GDR 47.7
MFs/Banks/FIs 11.1
Non Promoter Corporate 8.8
Public & Others 9.1
Shareholding Pattern (%)
80
90
100
110
120
Sep
-10
Oct
-10
Nov
-10
Dec
-10
Jan-
11
Feb
-11
Mar
-11
Apr
-11
May
-11
Jun-
11
Jul-1
1
Aug
-11
Sep
-11
HDFC Bank Sensex
Table: Financial snapshot
Year-end NII PAT EPS P/E Div yield BV P/BV ROA ROE CAR GNPA NNPA
March (Rs bn) (Rs bn) (Rs) (x) (%) (Rs) (x) (%) (%) (%) (%) (%)
FY09 74.2 22.4 10.6 45.9 0.4 68.8 7.0 1.4 17.2 15.7 2.0 0.6
FY10 83.9 29.5 12.9 37.6 0.5 93.9 5.2 1.5 16.3 17.4 1.4 0.3
FY11 105.4 39.3 16.9 28.7 0.7 108.9 4.4 1.6 16.7 16.2 1.1 0.2
FY12E 122.9 46.7 19.8 24.5 0.7 126.6 3.8 1.5 16.9 15.3 1.2 0.3
FY13E 148.6 56.7 23.6 20.5 0.8 147.7 3.3 1.5 17.3 14.5 1.2 0.4
Source: Company; IDBI Capital Research

2
Company Report – HDFC Bank Ltd.
HDFCB, one of the private sector banks in India, was formed in 1994-95 along with Axis and ICICI Bank. The key hallmark
from 1994-95 for HDFCB is its consistent performance, as a result of which the bank trades at a premium to its peers.
Consistent high margins among peers, lower levels of NPAs and high provision coverage gives an edge to HDFCB over its
peers.
HDFCB has also grown inorganically during its journey from 1994-95 acquiring times bank in the year 2000 and
Centurion Bank of Punjab (CBoP) in 2008. The acquisition added significant value in terms of increased branch network,
geographic reach and customer base.
Investment Rationale
Balanced loan book
HDFCB has a diversified loan book with equal proportion to Retail and Corporate. Historically, the share of Retail has
remained higher compared to Corporate segment. Total exposure of only 16% towards top twenty lenders shows the
diversified nature of the book. Further, 43.7% of the loan book has a maturity of less than 1 year, which gives the bank
an edge in the rising interest rate scenario.
Figure: Retail v/s corporate lending – Balanced portfolio
Source: Company; IDBI Capital Research
Among Corporate, ~70% is working capital/short term loans and ~30% consists of loans in more than 1 year category.
Recently the bank has also started lending in the Infrastructure space, currently ~1% of the total loan book. However,
the bank has maintained its cautious stand on lending towards infrastructure segment and will continue to grow slow in
this space.
In the retail segment, the bank has a wide range of products. However, 37.6% of the retail loan consists of Cars, CVC
and Two wheelers.
0.0%
10.0%
20.0%
30.0%
40.0%
50.0%
60.0%
70.0%
Q1FY09 Q2FY09 Q3FY09 Q4FY09 Q1FY10 Q2FY10 Q3FY10 4QFY10 Q1FY11 Q2FY11 Q3FY11 Q4FY11 Q1FY12
% of Retail % of corporate

3
Company Report – HDFC Bank Ltd.
Table: Break-up of Retail loan book (Rs bn)
Segment Q1FY10 Q2FY10 Q3FY10 Q4FY10 Q1FY11 Q2FY11 Q3FY11 Q4FY11 Q1FY12
Auto 161 171 180 196 214 232 246 221 232
CVC 77 80 84 60 63 70 87 82 91
2 Wheeler 18 18 17 18 19 20 22 20 21
Personal Loans 85 84 85 88 90 95 100 103 110
Business banking 122 122 127 139 144 158 179 150 154
Credit Cards 38 38 38 38 39 42 46 49 54
House Loans 55 63 77 87 95 91 110 115 110
Loan against shares 8 8 8 9 10 11 12 12 11
Others 49 43 43 54 49 61 54 50 56
Total 612 625 660 688 723 778 853 802 839
Source: Company; IDBI Capital Research
HDFCB has always posted higher than industry loan growth over the last several years. With high proportion of retail
lending, the bank is able to maintain the yield on advances at higher levels than peers. We estimate loan growth of
19.5% in FY12E and 20% in FY13E. Further, we believe that bank will maintain its balanced mix of retail and corporate
loan.
Figure: Loan book growth – Above industry
Source: Company; IDBI Capital Research
Key to success: Liability franchisee
HDFCB puts greater emphasis on improvement in the liability profile and branch addition. Through the branch addition,
the bank has penetrated the entire financial requirement of customers. It had also acquired Times bank and CBoP in
the process of increasing its branch network and customer base. The merger with CBoP dragged the performance of
the bank for a year, but almost doubled the branch network from 761 to 1,412.
0%
10%
20%
30%
40%
50%
60%
FY09 FY10 FY11 FY12E FY13E
HDFC Bank Industry
Higher growth due to CBoP merger

4
Company Report – HDFC Bank Ltd.
Figure: Branch addition
Source: Company; IDBI Capital Research
The result of building a strong liability franchisee over years has enabled the bank to maintain a sticky and high CASA
ratio. CASA ratio stands at 52.7% as on FY11, which is highest amongst peers. The high CASA Ratio along with a high
presence in retail lending gives HDFCB an edge compared to its peers in terms of maintaining higher margins.
Figure: CASA Ratio (%) – Continues to lead
Source: Company; IDBI Capital Research
We expect the growth in CASA Balance to be similar to peers which in fact will help the bank maintain a low cost fund
base above 50%. We estimate a CASA ratio of 51%-52% during FY12E13E.
0
1,000
2,000
3,000
4,000
5,000
6,000
FY 03 FY04 FY05 FY 06 FY 07 FY 08 FY 09 FY 10 FY 11
Branches ATMs
0.0%
10.0%
20.0%
30.0%
40.0%
50.0%
60.0%
70.0%
FY04 FY05 FY06 FY07 FY08 FY09 FY10 FY11
HDFC Bank Axis Bank ICICI Bank
5
Company Report – HDFC Bank Ltd.
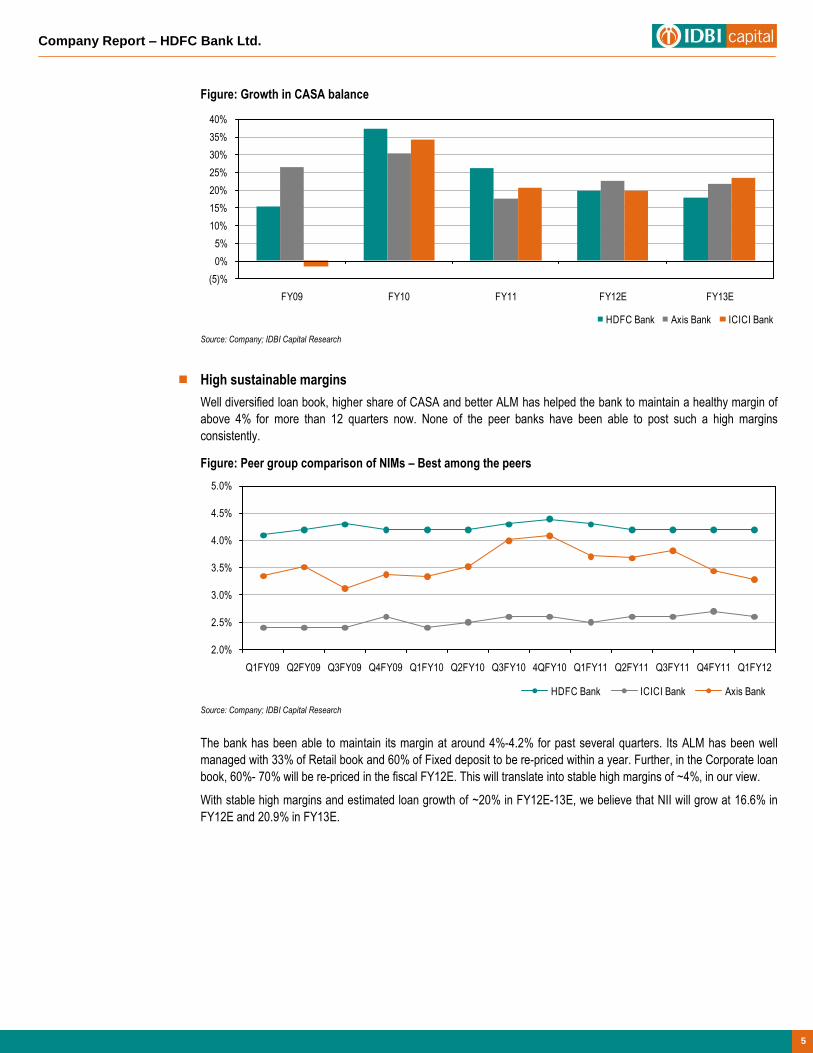
Figure: Growth in CASA balance
Source: Company; IDBI Capital Research
High sustainable margins
Well diversified loan book, higher share of CASA and better ALM has helped the bank to maintain a healthy margin of
above 4% for more than 12 quarters now. None of the peer banks have been able to post such a high margins
consistently.
Figure: Peer group comparison of NIMs – Best among the peers
Source: Company; IDBI Capital Research
The bank has been able to maintain its margin at around 4%-4.2% for past several quarters. Its ALM has been well
managed with 33% of Retail book and 60% of Fixed deposit to be re-priced within a year. Further, in the Corporate loan
book, 60%- 70% will be re-priced in the fiscal FY12E. This will translate into stable high margins of ~4%, in our view.
With stable high margins and estimated loan growth of ~20% in FY12E-13E, we believe that NII will grow at 16.6% in
FY12E and 20.9% in FY13E.
(5)%
0%
5%
10%
15%
20%
25%
30%
35%
40%
FY09 FY10 FY11 FY12E FY13E
HDFC Bank Axis Bank ICICI Bank
2.0%
2.5%
3.0%
3.5%
4.0%
4.5%
5.0%
Q1FY09 Q2FY09 Q3FY09 Q4FY09 Q1FY10 Q2FY10 Q3FY10 4QFY10 Q1FY11 Q2FY11 Q3FY11 Q4FY11 Q1FY12
HDFC Bank ICICI Bank Axis Bank

6
Company Report – HDFC Bank Ltd.
Figure: NII and NIM growth – Slight moderation due to low credit off take
Source: Company; IDBI Capital Research
Fee income: Steady growth
HDFCB’s Fee based income grew at a CAGR of 29% during FY07-FY11. 80% of the fee based income consists of
retail and balance 20% is corporate. The presence in all segments of retail portfolio and strong branch network has
enabled the bank to grow consistently on this vertical. We have estimated a CAGR of 15% fee based income growth
over FY11-FY13E.
Figure: Comparison of fee based income/NOI – for peers
Source: Company; IDBI Capital Research
Cost to income ratio – Higher than peers
HDFCB‘s cost to income ratio at 48% in FY11 was higher compared to peers Axis Bank and ICICI Bank. This can be
attributed to higher operating expenses as well as employee costs compared to peers. The higher operating expense
and employee cost is due to major focus on retail banking. Despite high cost to income ratio, historically the bank has
maintained a healthy return ratio. We have not estimated any moderation in cost to income ratio for FY12E
and FY13E.
0%
10%
20%
30%
40%
50%
60%
3.4%
3.6%
3.8%
4.0%
4.2%
4.4%
4.6%
FY07 FY08 FY09 FY10 FY11 FY12E FY13E
NIM (LHS) NII (RHS)
0.0% 5.0% 10.0% 15.0% 20.0% 25.0% 30.0% 35.0% 40.0%
FY03
FY04
FY05
FY06
FY07
FY08
FY09
FY10
FY11
ICICI Bank Axis Bank HDFC Bank

7
Company Report – HDFC Bank Ltd.
Table: Opex to NOI and employee cost to NOI (%)
Operating exp to NOI FY06 FY07 FY08 FY09 FY10 FY11
HDFC Bank 33 33 33 31 30 29
Axis Bank 32 34 34 28 27 28
ICICI Bank 44 40 38 32 25 24
Employee cost to NOI FY06 FY07 FY08 FY09 FY10 FY11
HDFC Bank 13 16 17 21 19 19
Axis Bank 13 15 15 15 14 14
ICICI Bank 12 13 13 12 12 18
Source: Company; IDBI Capital Research
Figure: Cost to Income ratio – On higher side v/s Peers
Source: Company; IDBI Capital Research
Asset Quality: Best in class
Best in class asset quality is the hallmark of HDFCB. The bank has reported its highest GNPA ratio of 2.05% due to the
merger of CBoP but after that, strong risk management and underwriting practices of the bank reduced this to the
lowest level of 1.04% of the total advances. Going ahead, we believe that GNPA ratio would be maintained around
1.1%-1.2% levels due to its strong risk management and secured retail loan book.
Table: GNPA trend v/s Peers (%)
GNPA Ratio Q1FY09 Q2FY09 Q3FY09 Q4FY09 Q1FY10 Q2FY10 Q3FY10 Q4FY10 Q1FY11 Q2FY11 Q3FY11 Q4FY11 Q1FY12
HDFC Bank 1.50 1.60 1.90 1.98 2.05 1.76 1.63 1.43 1.21 1.20 1.11 1.04 1.04
Axis Bank 0.92 0.91 0.90 0.96 1.01 1.21 1.23 1.13 1.13 1.21 1.09 1.01 1.06
ICICI Bank 0.00 4.18 4.14 4.32 4.89 4.69 4.84 5.06 5.14 5.03 4.75 4.47 4.36
Source: Company; IDBI Capital Research
Along with low levels of NPAs, the bank has a provision coverage ratio of 83% without technical write off. However, the
management has indicated that standard assets provision might increase in the near future but will remain under
control. We have increased our credit cost assumption to 1.2% of total advances and estimate a NNPA of 0.3%-0.4%
during FY12E-FY13E.
40%
42%
44%
46%
48%
50%
52%
54%
56%
FY06 FY07 FY08 FY09 FY10 FY11
HDFC Bank Axis Bank ICICI Bank
8
Company Report – HDFC Bank Ltd.
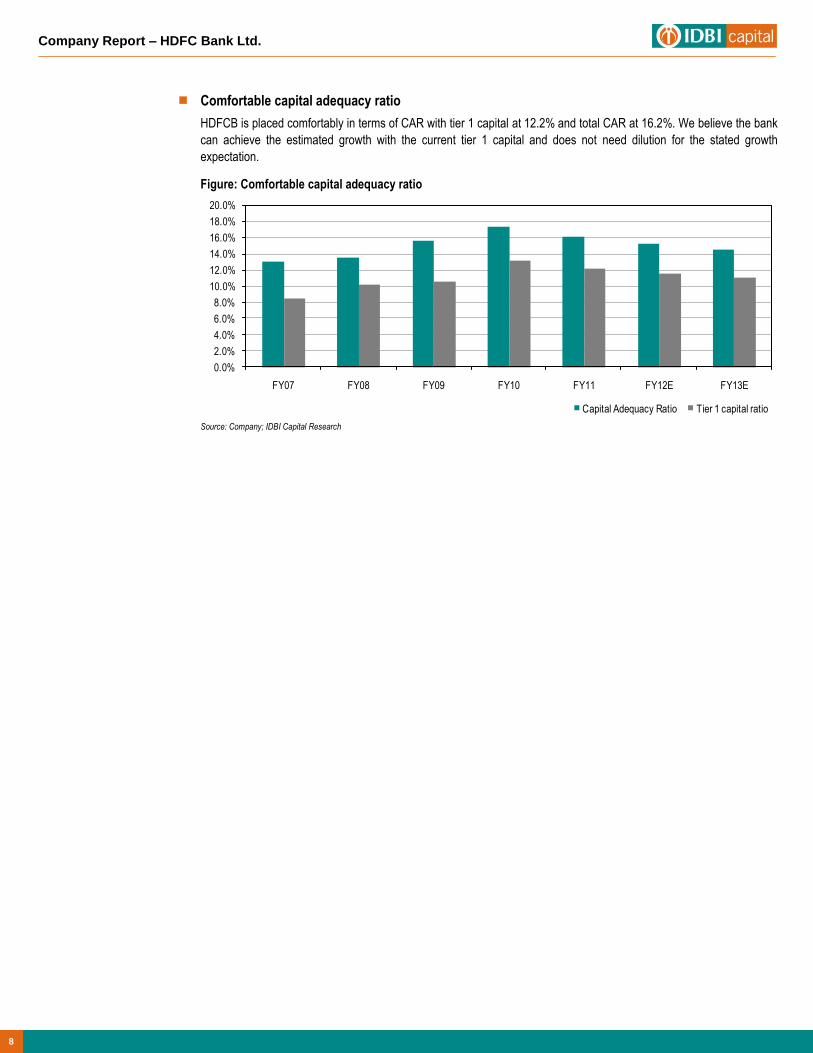
Comfortable capital adequacy ratio
HDFCB is placed comfortably in terms of CAR with tier 1 capital at 12.2% and total CAR at 16.2%. We believe the bank
can achieve the estimated growth with the current tier 1 capital and does not need dilution for the stated growth
expectation.
Figure: Comfortable capital adequacy ratio
Source: Company; IDBI Capital Research
0.0%
2.0%
4.0%
6.0%
8.0%
10.0%
12.0%
14.0%
16.0%
18.0%
20.0%
FY07 FY08 FY09 FY10 FY11 FY12E FY13E
Capital Adequacy Ratio Tier 1 capital ratio

9
Company Report – HDFC Bank Ltd.
Outlook and Valuation
We have estimated 15bps decline in margins factoring in increased savings rate and lower credit off take in FY12E due to
prevailing industry wide uncertainty regarding growth. Thus, we estimate a 19% CAGR in NII (Net interest income) during
FY11-13E. We have factored a 30bps increase in credit cost compared to FY11 for the bank and estimate PAT growth of
18.9% in FY12E and 21.3% in FY13E. With slightly lower profit growth due to margin compression, RoA would at best
marginally fall by 5bps-7bps and will remain in the range of 1.5%.
DuPont comparison of HDFCB with its peer group highlights the following: Higher margins compared to peers, flawless
assets quality and consistency that together remain a key for supremacy of this bank over its peers. While higher operating
expenses and employee to assets ratio negate impact of higher margins, asset quality compared to peers provides a
comfort to HDFCB. With best liability franchisee and lower level of NPAs we believe that HDFCB is the best conservative
play in the current environment.
Table: DuPont Analysis – Peer group
DuPont Comparison
(% of Avg. total assets)
HDFC Bank Axis Bank ICICI Bank
Mar-10 Mar-11 Mar-12 Mar-13 Mar-10 Mar-11 Mar-12 Mar-13 Mar-10 Mar-11 Mar-12 Mar-13
Net Interest income 4.1 4.2 4.1 4.1 3.0 3.1 2.8 2.8 2.2 2.3 2.4 2.4
Fee Income 1.5 1.4 1.4 1.4 1.6 1.4 1.5 1.5 1.3 1.4 1.5 1.6
Other Income 0.5 0.3 0.3 0.3 0.8 0.7 0.6 0.5 0.7 0.3 0.3 0.3
Operating Income 6.1 6.0 5.8 5.8 5.5 5.3 4.9 4.8 4.2 4.1 4.3 4.4
Employee Expenses 1.1 1.1 1.1 1.1 0.8 0.8 0.7 0.7 0.5 0.7 0.8 0.8
Other Operating expenses 1.8 1.7 1.6 1.6 1.5 1.5 1.4 1.4 1.1 1.0 1.0 1.0
Operating profit 3.2 3.1 3.1 3.2 3.2 3.0 2.8 2.7 2.6 2.4 2.5 2.6
Loan loss provision 1.0 0.6 0.6 0.7 0.8 0.4 0.4 0.4 1.2 0.5 0.5 0.5
Other provision 0.1 0.2 0.1 0.1 0.0 0.2 0.2 0.2 0.0 0.1 0.1 0.1
PBT 2.1 2.3 2.3 2.4 2.3 2.4 2.2 2.2 1.4 1.8 1.9 2.0
Tax 0.7 0.8 0.7 0.8 0.8 0.8 0.7 0.7 0.4 0.4 0.5 0.5
PAT (RoA) 1.5 1.6 1.6 1.6 1.5 1.6 1.5 1.4 1.1 1.3 1.4 1.5
Assets/Equity 11.2 10.7 10.8 10.9 12.5 12.1 13.1 13.3 7.3 7.2 7.6 8.2
RoE 16.3 16.7 17.2 17.3 19.2 19.1 19.1 19.2 7.9 9.6 10.7 12.3
Source: IDBI Capital Research
Further, as per our analysis, historically, HDFCB has shown resilience over its peers & benchmark indices during times of
market correction/volatility and has emerged as an outperformer.
HDFCB has higher
operating cost and
employee expenses
compared to peers

10
Company Report – HDFC Bank Ltd.
Figure: Comparison of HDFCB with SBI and Bankex
Source: Bloomberg; IDBI Capital Research
Figure: Comparison with peers
Source: Bloomberg; IDBI Capital Research
Table: Comparison of stock performance
% Change in Price HDFC Bank SBI Bank ICICI Bank Axis Bank
Post Lehman (Fall) (49.0) (54.0) (73.0) (64.0)
Election Impact (Rebound) 31.0 46.0 55.0 41.0
Upturn in Economy 66.0 86.0 54.0 84.0
Recent Correction 0.2 (38.5) (26.1) (29.0)
Source: IDBI Capital Research
0
50
100
150
200
250
300
350
Apr
-07
Jun-
07
Aug
-07
Oct
-07
Dec
-07
Feb
-08
Apr
-08
Jun-
08
Aug
-08
Oct
-08
Dec
-08
Feb
-09
Apr
-09
Jun-
09
Aug
-09
Oct
-09
Dec
-09
Feb
-10
Apr
-10
Jun-
10
Aug
-10
Oct
-10
Dec
-10
Feb
-11
Apr
-11
Jun-
11
Aug
-11
Bankex SBI HDFCB
0
50
100
150
200
250
300
350
Apr
-07
Jun-
07
Aug
-07
Oct
-07
Dec
-07
Feb
-08
Apr
-08
Jun-
08
Aug
-08
Oct
-08
Dec
-08
Feb
-09
Apr
-09
Jun-
09
Aug
-09
Oct
-09
Dec
-09
Feb
-10
Apr
-10
Jun-
10
Aug
-10
Oct
-10
Dec
-10
Feb
-11
Apr
-11
Jun-
11
Aug
-11
HDFCB ICICI Axis
HDFCB outperformed
Bankex post Lehman
crisis and also during
the recent correction
In a challenging
environment, the
correction in HDFCB is
lower than peers
corroborating our view
of conservative play
2007 Peak
Post Lehman
(Fall)
Election Impact
(Rebound)
Upturn in
Economy
Recent
Correction
2007 Peak
Post Lehman
(Fall)
Election Impact
(Rebound)
Upturn in
Economy
Recent
Correction
11
Company Report – HDFC Bank Ltd.
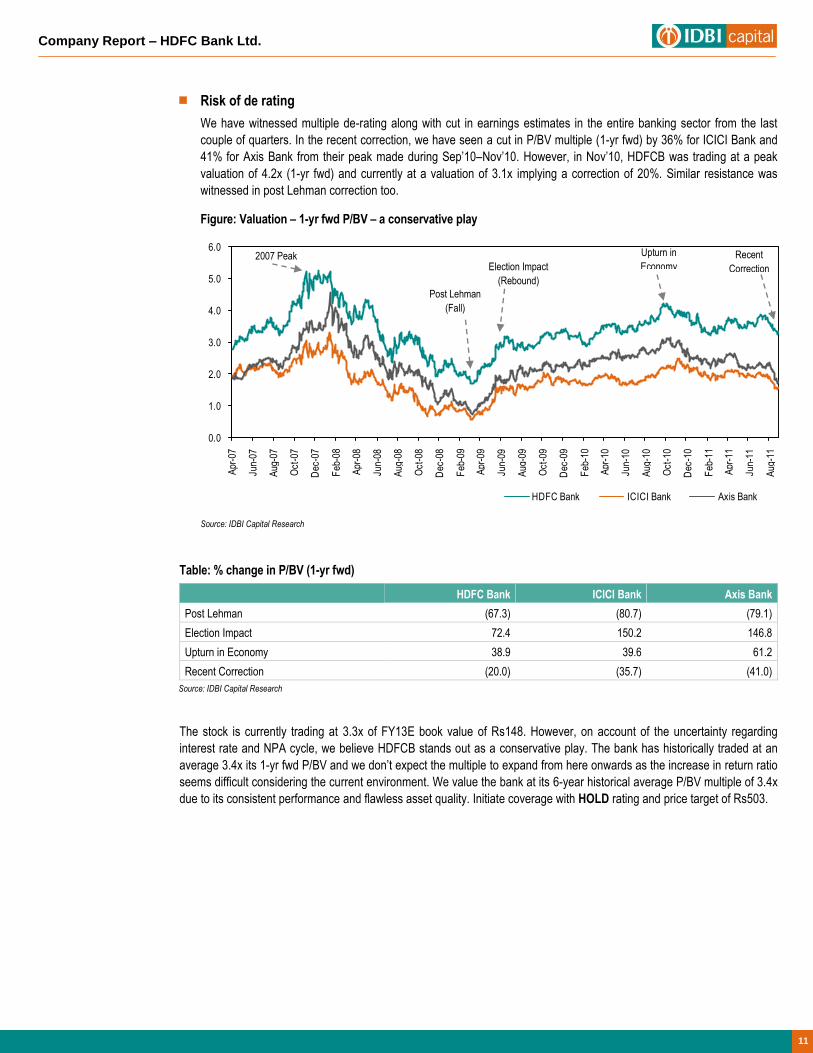
Risk of de rating
We have witnessed multiple de-rating along with cut in earnings estimates in the entire banking sector from the last
couple of quarters. In the recent correction, we have seen a cut in P/BV multiple (1-yr fwd) by 36% for ICICI Bank and
41% for Axis Bank from their peak made during Sep’10–Nov’10. However, in Nov’10, HDFCB was trading at a peak
valuation of 4.2x (1-yr fwd) and currently at a valuation of 3.1x implying a correction of 20%. Similar resistance was
witnessed in post Lehman correction too.
Figure: Valuation – 1-yr fwd P/BV – a conservative play
Source: IDBI Capital Research
Table: % change in P/BV (1-yr fwd)
HDFC Bank ICICI Bank Axis Bank
Post Lehman (67.3) (80.7) (79.1)
Election Impact 72.4 150.2 146.8
Upturn in Economy 38.9 39.6 61.2
Recent Correction (20.0) (35.7) (41.0)
Source: IDBI Capital Research
The stock is currently trading at 3.3x of FY13E book value of Rs148. However, on account of the uncertainty regarding
interest rate and NPA cycle, we believe HDFCB stands out as a conservative play. The bank has historically traded at an
average 3.4x its 1-yr fwd P/BV and we don’t expect the multiple to expand from here onwards as the increase in return ratio
seems difficult considering the current environment. We value the bank at its 6-year historical average P/BV multiple of 3.4x
due to its consistent performance and flawless asset quality. Initiate coverage with HOLD rating and price target of Rs503.
0.0
1.0
2.0
3.0
4.0
5.0
6.0
Apr
-07
Jun-
07
Aug
-07
Oct
-07
Dec
-07
Feb
-08
Apr
-08
Jun-
08
Aug
-08
Oct
-08
Dec
-08
Feb
-09
Apr
-09
Jun-
09
Aug
-09
Oct
-09
Dec
-09
Feb
-10
Apr
-10
Jun-
10
Aug
-10
Oct
-10
Dec
-10
Feb
-11
Apr
-11
Jun-
11
Aug
-11
HDFC Bank ICICI Bank Axis Bank
2007 Peak
Post Lehman
(Fall)
Election Impact
(Rebound)
Upturn in
Economy Recent
Correction

12
Company Report – HDFC Bank Ltd.
Financial Summary
Profit & Loss Account (Rs bn)
Year-end: March FY09 FY10 FY11 FY12E FY13E
Interest earned 163.3 161.7 199.3 249.9 309.6
Interest expended 89.1 77.9 93.9 127.0 161.0
NII 74.2 83.9 105.4 122.9 148.6
Other Income 32.9 39.8 43.4 51.0 58.8
Fee Based 24.6 30.1 36.0 41.4 48.0
Trading & Froex 6.0 6.1 9.2 7.4 7.7
Treasury Profit 4.1 3.5 (0.8) 0.8 1.0
Net Opt. Inc. (NOI) 107.1 123.7 148.8 173.9 207.4
Employee Cost 22.4 22.9 28.4 33.2 39.6
Opt. Expenses 32.9 36.5 43.2 49.6 58.1
Opt. Profit 51.8 64.3 77.3 91.1 109.8
Provisions 18.8 21.4 19.1 22.9 25.7
Profit before tax 33.0 42.9 58.2 68.2 84.1
Net Profit 22.4 29.5 39.3 46.7 56.7
Balance Sheet (Rs bn)
Year-end: March FY09 FY10 FY11 FY12E FY13E
Capital 4.3 4.6 4.7 4.7 4.8
Net Worth 146.5 215.2 253.8 299.7 355.1
Deposit 1,428.1 1,674.0 2,085.9 2,549.4 3,101.4
Total Liab. & Equity 1,832.7 2,224.6 2,773.5 3,299.0 4,019.6
Investments 588.2 586.1 709.3 873.8 1,108.0
Advances 988.8 1,258.3 1,599.8 1,912.0 2,295.1
Total Assets 1,832.7 2,224.6 2,773.5 3,299.0 4,019.6
Growth (%)
Year-end: March FY09 FY10 FY11 FY12E FY13E
Deposits 41.7 17.2 24.6 22.2 21.7
Advances 55.9 27.3 27.1 19.5 20.0
Total Assets 37.6 21.4 24.7 18.9 21.8
NII 42.0 13.0 25.7 16.6 20.9
Other Income 44.1 21.0 8.8 17.6 15.4
Net Profit 41.2 31.3 33.2 18.9 21.3
Productivity
Year-end: March FY09 FY10 FY11 FY12E FY13E
Bus./Employee (mn) 64.6 77.2 94.5 111.5 131.6
Profit/Employee ('000) 600.5 776.0 1,006.8 1,167.4 1,382.1
Bus./Branch (mn) 1,711.7 1,699.9 1,855.8 2,075.1 2,272.2
NP/Branch (mn) 15.9 17.1 19.8 21.7 23.9
CASA Per Branch 448.7 505.0 553.4 612.9 654.3
Source: Company; IDBI Capital Research
Opt. Ratio (%)
Year-end: March FY09 FY10 FY11 FY12E FY13E
Int Exp/Int Earned 54.6 48.1 47.1 50.8 52.0
Cost/NOI 51.7 48.0 48.1 47.6 47.1
Cost/NOI (Ex. treasury inc.) 53.6 49.4 47.9 47.8 47.3
Other Income/NOI 30.7 32.2 29.1 29.3 28.4
Ot. Inc. (ex. treasury)/NOI 26.9 29.4 29.7 28.9 27.9
NPM 21.0 23.8 26.4 26.9 27.3
Spreads (%)
Year-end: March FY09 FY10 FY11 FY12E FY13E
NII/Avg Total Assets 4.7 4.1 4.2 4.0 4.1
NII/Avg Int Earning Assets 4.9 4.4 4.5 4.4 4.4
NIMs 4.2 3.8 4.0 3.9 3.9
CASA 44.4 52.0 52.7 51.7 50.1
Avg Int earnings assets 1,501.4 1,927.8 2,347.6 2,821.1 3,411.6
Avg Int bearing liabilities 1,332.8 1,705.7 2,076.9 2,543.2 3,092.9
Solvency (%)
Year-end: March FY09 FY10 FY11 FY12E FY13E
Credit-Deposit Ratio 69.2 75.2 76.7 75.0 74.0
Incremental CD Ratio 84.3 109.6 82.9 67.4 69.4
Investment/Deposit Ratio 41.2 35.0 34.0 34.3 35.7
GNPA Ratio 2.0 1.4 1.1 1.2 1.2
Prov. Cover 68.4 78.4 82.5 78.1 80.0
NNPA Ratio 0.6 0.3 0.2 0.3 0.4
CAR 15.7 17.4 16.2 15.3 14.5
Tier1 10.6 13.3 12.2 11.7 11.2
Tier2 5.1 4.2 4.0 3.6 3.4
Return
Year-end: March FY09 FY10 FY11 FY12E FY13E
ATA (Avg. Total Assets) 1,582.2 2,028.6 2,499.1 3,036.3 3,659.3
Total Busi.(Dep+Adv) 2,416.9 2,932.4 3,685.7 4,461.4 5,396.5
Interest Income/ATA (%) 10.3 8.0 8.0 8.2 8.5
PBT/ATA (%) 2.1 2.1 2.3 2.2 2.3
PAT/ATA (%) 1.4 1.5 1.6 1.5 1.5
ROA (%) 1.4 1.5 1.6 1.5 1.5
ROE (%) 17.2 16.3 16.7 16.9 17.3
Assets/Equity 12.1 11.2 10.7 11.0 11.2
Valuation
Year-end: March FY09 FY10 FY11 FY12E FY13E
P/E (x) 45.9 37.6 28.7 24.5 20.5
P/BV (x) 7.0 5.2 4.4 3.8 3.3
P/ABV (x) 9.0 5.7 4.7 4.2 3.6
Book Value/share (Rs) 68.8 93.9 108.9 126.6 147.7
EPS (Rs) 10.6 12.9 16.9 19.8 23.6

13
Company Report – HDFC Bank Ltd.
Notes
Vikrant Oak – Head Institutional Equities (91-22) 4322 1385 [email protected]
Sonam H. Udasi – Head Research (91-22) 4322 1375 [email protected]
Dealing (91-22) 4322 1150 [email protected]
Key to Ratings
Stocks:
BUY: Absolute return of 15% and above; ACCUMULATE: 5% to 15%; HOLD: Upto ±5%; REDUCE: -5% to -15%; SELL: -15% and below.
IDBI Capital Market Services Ltd. (A wholly owned subsidiary of IDBI Ltd.) Equity Research Desk
3rd Floor, Mafatlal Centre, Nariman Point, Mumbai – 400 021. Phones: (91-22) 4322 1212; Fax: (91-22) 2285 0785; Email: [email protected]
SEBI Registration: NSE CM – INB230706631, NSE F&O – INF230706631, BSE CM – INB010706639, BSE F&O – INF010706639, NSDL – IN-DP-NSDL-12-96
Compliance Officer: Christina Fernandes; Email: [email protected]; Telephone: (91-22) 4322 1212 Disclaimer This document has been prepared by IDBI Capital Market Services Ltd (IDBI Capital) and is meant for the recipient only for use as intended and not for circulation. This document should not be reproduced or copied or made available to others. No person associated with IDBI Capital is obligated to call or initiate contact with you for the purposes of elaborating or following up on the information contained in this document.
Recipients may not receive this report at the same time as other recipients. IDBI Capital will not treat recipients as customers by virtue of their receiving this report.
The information contained herein is from the public domain or sources believed to be reliable. While reasonable care has been taken to ensure that information given is at the time believed to be fair and correct and opinions based thereupon are reasonable, due to the very nature of research it cannot be warranted or represented that it is accurate or complete and it should not be relied upon as such. In so far as this report includes current or historical information, it is believed to be reliable, although its accuracy and completeness cannot be guaranteed.
Opinions expressed are current opinions as of the date appearing on this material only. While we endeavor to update on a reasonable basis, the information discussed in this material, IDBI Capital, its directors, employees are under no obligation to update or keep the information current. Further there may be regulatory, compliance, or other reasons that prevent us from doing so.
Prospective investors and others are cautioned that any forward-looking statements are not predictions and may be subject to change without notice.
IDBI Capital, its directors and employees and any person connected with it, will not in any way be responsible for the contents of this report or for any losses, costs, expenses, charges, including notional losses/lost opportunities incurred by a recipient as a result of acting or non acting on any information/material contained in the report.
This is not an offer to sell or a solicitation to buy any securities or an attempt to influence the opinion or behaviour of investors or recipients or provide any investment/tax advice.
This report is for information only and has not been prepared based on specific investment objectives. The securities discussed in this report may not be suitable for all investors. Investors must make their own investment decision based on their own investment objectives, goals and financial position and based on their own analysis.
Trading in stocks, stock derivatives, and other securities is inherently risky and the recipient agrees to assume complete and full responsibility for the outcomes of all trading decisions that the recipient makes, including but not limited to loss of capital.
Opinions, projections and estimates in this report solely constitute the current judgment of the author of this report as of the date of this report and do not in any way reflect the views of IDBI Capital, its directors, officers, or employees.
This report is not directed or intended for distribution to, or use by, any person or entity who is a citizen or resident of or located in any locality, state, country or other jurisdiction, where such distribution, publication, availability or use would be contrary to law, regulation or which would subject IDBI Capital and affiliates to any registrati on or licensing requirement within such jurisdiction. The securities described herein may or may not be eligible for sale in all jurisdictions or to certain category of investors. Persons in whose possession this document may come are required to inform themselves of and to observe such restriction.
IDBI Capital, its directors or employees or affiliates, may from time to time, have positions in, or options on, and buy and sell securities referred to herein. IDBI Capital or its affiliates, during the normal course of business, from time to time, may solicit from or perform investment banking or other services for any company mentioned in this document or their connected persons or be engaged in any other transaction involving such securities and earn brokerage or other compensation or act as a market maker in the financial instruments of the company(ies) discussed herein or their affiliate companies or act as advisor or lender / borrower to such company(ies)/affiliate companies or have other potential conflict of interest.
This report may provide hyperlinks to other websites. Except to the extent to which the report refers to the website of IDBI Capital, IDBI Capital states that it has not reviewed the linked site and takes no responsibility for the content contained in such other websites. Accessing such websites shall be at recipient's own risk.
E-mail is not a secure method of communication. IDBI Capital Market Services Limited cannot accept responsibility for the accuracy or completeness of any e-mail message or any attachment(s). This transmission could contain viruses, be corrupted, destroyed, incomplete, intercepted, lost or arrive late. IDBI Capital, its directors or employees or affiliates accept no liability for any damage caused, directly or indirectly, by this email.